Interrogating the recognition landscape of a conserved HIV-specific TCR reveals distinct bacterial peptide cross-reactivity
- Department of Molecular and Cellular Physiology, Stanford University School of Medicine, United States
- Kennedy Institute of Rheumatology, University of Oxford, United Kingdom
- Translational Gastroenterology Unit, Nuffield Department of Medicine, John Radcliffe Hospital, United Kingdom
- Nuffield Department of Medicine, University of Oxford, NDM Research Building, Old Road Campus, Headington, United Kingdom
- Koch Institute at MIT, United States
- Howard Hughes Medical Institute, Stanford University School of Medicine, United States
Figures
Figure 1
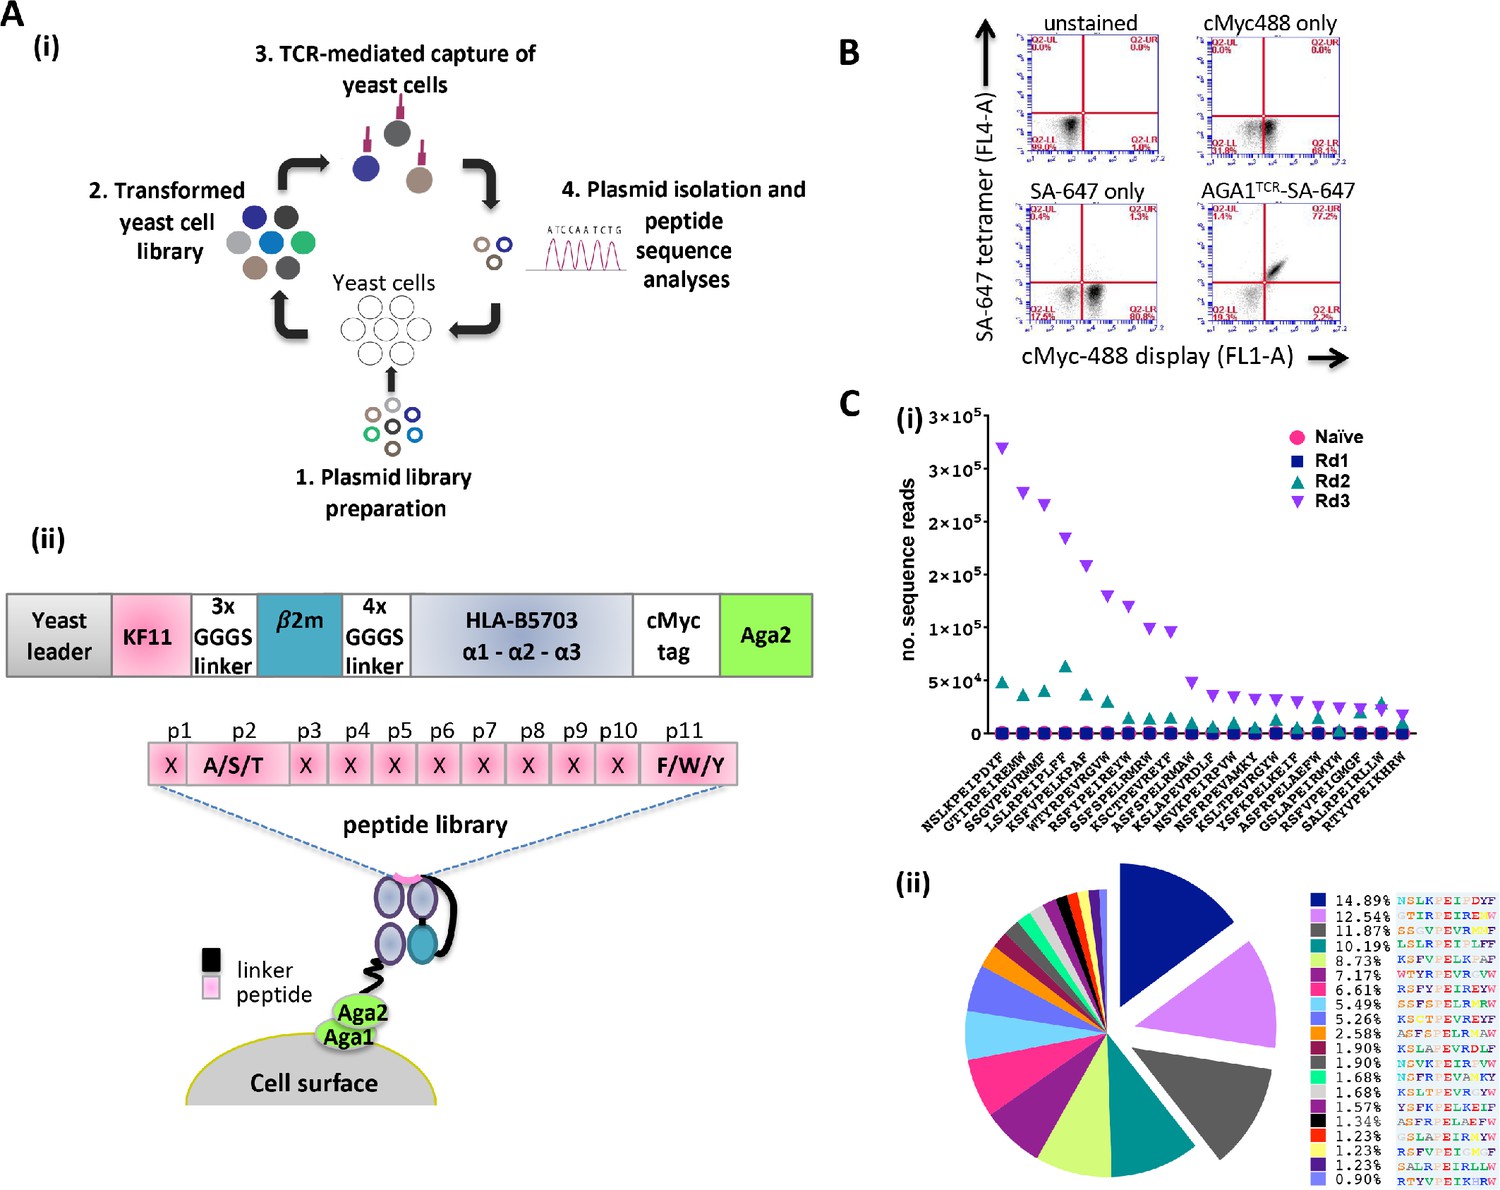
Schematic overview of the peptide-β2m-HLA-B*57:03 yeast display platform.
(A) (i) Plasmid libraries encoding semi-randomized peptide sequences generated by polymerase chain reaction amplification using rationally designed degenerate oligos and linked to the HLA-B*57:03 heavy chain and β2m were (1) transfected into yeast cells to generate libraries (2). Biotinylated AGA1 TCR reagents conjugated to streptavidin-coated magnetic beads were subsequently used to purify TCR-reactive peptide-MHC complexes expressed on yeast cells (3). The identities of peptides allowing TCR binding were confirmed via plasmid extraction and next generation sequencing analyses (4). This process was repeated up to four times under successively stringent rounds of selection. (ii) Outline of the peptide-β2m-HLA-B*57:03-Aga2 yeast single chain construct illustrating the peptide-β2m-HLA-B*57:03 fusion chain, interspersed with repeating Gly-Ser linker sequence motifs (upper image). HLA-B*57:03-preferred anchor binding residues were fixed at position 2 (p2) to Ala/Ser/Thr and position 11 (p11, CΩ) to Phe/Trp/Tyr, whereas non-anchor residues were allowed to express any amino acid (X) throughout the selection process (lower image). (B) Staining of a KF11-β2m-HLA-B*57:03 yeast display test platform with AGA1 TCR fluorescent tetramers. cMyc staining denotes cell-surface expression of the KF11-β2m-HLA-B*57:03 construct, with SA-647 staining employed to monitor non-specific binding of the fluorescent label to transfected yeast cells. (C) Frequency of top 20 Round 3 peptide sequences, pre-(naïve) and post-AGA1 TCR-mediated selection. Individual peptide sequences (X-axis) versus their frequencies (number of sequence reads) in the naïve, Round 1, Round 2 and Round 3 AGA1 TCR-selected libraries are denoted (Y-axis) in (i), with the three dominant peptides following Round 3 enrichment illustrated in (ii) as exploded pie chart slices. Percentage (%) peptide frequencies are indicated. The corresponding peptide legend is color-coded according to RasMol amino schema.
-
Figure 1—source data 1
AGA1 TCR-recovered top 20 peptides_Naïve to Round 3 screens.
- https://cdn.elifesciences.org/articles/58128/elife-58128-fig1-data1-v1.pzfx.zip
-
Figure 1—source data 2
AGA1 TCR-recovered top 20 peptides_ Round 3 frequencies.
- https://cdn.elifesciences.org/articles/58128/elife-58128-fig1-data2-v1.pzfx.zip
Figure 2 with 5 supplements
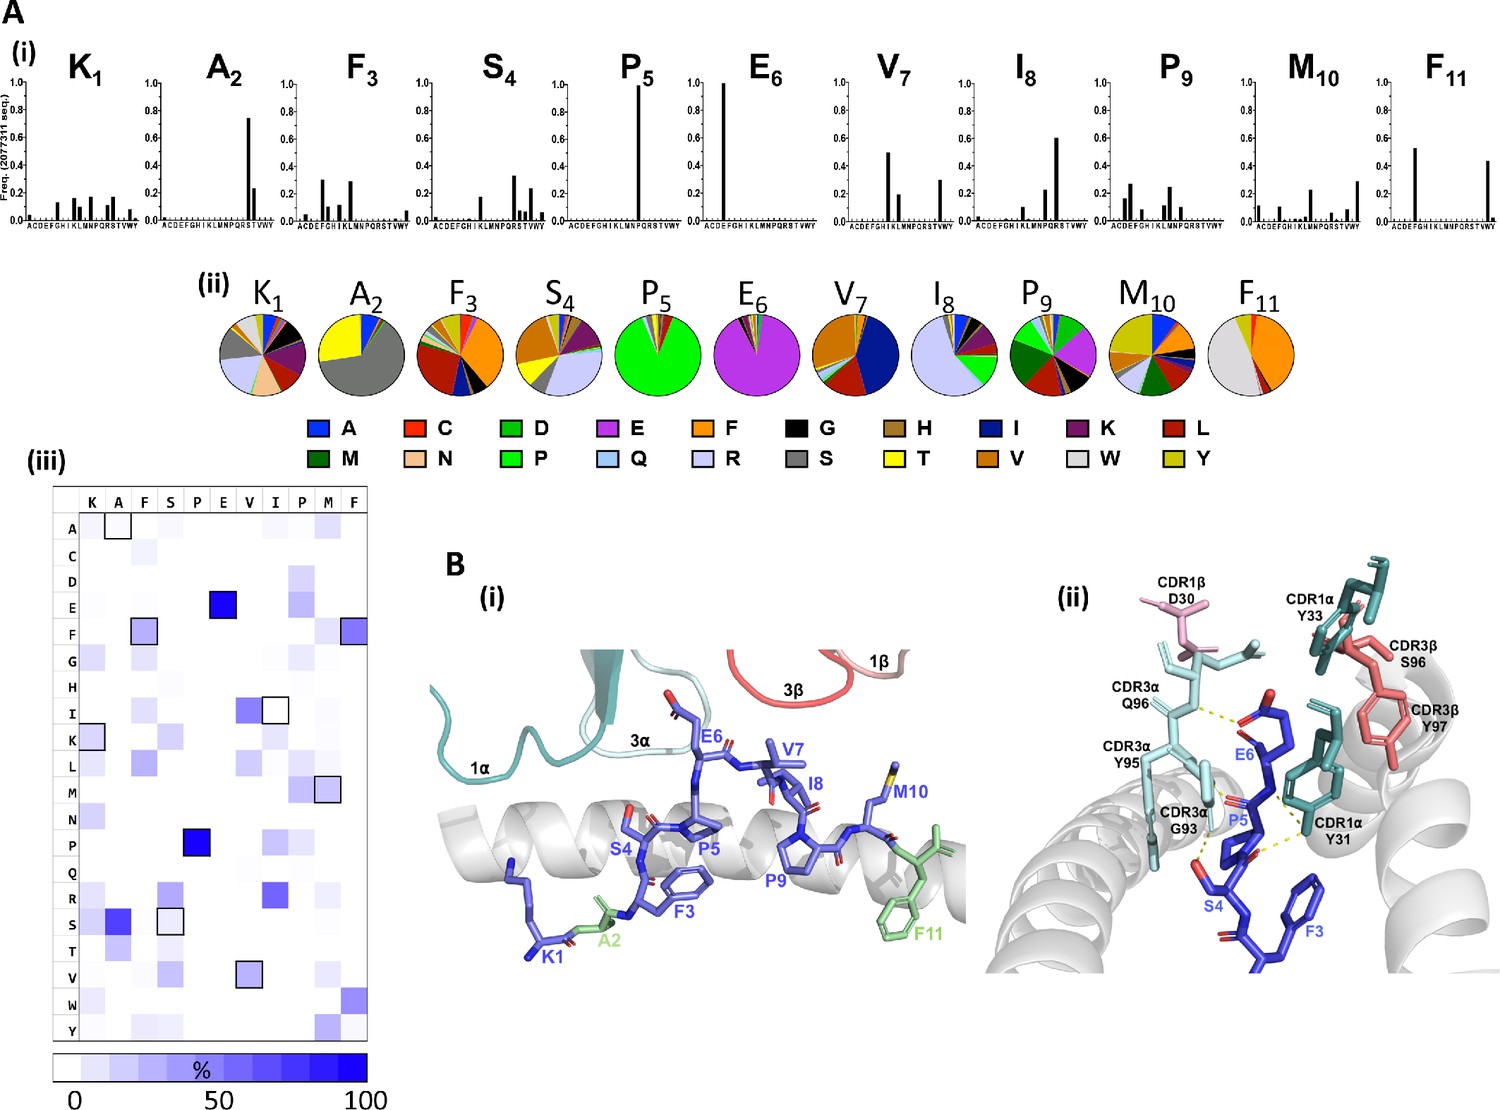
Fixation of specific peptide amino acids residues following Round 3 AGA1 TCR–mediated selection.
(A) Amino acid enrichment along the length of AGA1 TCR selected 11mer peptides are illustrated (i) in bar chart format for approximately 2.0 × 10⁶ selected peptide sequences, with individual amino acid enrichment at each position of the 11mer peptide represented on the X-axis and sequence frequency on the Y-axis. K1, A2, F3 refers to amino acid positions 1, 2, 3, etc, of the HIV KF11 epitope which is included for reference. Enrichment data for pre-(naïve) and post-AGA1 TCR selected peptides from all libraries are provided in Figure 2—figure supplement 1). (ii) The top 1000 peptide sequences are reported in pie-chart format, with the original KF11 (KAFSPEVIPMF) peptide amino acids included above the relevant pie-charts for reference. K1, A2, F3 refers to amino acid positions 1, 2, 3, etc, of the HIV KF11 peptide sequence. (iii) A Heat map of the entire Round 3 peptide sequence dataset (~2.0×10⁶ peptides) demonstrating the near absolute dominance of Pro and Glu at positions 5 and 6, respectively, in AGA1 TCR-selected peptide datasets. The amino acid residues corresponding to the KF11 peptide are outlined in black. Heatmap scale = 0 – 100%, 10% increments. (B) Structural overview of the primary contacts formed between the AGA1 TCR and KF11 when restricted by HLA-B*57:03. (i) Slide view of the HLA-B*57:03 alpha 1 (α1) helix in cartoon form (grey), with the alpha 2 (α2) helix removed for clarity. The peptide is depicted in stick format (blue) with the KF11 position 2 Ala (A2) and Position 11 Phe (F11) anchor resides highlighted in green. The TCR CDR1α (deep teal), CDR3α (pale cyan), CDR3β (deep salmon) and CDR1β (light pink) loops that form the main contacts with HLA-B*57:03-KF11 are illustrated. (ii) Barrel view of HLA-B*57:03-KF11, oriented from the peptide’s N terminus, with HLA-B*57:03 α1 and α2 helices display in cartoon format (grey) and KF11 amino acids 3–6 illustrated in stick format (blue). The remainder of the KF11 peptide sequence is omitted for clarity. The primary polar contacts (~3 ångströms (Å)) between TCR CDR1α (deep teal) and CDR3α (pale cyan) amino acids and the KF11 peptide at positions 4 to 6 are illustrated (yellow dash lines). CDR1β residue D30 (light pink) and CDR3β amino acids S96 and Y97 (deep salmon) that reportedly form weaker peptides mediated contacts are also displayed. TCR amino acids positions are number according to Arden nomenclature (see Ref 37). Structural images were generated in PyMOL four using the Protein Data Bank coordinates 2YPL.
-
Figure 2—source data 1
All Round 3 AGA1 TCR recovered library peptide amino acid frequencies.
- https://cdn.elifesciences.org/articles/58128/elife-58128-fig2-data1-v1.pzfx.zip
-
Figure 2—source data 2
Top 1000 Round 3 AGA1 TCR recovered library peptide amino acid frequencies.
- https://cdn.elifesciences.org/articles/58128/elife-58128-fig2-data2-v1.pzfx.zip
-
Figure 2—source data 3
Heatmap of all Round 3 AGA1 TCR recovered library peptides.
- https://cdn.elifesciences.org/articles/58128/elife-58128-fig2-data3-v1.xlsx
Figure 2—figure supplement 1
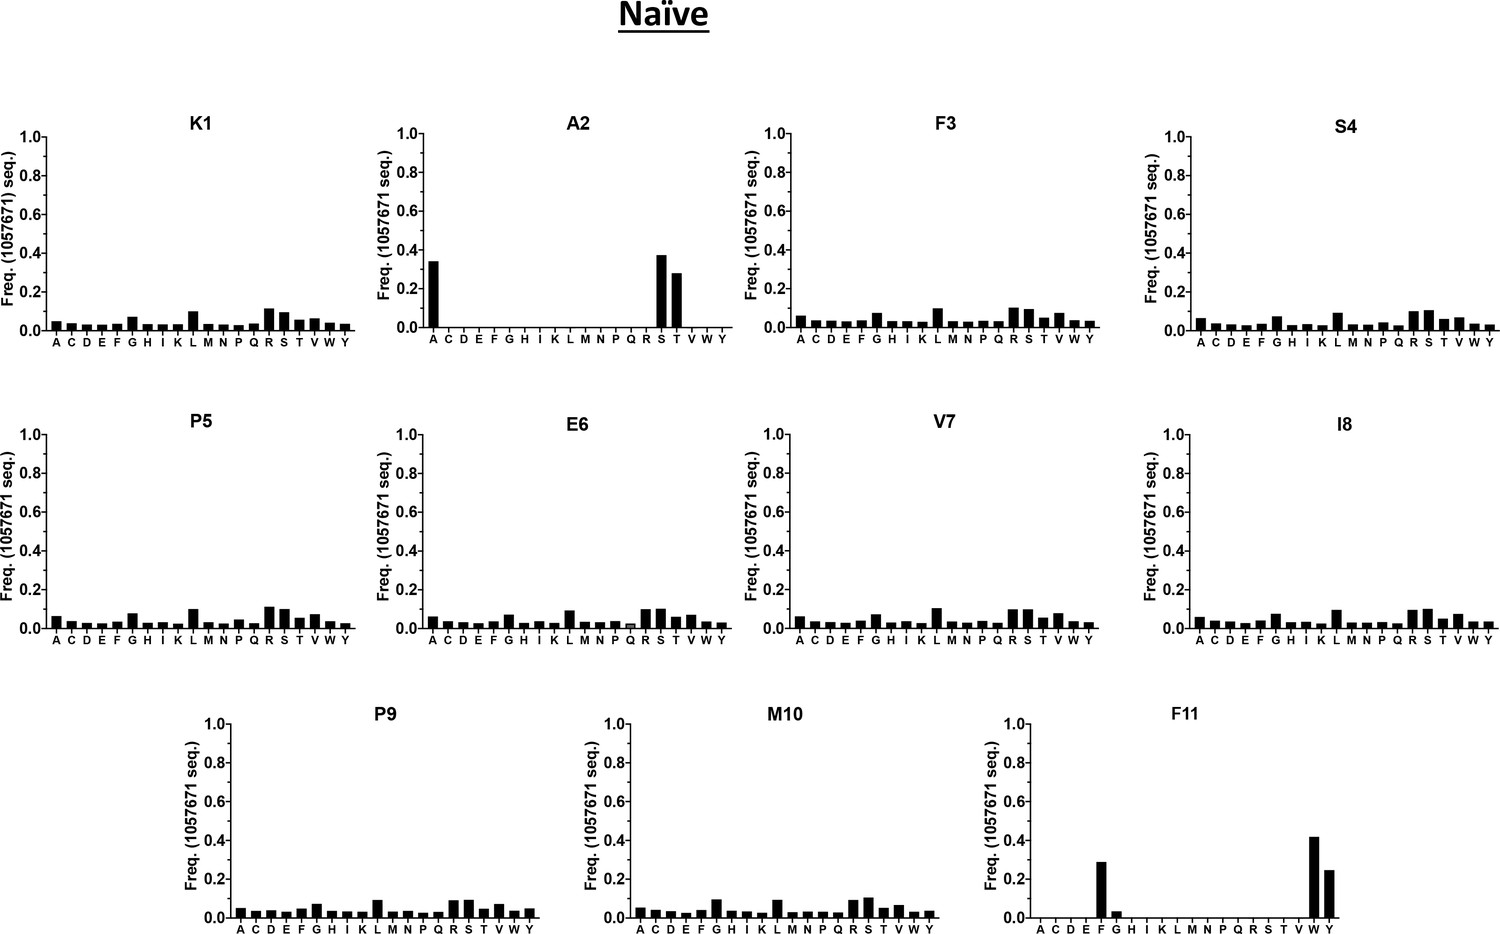
Individual amino acid frequencies in the naïve (pre-AGA1 TCR-selected) HLA-B*57:03-restricted yeast display peptide repertoire.
Individual amino acid frequencies along the length of the 11 amino acid peptide are illustrated in bar chart format, with the frequencies of peptide sequence reads represented on the Y axis. Individual amino acids at each position of the 11mer peptide are represented on the X-axis. K1, A2, F3 refers to amino acid positions 1, 2, 3, etc, of the HIV KF11 peptide sequence, which is included for reference.
-
Figure 2—figure supplement 1—source data 1
Amino acid signatures of Yeast display libraries-Naïve.
- https://cdn.elifesciences.org/articles/58128/elife-58128-fig2-figsupp1-data1-v1.pzfx.zip
Figure 2—figure supplement 2
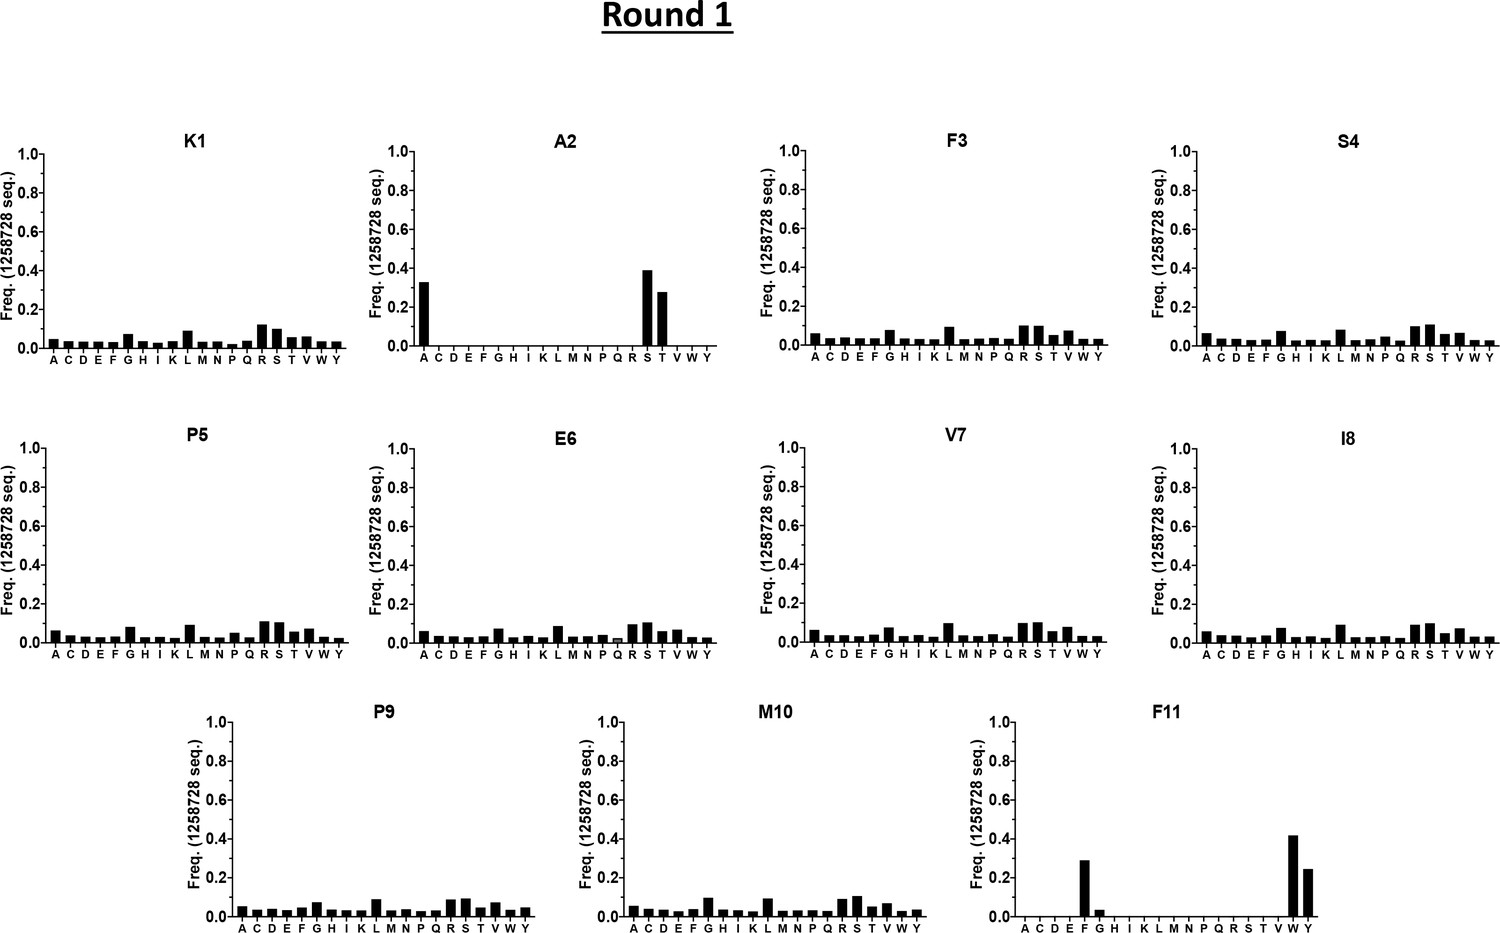
Individual amino acid frequencies of the AGA1 TCR-selected, HLA-B*57:03-restricted yeast display peptide repertoire following Round 1 selection.
Individual amino acid frequencies along the length of the 11 amino acid peptide are illustrated in bar chart format, with the frequencies of peptide sequence reads represented on the Y axis. Individual amino acids at each position of the 11mer peptide are represented on the X-axis. K1, A2, F3 refers to amino acid positions 1, 2, 3, etc, of the HIV KF11 peptide sequence, which is included for reference.
-
Figure 2—figure supplement 2—source data 1
Amino acid signatures of Yeast display libraries-AGA1 TCR Round 1 selection.
- https://cdn.elifesciences.org/articles/58128/elife-58128-fig2-figsupp2-data1-v1.pzfx.zip
Figure 2—figure supplement 3
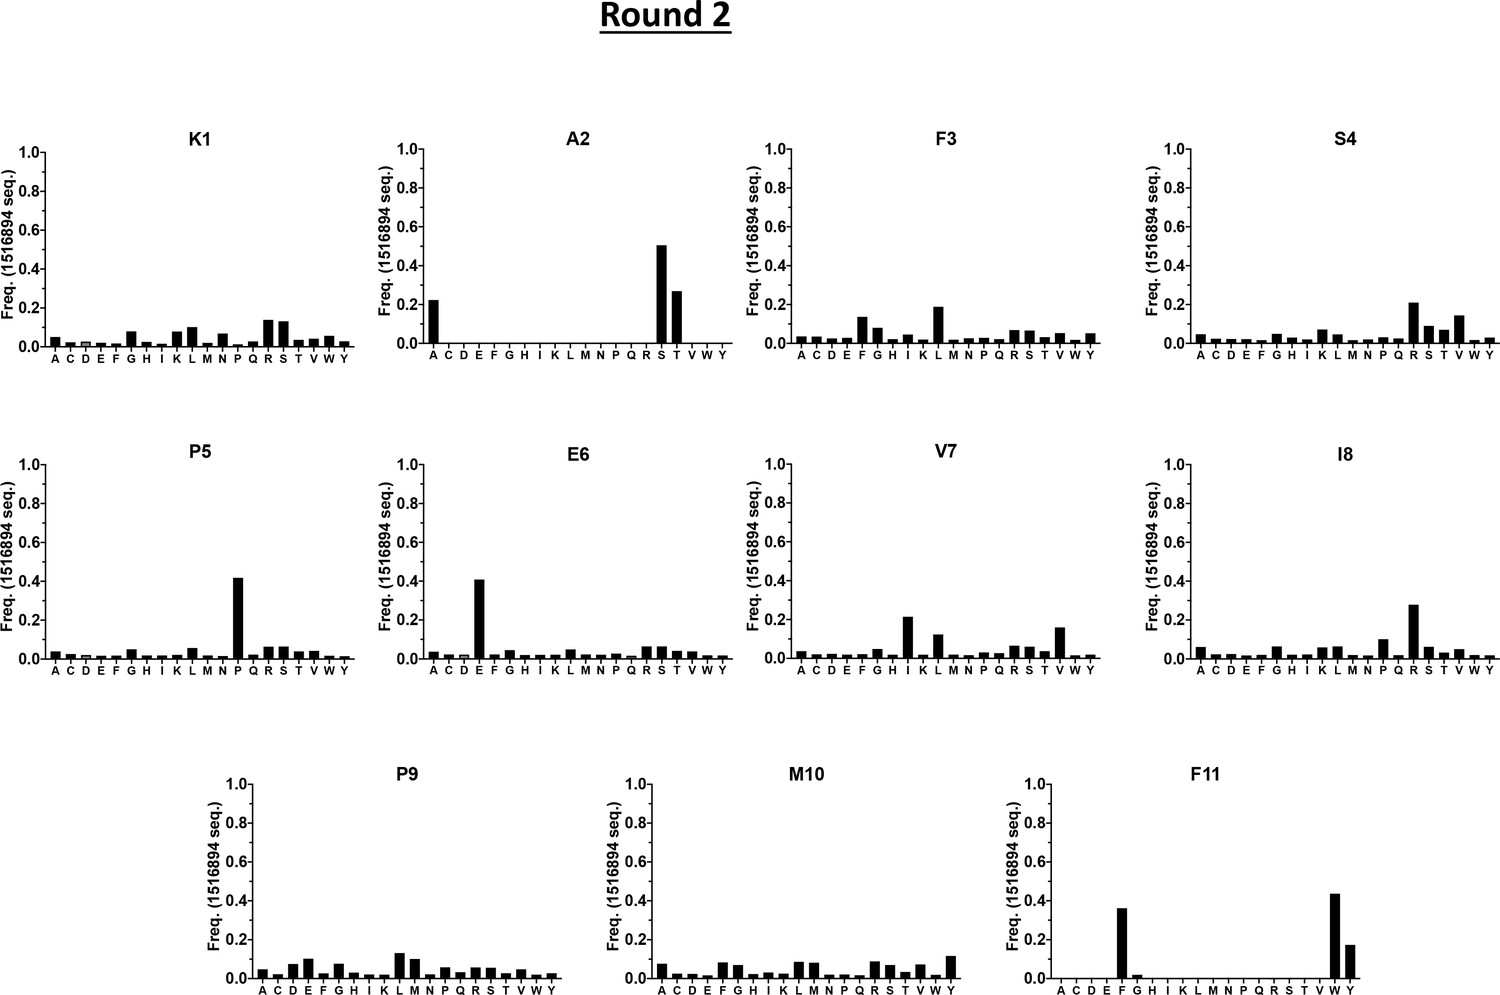
Individual amino acid frequencies of the AGA1 TCR-selected, HLA-B*57:03-restricted yeast display peptide repertoire following Round 2 selection.
Individual amino acid frequencies along the length of the 11 amino acid peptide are illustrated in bar chart format, with the frequencies of peptide sequence reads represented on the Y axis. Individual amino acids at each position of the 11mer peptide are represented on the X-axis. K1, A2, F3 refers to amino acid positions 1, 2, 3, etc, of the HIV KF11 peptide sequence, which is included for reference.
-
Figure 2—figure supplement 3—source data 1
Amino acid signatures of Yeast display libraries-AGA1 TCR Round 2 selection.
- https://cdn.elifesciences.org/articles/58128/elife-58128-fig2-figsupp3-data1-v1.pzfx.zip
Figure 2—figure supplement 4
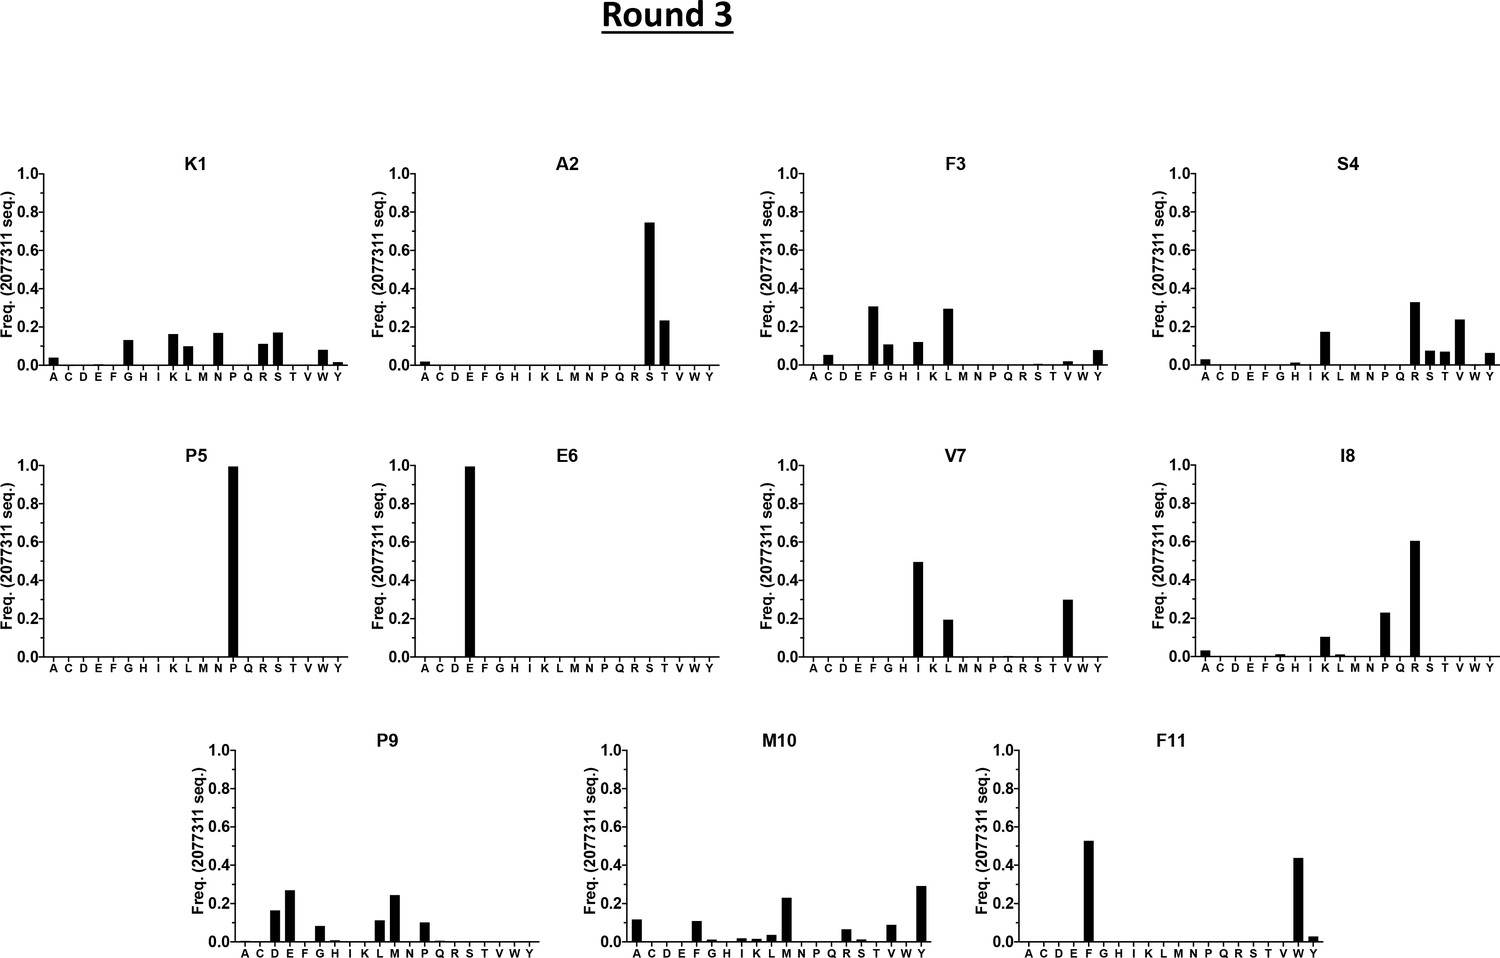
Individual amino acid frequencies of the AGA1 TCR-selected, HLA-B*57:03-restricted yeast display peptide repertoire following Round 3 selection.
Individual amino acid frequencies along the length of the 11 amino acid peptide are illustrated in bar chart format, with the frequencies of peptide sequence reads represented on the Y axis. Individual amino acids at each position of the 11mer peptide are represented on the X-axis. K1, A2, F3 refers to amino acid positions 1, 2, 3, etc, of the HIV KF11 peptide sequence, which is included for reference.
-
Figure 2—figure supplement 4—source data 1
Amino acid signatures of Yeast display libraries-AGA1 TCR Round 3 selection.
- https://cdn.elifesciences.org/articles/58128/elife-58128-fig2-figsupp4-data1-v1.pzfx.zip
Figure 2—figure supplement 5
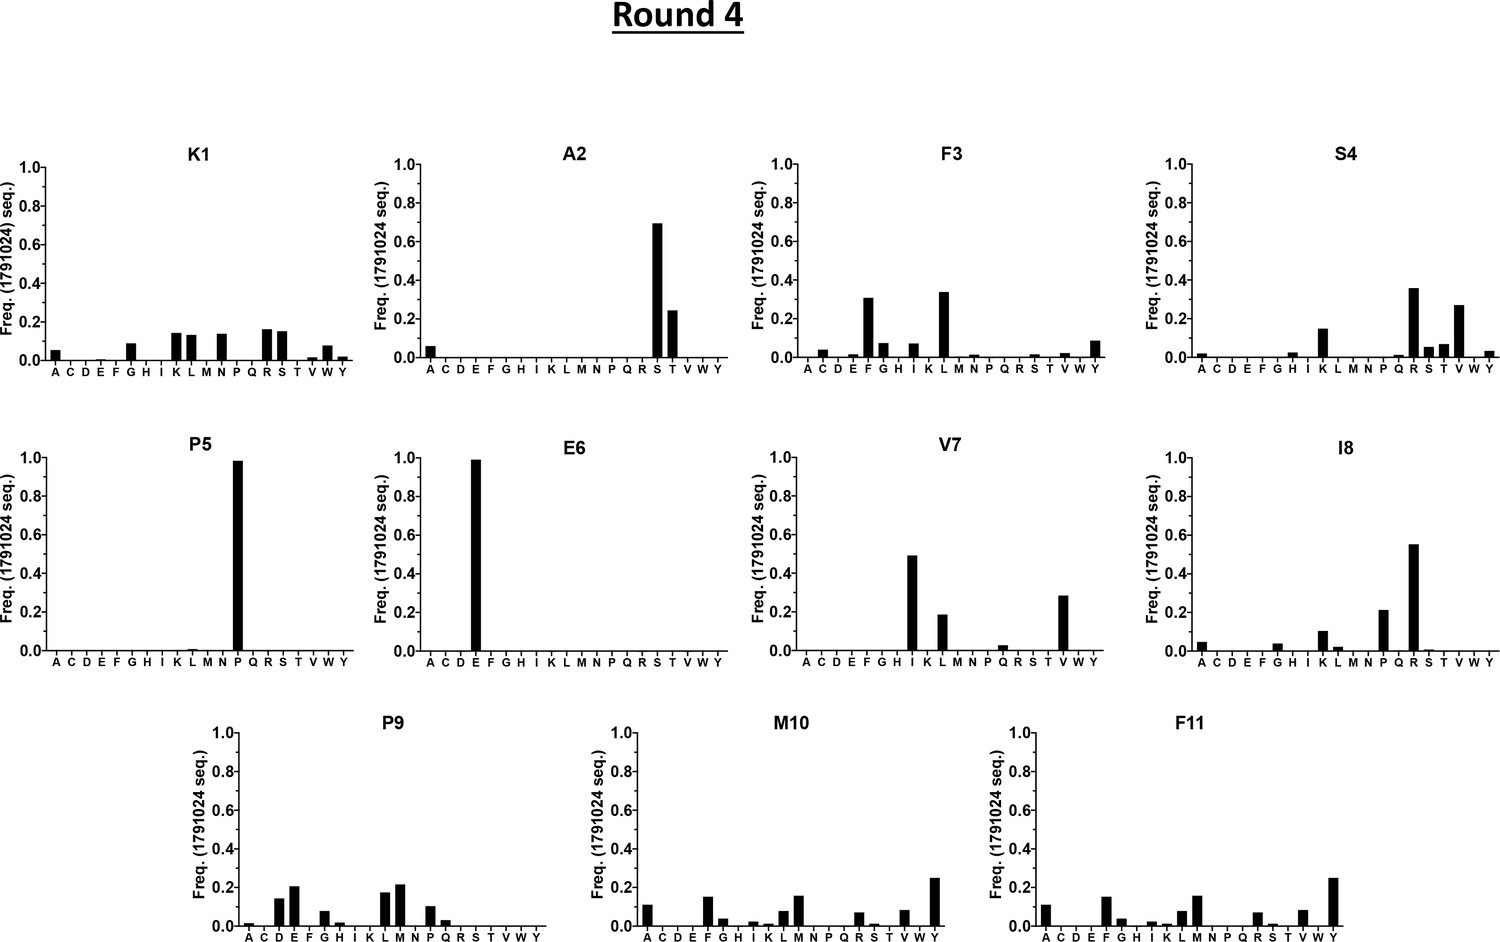
Individual amino acid frequencies of the AGA1 TCR-selected, HLA-B*57:03-restricted yeast display peptide repertoire following Round 4 selection.
Individual amino acid frequencies along the length of the 11 amino acid peptide are illustrated in bar chart format, with the frequencies of peptide sequence reads represented on the Y axis. Individual amino acids at each position of the 11mer peptide are represented on the X-axis. K1, A2, F3 refers to amino acid positions 1, 2, 3, etc, of the HIV KF11 peptide sequence, which is included for reference.
-
Figure 2—figure supplement 5—source data 1
Amino acid signatures of Yeast display libraries-AGA1 TCR Round 3 selection.
- https://cdn.elifesciences.org/articles/58128/elife-58128-fig2-figsupp5-data1-v1.pzfx.zip
Figure 3
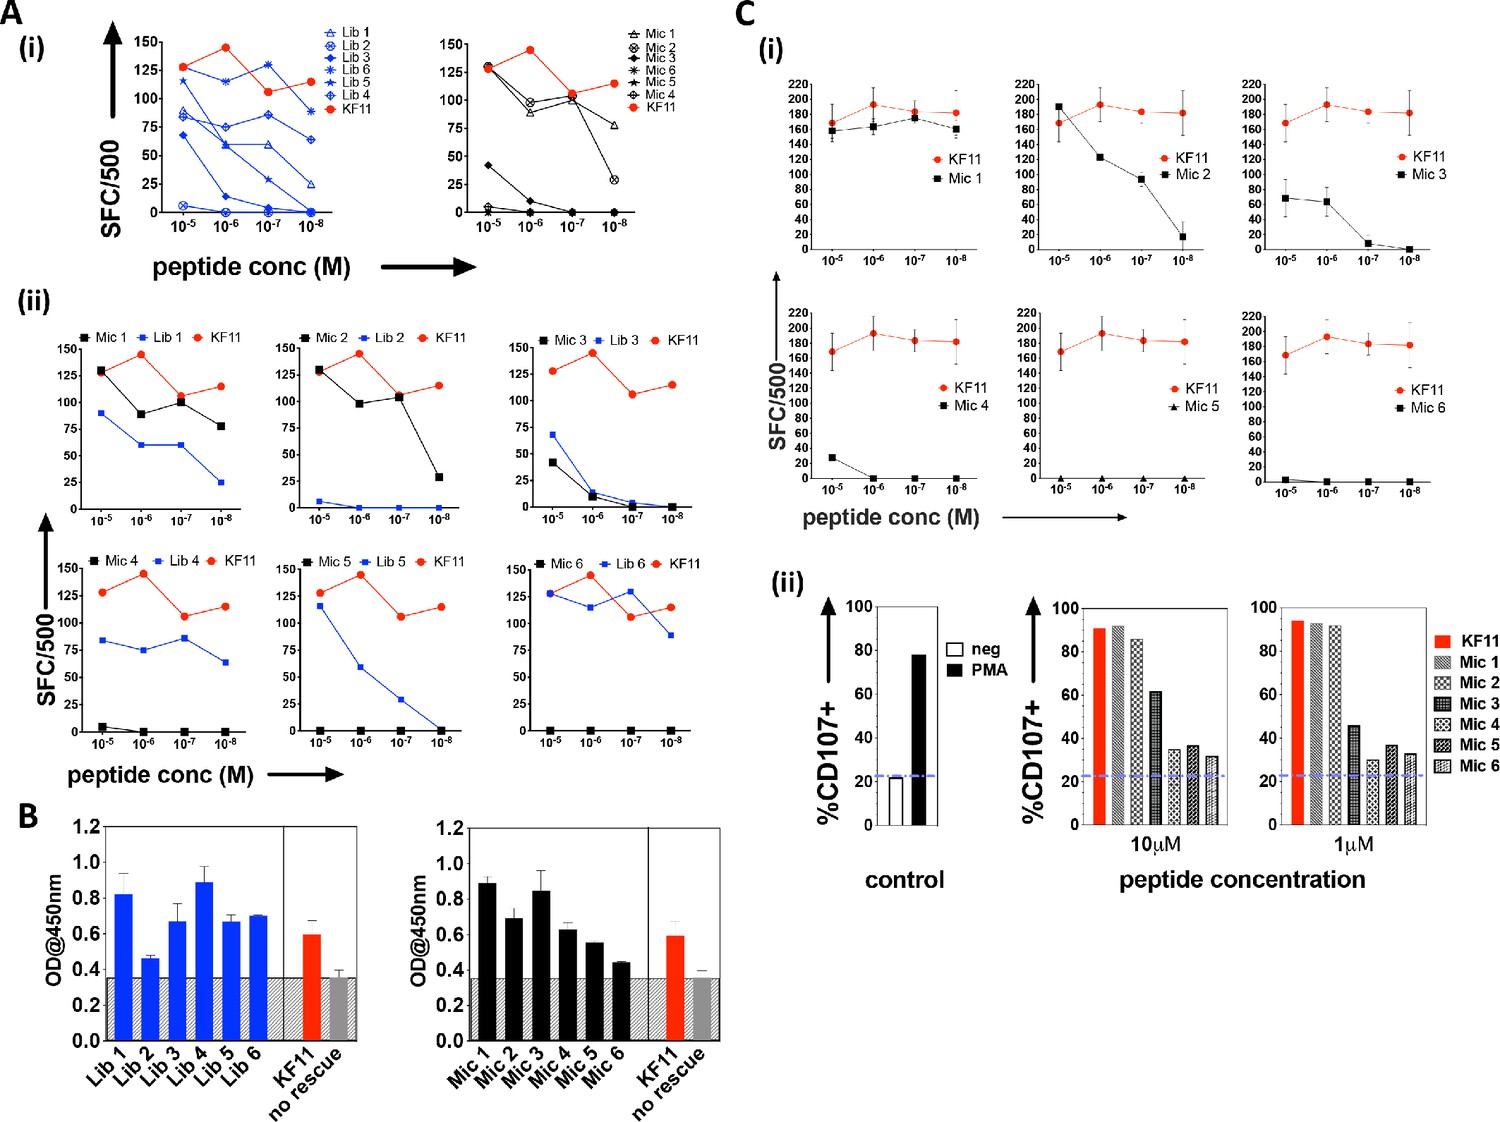
Recognition of library-derived peptides and their closest peptide sequence matches identified from the 'nr' database by AGA1-expressing T cell clones.
(A) Recognition of six library peptides (Lib) and their closest 'nr'-derived microbial peptides (Mic) matches were compared to the index KF11 in IFN-γ based ELISpot assay screens using an AGA1-expressing T cell clone, summarized in (i) with individual Lib and Mic peptide responses plus comparison to KF11 denoted in (ii). Peptide concentration (Molar (M)) is denoted on the X-axis, with numbers of Spot Forming Cells (SFC) per 500 cell input on the Y-axis. Initial screens were performed with one replica per screen, and were screened on two separate occasions following re-stimulation of T cell clone 1.1 (biological repeat, n = 2), with one representative shown here. Test peptide IDs, their origins and sequence identities are specified in Table 1. (B) Binding of library derived and the sequence-mined microbial peptides to HLA-B*57:01, assessed by UV-mediated peptide exchange sandwich ELISA. The Y-axis denotes average absorbance readings at 450 nm, with the peptides tested reported on the X-axis. The background corresponding to the no peptide rescue (nr) control is denoted in grey (also illustrated across the samples by grey hatching). Assays were performed in duplicate (technical repeats, n = 2) on two separate occasions using different peptide stock dilutions (biological repeats, n = 2), with one representative shown here. Error bars corresponding to the Standard Error of the Mean (SEM) are reported. Test peptide IDs, their origins and sequence identities are specified in Table 1. (C) Recognition of the six nr-derived microbial peptides (Mic 1–6) by the closely related AGA1-like T cell clone 1.2, assessed by IFN-γ based ELISpot assay and summarized in (i) with comparison to the KF11 index peptide reported. Peptide concentration (Molar (M)) is denoted on the X-axis with the numbers of Spot Forming Cells (SFC) per 500 cell input on the Y axis. Assays were performed in duplicate (technical repeats, n = 2) on two separate occasions using different peptide stock dilutions and following re-stimulation and resting of T cell clone 1.2 (biological repeats, n = 2), with one representative shown here. Error bars corresponding to the Standard Error of the Mean (SEM) are reported. Test peptide IDs, origins and sequences are specified in Table 1. (ii) Up-regulation of CD107 on T cell clones in response to 1 and 10 μM Mic peptides compared to the index KF11 epitope was assessed by flow cytometry. Negative (no added peptide - purple dashed line) and positive controls (10 ng/mL PMA stimulation) are reported for reference.
-
Figure 3—source data 1
AGA1+ T cell clone 1.1 recognition of top 6 Lib and closest 'nr' mined microbial (Mic) peptide hits_all combined_ELISpot data.
- https://cdn.elifesciences.org/articles/58128/elife-58128-fig3-data1-v1.pzfx.zip
-
Figure 3—source data 2
AGA1+ T cell clone 1.1 recognition of top 6 Lib and closest 'nr' mined microbial (Mic) peptide hits_all combined_ELISpot data.
- https://cdn.elifesciences.org/articles/58128/elife-58128-fig3-data2-v1.pzfx.zip
-
Figure 3—source data 3
UV-exchange HLA-B*57:01 peptide binding ELISA data for Top 6 Lib and closest 'nr' mined microbial (Mic) peptides.
- https://cdn.elifesciences.org/articles/58128/elife-58128-fig3-data3-v1.pzfx.zip
-
Figure 3—source data 4
AGA1+ T cell clone 1.2 recognition of 6 'nr' mined microbial (Mic) peptide hits_individual plots_ELISpot data.
- https://cdn.elifesciences.org/articles/58128/elife-58128-fig3-data4-v1.pzfxalias.zip
-
Figure 3—source data 5
AGA1+ T cell clone 1.2 recognition of 6 'nr' mined microbial (Mic) peptide hits_CD107 data.
- https://cdn.elifesciences.org/articles/58128/elife-58128-fig3-data5-v1.pzfx.zip
Figure 4 with 1 supplement
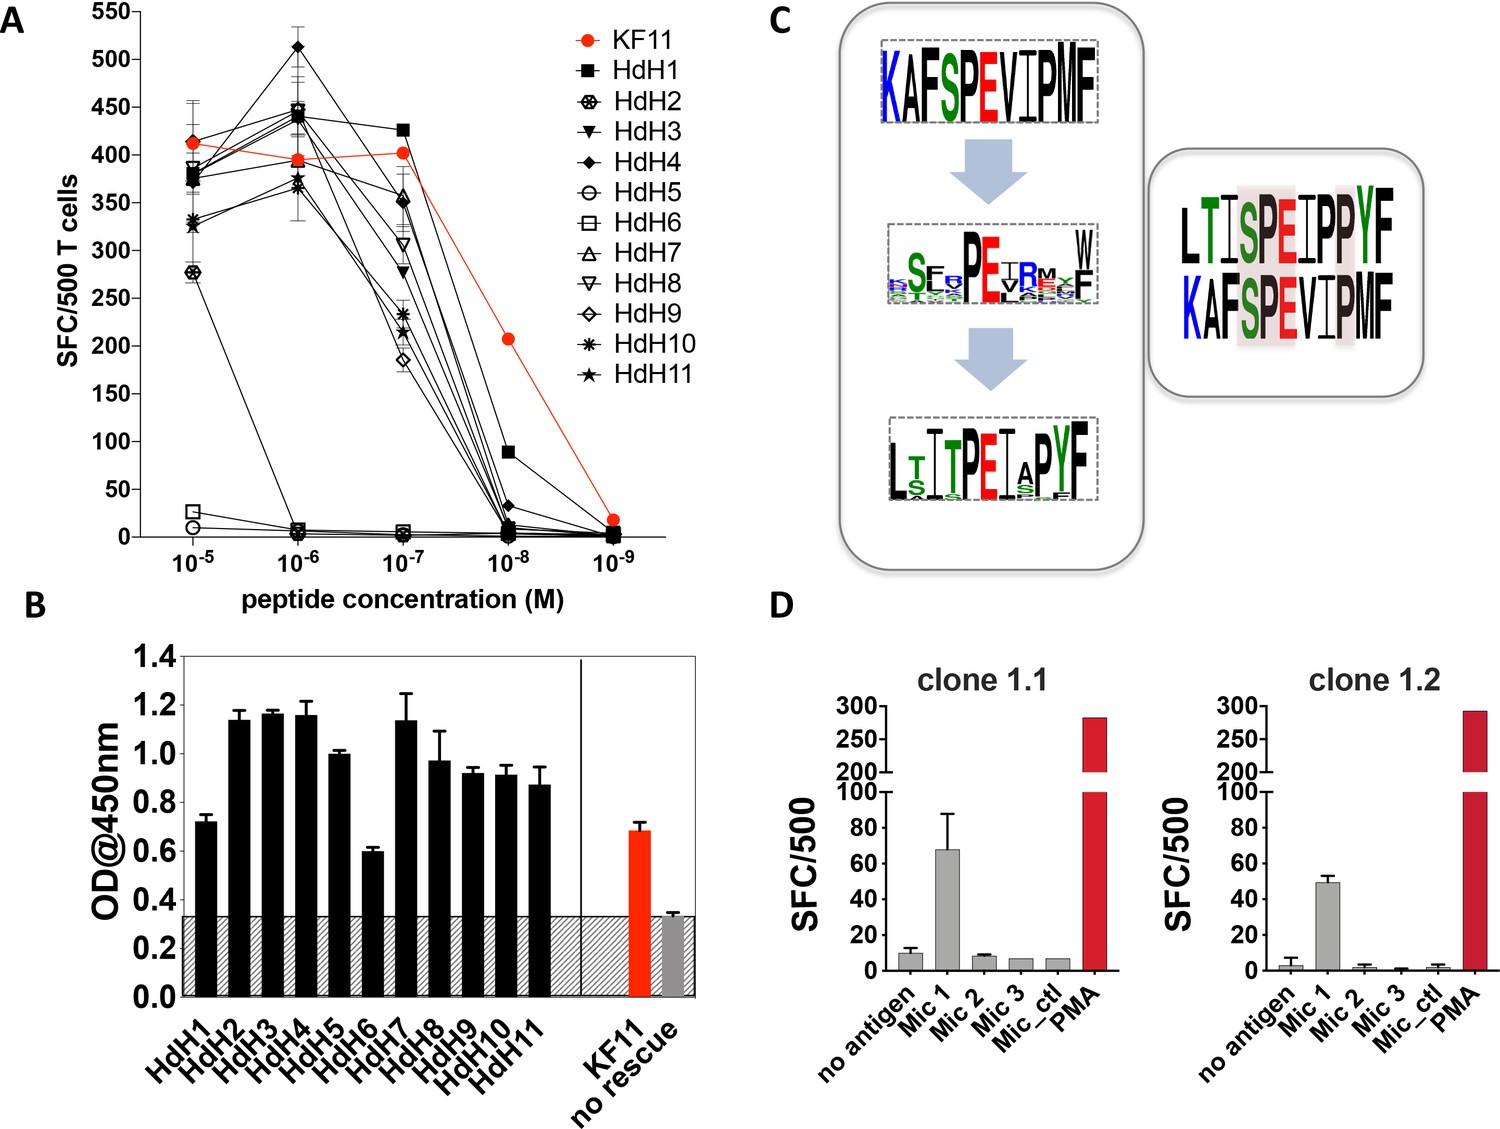
Recognition of haloacid dehydrogenase (HdH) peptides and bacterial lysate-derived antigen by AGA1-expressing T cell clones.
(A) Ten non-redundant ('nr') database-mined HdH peptides with close homology to S. newyorkensis peptide (Mic 1/HdH1) were tested in an IFN-γ based ELISpot assays using an AGA1-expressing T cell clone. Peptide concentration (Molar (M)) is denoted on the X-axis and the numbers of Spot Forming Cells (SFC) per 500 cell input is displayed on the Y-axis. Responses to the KF11 epitope are noted in red. Assays were performed in duplicate (technical repeats) on two separate occasions using different peptide stock dilutions and following re-stimulation and resting of T cell clone 1.2 (biological repeats), with one representative shown here. Error bars corresponding to the Standard Error of the Mean (SEM) reported. Test peptide IDs, their origins and sequence identities are specified in Table 2. (B) Binding of the HdH peptides to HLA-B*57:01, assessed in the UV-mediated peptide exchange sandwich ELISA assay. The Y-axis denotes average absorbance readings at 450 nm and the X-axis denotes test peptides. The background corresponding to the no peptide rescue (nr) control is denoted in grey (also illustrated across the samples by grey hatching). Assays were performed in duplicate (technical repeats) on two separate occasions using different peptide stock dilutions (biological repeats, n = 2), with one representative shown here. Error bars corresponding to the Standard Error of the Mean (SEM) are reported. Test peptide IDs, their origins and sequence identities are specified in Table 2. (C) Summary of evolved peptide motifs recognised by the AGA1 TCR. Recognition beyond the original KAFSPEVIPMF (KF11) index motif is exemplified initially by the diverse peptide sequences retrieved during repeated rounds of AGA1 TCR-mediated peptide selection, with a Seq2Logo motif reported for the top 20 Round 3 evolved peptide libraries. Following evaluation of 'nr'-database derived peptides in T cell functional assays, peptides that elicited the strongest functional responses - in this case, a S. newyorkensis-derived haloacid dehydrogenase peptide -allowed further refinement of database-led search motifs and identification of related peptide that were functionally recognized by AGA1 TCR-expressing T cell clones. Amino acids shared between KF11 and the S. newyorkensis-derived Mic1/HdH1 peptide is illustrated in the smaller right panel (pink shading). (D) Recognition of bacterial cell lysates from S. newyorkensis (Mic 1), C. orthopsilosis (Mic 2), O. uli (Mic 3) and R. gnavus (control) by AGA1-expressing T cell clones 1.1 and 1.2 was tested using an IFN-γ based ELISpot assay. Bacterial cell lysates (20μg/mL) were incubated with cytokine-matured HLA-B*57:01 positive HL60 cells for 7 hours, following which T cell responses were evaluated. PMA (10ng/mL) was included as a positive control, and the background control comprised HL60 cells incubated with T cells only. Lysate identity is denoted on the X-axes and the numbers of Spot Forming Cells (SFC) per 500 cell input are displayed on the Y-axes. Assays were performed in duplicate (technical repeats, n = 2) on two separate occasions (biological repeats, n = 2) using fresh lysate stock dilutions and following re-stimulation and resting of T cell clones 1.1 and 1.2. One representative is shown.
-
Figure 4—source data 1
AGA1+ T cell clone 1.2 recognition of 'nr' mined HdH peptides_ELISpot data.
- https://cdn.elifesciences.org/articles/58128/elife-58128-fig4-data1-v1.pzfx.zip
-
Figure 4—source data 2
UV-exchange HLA-B*57:01 peptide binding ELISA data for HdH peptides.
- https://cdn.elifesciences.org/articles/58128/elife-58128-fig4-data2-v1.pzfx.zip
-
Figure 4—source data 3
Recognition of S. newyorkensis bacterial lysates by AGA1+ T cell clones 1.1 and 1.2_ELISpot data.
- https://cdn.elifesciences.org/articles/58128/elife-58128-fig4-data3-v1.pzfx.zip
Figure 4—figure supplement 1
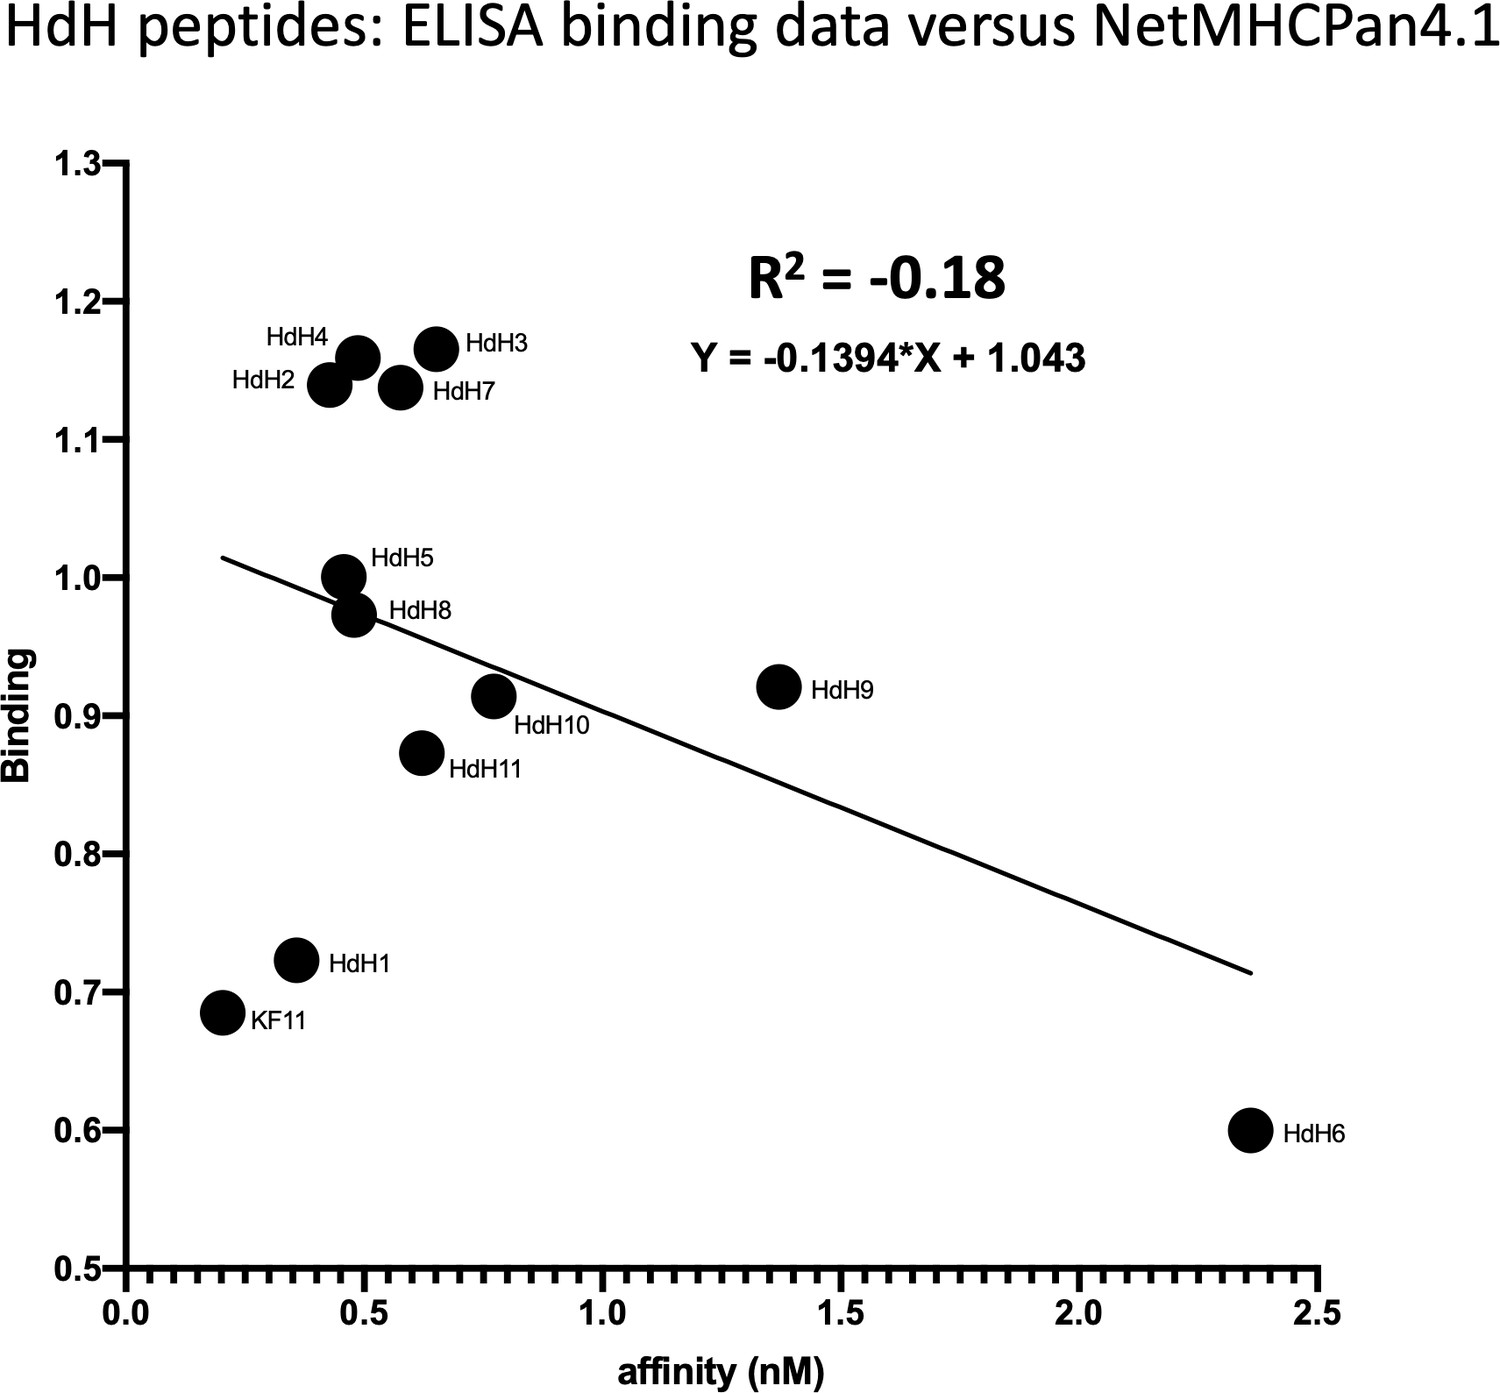
Weak, negative correlation between HLA-B*57:01 UV exchange-peptide binding data and Net MHCpan 4.1 predicted affinities for KF11 and the HdH peptides.
UV exchange peptide binding data for HLA-B*57:01 is displayed on the Y axis and peptide binding affinities (nM) predicted using NetMHCPan4.1 (http://www.cbs.dtu.dk/services/NetMHCpan/) are reported on the X axis. Correlation coefficient (R2) was calculated in Microsoft Excel.
-
Figure 4—figure supplement 1—source data 1
Correlation between UV exchange HLA-B*57:01 peptide binding data and NetMHC pan4.1 predicitons.
- https://cdn.elifesciences.org/articles/58128/elife-58128-fig4-figsupp1-data1-v1.pzfx.zip
Tables
Key resources table
| Reagent type (species) or resource | Designation | Source or reference | Identifiers | Additional information |
|---|---|---|---|---|
| Cell line (S. cerevisiae) | EBY100 | D. Wittrup, PMID:9181578 | MATa AGA1::GAL1-AGA1::URA3 ura3-52 trp1 leu2-delta200 his3-delta200 pep4::HIS3 prbd1.6R can1 GAL | |
| Strain, strain background (Escherichia coli) | Rosetta 2 | Novagen | 71400–3 | F- ompT hsdSB(rB- mB-) gal dcm (DE3) pRARE2 (CamR) |
| Genetic reagent (Homo sapiens) | AGA1 TCR biotin tag, PET22b+ construct | This paper | disulfide bridge was introduced into both the alpha and beta TCR chains, hexahistidine tag and a BirA biotinylation substrate motif | |
| Recombinant DNA reagent | Peptide-HLA-B*5703, PYAL vector | This paper | a single chain fusion display where HLA-B*57:03 heavy chain domains were included downstream of the KF11 epitope sequence and the β2m gene | |
| Commercial assay or kit | streptavidin microbeads | Miltenyi Biotec | 130-048-102 | |
| Commercial assay or kit | LS column | Miltenyi Biotec | 130-042-401 | |
| Commercial assay or kit | Zymoprep II kit | Zymo Research | D2004 | |
| Commercial assay or kit | MiSeq Reagent V2 kit | Illumina | MS-102–2002 | |
| Antibody | anti-myc 488 (mouse monoclonal,9B11) | Cell Signaling | 2279 RRID:AB_2151849 | |
| Peptide, recombinant protein | Streptavidin Alexa 647 | PMID:17187819 | ||
| Software, algorithm | PandaSeq | PMID:22333067 | ||
| Software, algorithm | Geneious, version 6 | Biomatters, Inc | ||
| Software, algorithm | Perl scripts for data prep, analysis and prediction | PMID:24855945 | ||
| Software, algorithm | Matlab, R2015b | Mathworks, Inc | ||
| Cell line (Homo sapiens) | HL60 | ATCC | RRID:CVCL_0002 | Antigen processing experiments |
| Antibody | Anti-human CD8-APC (mouse monoclonal, clone RPA-T8) | BD Bioscience | 555369 RRID:AB_398595 | Functional T cell assay (2.5 μL/test) |
| Antibody | Anti-human CD107a PE (mouse monoclonal, clone H4A3) | BD Bioscience | 555801 RRID:AB_396135 | Functional T cell assay (3 μL/test) |
| Chemical compound, drug | BD Golgi Stop | BD Bioscience | 554724 | Protein transport inhibitor for T cell functional studies (1:1500) |
| Chemical compound, drug | BD Cytofix | BD Bioscience | 554655 | Cell fixation prior to flow cytometric analysis (150 μL/tube) |
| Software, algorithm | FlowJo | FlowJo-BD | Analysis of flow cytometry data | |
| Commercial assay or kit | Human IFNγ ELISpotPLUSkit-ALP strips | MABTECH | 3420-4AST | T cell functional ELISpot assays to assess IFN-γ production. |
| Software, algorithm | AID ELISpot Classic | resolving IMAGES | ||
| Peptide, recombinant protein | synthetic peptides | This paper | KF11, HdH1-11, Mic1-6, Lib1-6 | Synthetic KF11, Mic, Lib and HdH peptides for functional T cell studies – as per concentrations and titrations in Materials and methods. |
| Others | Interferon γ | PeproTech | 300-02-100μg | Maturation of antigen presenting cells (1000 U/mL) |
| Chemical compound, drug | Calcium Ionophore | Sigma | A23187 | Maturation of antigen presenting cells (100 ng/mL) |
| Chemical compound, drug | PMA | Sigma | P1585 | Positive control for T cell functional assays (10 ng/mL) |
| Strain, strain background (Sporosarcina newyorkensis) | Sporosarcina newyorkensis | DSMZ-German Collection of Microorganisms and Cell Cultures GmbH | DSM-23544 | Bacterial cultures for generation of lysates (20 μg/mL) |
| Strain, strain background (Olsenella uli) | Olsenella uli | DSMZ-German Collection of Microorganisms and Cell Cultures GmbH | DSM 7084 | Bacterial cultures for generation of lysates (20 μg/mL) |
| Strain, strain background(Candida orthopsilosis) | Candida orthopsilosis | DSMZ-German Collection of Microorganisms and Cell Cultures GmbH | DSM 24508 | Bacterial cultures for generation of lysates (20 μg/mL) |
| Strain, strain background (Ruminococcus gnavus) | Ruminococcus gnavus | DSMZ-German Collection of Microorganisms and Cell Cultures GmbH | CC55_001C | Bacterial cultures for generation of lysates (20 μg/mL) |
| Commercial assay, kit | Pierce BCA Protein Assay Kit | Thermo Fisher Scientific | 23225 | Quantification of bacterial cell lysates. |
| Genetic reagent (Homo sapiens) | HLA-B*57:01 biotin tagged | PMID:11953462 | Expression plasmid for HLA-B*57:01 protein expression. | |
| Peptide, recombinant protein | 9MT4 UV peptide | PMID:21430058 | UV exchange peptide for HLA-B*57:01 protein refold (1:100) | |
| Antibody | anti-human ABC (mouse monoclonal, clone W6/32) | Biolegend | 311402 | Coating antibody for UV-peptide exchange ELISA (10 μg/mL) |
| Antibody | anti-human B2M biotin (mouse, monoclonal, clone 2M2) | Biolegend | 316308 RRID:AB_493689 | Detection antibody for UV-peptide exchange ELISA (1 μg/mL) |
| Chemical compound, drug | ExtrAvidin-peroxidase | Sigma | E2886 | Assay development step (1) for UV-peptide exchange ELISA (1:1000) |
| Chemical compound, drug | TMB High sensitivity Substrate | Biolegend | 421501 | Assay development step (2) for UV-peptide exchange ELISA (100 μL/well) |
| Chemical compound, drug | Stop Solution | Biolegend | 423001 | Assay development stop step (3) for UV-peptide exchange ELISA (100 μL/well) |
| Software, algorithm | FLUOstar | BMG LABTECH | ELISA plate absorbance reading@450 nm |
Additional files
-
Supplementary file 1
Non-redundant (‘nr’) database recovered KF11-related peptides, TCR sequence similarity of T cell clones and HLA-B*57:01 HdH peptide binding hierarchies.
Table 1: Round 3 of the AGA-1 TCR yeast display selection results were used to identify sequence related peptides from the non-redundant ('nr') database. Listed are the prediction results for KF11-related peptides derived from the gag HIV protein. GI identification and blast scores are included. Table 2: AGA-1 TCR yeast display selection results from Round 3 screens were used to identify sequence related peptides from the non-redundant ('nr') database. Listed are the prediction results of sequence-related, non-KF11 peptides. GI identification, blast scores, % identity to the KF11 peptide and to 'nr' database mined peptide hits are included. Table 3: TCR alpha chain amino acid sequence identity of clone 1.2 and the AGA1 (clone 1.1) TCR. Clones 1.1 and 1.2 both utilize the V alpha 5 (AV5) chain segments, encode identical CDR3 motifs and carry one amino acid sequences difference that maps to the J alpha (AJ) region (underlined). This residue is outside the TCR:peptide-MHC binding interface described previously for the AGA1 TCR-B*57:03-KF11 co-complex (red) (Stewart-Jones et al., 2012). AGA1 TCR clone 1.1 and the related clone 1.2 are 100% sequence identical across the CDR3 and J regions of their V beta19 (BV19) TCR chain sequences (CASTGSYGYTFGSGTRLTVT) (Stewart-Jones et al., 2012). The TCR V region, CDR3 and J region boundaries as defined by ImMunoGeneTics (IMGT), http://www.imgt.org/IMGTrepertoire/. Table 4: Peptide binding strength hierarchy ranked on the basis of UV exchange HLA-B*57:01 peptide binding ELISA data. The index KF11 epitope and the HdH peptides are ranked in descending order according to their peptide binding strength as determined using the UV exchange peptide binding assay. High, medium and low binders are color-coded from dark to light shades of grey, respectively. Amino acids differences specific to low/medium binders outside the p4-p6 TCR recognition interface are highlighted (bold squared). p1 = peptide position 1, etc.
- https://cdn.elifesciences.org/articles/58128/elife-58128-supp1-v1.pptx
-
Source data 1
Library peptide-based returned 'nr' hits_KF11 variant peptides.
- https://cdn.elifesciences.org/articles/58128/elife-58128-data1-v1.xlsx
-
Source data 2
Library peptide-based returned 'nr' hits_non-KF11 related peptides.
- https://cdn.elifesciences.org/articles/58128/elife-58128-data2-v1.xlsx
-
Source data 3
Correlation between ELISA data and NetMHC Pan4.1 binding predictions for HdH peptides.
- https://cdn.elifesciences.org/articles/58128/elife-58128-data3-v1.xlsx
-
Transparent reporting form
- https://cdn.elifesciences.org/articles/58128/elife-58128-transrepform-v1.docx
Download links
A two-part list of links to download the article, or parts of the article, in various formats.
Downloads (link to download the article as PDF)
Open citations (links to open the citations from this article in various online reference manager services)
Cite this article (links to download the citations from this article in formats compatible with various reference manager tools)
Interrogating the recognition landscape of a conserved HIV-specific TCR reveals distinct bacterial peptide cross-reactivity
eLife 9:e58128.
https://doi.org/10.7554/eLife.58128


