Multiscale cardiac imaging spanning the whole heart and its internal cellular architecture in a small animal model
- Biomedical Engineering, Oregon Health & Science University, United States
- Multiscale Microscopy Core, Oregon Health & Science University, United States
- Center for Developmental Health, Knight Cardiovascular Institute, Oregon Health & Science University, United States
Figures
Figure 1
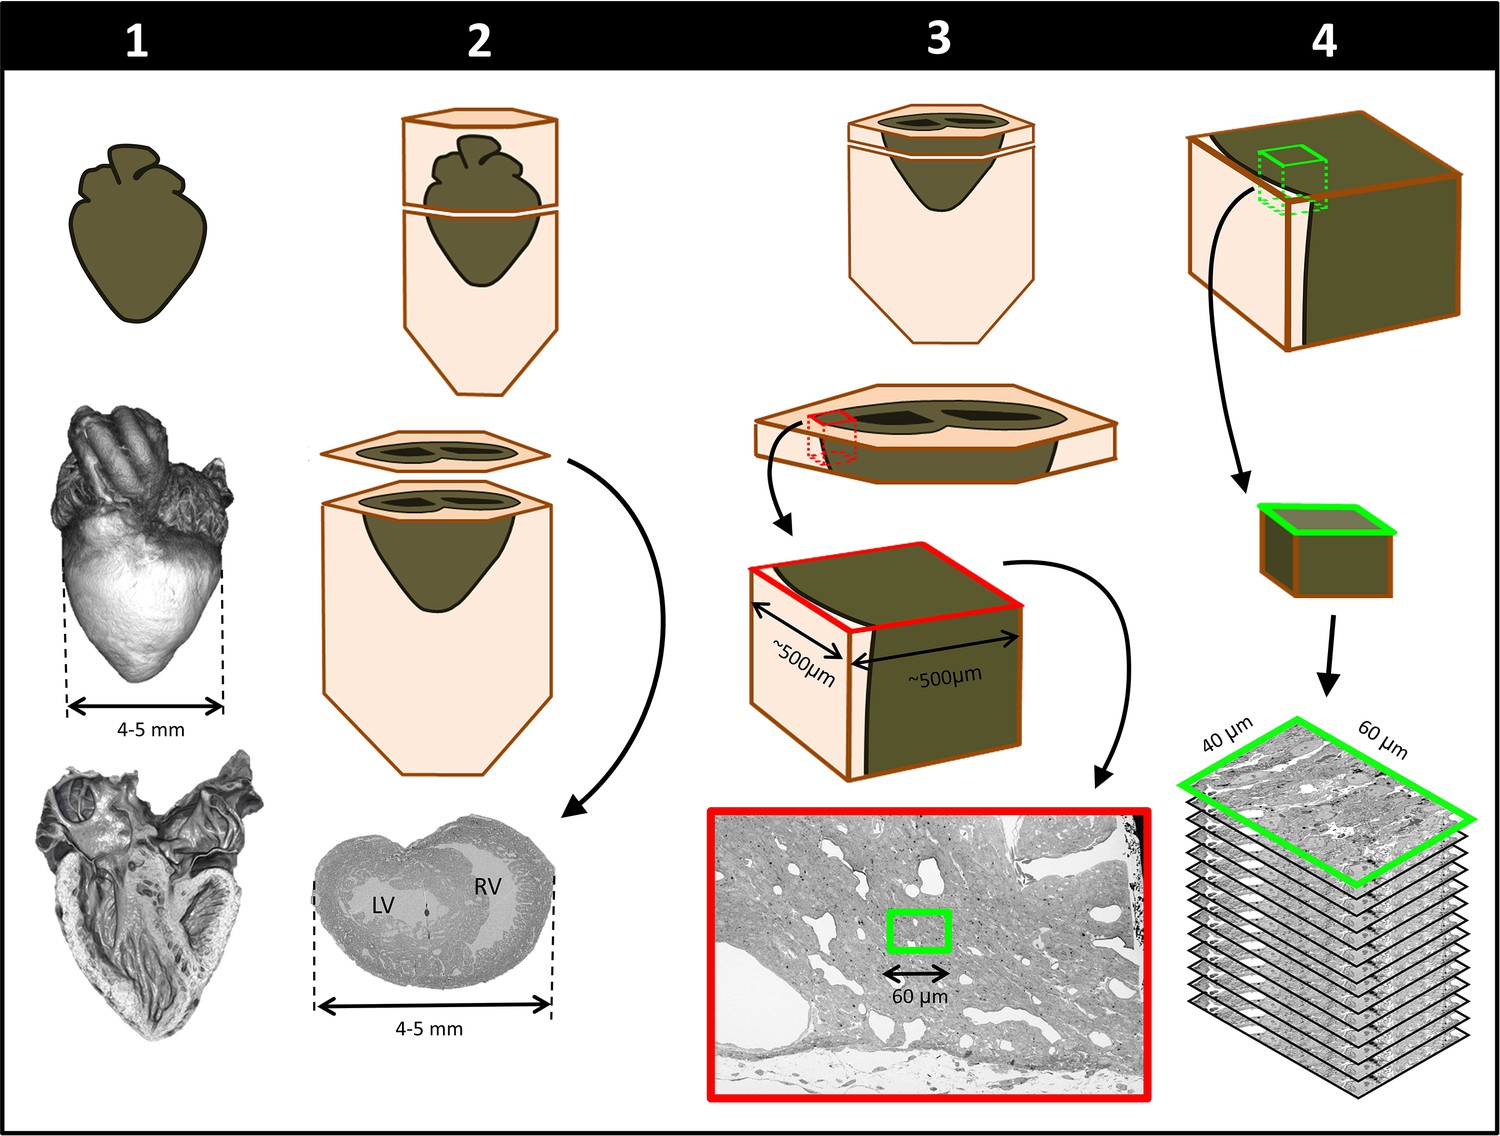
Schematics of steps performed to achieve cardiac multiscale imaging, which yields both 3D whole-heart images and 3D ultrastructural images from the same heart.
Columns depict the four steps employed. In Step 1, the heart is post-fixed with osmium tetroxide to provide contrast for 3D micro-CT images of the whole heart (middle row). Digital sections of the micro-CT scans (bottom row) reveal the heart’s interior and allow for cardiac phenotyping and assessment of stain penetration. In Step 2, contrast staining is finalized and the resin block in which the heart is embedded is sectioned to reach a plane of interest (bottom row). In Step 3, after cutting a slab of the sample, a region of interest (ROI) is sectioned from the slab, mounted, and then scanned by SEM backscattered imaging methods to aid in the selection of sub-ROIs (for example, the sub-ROI highlighted in green). In Step 4, the selected sub-ROI 3D SBF-SEM images are acquired by progressively sectioning and imaging layers that are 40-nm apart.
Figure 2
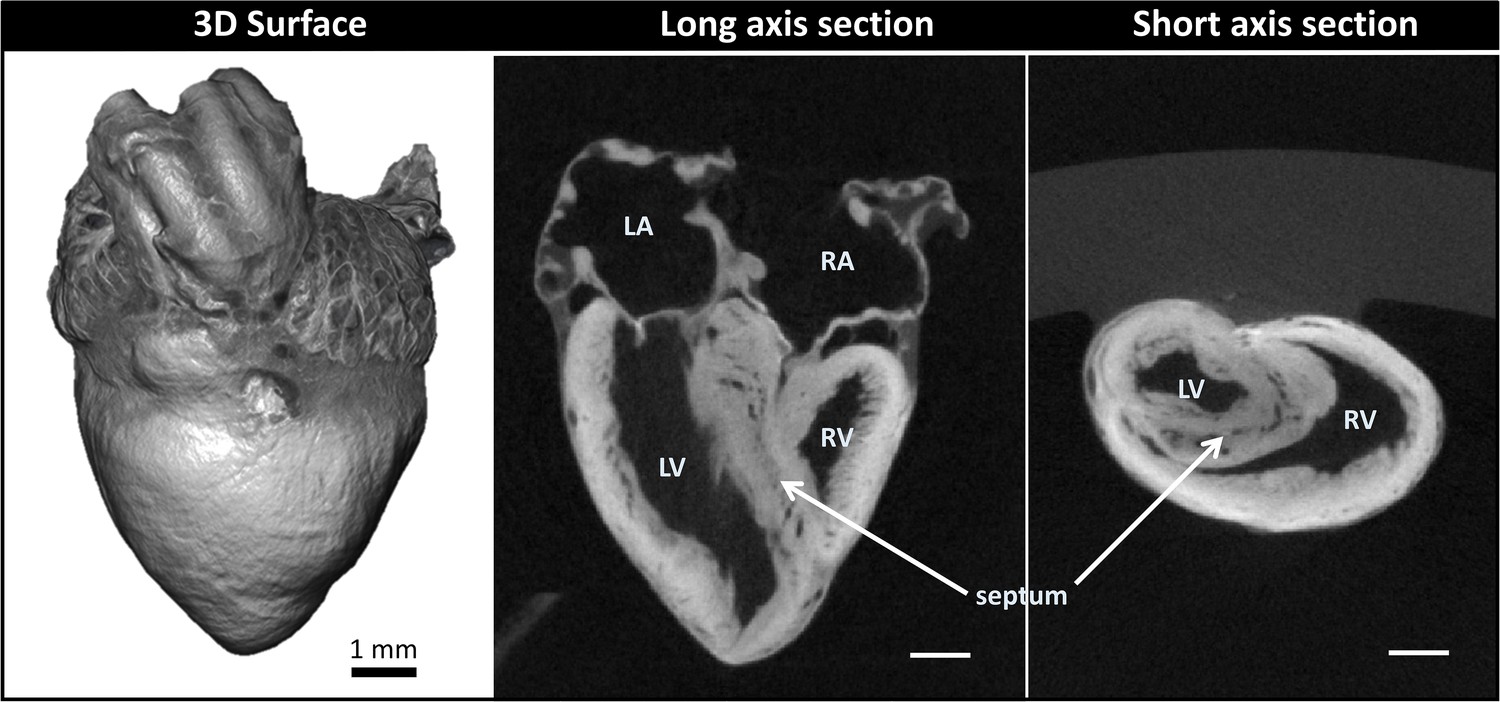
Micro-computed tomography (micro-CT) images of a chicken embryo normal heart.
The contrast was achieved by following Step 1 of our correlative multiscale imaging protocol (Figure 1). From left to right: External 3D surface of the heart; cardiac section along the heart’s long axis (coronal section); cardiac section across the heart’s short axis (transverse section). Cardiac sections show uniform staining across cardiac walls, and reveal the heart internal and external microstructure. LA: left atrium; LV: left ventricle; RA: right atrium; RV: right ventricle. Scale bars 1 mm.
Figure 3
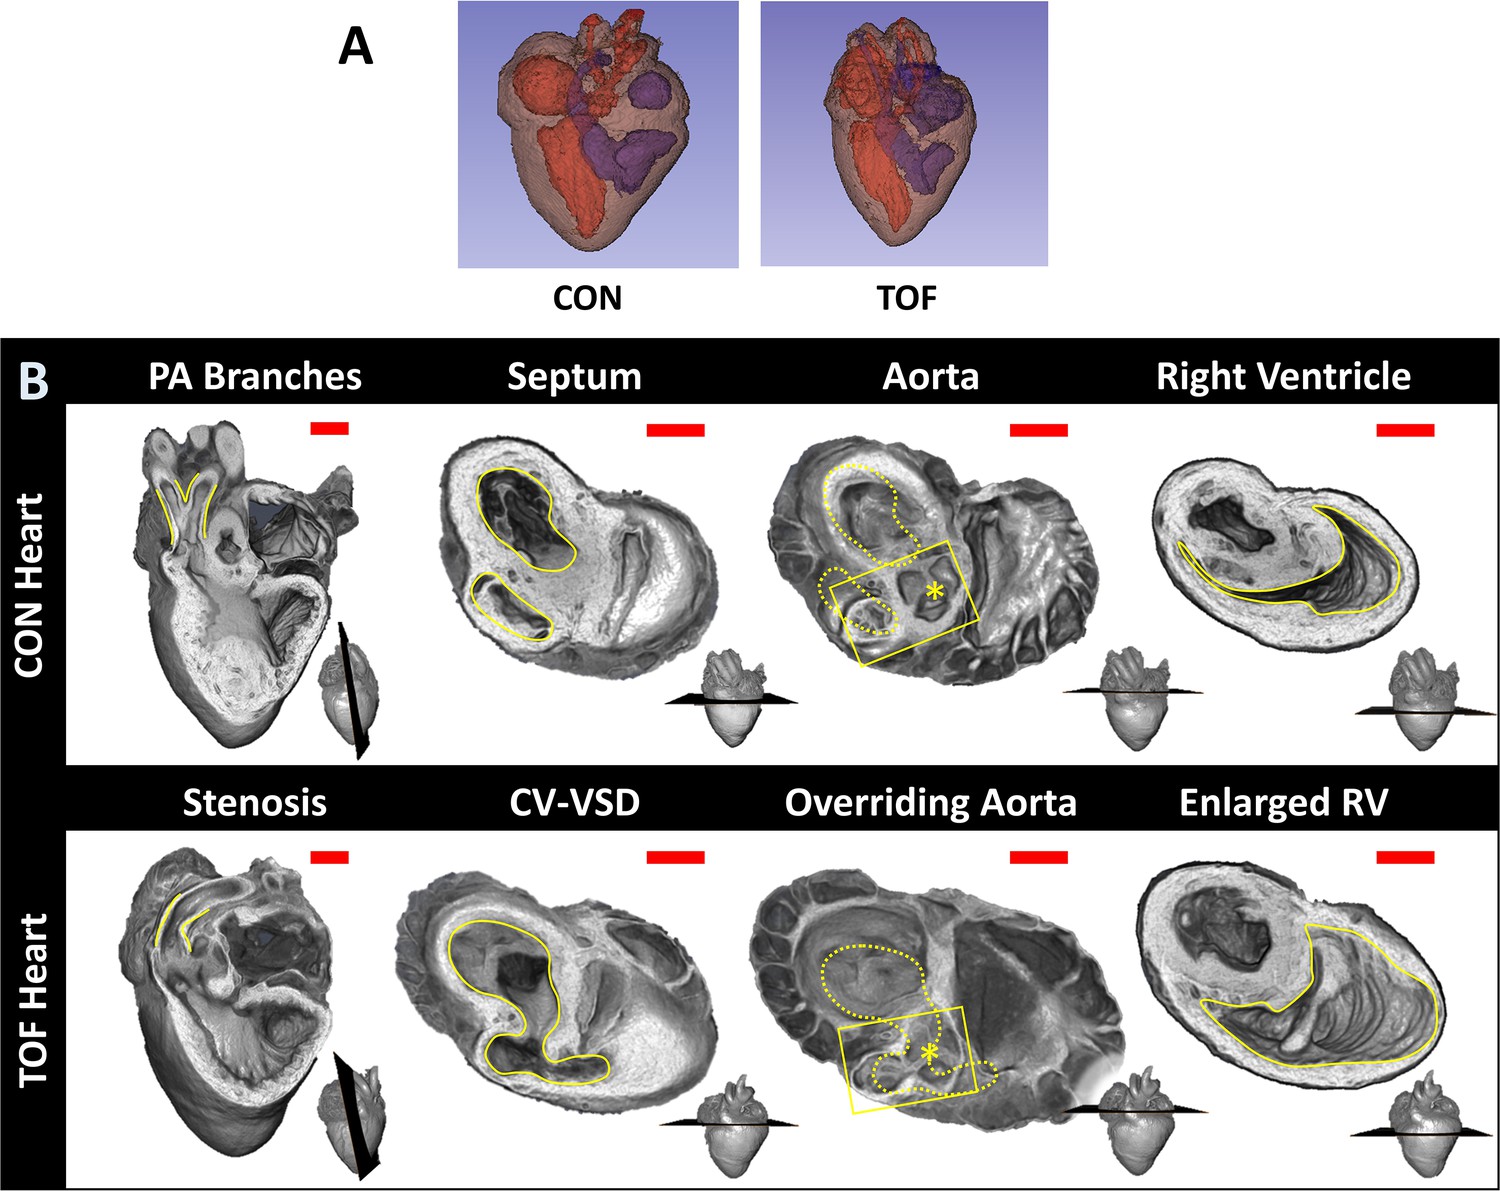
Comparison of micro-CT images of the two hearts selected for this study.
(A) Segmentations showing the heart morphology for the normal, control (CON) heart and the TOF heart. Red: lumen of the left atrium and ventricle as well as aorta; Blue: lumen of the right atrium and ventricle as well as pulmonary artery; Brown: heart tissue. (B) Detailed comparison of the two hearts. Each column compares a cardiac feature (highlighted in yellow) between the hearts. The position of the plane along which the tissue was cut for display is shown at the bottom right of each image. From left to right: Pulmonary artery (PA) branches: On the control heart, the PA is bifurcated (yellow lines) whereas the left branch of the PA is absent in the TOF heart. The remaining PA of the TOF heart exhibits supravalvular stenosis (yellow lines). Septum: The ventricles (yellow lines) in the control heart are discrete, separated by an intact interventricular septum, whereas the TOF heart shows a conoventricular septal defect (CV-VSD). Aorta: In the control heart the aortic valve (asterisk) is connected to the left ventricle, whereas in the TOF heart the aortic valve is positioned directly over the VSD. Dotted yellow lines show the position of yellow lines in the septum column. Right Ventricle (RV): The RV (yellow lines) is significantly larger in the TOF heart than in the control heart. Scale bars = 1 mm.
Figure 4
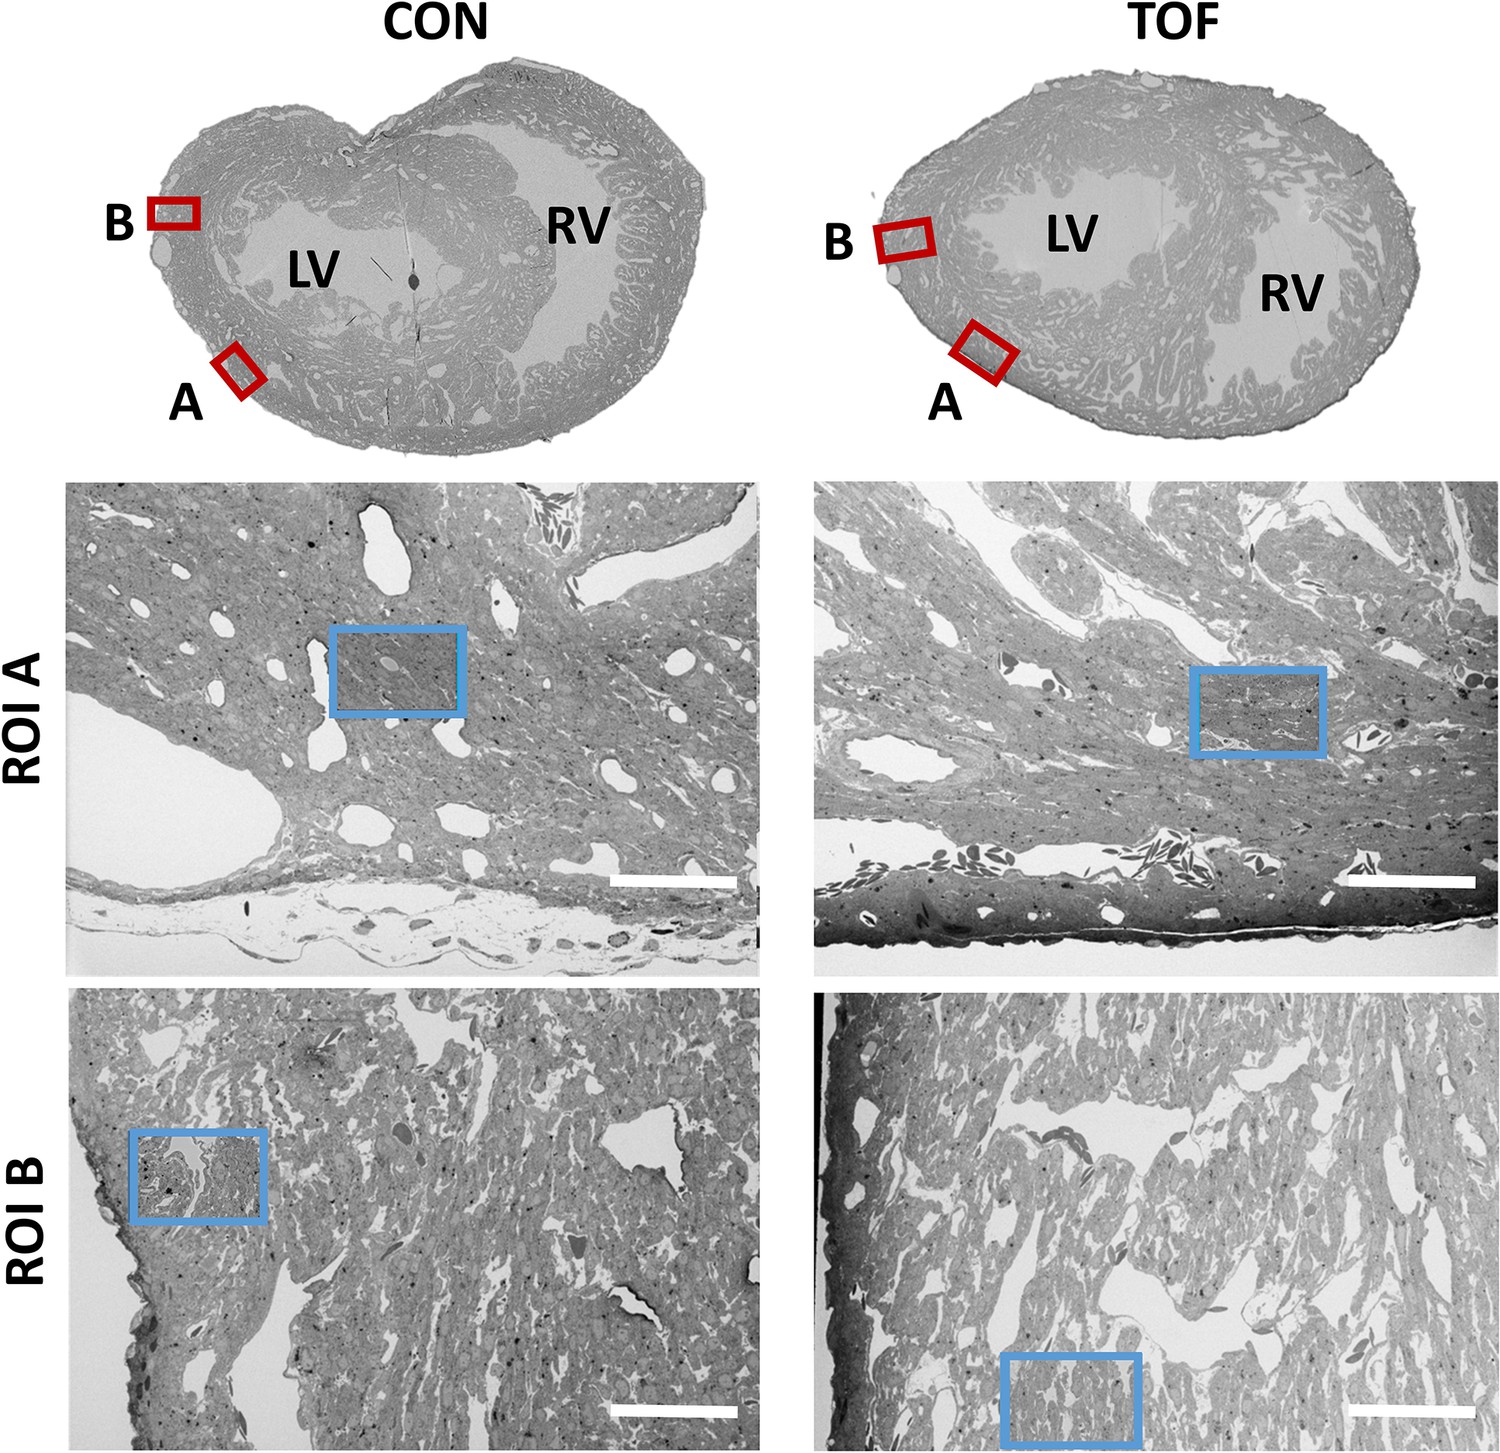
SBF-SEM images of the control (CON, left) and TOF (right) hearts, indicating the location of imaging.
Overview scans from semithin transverse sections of each heart (top row) were used to confirm uniform stain penetration and the location of 2 ROIs per heart (ROI A and ROI B) further analyzed (red boxes). Semithin sections are not to scale. Blood vessels and trabeculae served as landmarks for accurate positioning of the ROIs and sub-ROIs (blue boxes). LV: left ventricle; RV: right ventricle. The sub-ROIs corresponding to ROI A (second row), were fully segmented (nuclei, extracellular space, myofibrils, and mitochondria). However, the sub-ROIs corresponding to ROI B (third row) were only partially segmented (only a fraction of the images in the stack were segmented) for quantification purposes. Scale bars 60 µm.
Figure 5

Detail of high-resolution SBF-SEM images obtained.
The pictures depict small regions within the selected sub-ROIs from region A of the control (CON) and TOF hearts. Nuclear membranes (N) are intact, as well as myofibrils (Myo) and mitochondria (Mit). Finally, the extracellular space (EC) is also visible. Scale bars 2 µm.
Figure 6
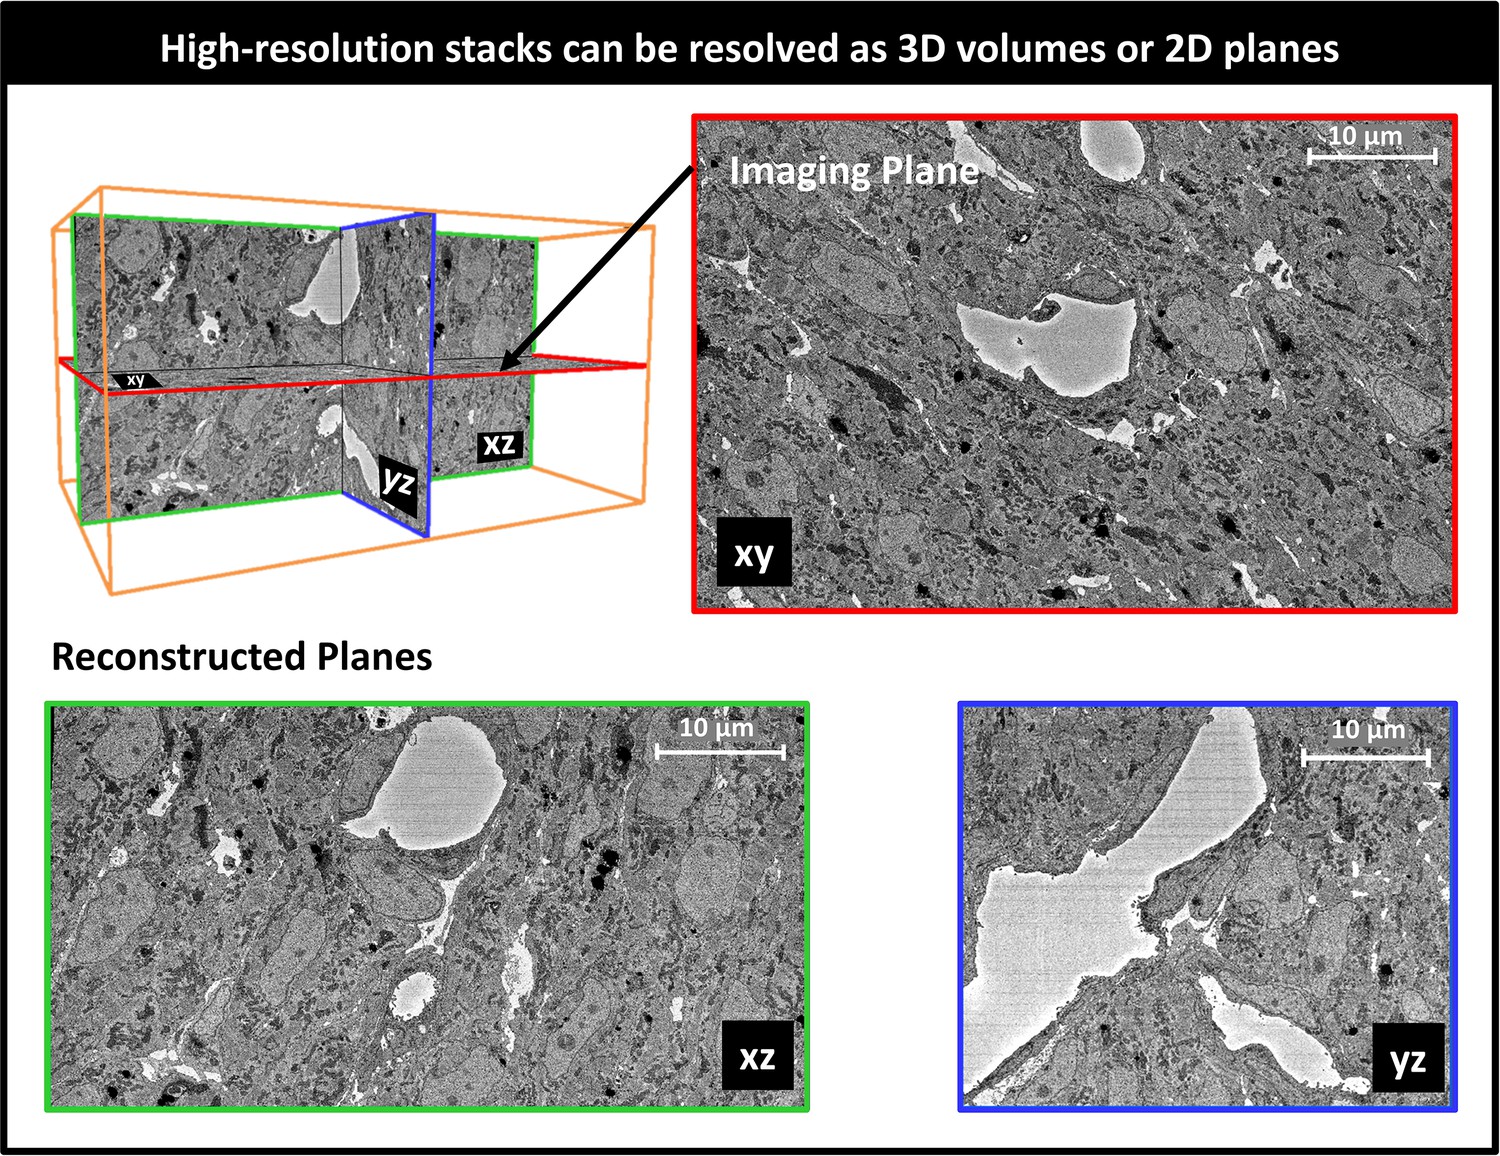
Example 3D reconstruction of SBF-SEM image stack acquired from the control heart.
xy is the imaging plane, acquired at 10 nm lateral resolution. z is the depth direction, with xy images acquired every 40 nm. xz and yz are reconstructed perpendicular planes that show the continuity of the ultrastructural features along the z-axis (depth), and thus alignment of the acquired images. Scale bars = 10 µm.
Figure 7

Segmented portion of 3D SBF-SEM heart tissue images.
The pictures illustrate the level of detailed ultrastructural architecture that can be obtained from 3D SBF-SEM images. (A and B) show the same 10 × 10 × 10 µm3 of the LV developing chick heart tissue, TOF heart, from different points of view. Arrows indicate coordinate system, and its rotation. Organelle segmentation is color-coded. Red: nuclei; Blue: mitochondria; Green: myofibrils. Scale bars = 1 µm.
Figure 8

Segmentation and quantification of SBF-SEM images.
Selected images (n ≥ 10) from the SBF-SEM image stacks acquired at regions A and B were segmented and quantified. (A) Percentage of myocardial cells occupied by nuclei, myofibrils and mitochondria in regions A and B of the control (CON) heart and TOF heart. (B) Percentage of the images occupied by extracellular space. (C, D) 3D views of the segmented extracellular space in (C) control (CON) heart, region A; and (D) TOF heart, region A. The semitransparent 3D views show increased extracellular space for the TOF A sample, as quantified in (B). Detailed of calculations presented in (A) and (B) are included as supplementary material (Figure 8—source data 1).
-
Figure 8—source data 1
Detailed calculations from segmented SBF-SEM images leading to Figure 8A and B plots.
- https://cdn.elifesciences.org/articles/58138/elife-58138-fig8-data1-v2.xlsx
Figure 9
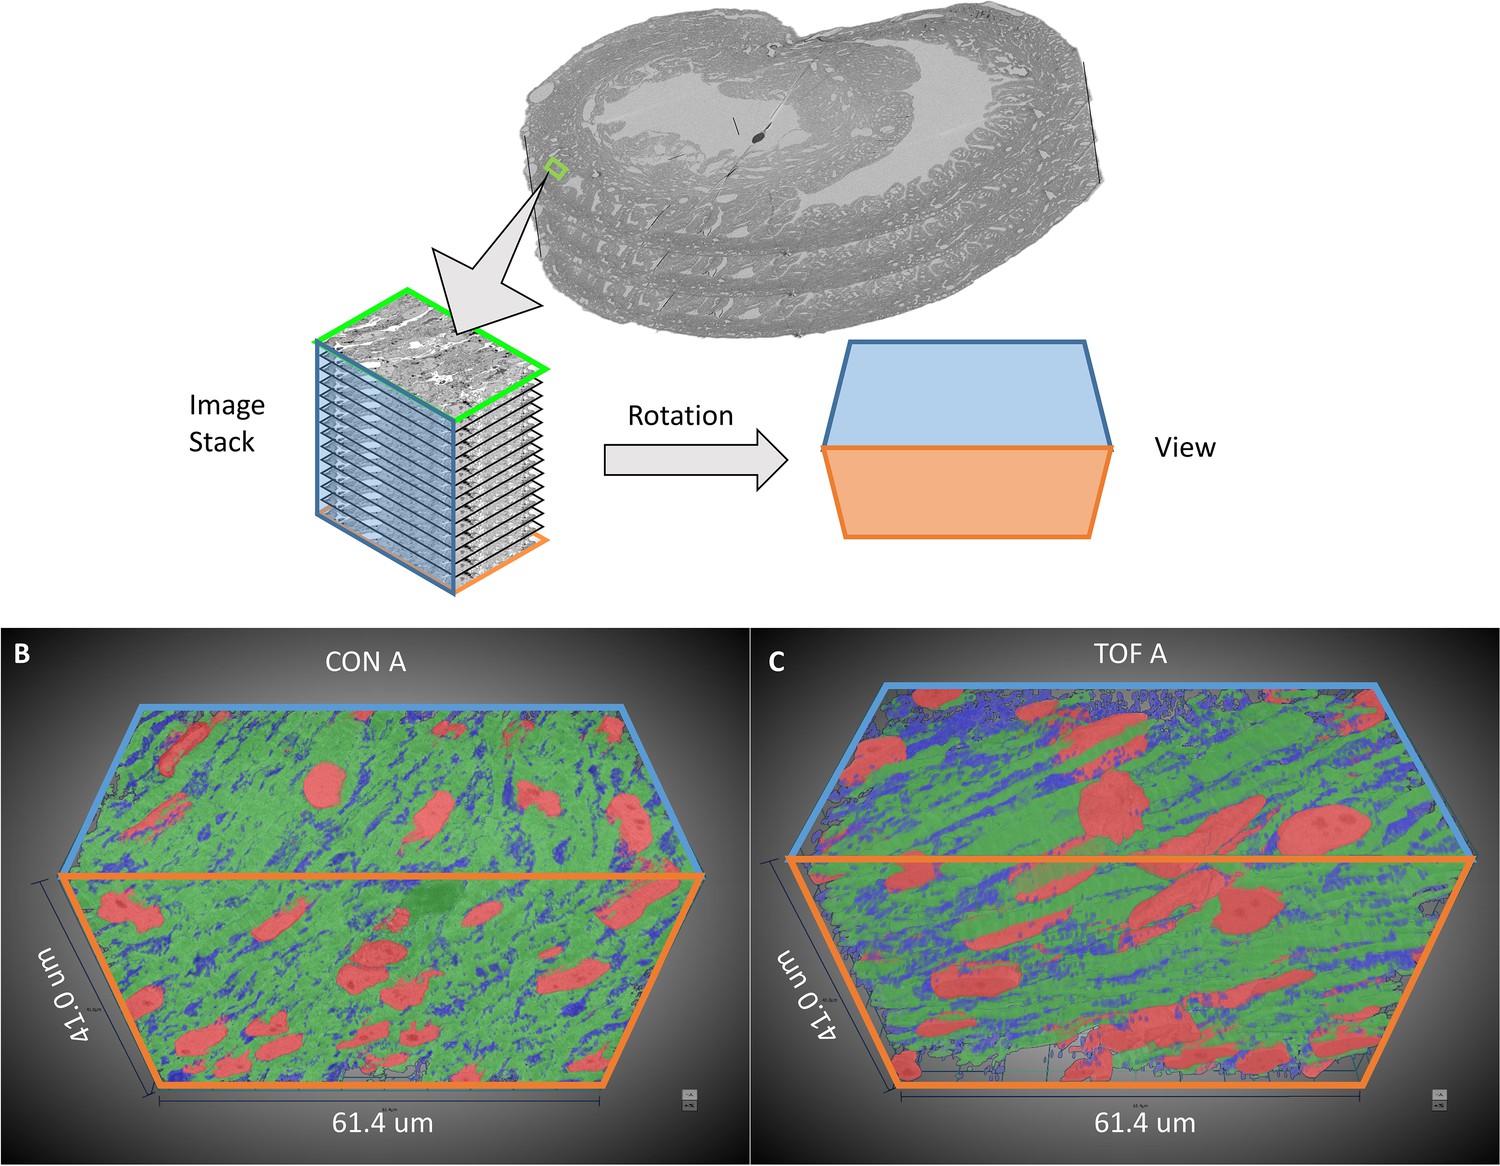
3D visualization of SBF-SEM segmentations.
(A) Sketch of image dataset acquisition, showing relative orientations. Green plane is the top image, orange plane is the bottom image (last image acquired), blue plane is approximately parallel to the heart wall. The sketch of the view shows the orientation of the planes as shown in (B) control (CON) heart and (C) TOF heart. Organelle segmentation is color-coded. Red: nuclei; Blue: mitochondria; Green: myofibrils.
Figure 10
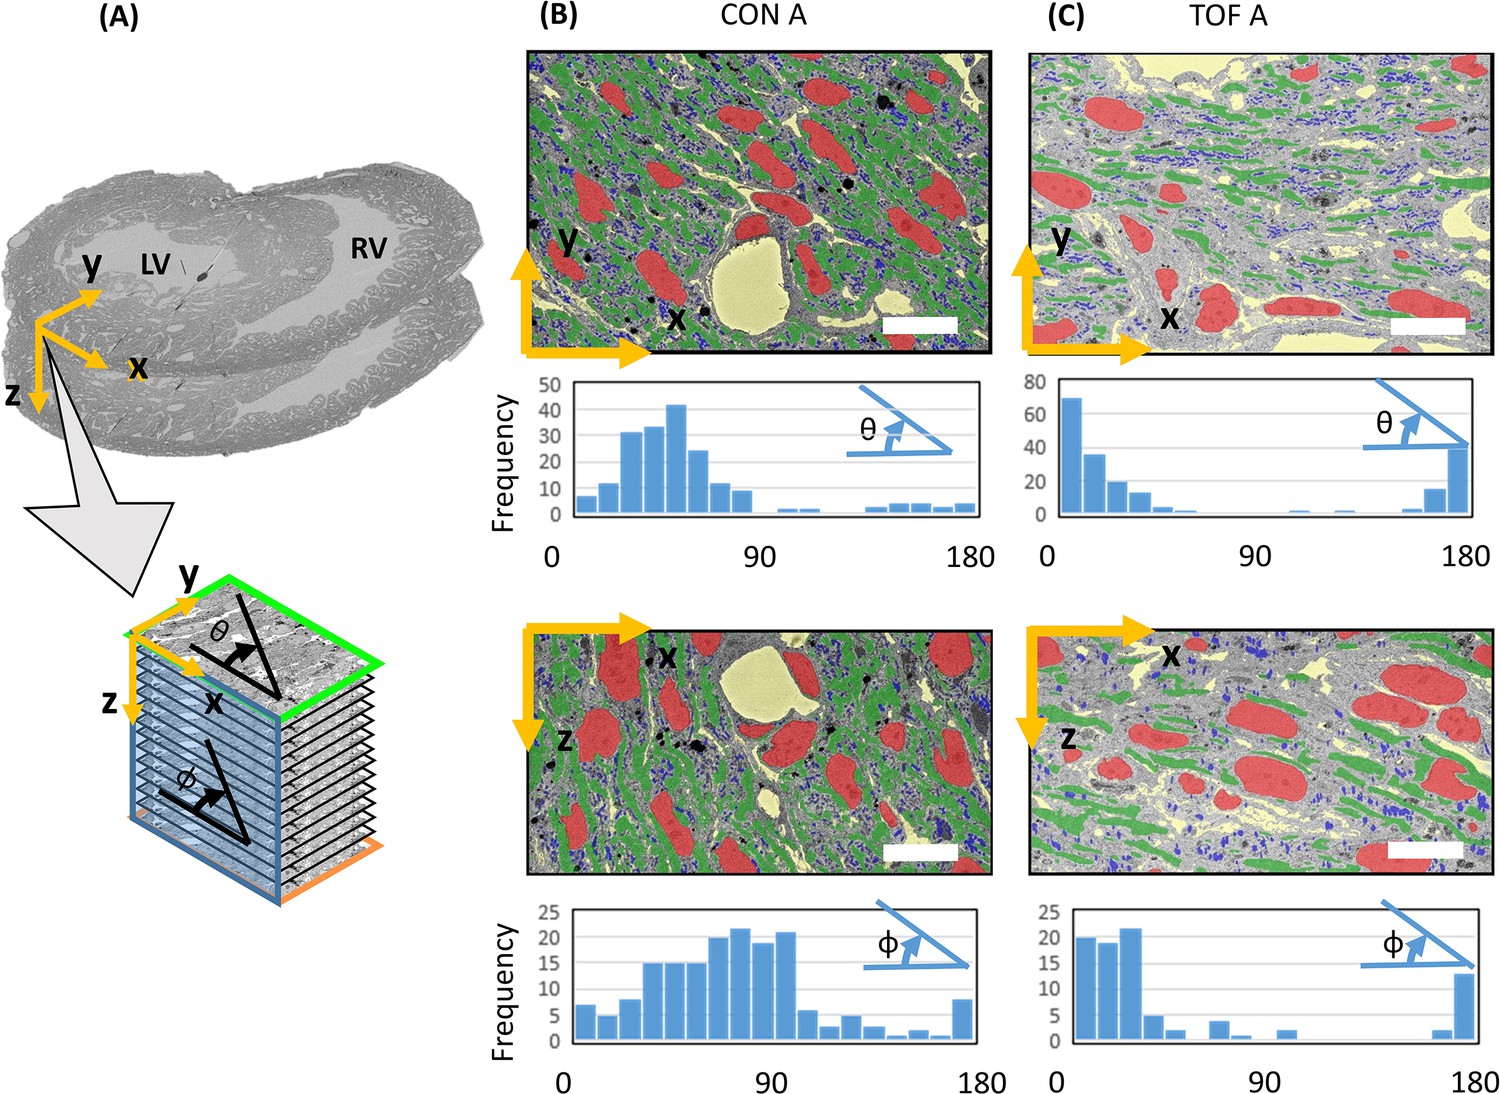
Myofibril transmural and elliptical angle quantification.
(A) Sketch showing approximate position of the SBF-SEM imaged planes (x-y planes), and image stacks (spanning the z-direction depth) with respect to the heart morphology. For the imaged transmural planes, the y-direction approximately corresponds to the radial direction in the left ventricle (LV), and the x-direction is approximately parallel to the LV wall boundary (circumferential direction). The stack depth direction (z-direction) corresponds to the heart longitudinal direction. Myofibril orientation angles were quantified for the x-y and x-z planes: the transmural angle θ is the myofibril angle in the x-y plane, with respect to the circumferential (x) direction (wall direction); the elliptical angle Φ is the orientation angle in the x-z plane with respect to the circumferential (x) direction. Segmentations of organelles on the x-y and x-z planes, together with frequency versus angle histograms, are shown in (B) for the control heart, ROI A (CON A); and (C) for the TOF heart, ROI A (TOF A). Each bar in the histogram represents a 10° range, hence there are 18 bars to represent 0° to 180° angles. Organelle segmentation is color-coded. Red: nuclei; Blue: mitochondria; Green: myofibrils. The extracellular matrix is shown in yellow. Scale bars: 10 µm. The details of the angle calculations are included as supplementary files (Figure 10—source datas 1–4).
-
Figure 10—source data 1
Details of transmural angle θ calculation from SBF-SEM images of the control heart CON A sample.
- https://cdn.elifesciences.org/articles/58138/elife-58138-fig10-data1-v2.xlsx
-
Figure 10—source data 2
Details of elliptical angle Φ calculation from SBF-SEM images of the control heart CON A sample.
- https://cdn.elifesciences.org/articles/58138/elife-58138-fig10-data2-v2.xlsx
-
Figure 10—source data 3
Details of transmural angle θ calculation from SBF-SEM images of the TOF A heart sample.
- https://cdn.elifesciences.org/articles/58138/elife-58138-fig10-data3-v2.xlsx
-
Figure 10—source data 4
Details of elliptical angle Φ calculation from SBF-SEM images of the TOF A heart sample.
- https://cdn.elifesciences.org/articles/58138/elife-58138-fig10-data4-v2.xlsx
Tables
Key resources table
| Reagent type (species) or resource | Designation | Source or reference | Identifiers | Additional information |
|---|---|---|---|---|
| Chemical compound, drug | Sodium Cacodylate | EMS | Cat#RT 12300 | RT 12300 0.1M; pH 7.4 |
| Chemical compound, drug | Tannic acid | EMS | Cat#21700 | 0.1% (w/v) |
| Chemical compound, drug | Osmium Tetroxide, OsO4 | Ted Pella | Cat#18463 | 2% (v/v) final concentration |
| Chemical compound, drug | Potassium Ferricyanide, K₃[Fe(CN)₆] | EMS | Cat#20150 | 1.5% (w/v) |
| Chemical compound, drug | Thiocarbohydrazide, TCH | Aldrich | Cat#223220 | 0.1% (w/v) |
| Chemical compound, drug | Uranyl acetate | Ted Pella | Cat# 19481 | 1% (w/v) working solution |
| Chemical compound, drug | Lead nitrate | EMS | Cat#17900 | Used to prepare Lead Apartate |
| Chemical compound, drug | Aspartic acid | Aldrich | Cat#11195 | Used to prepare Lead Apartate |
| Chemical compound, drug | Acetone | EMS | Cat#10015 | Glass Distilled |
| Chemical compound, drug | Epoxy resin | EMS | Cat# RT 14900 Epon 812 | |
| Software, algorithm | Amira 6.0 | FEI, now ThermoFisher | ||
| Software, algorithm | Dragonfly 4.1 | Object Research Systems |
Additional files
Download links
A two-part list of links to download the article, or parts of the article, in various formats.
Downloads (link to download the article as PDF)
Open citations (links to open the citations from this article in various online reference manager services)
Cite this article (links to download the citations from this article in formats compatible with various reference manager tools)
Multiscale cardiac imaging spanning the whole heart and its internal cellular architecture in a small animal model
eLife 9:e58138.
https://doi.org/10.7554/eLife.58138


