Spectral clustering of risk score trajectories stratifies sepsis patients by clinical outcome and interventions received
- Institute for Computational Medicine, The Johns Hopkins University, United States
- Department of Biomedical Engineering, The Johns Hopkins University School of Medicine & Whiting School of Engineering, United States
- Department of Anesthesiology and Critical Care Medicine, The Johns Hopkins University School of Medicine, United States
- Department of Pediatrics, The Johns Hopkins University School of Medicine, United States
Figures
Figure 1 with 3 supplements
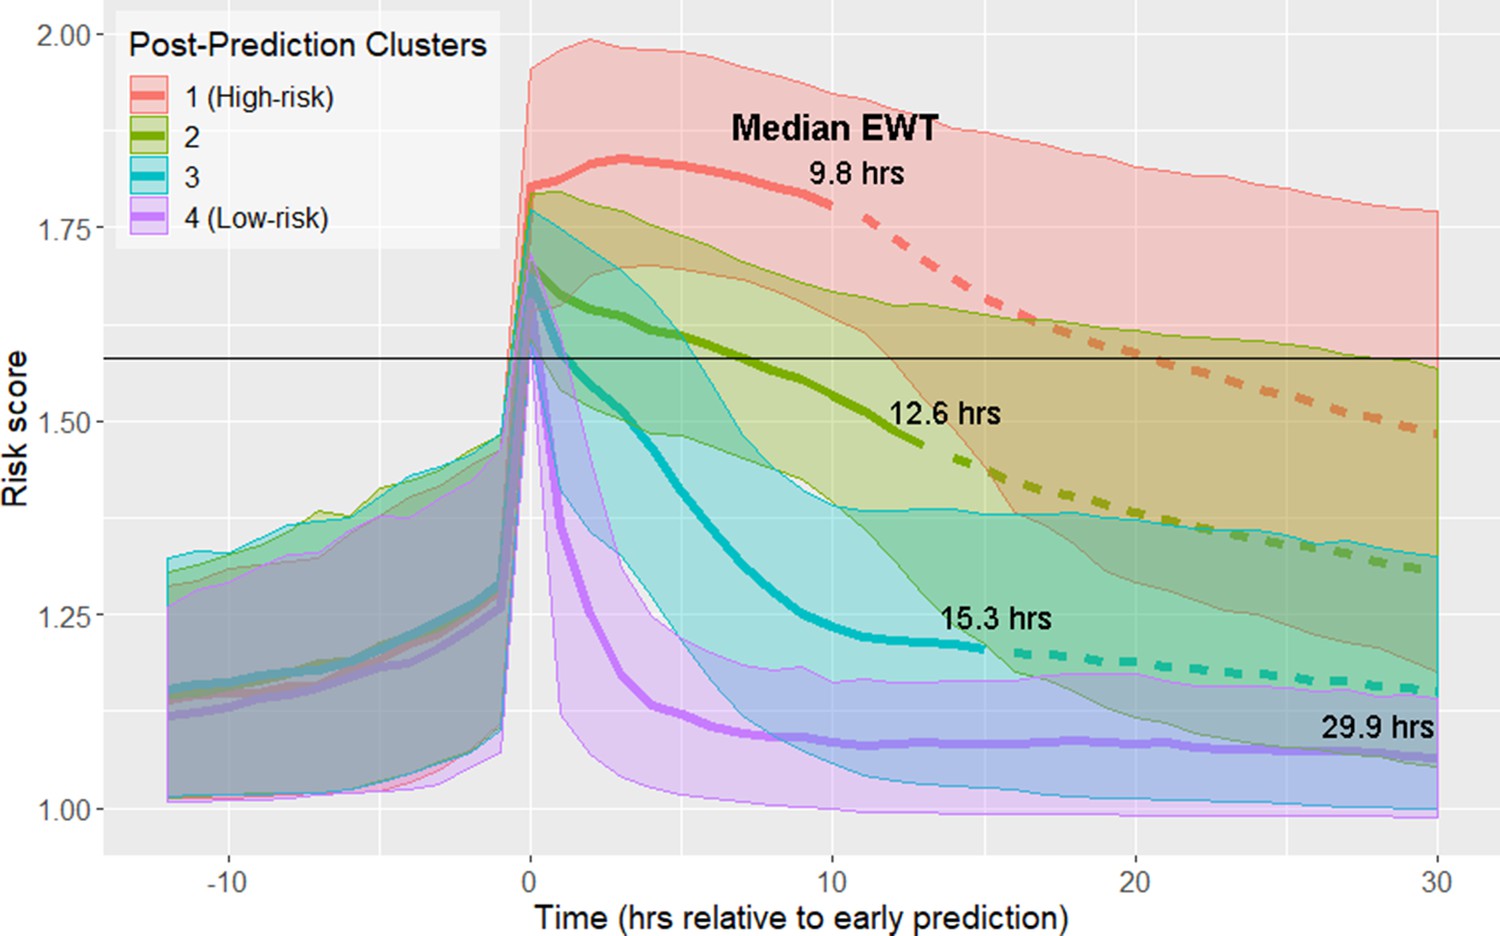
Risk score clusters obtained using spectral clustering on the 12 hr following time of early prediction.
Time 0 represents td, time of early prediction. Bold solid and dashed lines indicate mean risk within each cluster. Each solid line becomes a dashed line at the cluster median EWT (indicated on figure). Shaded areas indicate one standard deviation from the mean. Black horizontal line indicates risk score threshold for early prediction.
Figure 1—figure supplement 1
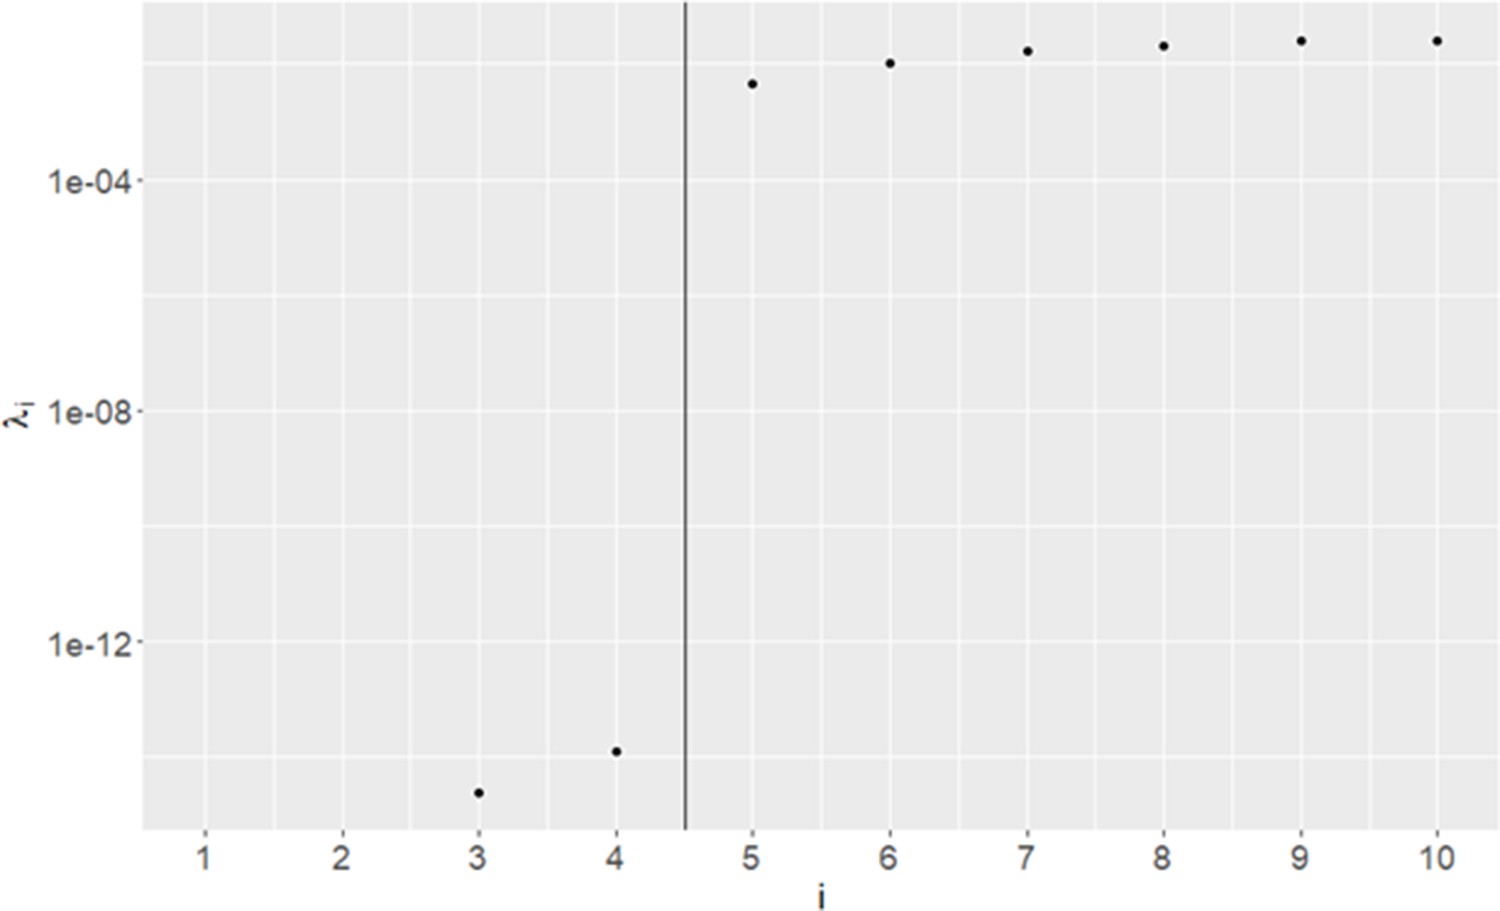
Eigenvalues of Graph Laplacian of post-early prediction risk trajectories.
Figure 1—figure supplement 2
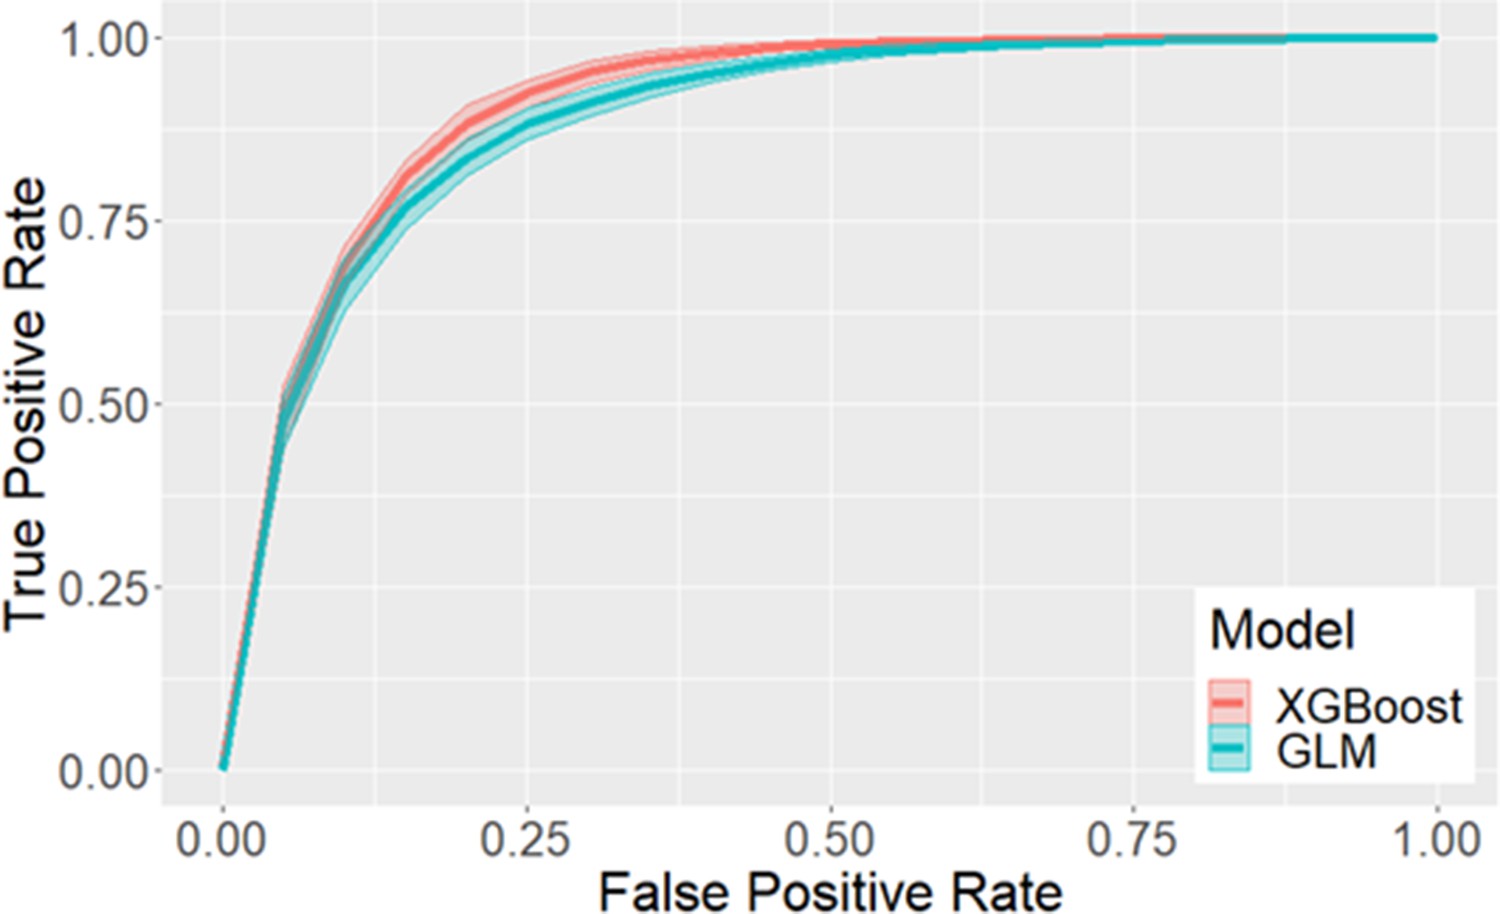
Receiver operating characteristic curves for early prediction in eICU.
95% confidence intervals, estimated using 100 iterations of bootstrap, are indicated by the shaded area. Using XGBoost, we obtain an average performance of 0.912 AUC, 82.5% sensitivity, 84.1% specificity, a median early warning time of 10.3 hr, and 34.0% positive predictive value. Using GLM, we obtain an average performance of 0.894 AUC, 82.7% sensitivity, 80.8% specificity, a median early warning time of 10.5 hr, and 29.9% positive predictive value.
Figure 1—figure supplement 3
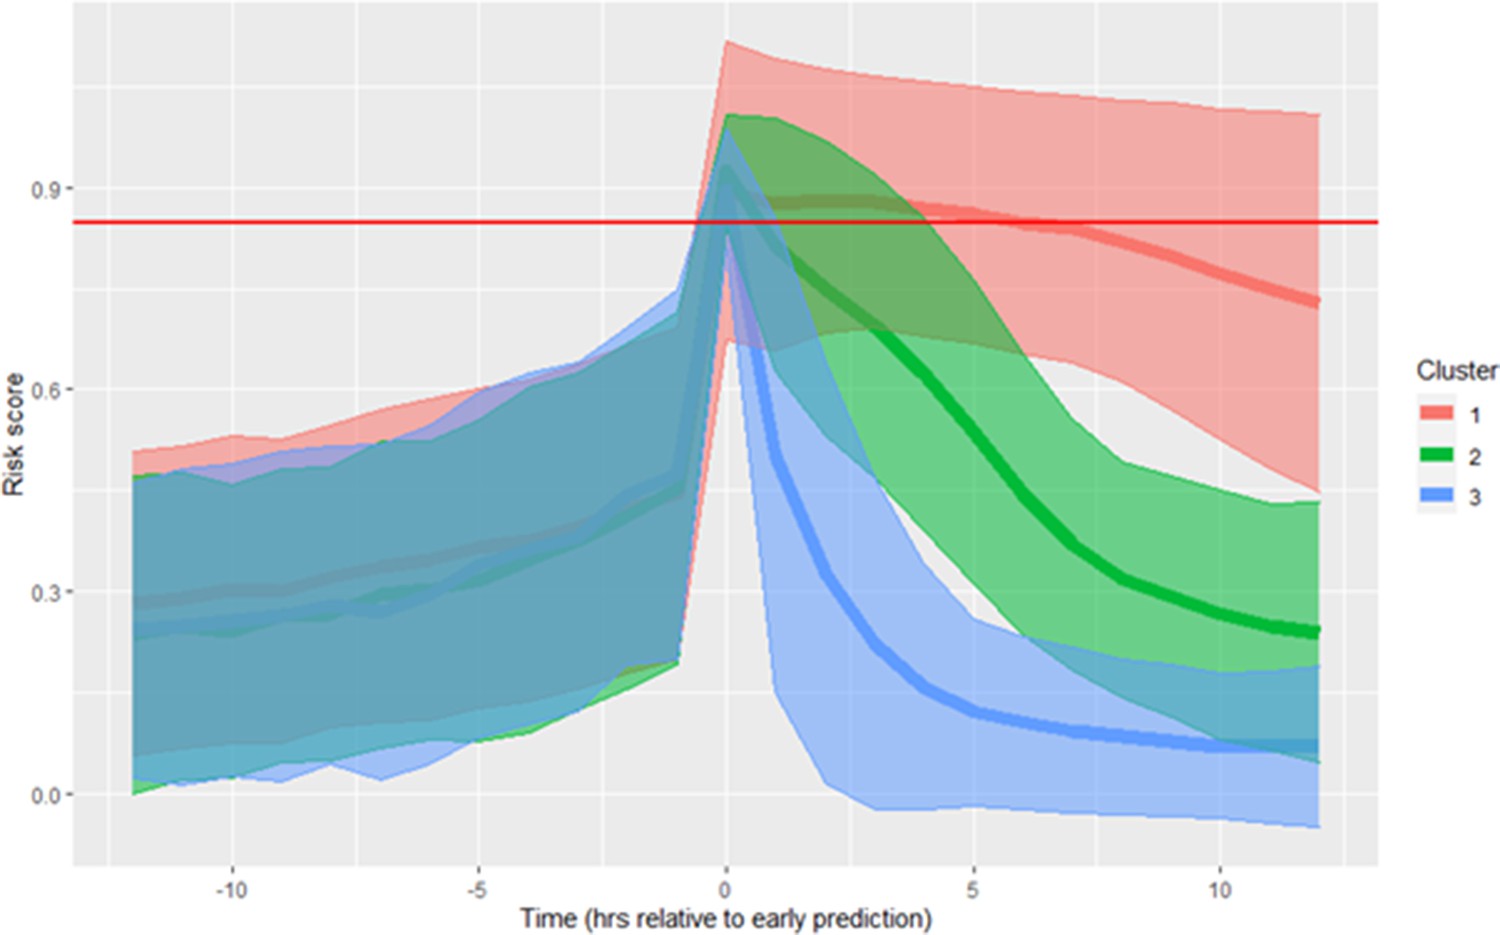
Risk score clusters obtained using spectral clustering on the 12 hr following time of early prediction in the MIMIC-III database.
Time 0 represents td, time of early prediction. Shaded areas indicate one standard deviation from the mean. The red horizontal line indicates risk score threshold for early prediction. Clusters are numbered in descending order of septic shock prevalence.
Figure 2 with 3 supplements
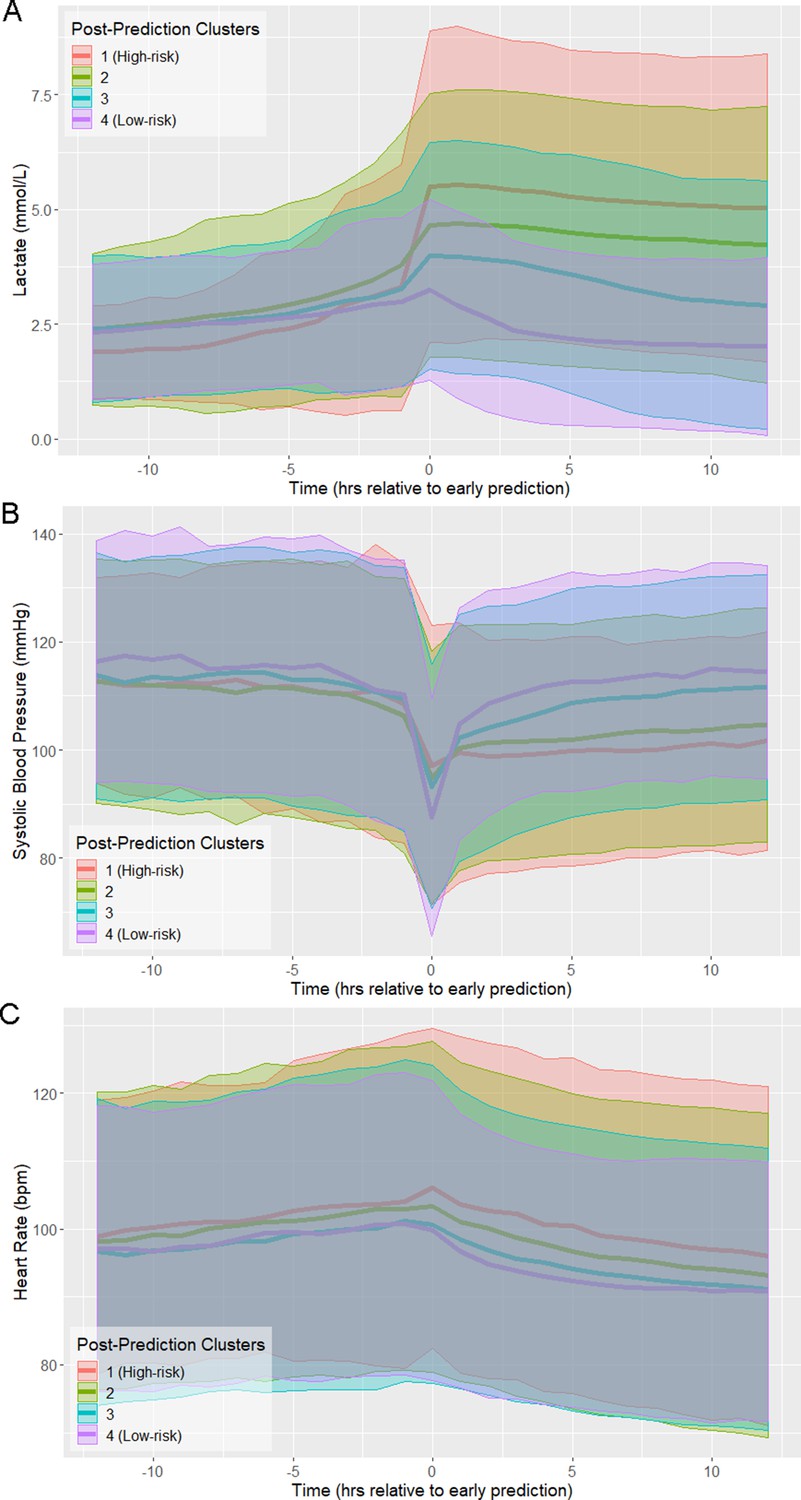
Physiological trajectories in (A) Lactate, (B) systolic blood pressure, and (C) heart rate for the 4 clusters of patients illustrated in Figure 1.
Solid lines indicate the mean value of each feature within each cluster. Shaded areas indicate an interval of 1 standard deviation from the mean.
Figure 2—figure supplement 1
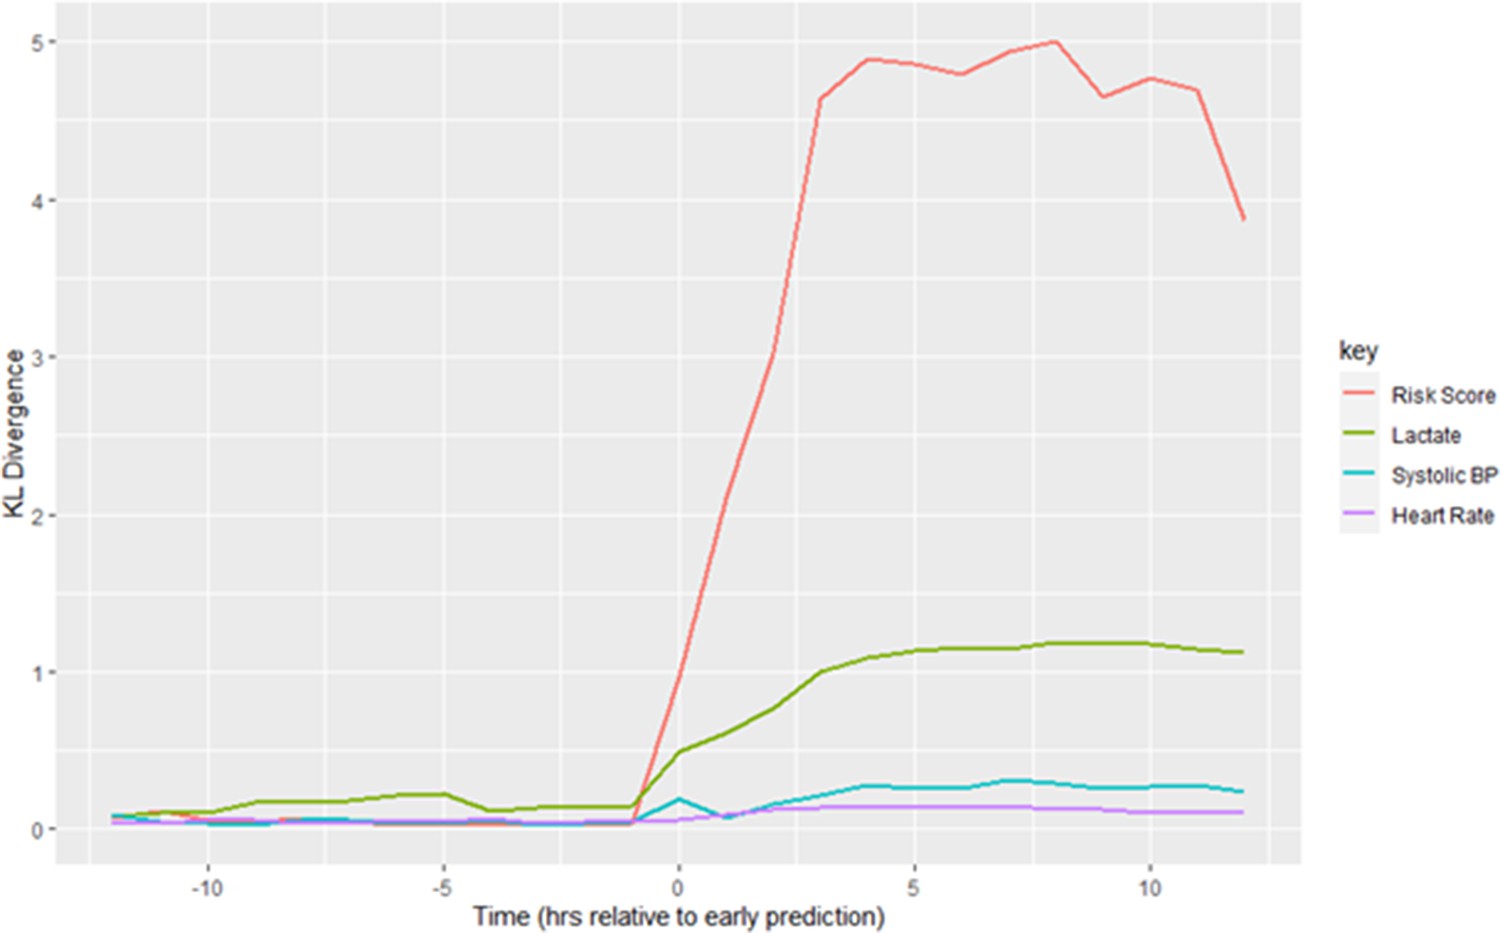
Kullback-Leibler Divergence of Risk Score and physiological variables between the highest-risk and lowest-risk clusters in the window surrounding early prediction.
Figure 2—figure supplement 2
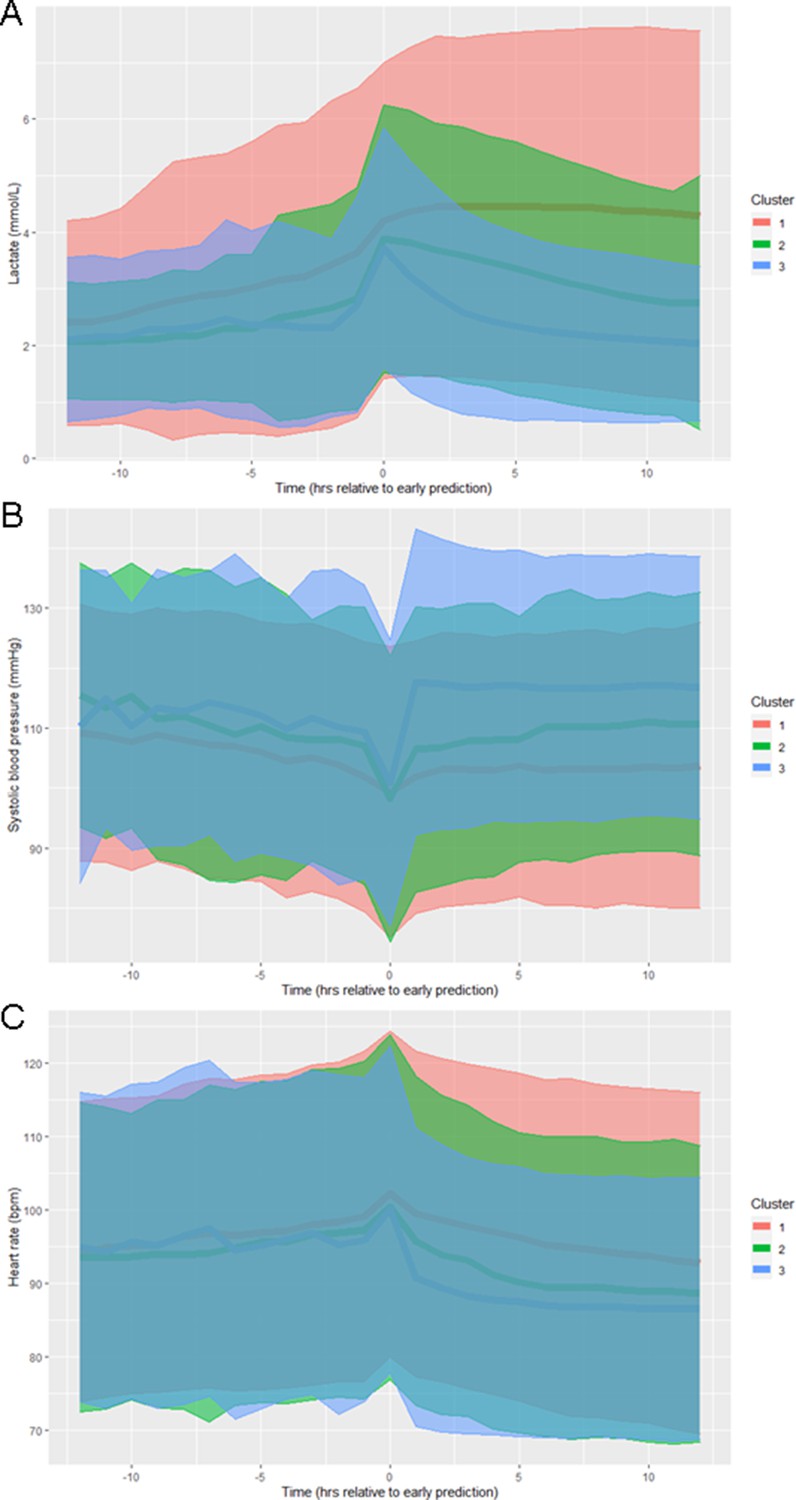
Physiological trajectories in (A) Lactate, (B) systolic blood pressure, and (C) heart rate for the 3 clusters of patients illustrated in Figure 1—figure supplement 3 in the MIMIC-III database.
Solid lines indicate the mean value of each feature within each cluster. Shaded areas indicate an interval of 1 standard deviation from the mean.
Figure 2—figure supplement 3
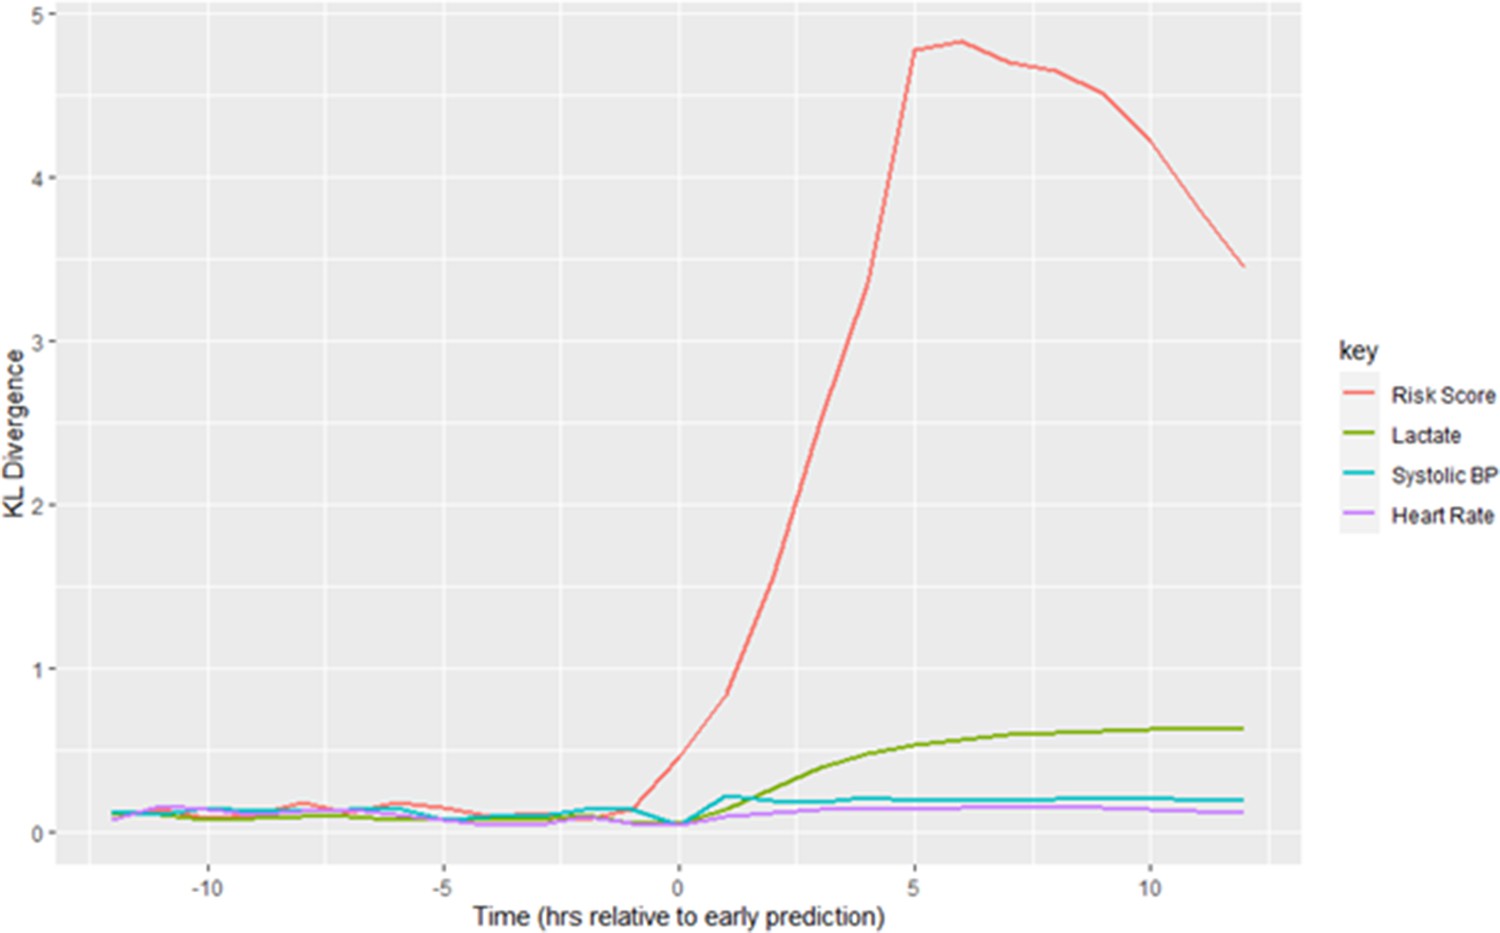
Kullback-Leibler Divergence of Risk Score and physiological variables between the highest-risk and lowest-risk clusters in the window surrounding time of early prediction in the MIMIC-III database.
Figure 3
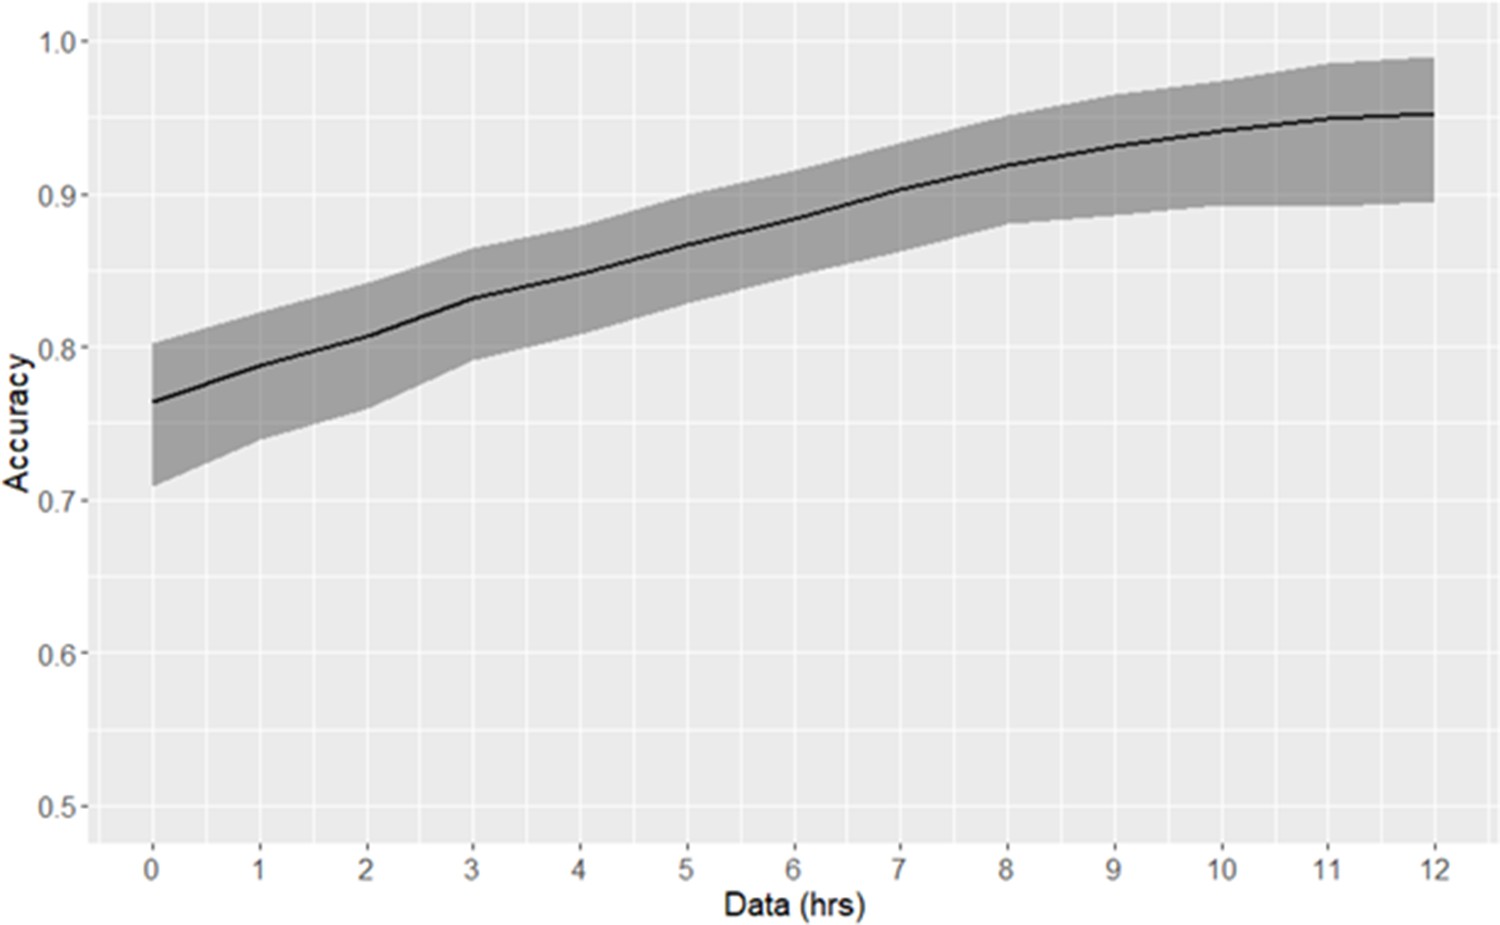
Risk trajectory classification accuracy.
The duration of data used consequent to early prediction is specified by the x-axis. 90% confidence intervals, as empirically estimated using bootstrap, are indicated by the shaded area.
Figure 4 with 1 supplement
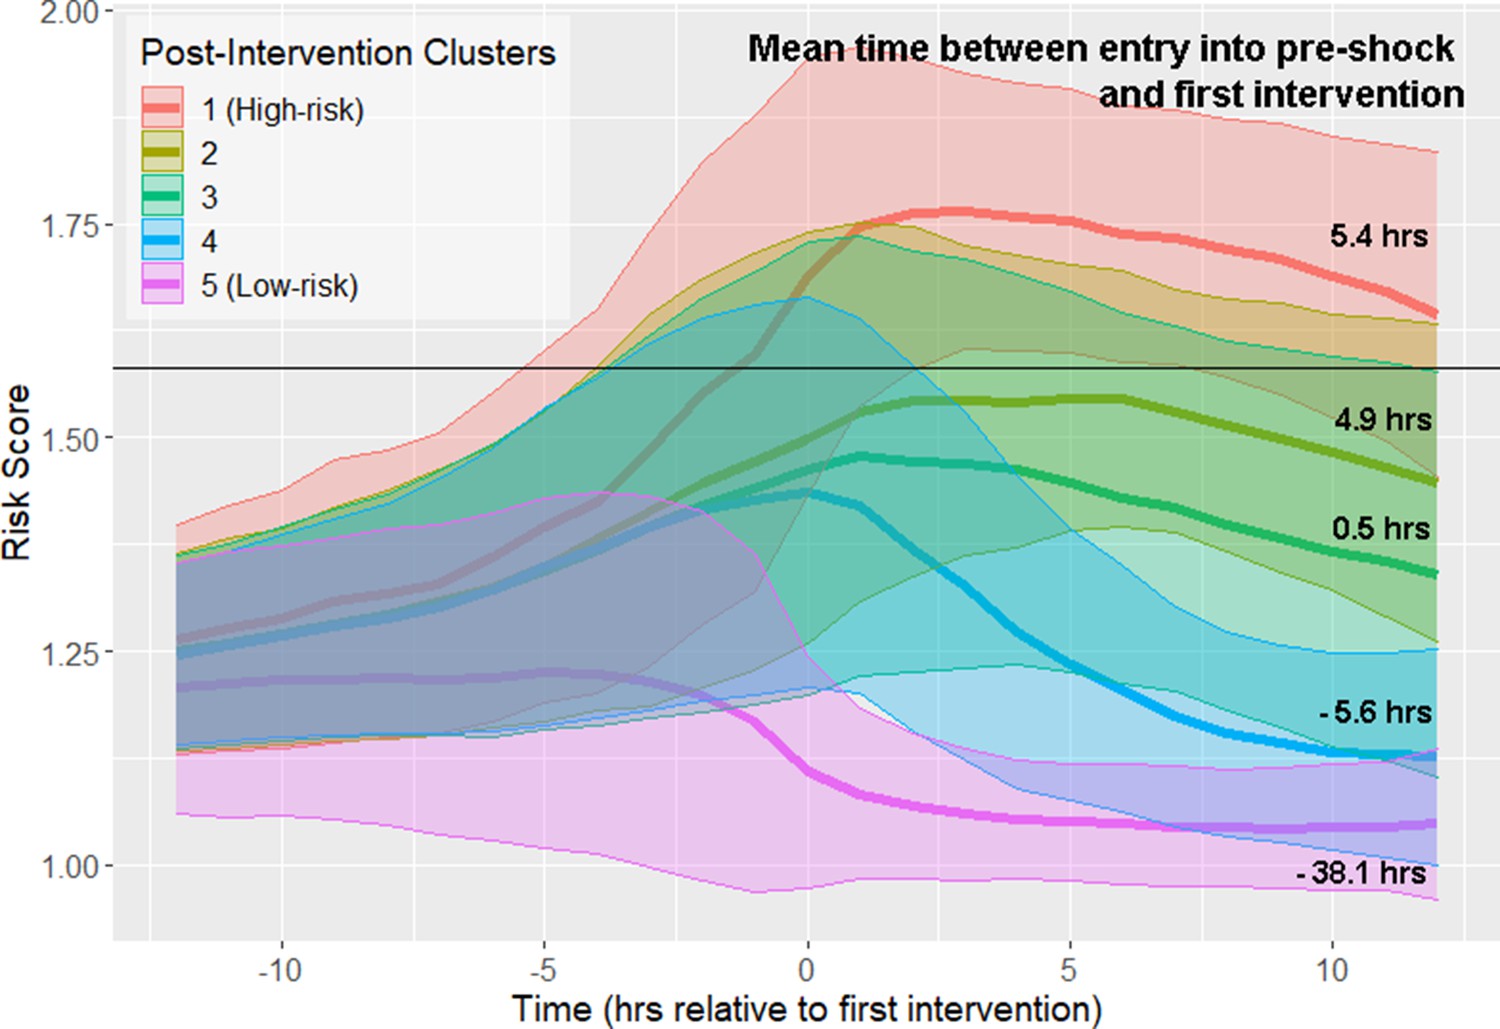
Risk score trajectories following the first instance of intervention.
Threshold for early prediction is indicated by the horizontal line. Bold lines indicate mean risk within each cluster. Shaded areas indicate one standard deviation from the mean. The mean time within each cluster between entry into the pre-shock state and the time of first intervention is indicated on the right-hand side of the figure. A positive number indicates that the time of first intervention is after the time of threshold crossing, whereas a negative number indicates that the first intervention precedes entry into pre-shock.
Figure 4—figure supplement 1
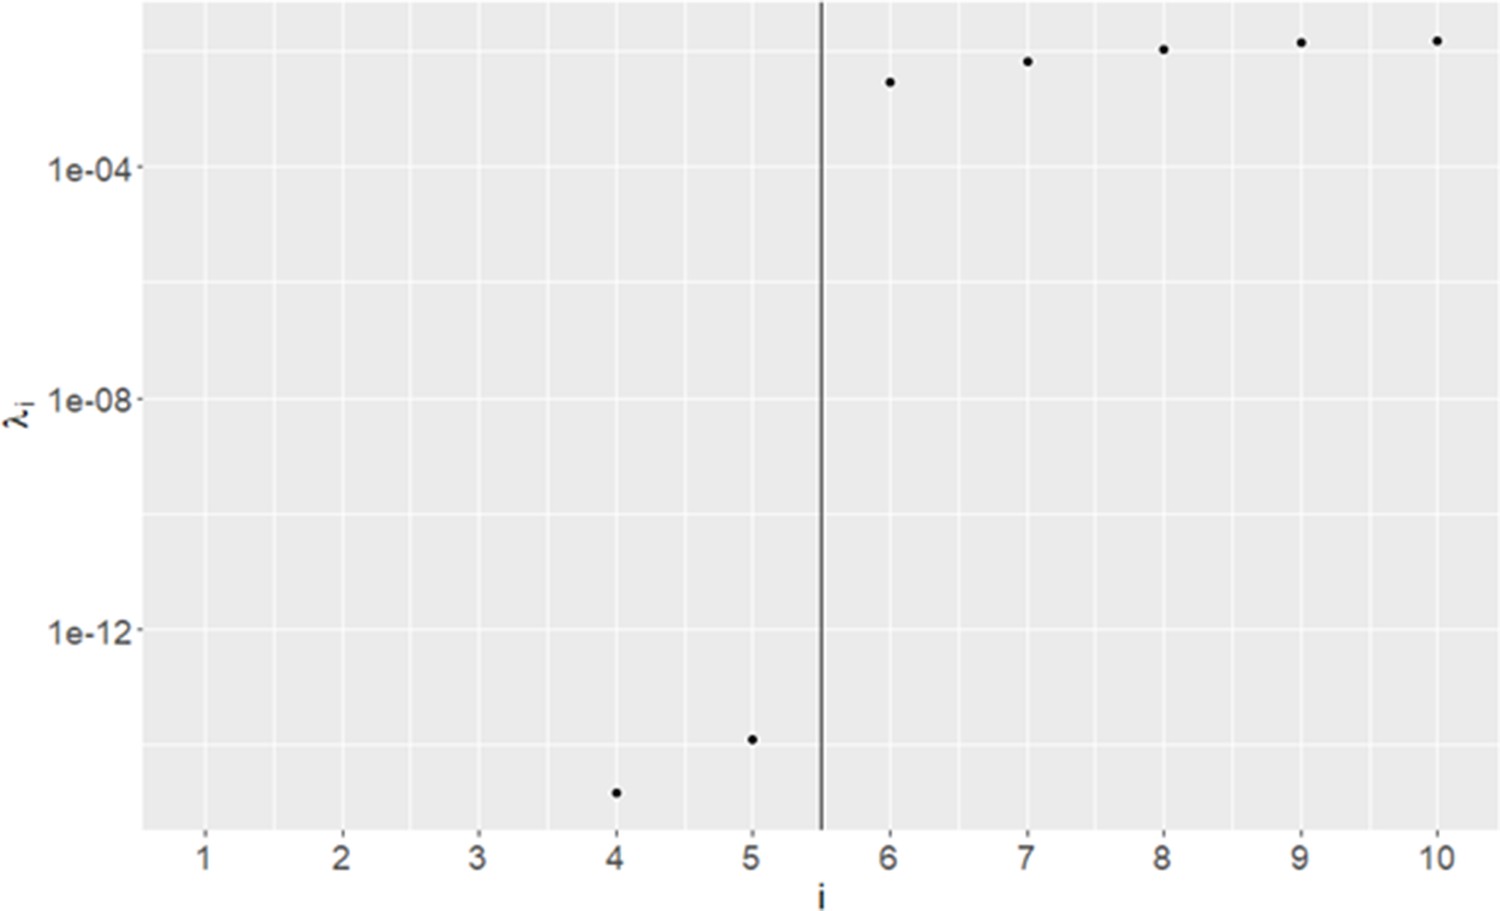
Eigenvalues of Graph Laplacian of post-intervention risk trajectories.
Figure 5
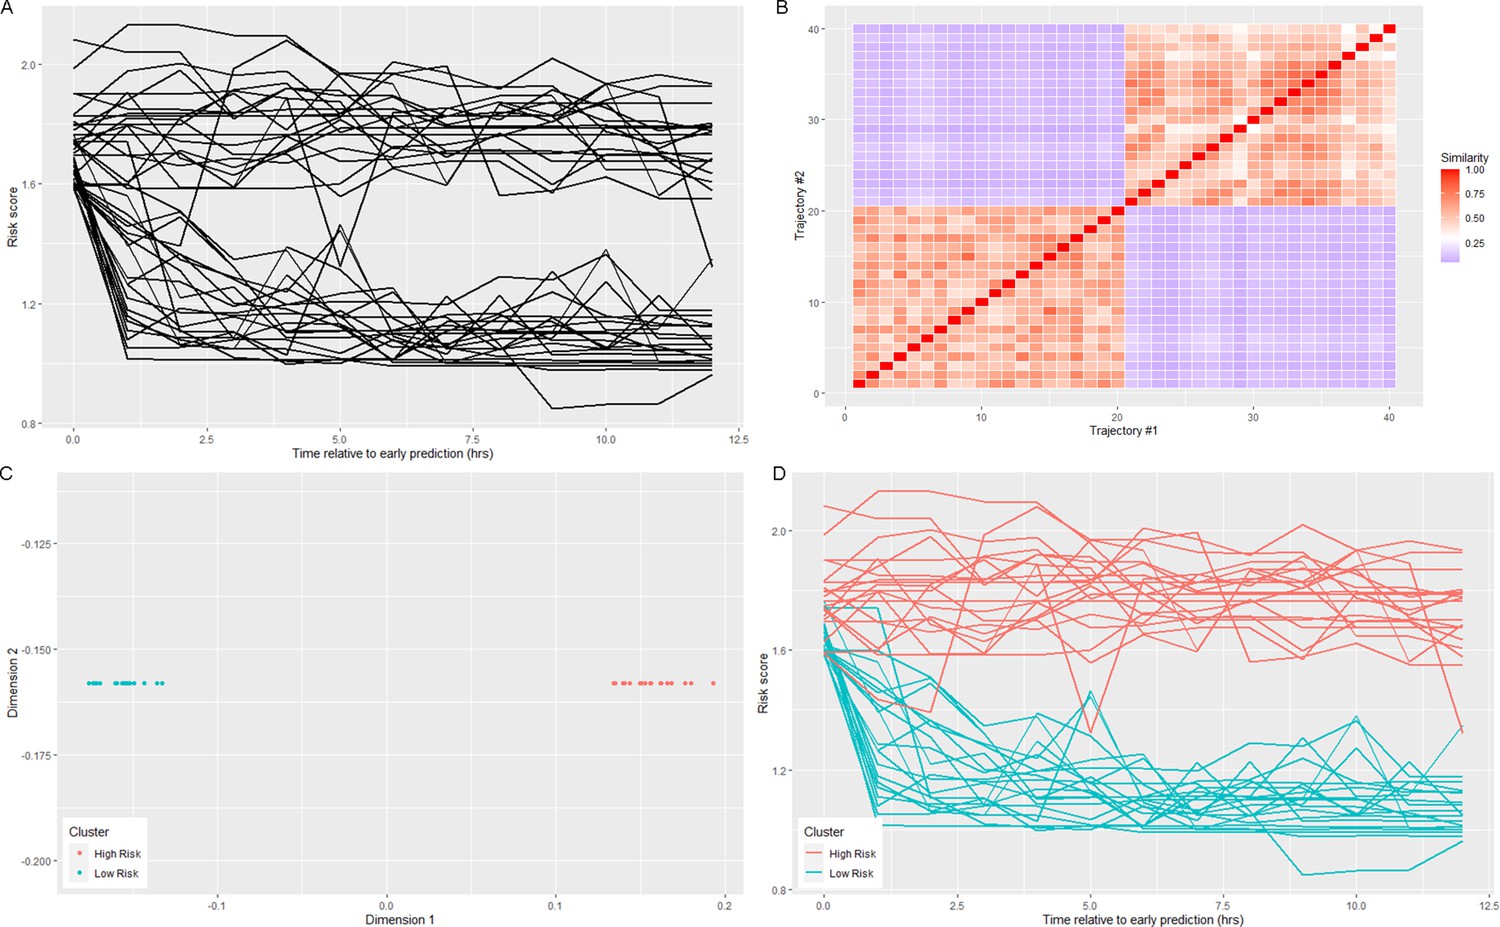
Visualization of spectral clustering of risk score trajectories, for a simple example with two clusters.
Risk score trajectories (A) are clustered by using distances between trajectories (B) to project the data into a space in which they are easily separable (C). K-means clustering of the data in this new space yields clusters of risk scores (D).
Tables
Table 1
Clusters in Figure 1 stratify by septic shock prevalence, mortality, and time to septic shock onset (EWT).
Clusters are numbered in descending order of septic shock prevalence.
| Post-Prediction cluster | Size | % Septic Shock | % Mortality | Median time to shock onset (EWT) |
|---|---|---|---|---|
| 1 (High-risk) | 1558 (17.2%) | 76.5% | 43% | 9.8 hr |
| 2 | 2672 (29.5%) | 46.3% | 34% | 12.6 hr |
| 3 | 3538 (39.0%) | 26.0% | 22% | 15.3 hr |
| 4 (Low-risk) | 1305 (14.4%) | 10.4% | 18% | 29.9 hr |
Table 2
Proportion of patients in each of the four clusters who have received adequate fluid resuscitation or treatment with vasopressors by time of early prediction.
| Cluster | % Shock patients adequately fluid resuscitated | % Shock patients treated with vasopressors |
|---|---|---|
| 1 (High-risk) | 7.8% | 14.3% |
| 2 | 9.8% | 22.2% |
| 3 | 13.8% | 29.3% |
| 4 (Low-risk) | 21.3% | 50.7% |
Table 3
Mean values of features which are significantly different at a 99% confidence level between the post-prediction high-risk and low-risk clusters at the time point 1 hr preceding (A) first instance of adequate fluid resuscitation or (B) first instance of vasopressor administration.
| A | |||||
|---|---|---|---|---|---|
| High-risk | Low-risk | High-risk | Low-risk | ||
| HR (bpm) | 99.4 | 96.0 | BUN (mg/dL) | 39.8 | 33.2 |
| SBP (mmHg) | 107.2 | 112.4 | pH | 7.30 | 7.33 |
| DBP (mmHg) | 59.3 | 62.4 | PaCO2 (mmHg) | 40.5 | 41.9 |
| MBP (mmHg) | 72.5 | 75.1 | Urine (mL/hr) | 5.6 | 3.2 |
| Resp (bpm) | 22.7 | 21.6 | Resp SOFA | 1.1 | 0.6 |
| FiO2 | 66.2% | 61.2% | Nervous SOFA | 0.5 | 0.3 |
| GCS | 12.1 | 12.8 | Cardio SOFA | 0.4 | 0.1 |
| Platelets (k/μL) | 211.0 | 232.1 | Liver SOFA | 0.1 | 0.0 |
| Creatinine (mg/dL) | 2.2 | 1.9 | Coag SOFA | 0.5 | 0.3 |
| Lactate (mmol/L) | 4.6 | 2.9 | Kidney SOFA | 1.2 | 0.8 |
| B | |||||
| High-risk | Low-risk | High-risk | Low-risk | ||
| HR (bpm) | 100.4 | 93.3 | pH | 7.28 | 7.30 |
| Resp (bpm) | 23.0 | 21.4 | PaCO2 | 40.8 | 43.2 |
| CVP (mmHg) | 18.2 | 16.4 | Hemoglobin (g/dL) | 11.1 | 10.6 |
| FiO2 | 71.2% | 64.2% | Hematocrit | 33.9% | 32.7% |
Table 4
Clusters in Figure 4 stratify by septic shock prevalence and mortality.
A similar number of patients are in each cluster.
| Post-Intervention cluster | Size | % Septic Shock | % Mortality |
|---|---|---|---|
| 1 (High-risk) | 1506 | 75.9 | 42.2 |
| 2 | 1654 | 52.2 | 33.7 |
| 3 | 1758 | 38.5 | 26.9 |
| 4 | 2257 | 21.1 | 18.2 |
| 5 (Low-risk) | 1711 | 19.2 | 26.4 |
Additional files
-
Supplementary file 1
Supplementary tables.
- https://cdn.elifesciences.org/articles/58142/elife-58142-supp1-v1.docx
-
Transparent reporting form
- https://cdn.elifesciences.org/articles/58142/elife-58142-transrepform-v1.docx
Download links
A two-part list of links to download the article, or parts of the article, in various formats.
Downloads (link to download the article as PDF)
Open citations (links to open the citations from this article in various online reference manager services)
Cite this article (links to download the citations from this article in formats compatible with various reference manager tools)
Spectral clustering of risk score trajectories stratifies sepsis patients by clinical outcome and interventions received
eLife 9:e58142.
https://doi.org/10.7554/eLife.58142


