A transient role of the ciliary gene Inpp5e in controlling direct versus indirect neurogenesis in cortical development
- Centre for Discovery Brain Sciences, University of Edinburgh, United Kingdom
- Simons Initiative for the Developing Brain, University of Edinburgh, United Kingdom
- Sorbonne Université, CNRS UMR7622, INSERM U1156, Institut de Biologie Paris Seine (IBPS) - Developmental Biology Unit, France
- Department of Biochemistry and Biophysics, University of California, San Francisco, United States
- Chan Zuckerberg Biohub, United States
Figures
Figure 1 with 3 supplements
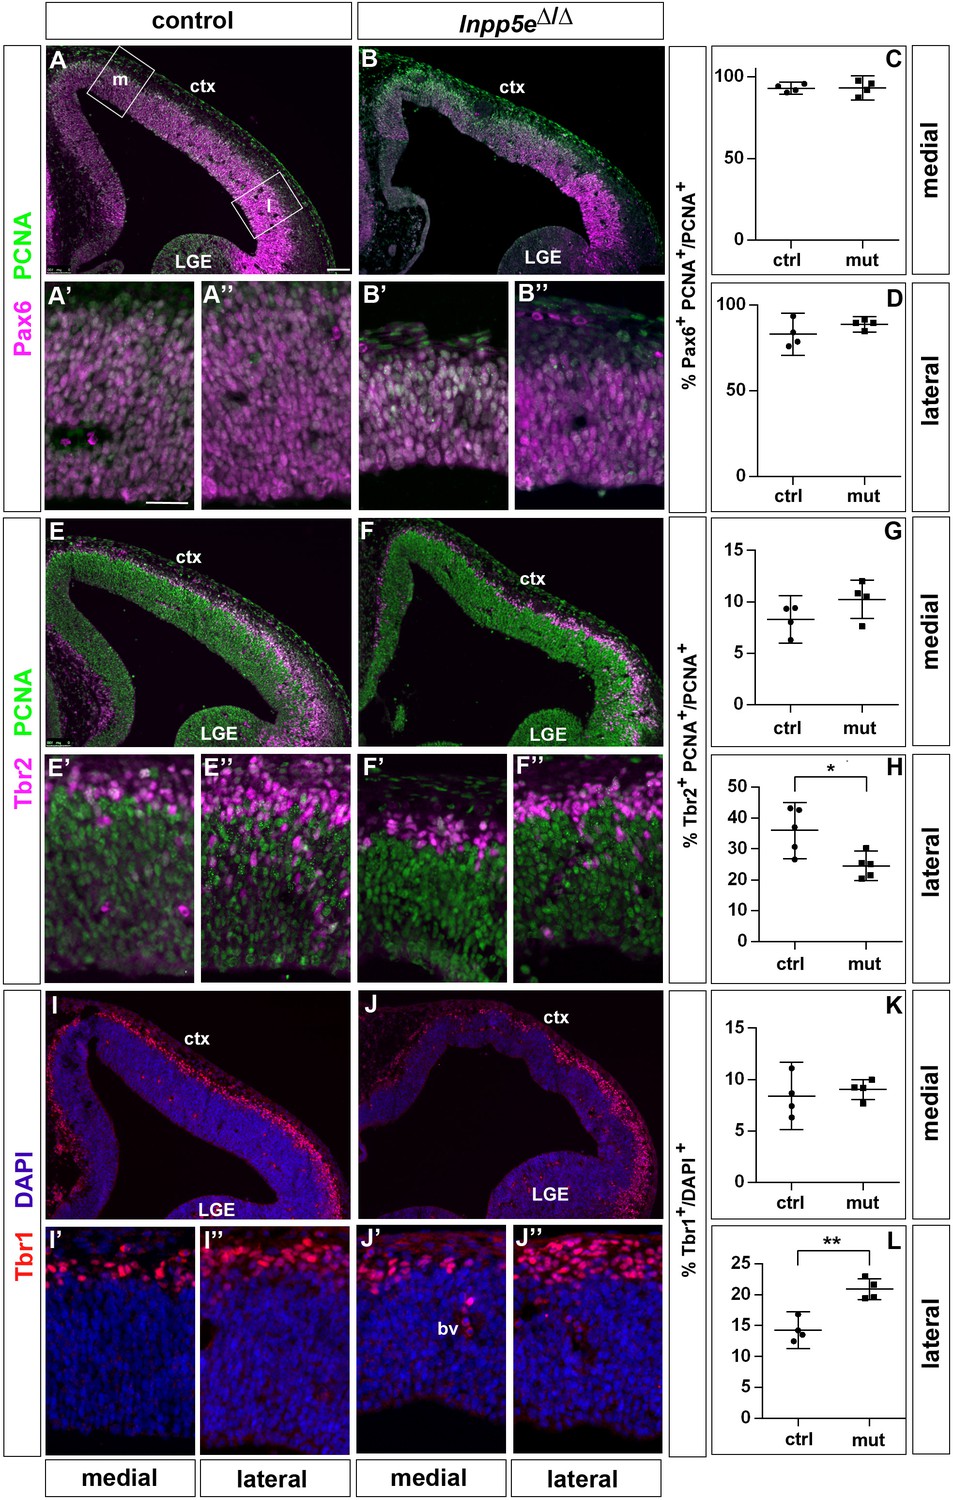
Increased neuron formation in the dorsolateral telencephalon of E12.5 Inpp5Δ/Δ embryos.
(A–D) Pax6/PCNA double immunofluorescence staining revealed the proportion of apical radial glial cells which remained unaltered in the mutant. The boxes in (A) indicate the regions in the medial (m) and lateral (l) telencephalon at which cell counts were performed. (E–H) Reduced proportions of basal progenitors in the lateral telencephalon as revealed by staining for Tbr2 and PCNA. (I–L) Tbr1 immunostaining showed that the proportion of neurons is increased in the lateral telencephalon. (A–J) The insets labelled with ’ and ” are representative magnifications of medial and lateral levels, respectively. All statistical data are presented as means ± 95% confidence intervals (CI); unpaired t-tests; n = 4 except for (H) with n = 5; *p<0.05; **p<0.01. Scale bar: 100 μm (A) and 50 μm (A’). ctx: cortex; LGE: lateral ganglionic eminence.
Figure 1—figure supplement 1
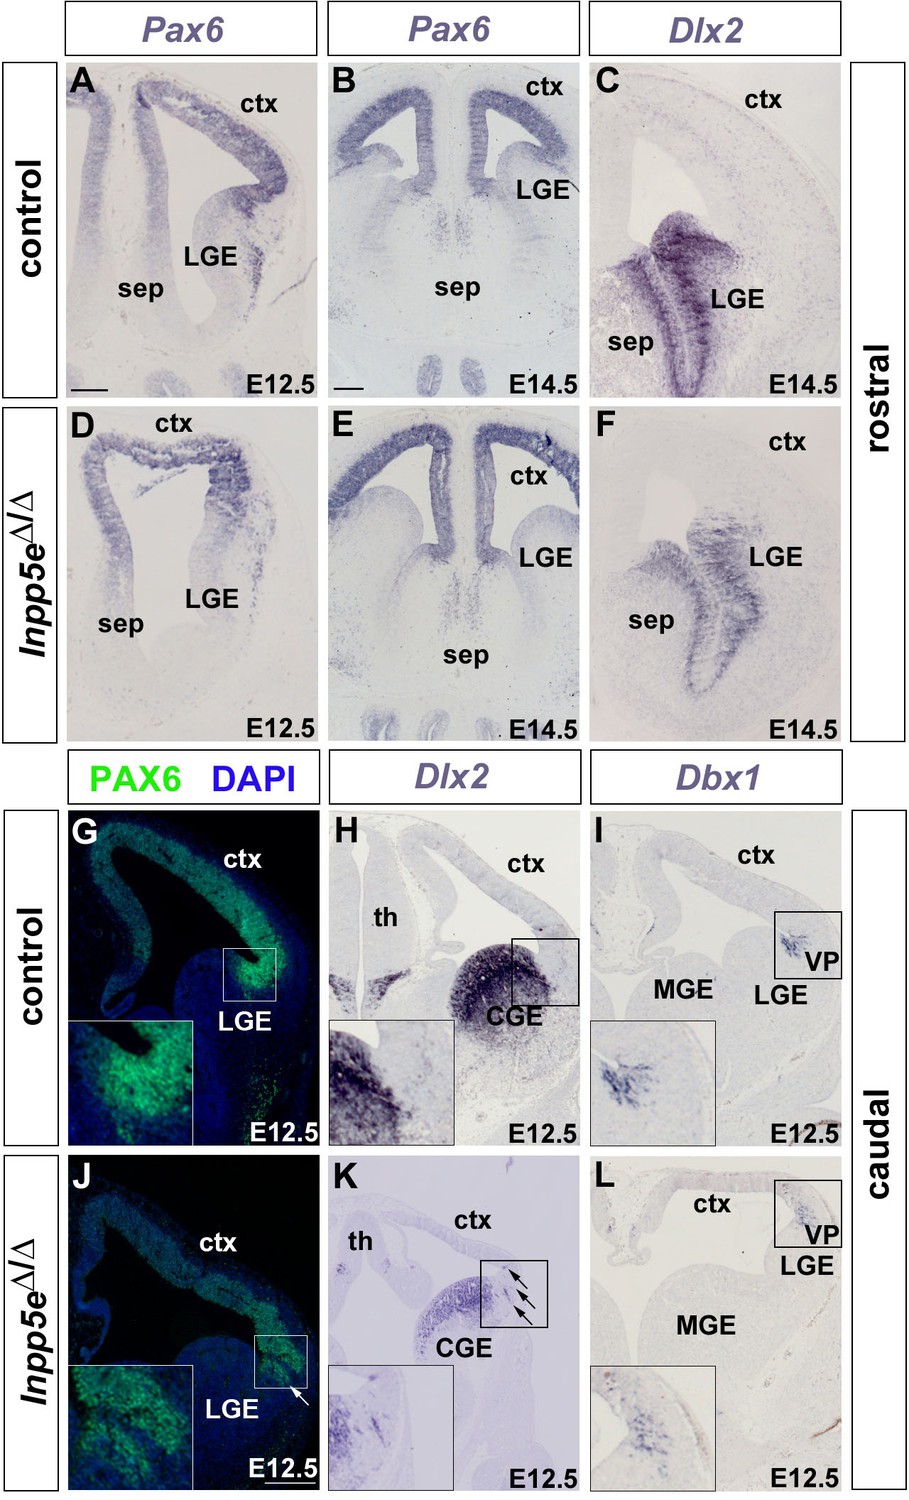
Formation of the telencephalic boundaries in Inpp5eΔ/Δ embryos.
(A–F) Formation of the corticoseptal boundary. Expression of the dorsal marker gene Pax6 (A, B, D, E) and of the ventral marker gene Dlx2 (C, F) remain restricted to the cortex and septum, respectively, with a sharp expression boundary between both tissues. (G–L) Formation of the pallial/subpallial boundary. While there is a sharp expression boundary between cortex and lateral ganglionic eminence (LGE) in wild-type embryos (G–I), scattered Pax6 and Dlx2-expressing cells (arrows in J and K) are found in the mutant LGE and cortex, respectively, while the Dbx1 expression domain characteristic of the ventral pallium (VP) is fuzzier (L). CGE: caudal ganglionic eminence; ctx: cortex; MGE: medial ganglionic eminence; sep: septum; th: thalamus. Scale bars: 200 μm.
Figure 1—figure supplement 2
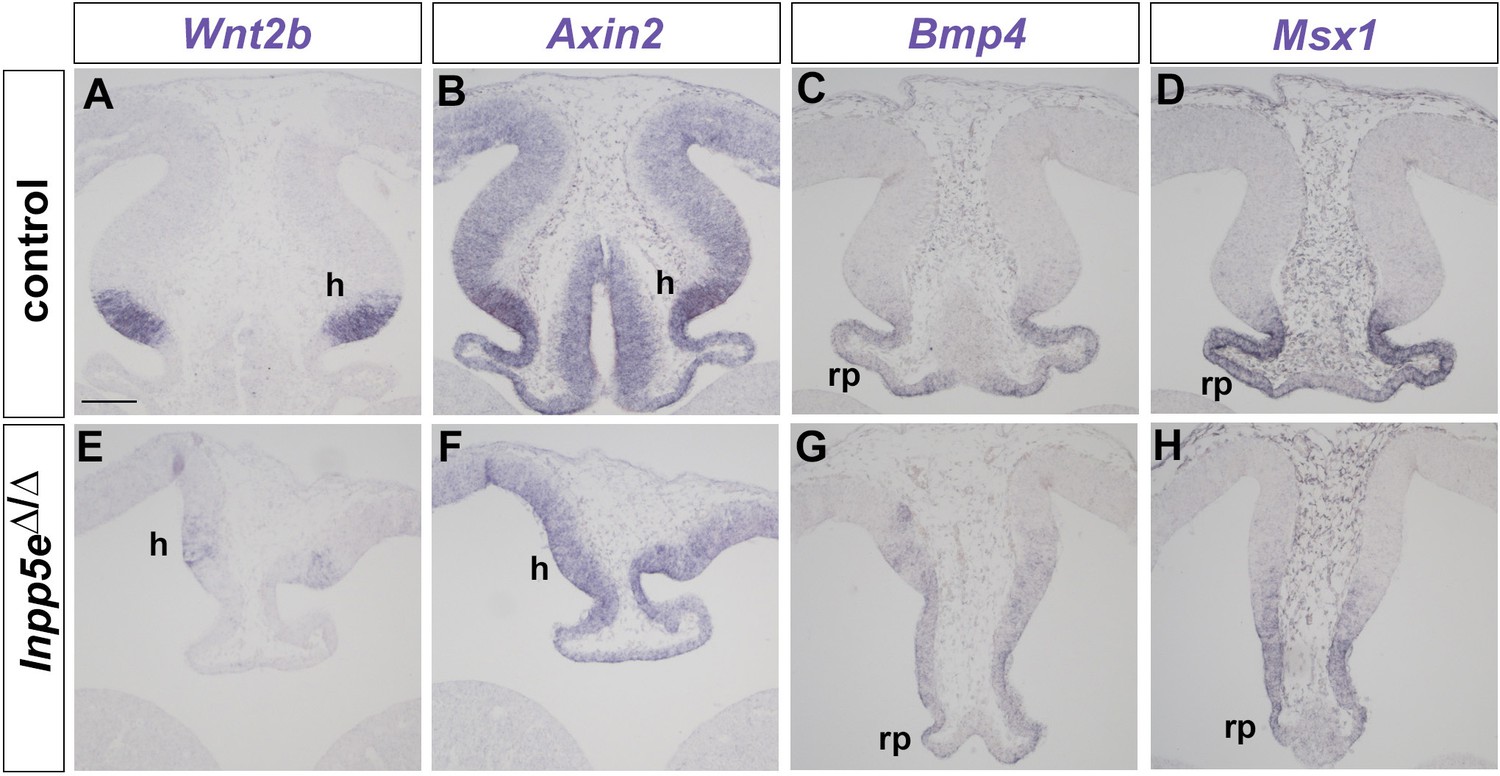
Wnt/β-catenin and Bmp signaling in the dorsomedial telencephalon of E12.5 Inpp5eΔ/Δ embryos.
(A, B, E, F) Reduced Wnt/β-catenin signaling in Inpp5eΔ/Δ embryos. (A, E) Wnt2b expression is confined to the cortical hem (h) while there are only few scattered Wnt2b expressing cells in the mutant. (B, F) Graded expression of the Wnt target gene Axin2 in the dorsal midline is reduced in mutant embryos. (C, D, G, H) Roof plate (rp) expression of Bmp4 and its target gene Msx1 are reduced in Inpp5eΔ/Δ embryos. Scale bar: 100 μm.
Figure 1—figure supplement 3
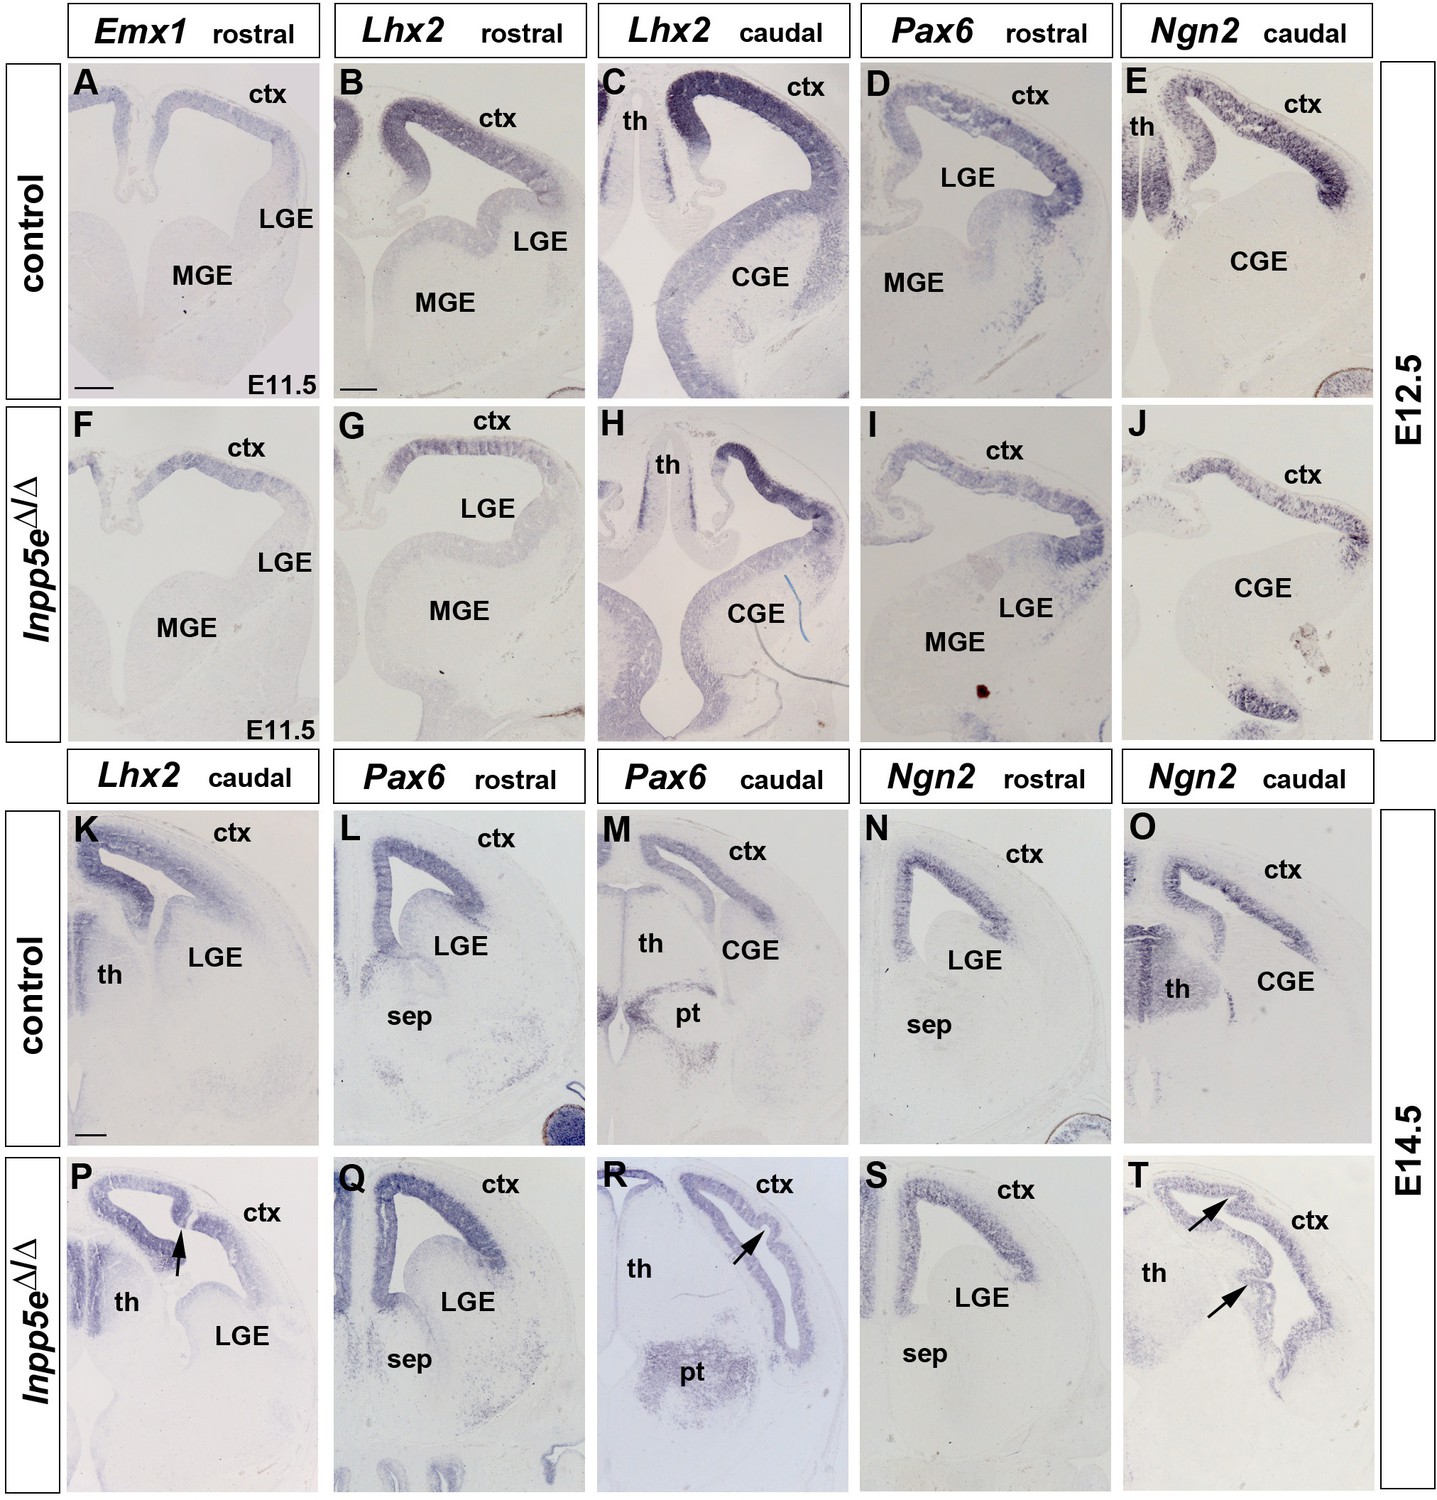
Expression of cortical progenitor markers in Inpp5eΔ/Δ embryos.
(A–J) Dorsal marker gene expression at patterning stages (E12.5). Emx1, Lhx2, Pax6 and Ngn2 are still expressed in the developing neocortex of Inpp5eΔ/Δ embryos though the Lhx2 medial to lateral (B, C, G, H) and the Pax6/Ngn2 lateral to medial (D, E, I, J) expression gradients are flatter. (K–T) Neocortical progenitors express Lhx2, Pax6 and Ngn2 in E14.5 Inpp5eΔ/Δ embryos. Note the folding of the neocortex at caudal levels which occurs with 100% penetrance (arrows in P, R and T). CGE: caudal ganglionic eminence; ctx: cortex; MGE: medial ganglionic eminence; LGE: lateral ganglionic eminence; pt: prethalamus; sep: septum; th: thalamus. Scale bars: 200 μm.
Figure 2
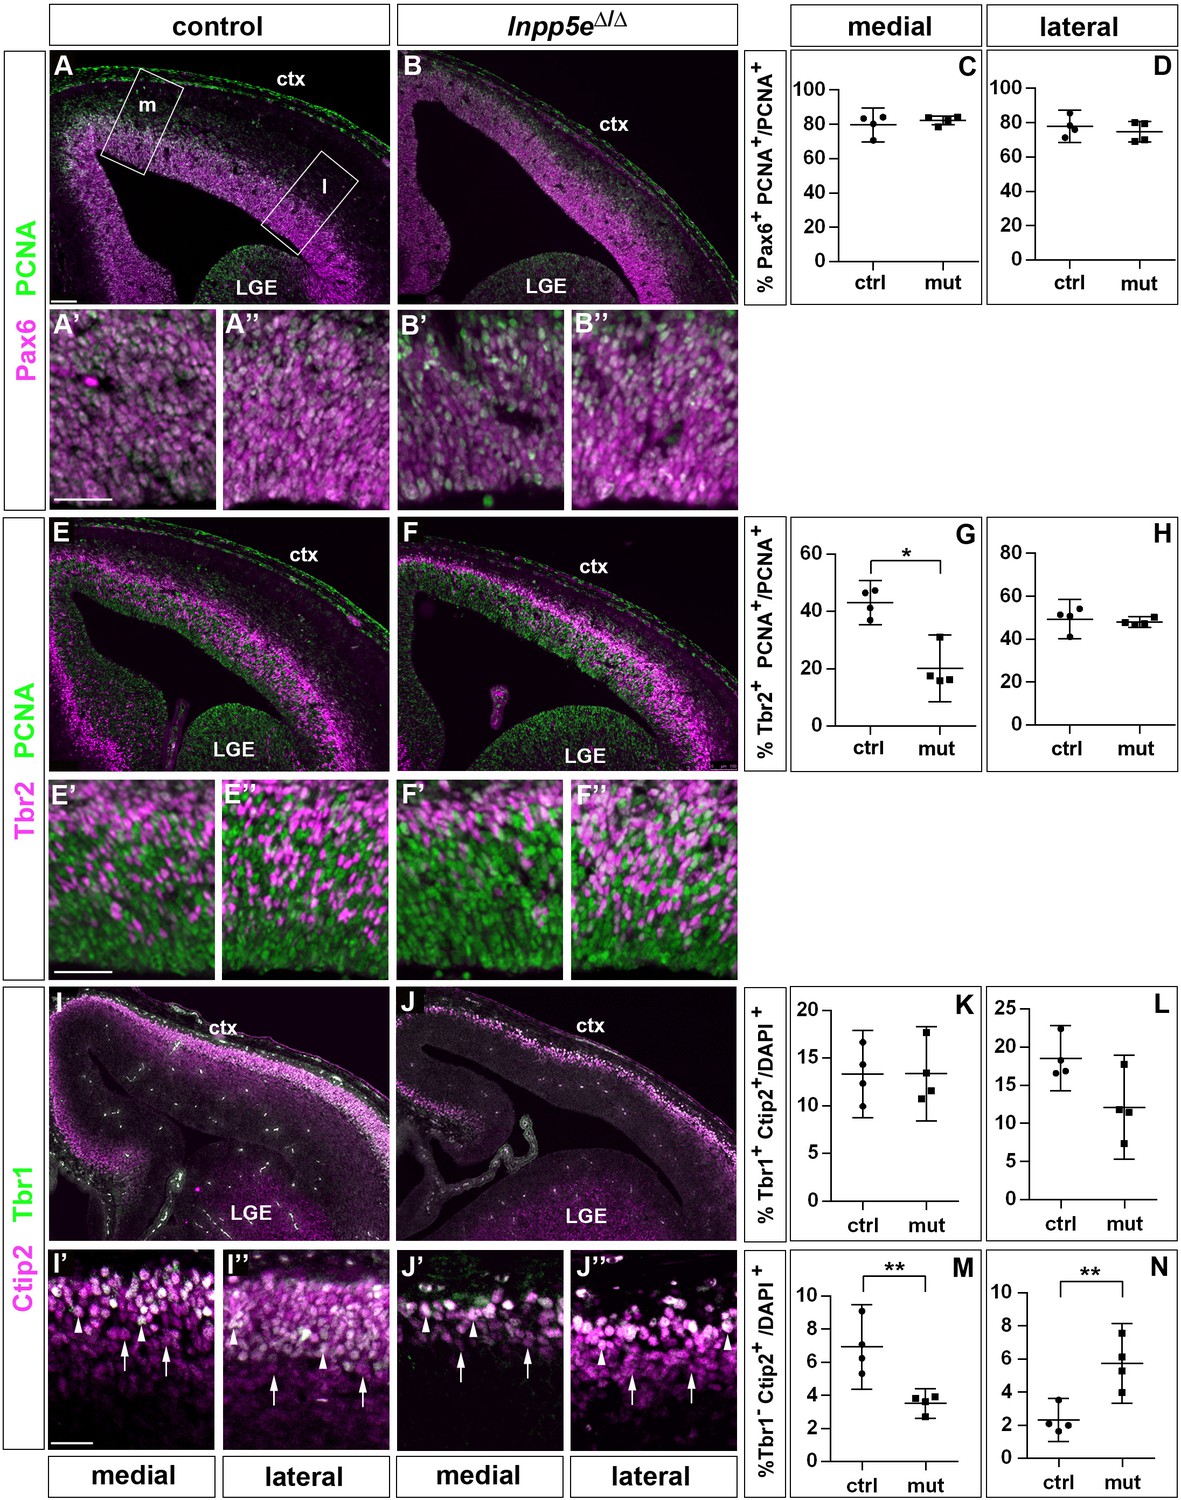
Proportions of radial glial cells, basal progenitors and neurons in the neocortex of E14.5 Inpp5eΔ/Δ embryos.
(A–D) The proportion of radial glial cells remains unaffected by the Inpp5e mutation as revealed by Pax6/PCNA double immunofluorescence. The boxes in A indicate the regions in the medial (m) and lateral (l) telencephalon at which cell counts were performed. (E–H) Tbr2/PCNA double staining showed a reduced proportion of basal progenitors in the Inpp5eΔ/Δ medial but not lateral neocortex. (I–N) The proportion of Tbr1+Ctip2+ neurons is not significantly altered (I–L), whereas the proportion of Tbr1-Ctip2+ neurons is decreased and increased in the medial and lateral neocortex, respectively. Arrows in (I and J) label Tbr1-Ctip2+ neurons and arrowheads Tbr1+Ctip2+ neurons. (A–J) The insets labeled with ’ and ” are representative magnifications of medial and lateral levels, respectively. All statistical data are presented as means ± 95% confidence intervals (CI); Unpaired t-tests (C, D, H, K–N) and Mann Whitney test (G); n = 4; *p<0.05; **p<0.01. Scale bars: 100 μm (A) and 50 μm (A’, E’ and I’). ctx: cortex; LGE: lateral ganglionic eminence.
Figure 3 with 3 supplements

Increased neurogenesis at the expense of basal progenitor formation in the E12.5 Inpp5eΔ/Δ mutant lateral telencephalon.
Immunohistochemistry on sections of E12.5 control (A, D) and Inpp5eΔ/Δ embryos (B, E) that were treated with BrdU 24 hr earlier. (A–C) Tbr2/BrdU double labeling showed that less basal progenitors formed from the BrdU-labeled progenitor cohort in Inpp5eΔ/Δ embryos. (D–F) The proportion of newly formed Tbr1+ neurons was increased in Inpp5eΔ/Δ embryos. The arrows in D and E label Tbr1+BrdU+ cells. All statistical data are presented as means ± 95% confidence intervals (CI); unpaired t tests; n = 4; *p<0.05; **p<0.01. Scale bar: 50 μm.
Figure 3—figure supplement 1
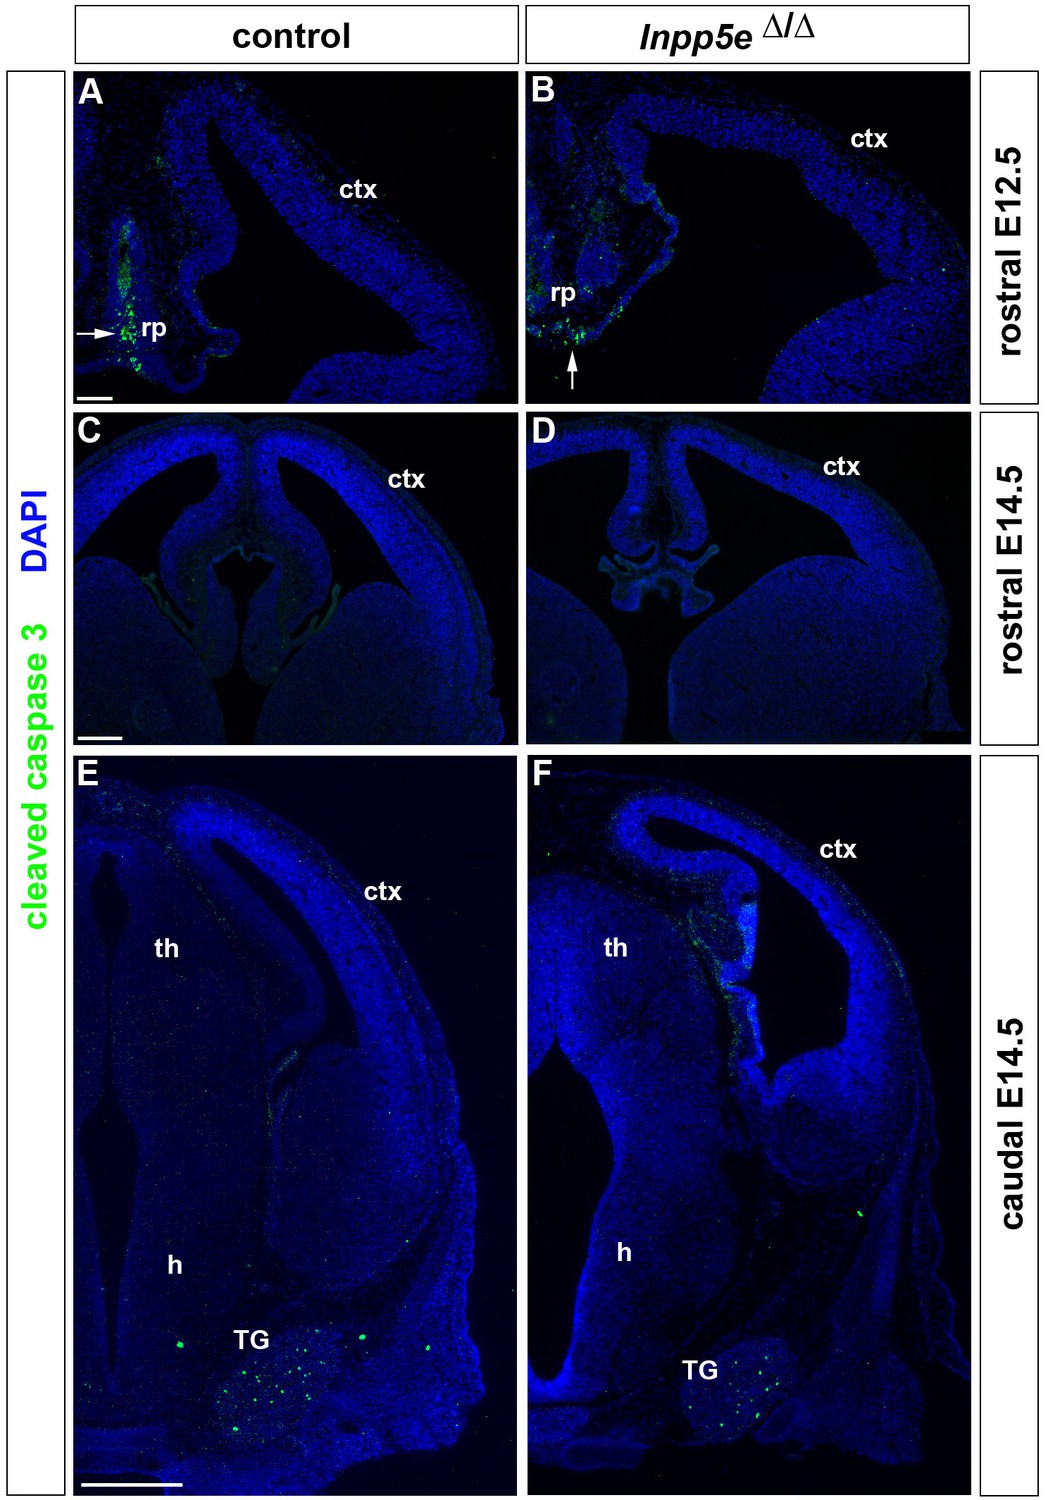
Apoptosis in the developing forebrain of Inpp5eΔ/Δ embryos.
(A–F) Immunofluorescence staining for Cleaved Caspase three revealing apoptic cells. (A, B) Programmed cell death was detected in the midline roof plate (rp) but hardly in the developing neocortex of E12.5 control (A) and Inpp5eΔ/Δ embryos (B). (C–F) In E14.5 embryos, very few apoptotic cells were identified in the neocortex while apoptosis is widespread in the trigeminal ganglion (TG) (E, F). ctx: cortex. Scale bars: (A): 100 μm, (C): 25`0 μm, (D) 500 μm.
Figure 3—figure supplement 2
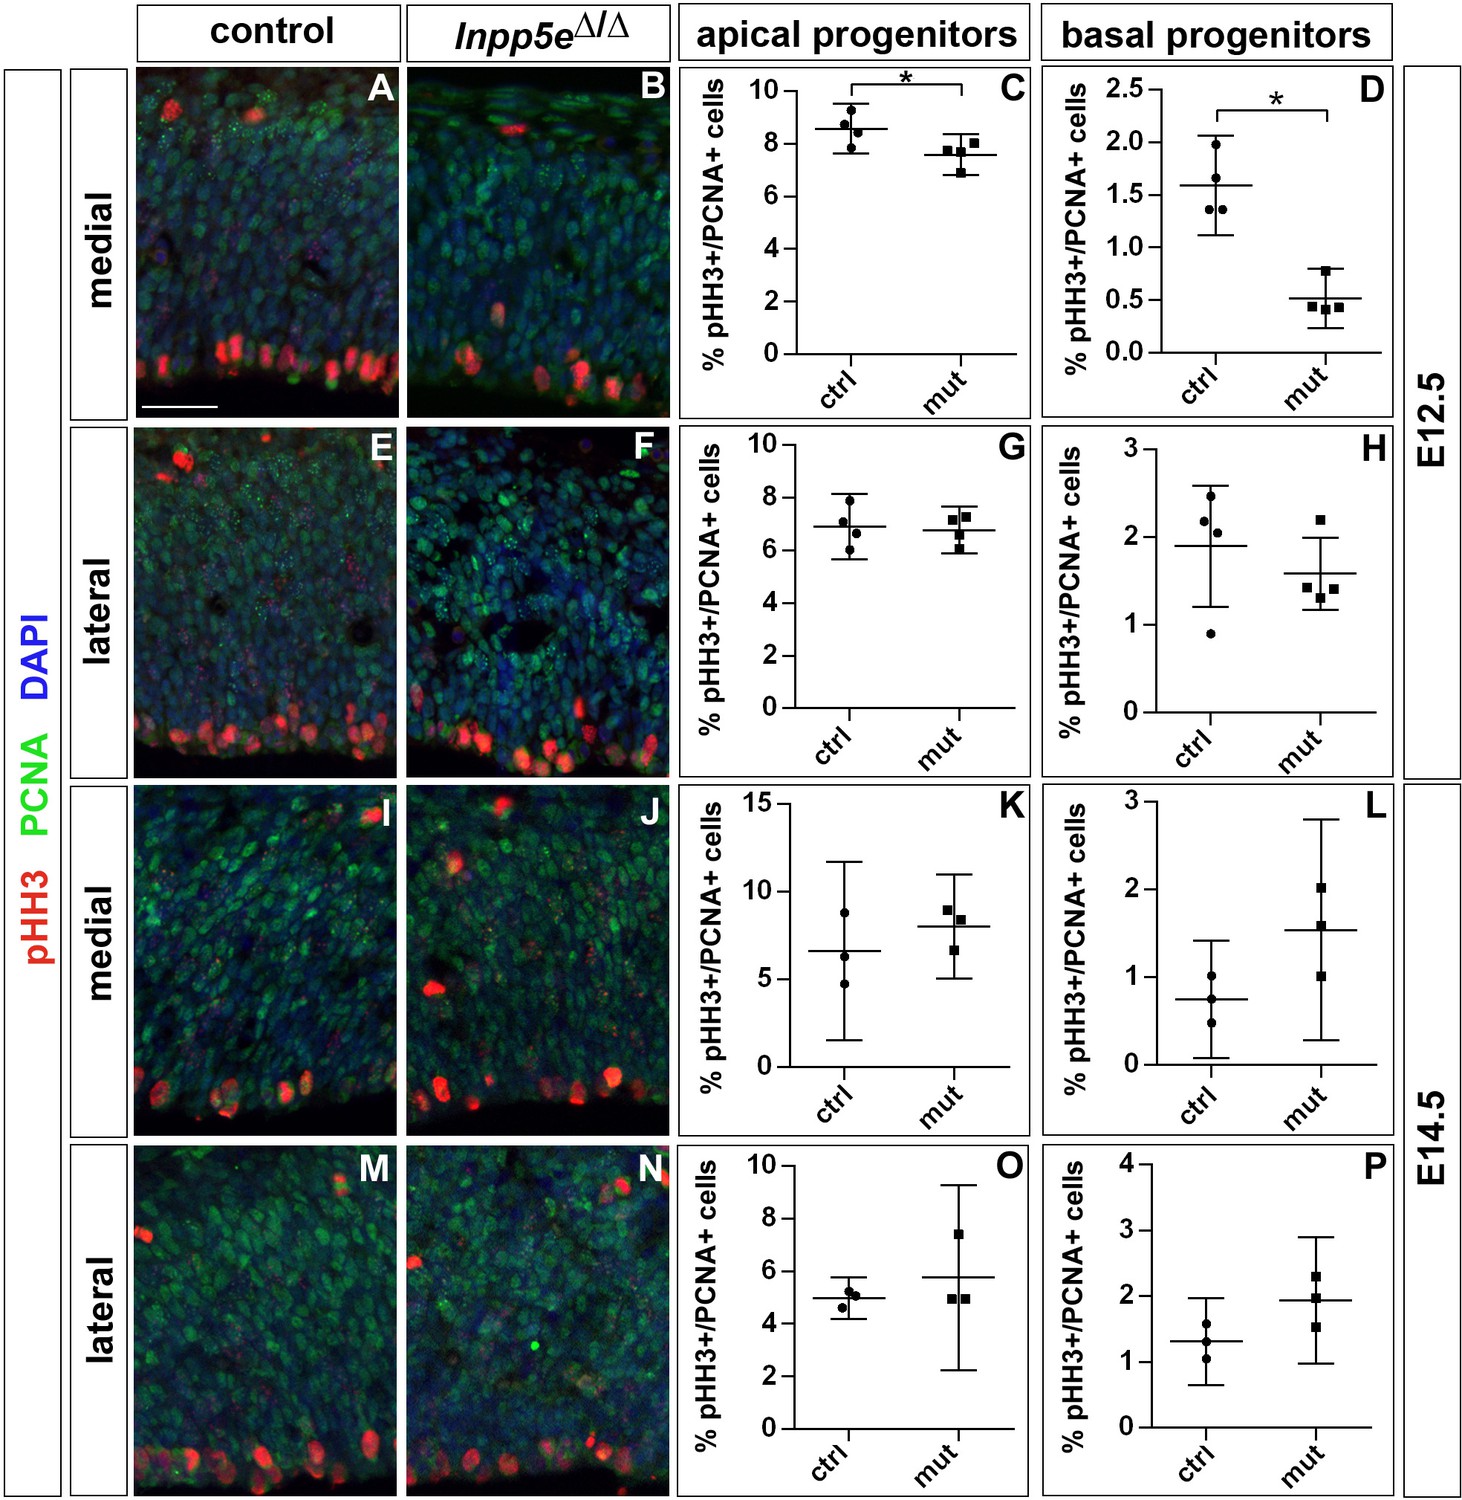
Proportion of mitotic progenitors in Inpp5eΔ/Δ embryos.
(A–H) Proportions of mitotic progenitors in E12.5 control (A, E) and Inpp5eΔ/Δ embryos (B, F) as revealed by pHH3 (mitotic cells) and PCNA (all progenitor cells) double immunofluorescence. Note the reduction in mitotic basal progenitors in the Inpp5eΔ/Δ medial neocortex (A, B, D). (I–P) The proportions of apical and basal progenitors is not significantly different in E14.5 control and Inpp5eΔ/Δ embryos. In all panels, radial glia cells divide at the ventricular surface, whereas mitotic basal progenitors locate in abventricular positions. All statistical data are presented as means ± 95% confidence intervals (CI); unpaired t-tests (C, G, K, L, P) and Mann Whitney tests (D, H, O); n = 4; *p<0.05. Scale bar: 50 μm.
Figure 3—figure supplement 3
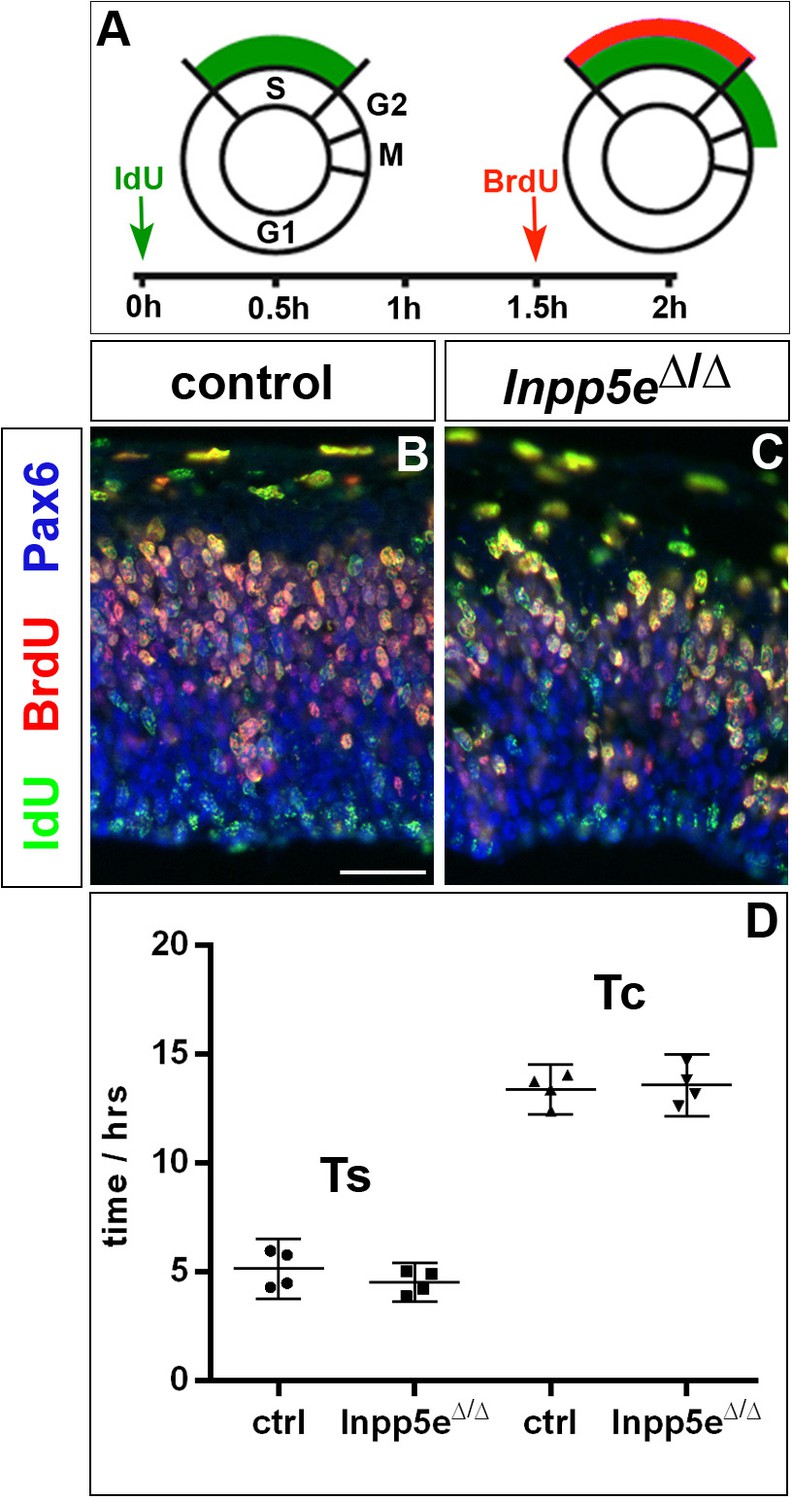
Cell cycle of cortical progenitors in E12.5 Inpp5eΔ/Δ embryos.
(A) Schematic illustrating the BrdU/IdU double labeling strategy to measure S phase (TS) and total cell cycle length (TC). 90 min after an initial IdU administration, pregnant females received an intraperitoneal BrdU injection. Embryos are harvested 30 min later. (B, C) Double immunofluorescence to detect IdU+ and BrdU+ progenitors. (D) Quantification showing no significant change in TS and TC. Statistical data are presented as means ± 95% confidence intervals (CI); unpaired t-tests; n = 4; *p<0.05. Scale bar: 50 μm.
Figure 4 with 4 supplements
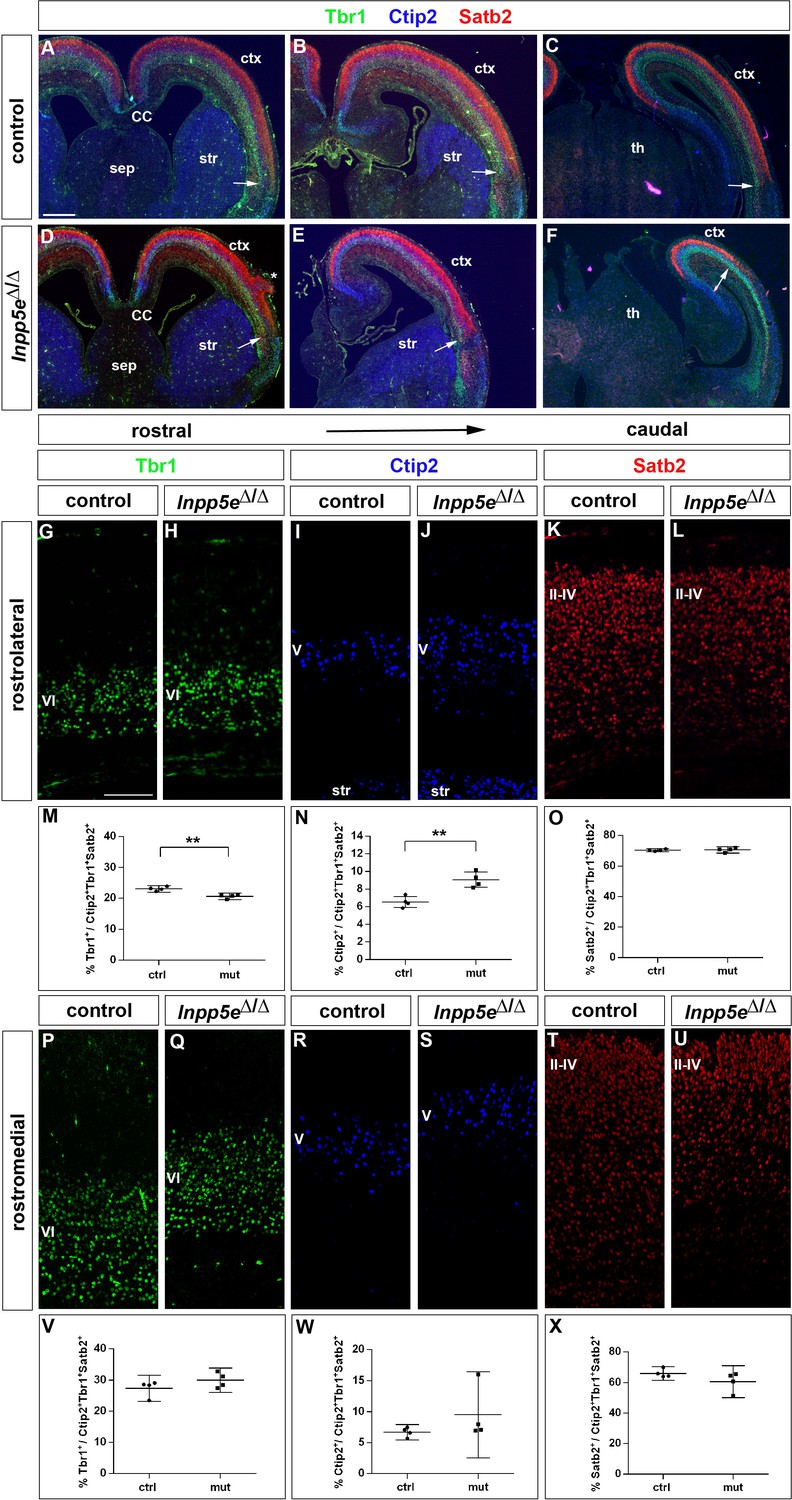
Increased formation of layer V neurons in E18.5 Inpp5eΔ/Δ mutants.
(A–F) Coronal sections immunostained for the deep layer markers Tbr1 (layer VI) and Ctip2 (layer V) and for the upper layer marker Satb2 (layers II-IV); there is no obvious defect in layering in Inpp5eΔ/Δ embryos except for the formation of a heterotopia (asterisk in D). At caudal levels, the cortex becomes thinner and the rhinal fissure is shifted medially as indicated by the arrows. (G–O) Formation of cortical neurons at rostrolateral levels. The proportion of Tbr1+layer VI neurons is decreased with a concomitant increase in Ctip2+layer V neurons. (P–X) Portion of cortical neurons at rostromedial levels. Immunolabeling with cortical layer markers revealed no significant difference. Note that due to the thinner cortex, the position of layer VI Tbr1+ (Q) and layer V Ctip2+ neurons (J, S) appears to be shifted to more superficial positions; however, the relative order of these layers remains unaffected. All statistical data are presented as means ± 95% confidence intervals (CI); unpaired t-tests (M–O, X); Mann Whitney tests (V, W); n = 4; **p<0.01. Scale bars: 500 μm (A) and 100 μm (G). CC: corpus callosum; ctx: cortex; sep: septum; str: striatum.
Figure 4—figure supplement 1
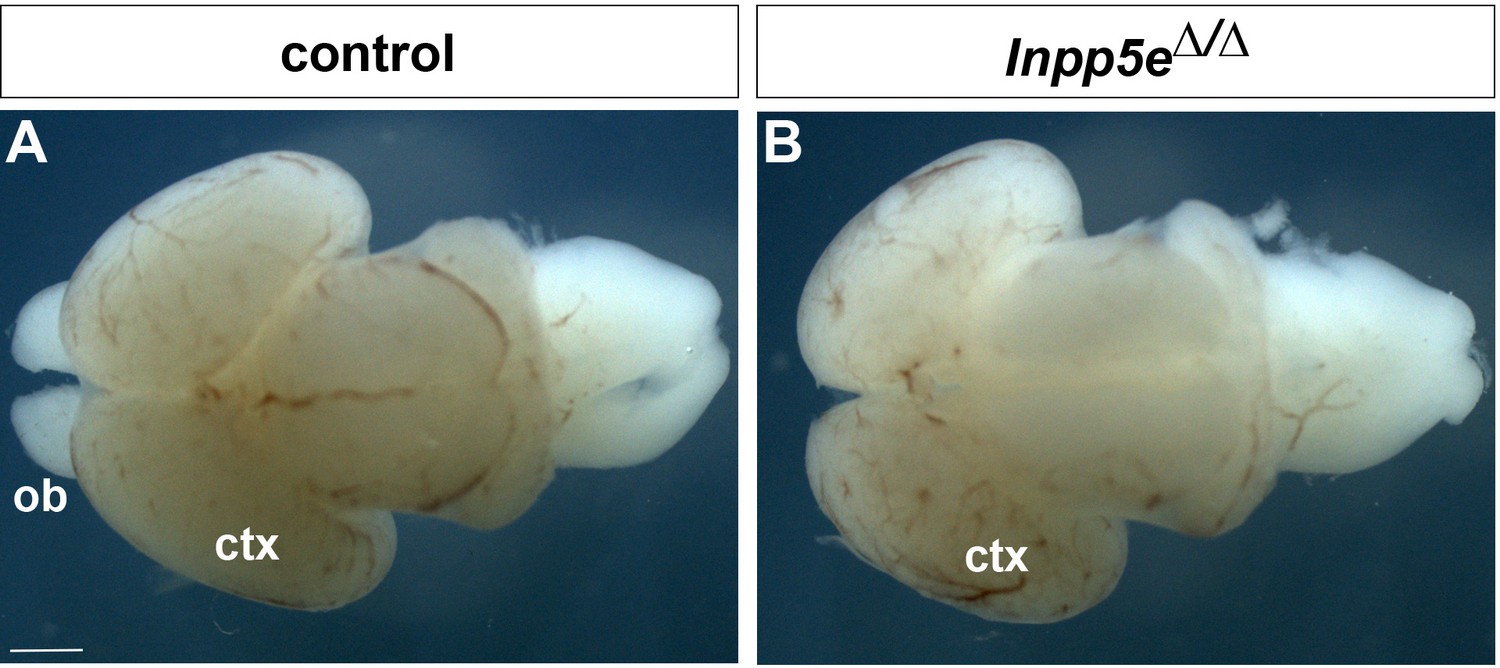
Whole mount preparations of E18.5 brains.
(A) Control. (B) Inpp5eΔ/Δ brain. Note the absence of obvious protrusions of the olfactory bulbs (ob) in the mutant. Ctx: cortex. Scale bar: 1 mm.
Figure 4—figure supplement 2
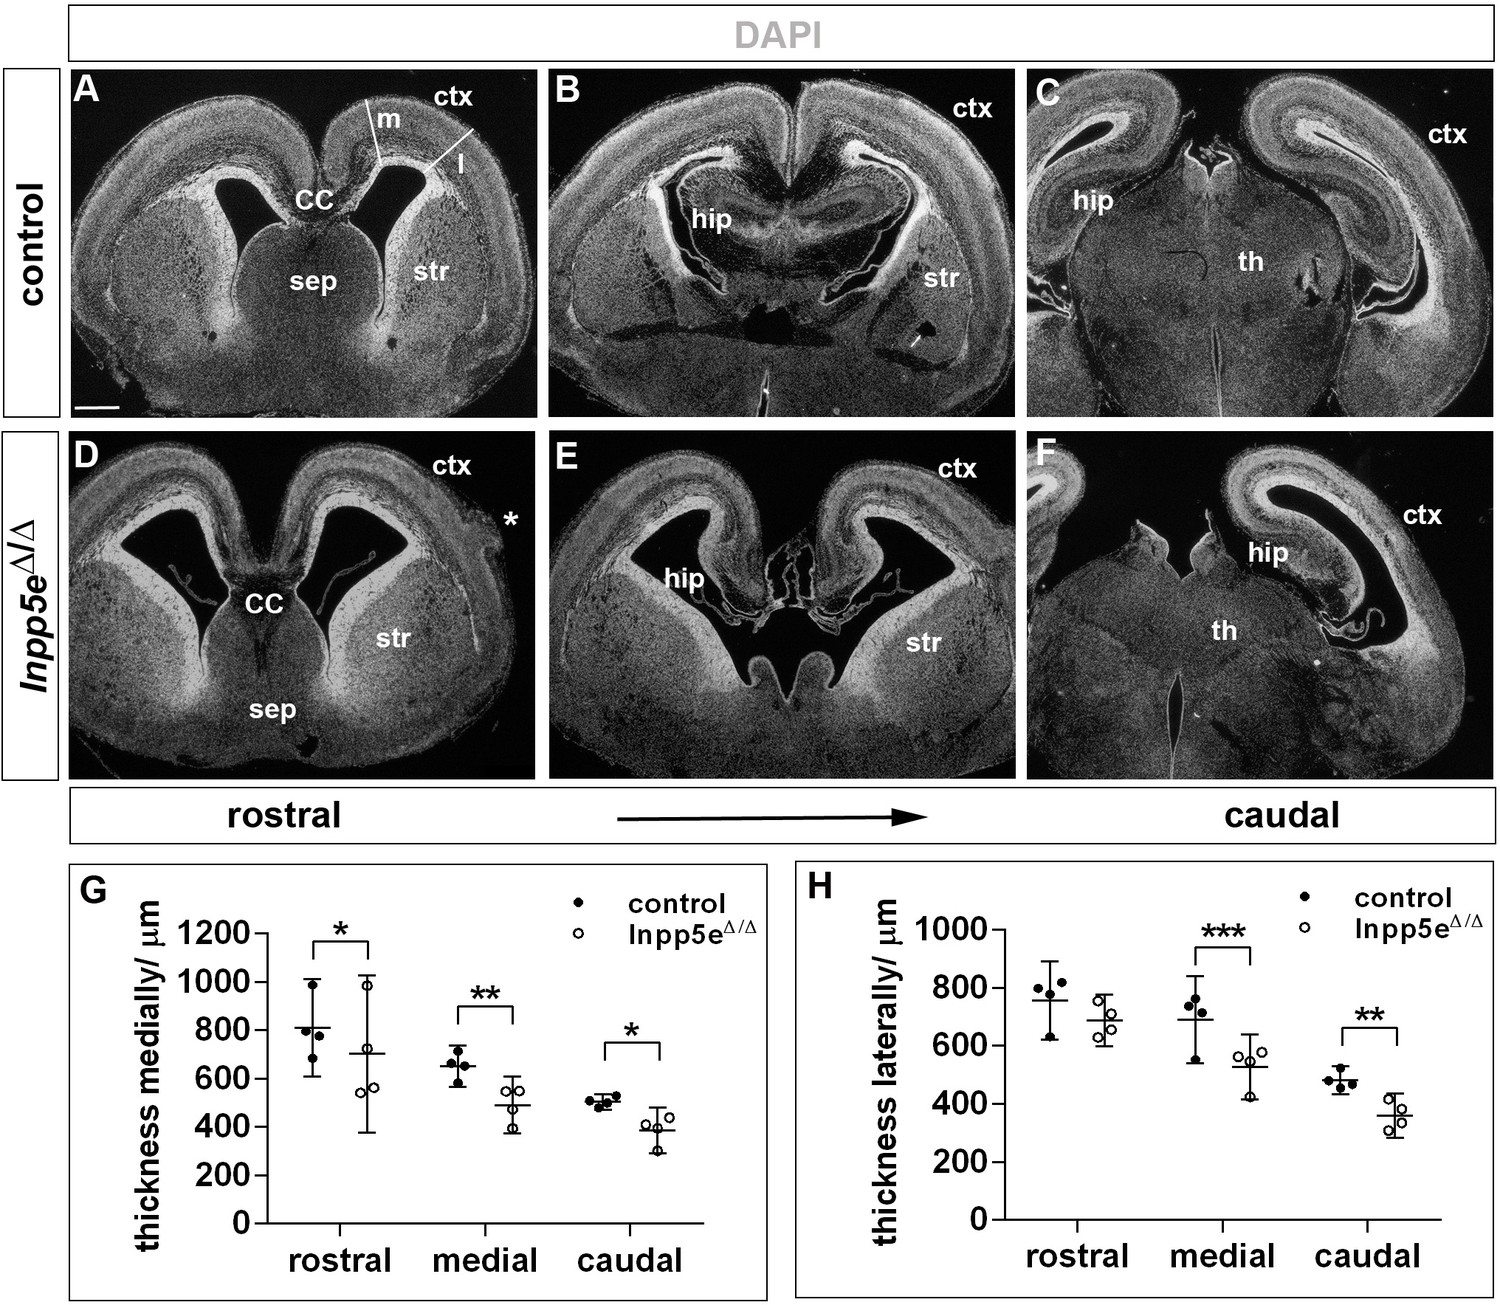
Forebrain malformations in E18.5 Inpp5eΔ/Δ embryos.
(A–F) Coronal sections through the forebrain of E18.5 control (A–C) and Inpp5eΔ/Δ (D–F) embryos. The asterisk in (D) demarcates a heterotopia in the Inpp5e mutant. Note that the mutant lateral neocortex is thinner at most levels but not rostrolaterally (D– F). The lines in (A) indicate where cortical thickness was measured at medial (m) and lateral (l) levels. (G, H) Quantification of cortical thickness. CC: corpus callosum; ctx: cortex; hip: hippocampus; sep: septum; str: striatum; th: thalamus. Scale bar: 500 μm. Statistical data are presented as means ± 95% confidence intervals (CI); Two-way ANOVA followed by Sidak multiple comparisons test; n = 4; *p<0.05; **p<0.005; ***p<0.001.
Figure 4—figure supplement 3
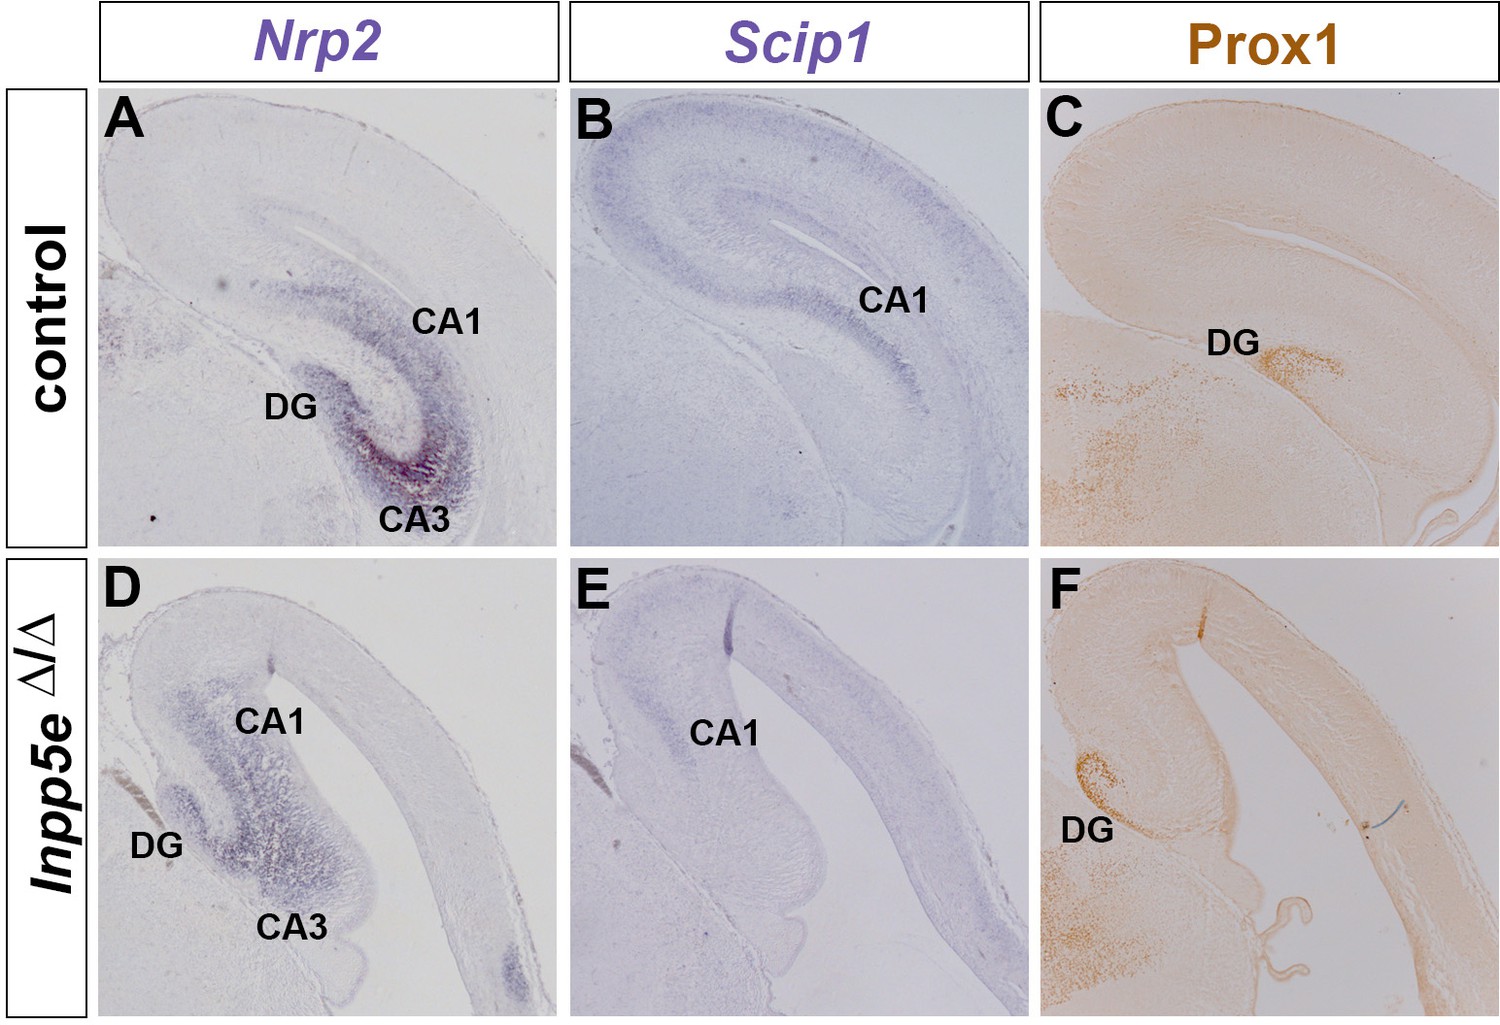
Hippocampus formation in Inpp5eΔ/Δ embryos.
(A–F) Hippocampal marker gene expression in E18.5 control (A–C) and Inpp5eΔ/Δ embryos (D–F). Expression of Nrp2 labels the whole hippocampal formation (A), while Scip1 is expressed in CA1 and in the neocortex (B). Prox1 expression is confined to the dentate gyrus (DG) (C). In Inpp5eΔ/Δ embryos, these hippocampal markers are expressed but their expression domains are severely reduced or disorganized (D–F).
Figure 4—figure supplement 4

Formation of the corpus callosum in E18.5 Inpp5eΔ/Δ embryos.
(A, B) Coronal section through the telencephalon stained with L1 and GFAP to reveal the corpus callosum (CC) and glial cells, respectively. The corpus callosum was smaller in Inpp5eΔ/Δ embryos while the glial wedge (GW), the induseum griseum glia (IGG) and the midline zipper glia (MZG) occupied their correct position surrounding the corpus callosum. (C) Quantification of corpus callosum thickness. Statistical data are presented as means ± 95% confidence intervals (CI); Mann-Whitney test; n = 4; *p<0.05. Scale bar: 250 μm.
Figure 5
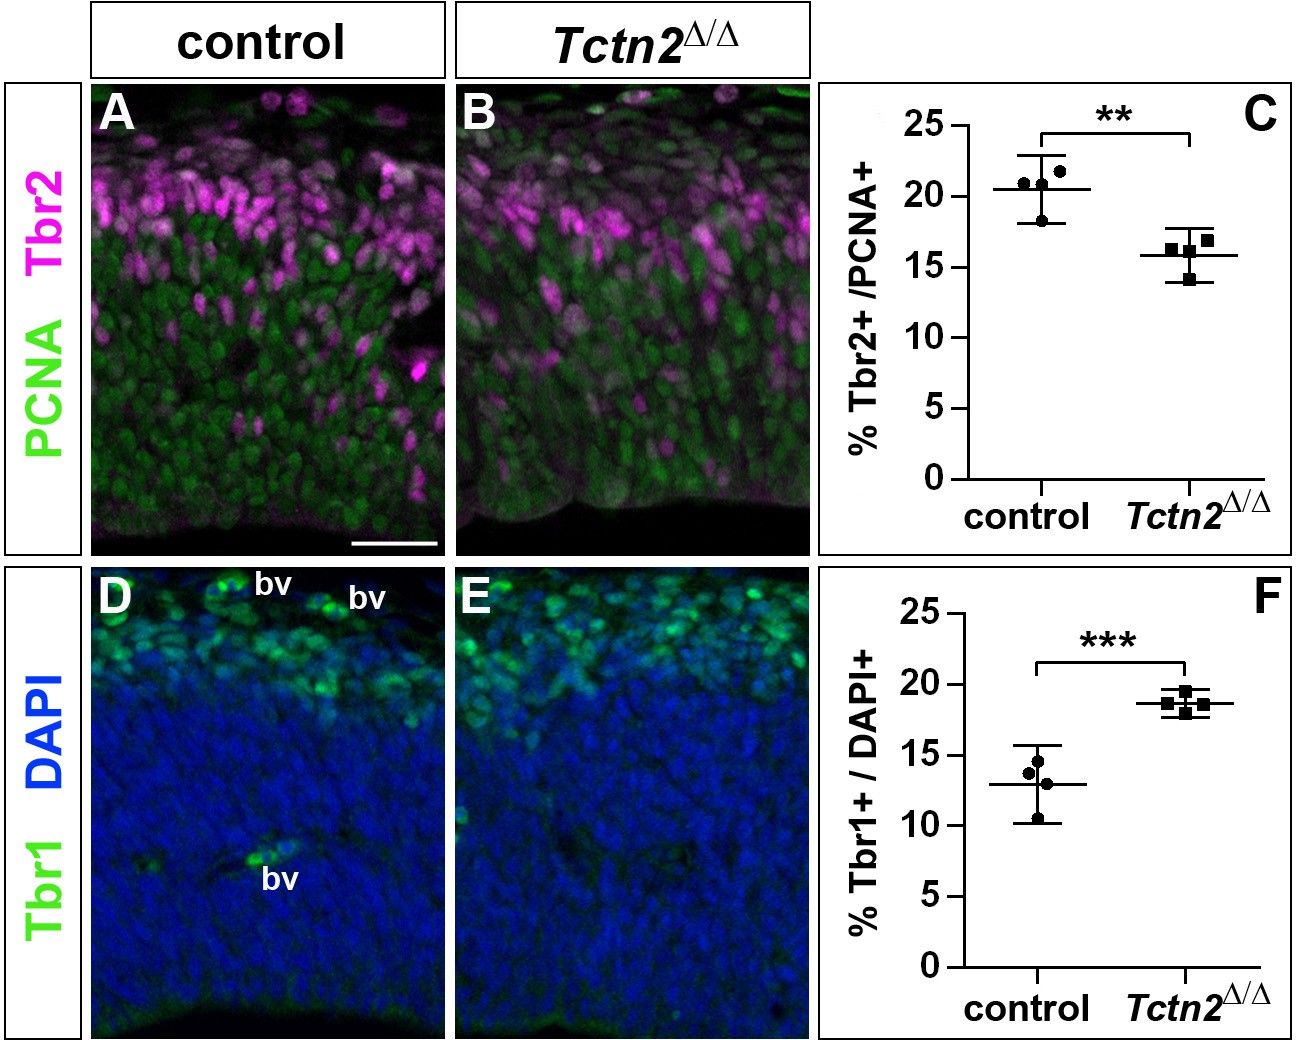
Increased generation of cortical neurons in the lateral neocortex of E12.5 Tctn2Δ/Δ embryos.
(A–C) Double immunofluorescence for PCNA and Tbr2 revealed a significantly decreased proportion of basal progenitors. (D–F) The portion of Tbr1+ cortical neurons was increased. All statistical data are presented as means ± 95% confidence intervals (CI); unpaired t tests; n = 4; **p<0.01; ***p<0.001. Scale bar: 50 μm. bv: blood vessel.
Figure 6
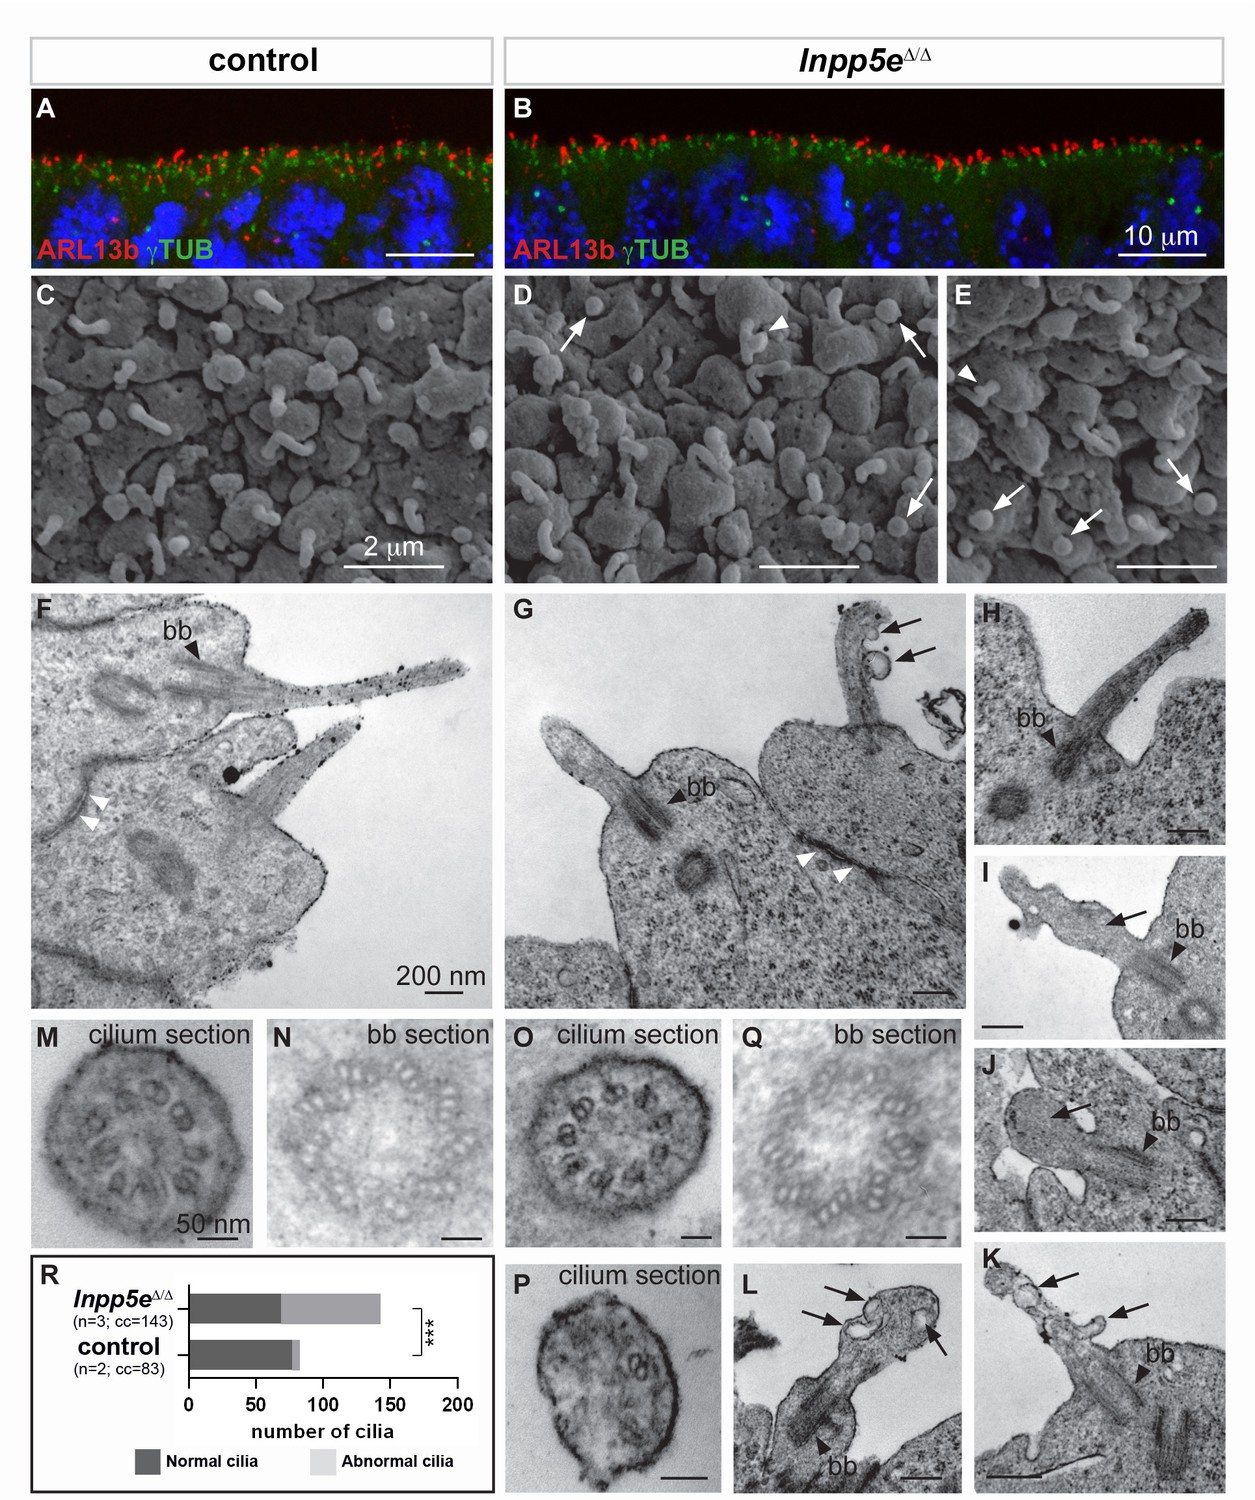
Ciliary defects in E12.5 Inpp5eΔ/Δ forebrain.
(A–B) Immunohistochemistry for Arl13b and γ-Tubulin (γTUB) on E12.5 brain cryosections showed an accumulation of ciliary axonemes and basal bodies, respectively, at the apical border of radial glial cells facing the ventricules in both control (A) and Inpp5eΔ/Δ (B) embryos without any gross difference. Scale bars: 10 μm. (C–E) Scanning electron microscopy (SEM) on E12.5 control (C) and Inpp5eΔ/Δ (D, E) brains highlighted the presence of primary cilia projecting from the apical surface of radial glial cells in both control (A) and Inpp5eΔ/Δ (B) embryos. However, SEM also revealed the presence of abnormal cilia in Inpp5eΔ/Δ embryos having a spherical shape (arrows in D and E) or aberrant lateral buddings (arrowheads in D and E). Scale bars: 2 μm. (F–L) Transmission electron microscopy (TEM) analysis on E12.5 brains showed longitudinal sections of primary cilia in control (F) and Inpp5eΔ/Δ (G–L) embryos. In control primary cilia, the axoneme appeared as an extension of the basal body (bb, black arrowheards) (F–H). In addition to cilia with normal morphology, abnormal cilia were identified in Inpp5eΔ/Δ embryos thanks to the presence of a basal body apparently correctly docked to the apical membrane. Abnormal cilia lacked an axoneme (I, J, L) or showed unusual membranous structures, such as budding (G, K) or internal (I, K, L) vesicles (arrows) or undulating peripheral membranes (I). Note that tight junctions (white arrowheads in F and G) appeared normal in Inpp5eΔ/Δ (G) and control (F) embryos, suggesting that apico-basal polarity of Inpp5eΔ/Δradial glial cells was not compromised. Scale bars: 200 nm. (M–Q) TEM images showing transverse sections of the axoneme (M, O, P) and the basal body (N, Q) in control (M, N) and Inpp5eΔ/Δ (O–Q) embryos with no major difference in the basal bodies between control (N) and Inpp5eΔ/Δ (Q) embryos. However, transverse section of primary cilia in Inpp5eΔ/Δ brains revealed the presence of normal axonemes composed of nine correctly organized doublets of microtubules on some radial glial cells (O), while others harbored an abnormal axoneme containing a lower number of microtubule doublets (P). Scale bars: 50 nm. (R) Graph showing the number of normal versus abnormal cilia (cil.) found on TEM images from control (n = 3) or Inpp5eΔ/Δ (n = 3) embryos. cc: counted cilia.
Figure 7 with 3 supplements
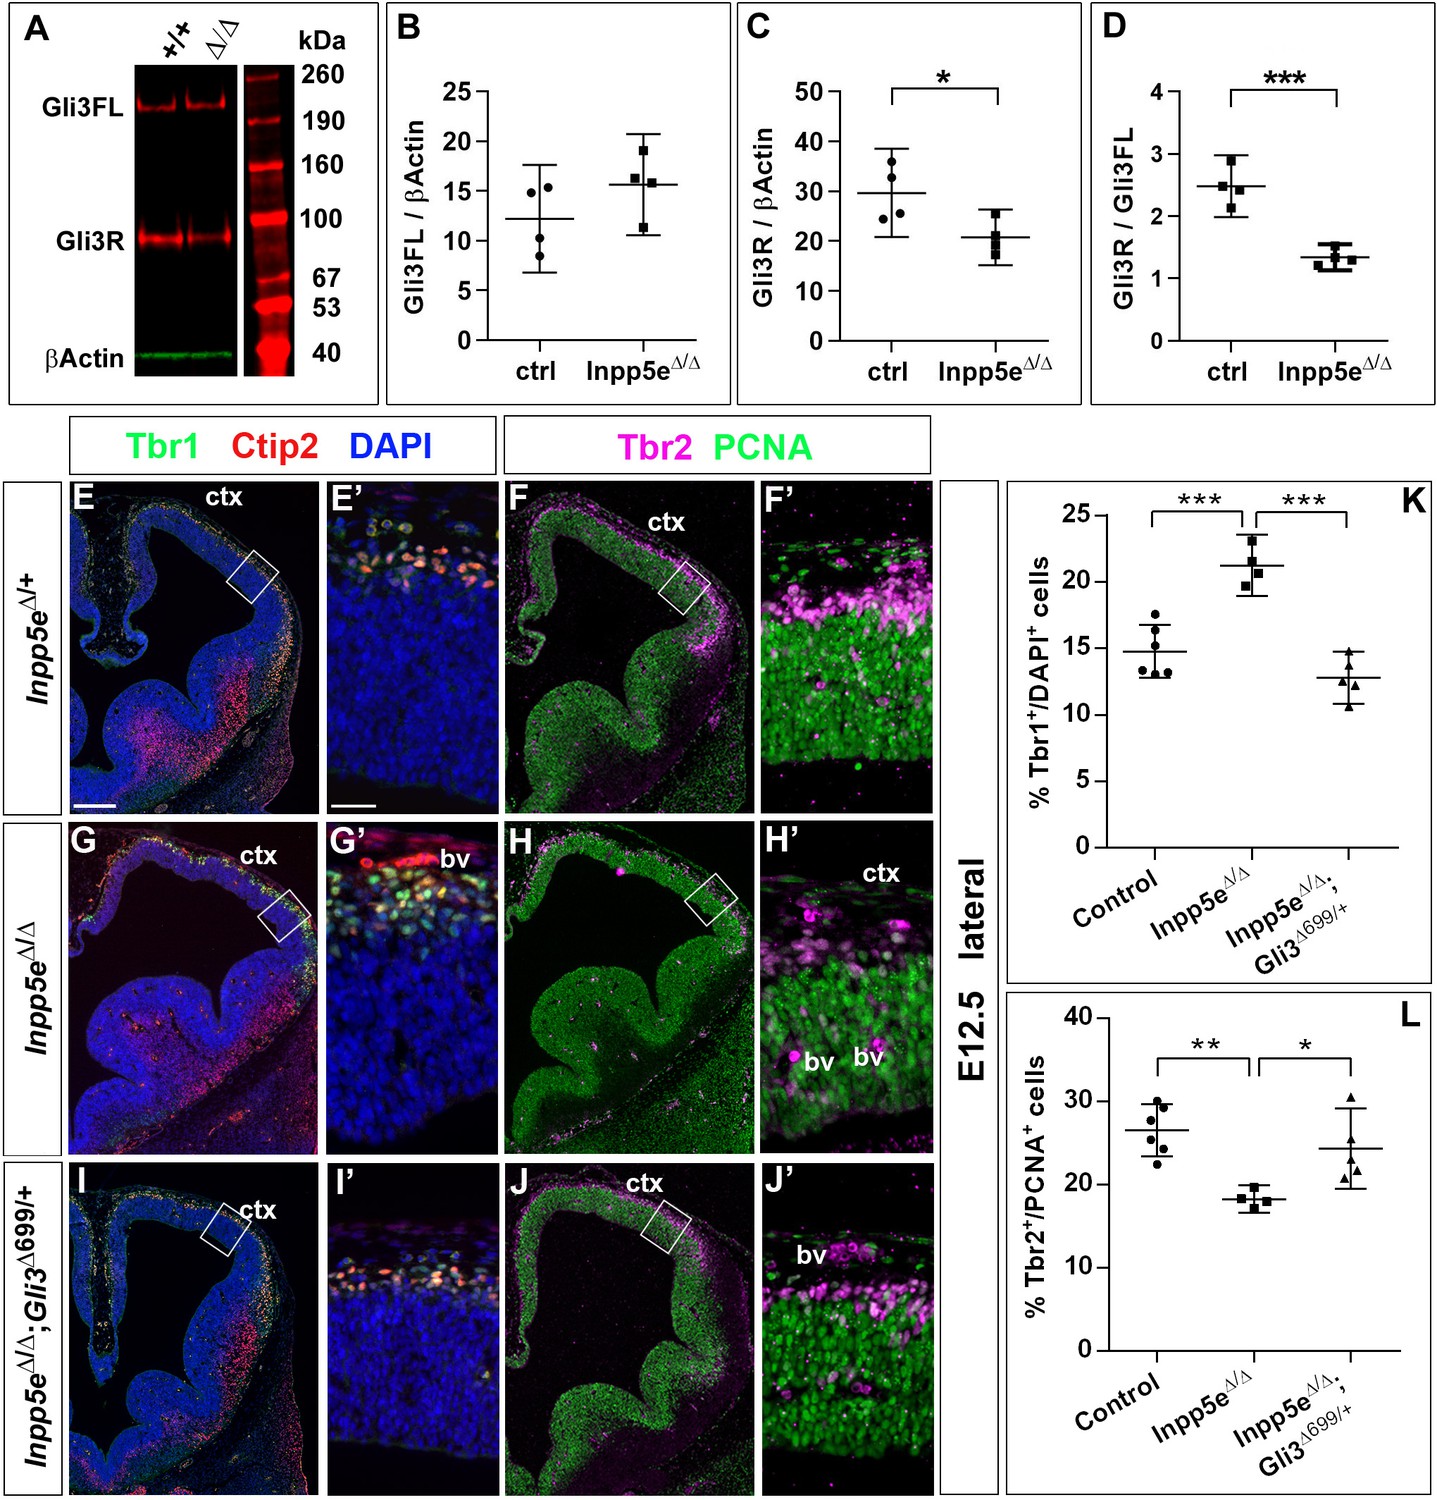
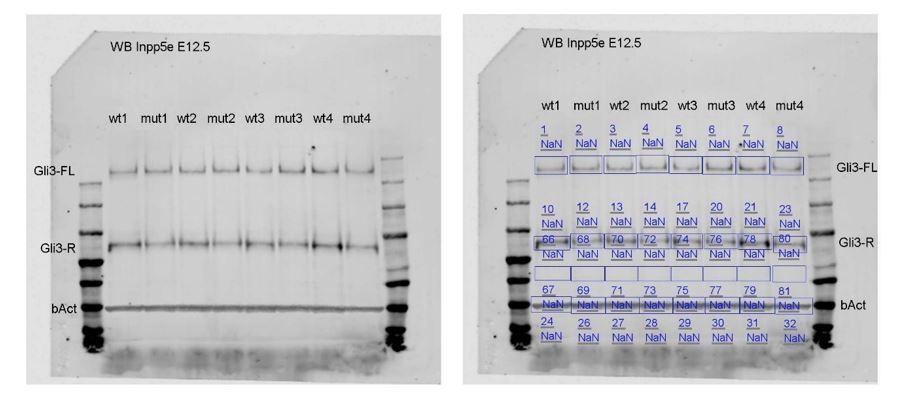
Re-introducing a single copy of the Gli3 repressor rescues the neurogenesis defect in E12.5 Inpp5e mutants.
(A–D) Gli3 western blot on E12.5 dorsal telencephalic tissue revealed the Gli3 full length (FL) and repressor (R) forms (A). While Gli3FL levels are not affected (B), levels of Gli3R (C) and the Gli3R/Gli3FL ratio (D) are decreased in Inpp5eΔ/Δ embryos. An unpaired t-test was used to evaluate levels of Gli3FL and Gli3R and the Gli3R/Gli3FL ratio in four control and fourInpp5eΔ/Δ embryos derived from four different litters. (E–L) Formation of basal progenitors and neurons in the neocortex of Inpp5eΔ/Δ and Inpp5eΔ/Δ;Gli3Δ699/+ embryos. In the lateral neocortex of E12.5 embryos, there is no significant difference in the proportions of Tbr1+ neurons (E, G, I, K) and basal progenitor cells (F, H, J, L) between control and Inpp5eΔ/Δ;Gli3Δ699/+ embryos. Note the three bulges of the ventral telencephalon in Inpp5eΔ/Δ;Gli3Δ699/+ embryos (J). Boxes indicate the regions where cell counts were performed. All statistical data are presented as means ± 95% confidence intervals (CI); unpaired t-tests (n = 5) (B–D) and one-way ANOVA followed by Tukey’s multiple comparison test (K, L); *p<0.05; **p<0.01; ***p<0.001. Scale bars: 250 μm (E), and 50 μm (E’). bv: blood vessel; ctx: cortex.
Figure 7—figure supplement 1
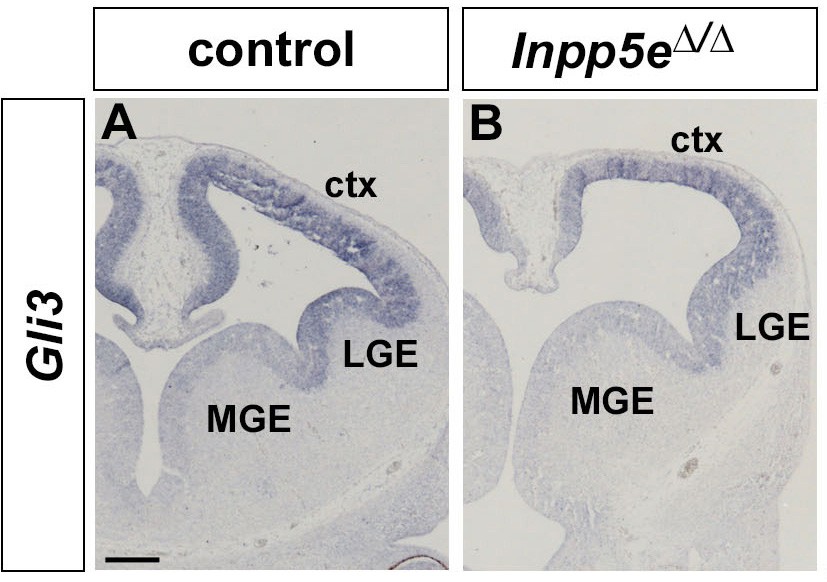
Gli3 mRNA expression in Inpp5e mutants.
(A, B) Gli3 in situ hybridization showing Gli3 mRNA expression in the cortex (ctx) and lateral ganglionic eminence (LGE) of control (A) and Inpp5eΔ/Δ embryos (B).
Figure 7—figure supplement 2
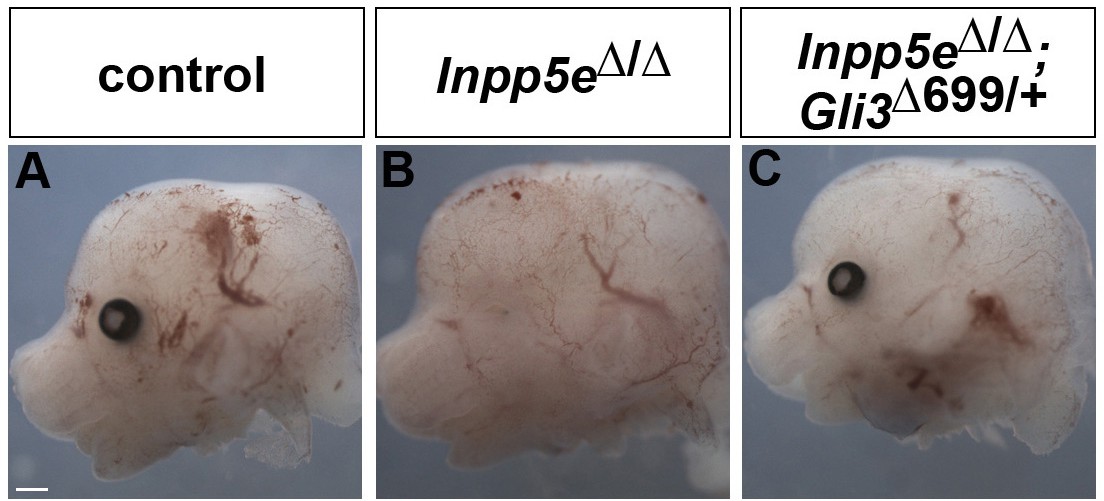
Rescue of eye development in Inpp5eΔ/Δ;Gli3Δ699/+ embryos.
(A–C) Side views of the heads of E12.5 embryos with the indicated genotype. Inpp5eΔ/Δ embryos lack the eye completely or only form a small remnant, whereas eye formation is not affected in Inpp5eΔ/Δ;Gli3Δ699/+ embryos. Scale bar: 1 mm.
Figure 7—figure supplement 3
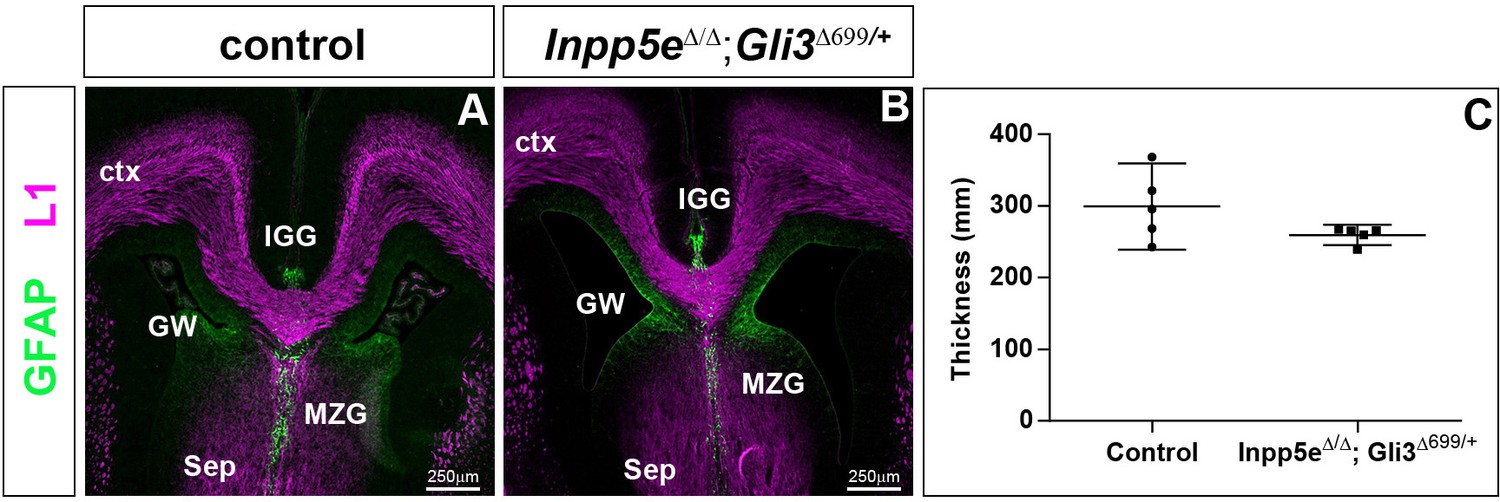
Rescue of corpus callosum formation in Inpp5eΔ/Δ;Gli3Δ699/+ embryos.
(A–B) Coronal section through the telencephalon stained with L1 and GFAP to reveal the corpus callosum (CC) and glial cells, respectively. There is no significant difference in the size of the corpus callosum between control and Inpp5eΔ/Δ;Gli3Δ699/+ embryos; the glial wedge (GW), the induseum griseum glia (IGG) and the midline zipper glia (MZG) are formed in their correct position. (C) Quantification of corpus callosum thickness. Statistical data are presented as means ± 95% confidence intervals (CI); Mann Whitney tests; n = 4; Scale bar: 250 μm.
Figure 8
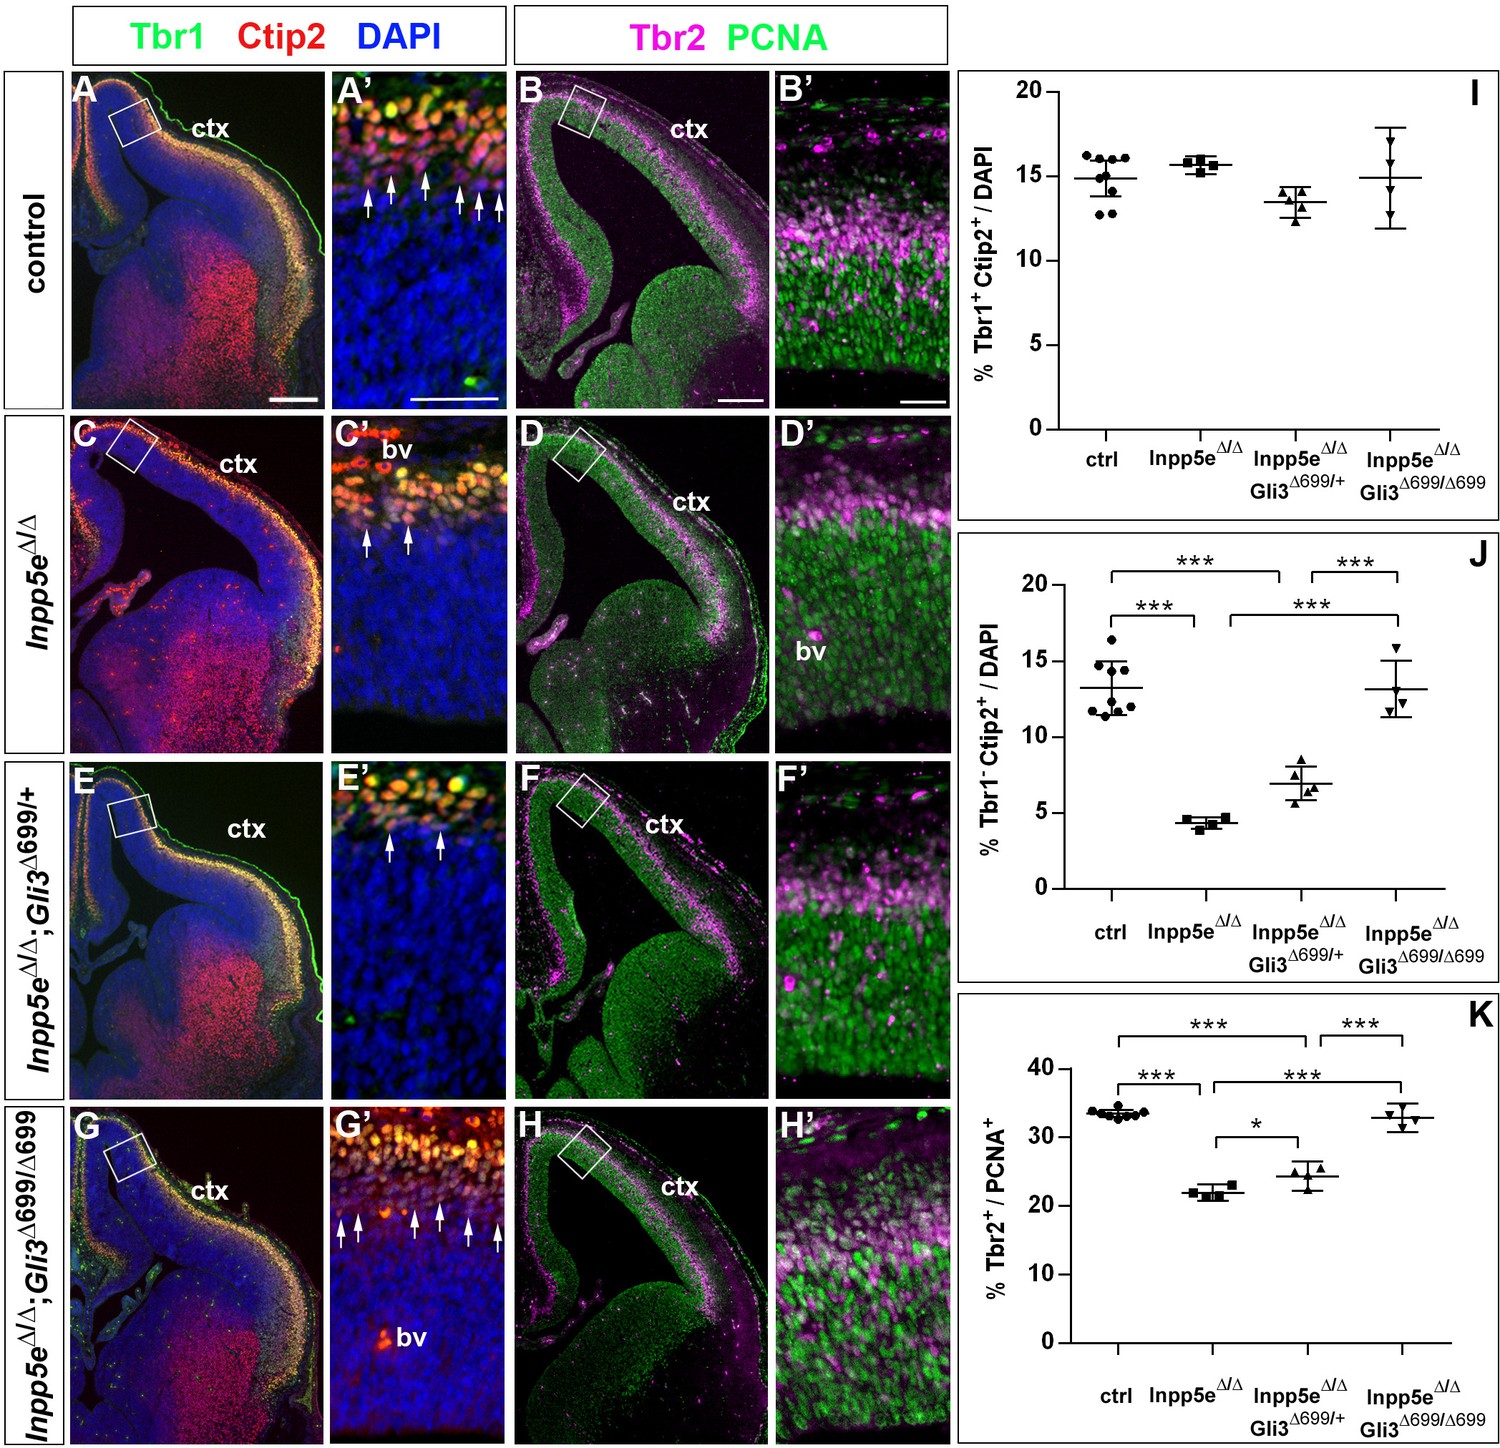
Two copies of the Gli3 repressor allele are required to rescue the neurogenesis defects in E14.5 Inpp5e mutants.
(A–H) Proportions of neurons (A, C, E, G) and basal progenitors (B D, F, H) in the medial neocortex of control, Inpp5eΔ/Δ, Inpp5eΔ/Δ;Gli3Δ699/+ and Inpp5eΔ/Δ;Gli3Δ699/Δ699 embryos. (A, C, E, G, J) The formation of Tbr1-Ctip2+ projection neurons is rescued after re-introducing two copies of the Gli3 repressor allele. (B, D, F, H, K) The proportion of basal progenitors is slightly increased in Inpp5eΔ/Δ;Gli3Δ699/+ embryos but a full rescue is only achieved in Inpp5eΔ/Δ;Gli3Δ699/Δ699 embryos. Boxes indicate the regions where cell counts were performed. All statistical data are presented as means ± 95% confidence intervals (CI); one-way ANOVA followed by Tukey’s multiple comparison test (I, J, K); *p<0.05; ***p<0.001. Scale bars: 250 μm (A, B), 50 μm (A’, B’). bv: blood vessel; ctx: cortex.
Figure 9
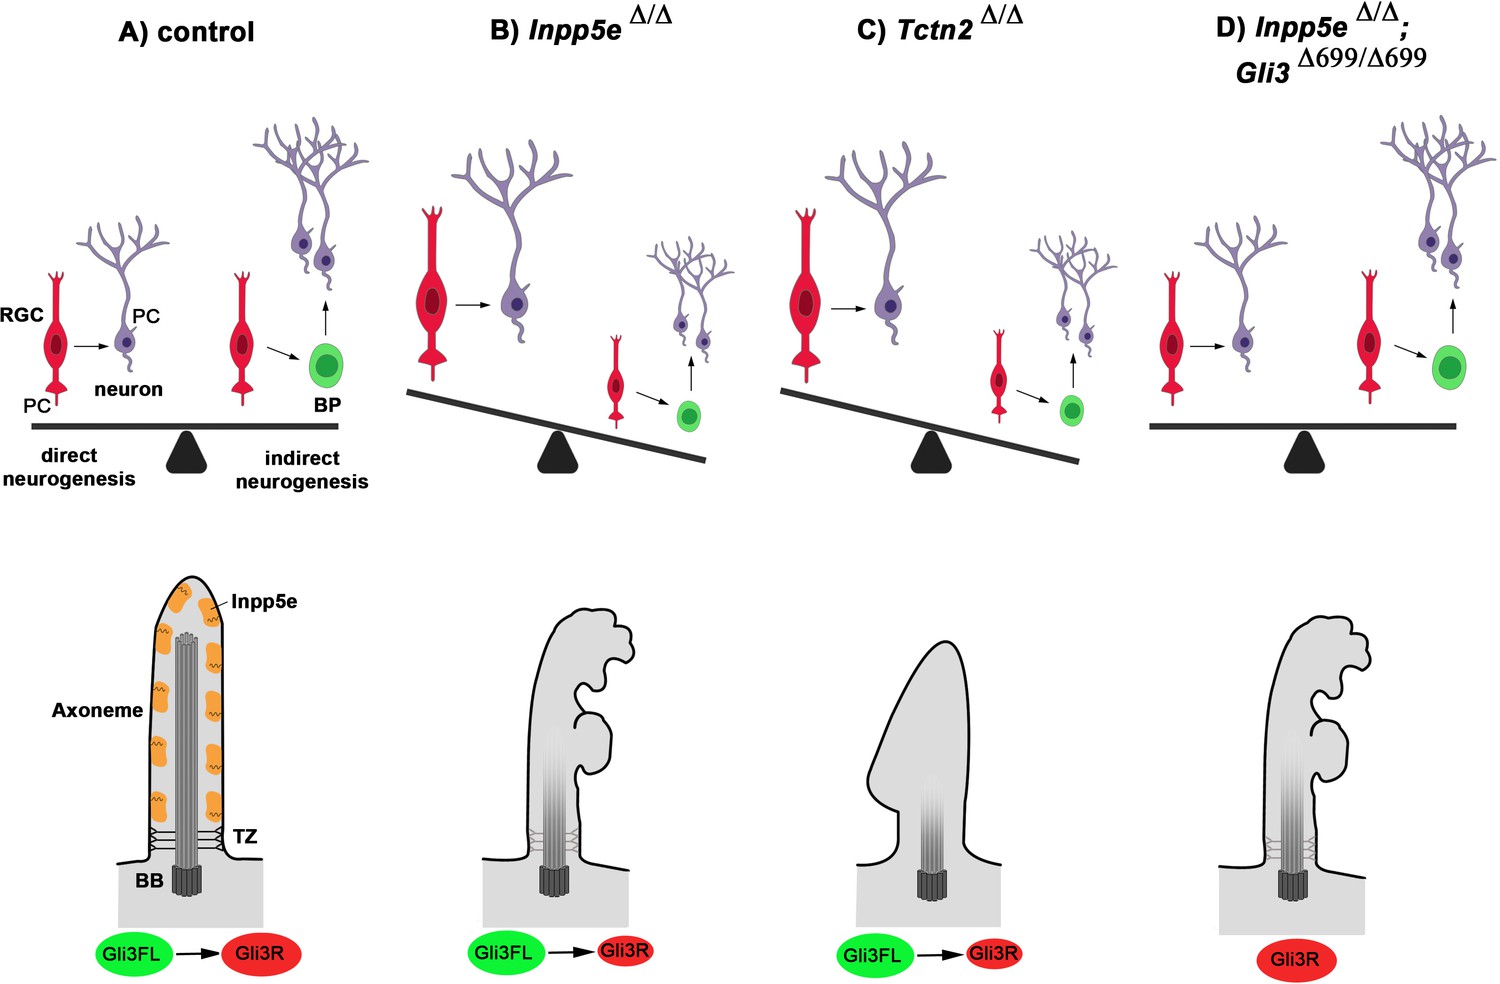
Model for Inpp5e’s role in controlling direct vs indirect neurogenesis in the developing cortex.
(A) A fine-tuned balance between direct and indirect neurogenesis is required to produce cortical neurons in appropriate numbers. The structure of a primary cilium and the ciliary localization of the Inpp5e protein are schematically indicated. (B) The Inpp5e mutation affects the axoneme (shaded microtubules) and ciliary morphology and may compromise the transition zone as indicated by the grayish colour (Dyson et al., 2017). Gli3R levels are reduced and there is a shift towarddirect neurogenesis. (C) Tctn2Δ/Δ embryos have morphologically abnormal cilia, a defective axoneme and transition zone (Garcia-Gonzalo et al., 2011), lack ciliary Inpp5e protein (Garcia-Gonzalo et al., 2015) and phenocopy the neurogenesis defect of Inpp5eΔ/Δ mutants. (D) Introducing Gli3R in an Inpp5e mutant background restores Gli3 levels and the balance between direct and indirect neurogenesis. BB: basal body; BP: basal progenitor; PC: primary cilium; RGC: radial glial cell; TZ: transition zone.
Author response image 1
Tables
Key resources table
| Reagent type (species) or resource | Designation | Source or reference | Identifiers | Additional information |
|---|---|---|---|---|
| Genetic reagent (Mus musculus) | Inpp5edelta (Inpp5etm1.2Sch) | PMID:19668215 | MGI:4360187 | |
| Genetic reagent (Mus musculus) | Gli3delta699 (Gli3tm1Urt) | PMID:11978771 | MGI:2182576 | |
| Genetic reagent (Mus musculus) | Tctn2delta (Tctn2tm1.1Reit) | PMID:21725307 | MGI:5292130 | |
| Antibody | Anti-Arl13b (clone N295B/66) (Mouse monoclonal) | UC Davis/NIH NeuroMab Facility | Cat# 75–287 RRID:AB_11000053 | IF (1:1500) |
| Antibody | Anti-BrdU (Rat monoclonal) | Abcam | Cat# ab6326 RRID:AB_305426 | IF (1:50) |
| Antibody | Anti-BrdU/IdU (B44) (Mouse monoclonal) | BD Biosciences | Cat# 347580 RRID:AB_2313824 | IF (1:500) |
| Antibody | Cleaved-Caspase3 (Asp175) (5A1E) (Rabbit polyclonal) | Cell Signaling Technology | Cat# 9664 RRID:AB_2070042 | IF (1:100) |
| Antibody | Anti-Ctip2 (Rat monoclonal) | Abcam | Cat# ab18465 RRID:AB_2064130 | IF (1:1000) |
| Antibody | Anti-GFAP (Rabbit polyclonal) | Agilent | Cat# Z0334 RRID:AB_10013382 | IF (1:1000) |
| Antibody | Anti-L1, clone 324 (Rat monoclonal) | Millipore | Cat# MAB5272 RRID:AB_2133200 | IF (1:1000) |
| Antibody | Anti-Pax6 (Rabbit polyclonal) | Biolegend | Cat# 901301 RRID:AB_2565003 | IF (1:400) |
| Antibody | Anti-PCNA (PC10) (Mouse monoclonal) | Abcam | Cat# ab29 RRID:AB_303394 | IF (1:500) |
| Antibody | Anti-Prox1 (Rabbit polyclonal) | Reliatech | Cat# 102-PA32 RRID:AB_10013821 | IHC (1:1000) |
| Antibody | Anti-pHH3 (Rabbit polyclonal) | Millipore | Cat# 06–570 RRID:AB_310177 | IF (1:100) |
| Antibody | Anti-Satb2 (Mouse monoclonal) | Abcam | Cat# ab51502 RRID:AB_882455 | IF (1:200) |
| Antibody | Anti-Tbr1 (Rabbit polyclonal) | Abcam | Cat# ab31940 RRID:AB_2200219 | IF (1:400) |
| Antibody | Anti-Tbr2 (Rabbit polyclonal) | Abcam | Cat# ab23345 RRID:AB_778267 | IF (1:1000) |
| Antibody | Anti−γTUB, (Rabbit polyclonal) | Sigma Aldrich | Cat# SAB4503045 RRID:AB_10747615 | IF (1:100) |
| Antibody | Anti-mouse Cy2 secondary (Donkey polyclonal) | Jackson ImmunoResearch Labs | Cat# 715-225-151 RRID:AB_2340827 | IF (1:100) |
| Antibody | Anti-rabbit Cy3 secondary (Donkey polyclonal) | Jackson ImmunoResearch Labs | Cat# 711-165-152 | IF (1:100) |
| Antibody | Anti-rat Cy3 secondary (Goat polyclonal) | Jackson ImmunoResearch Labs | Cat# 711-165-152 RRID:AB_2307443 | IF (1:100) |
| Antibody | Anti-rabbit Alexa Fluor 488 secondary (Goat polyclonal) | Molecular Probes (now: Invitrogen) | Cat# A-11008 RRID:AB_143165 | IF (1:200) |
| Antibody | Anti-rat Alexa Fluor 647 secondary (Goat polyclonal) | Molecular Probes (now: Invitrogen) | Cat# A-21247 RRID:AB_141778 | IF (1:200) |
| Antibody | Biotinylated swine anti-rabbit IgG | Dako | Cat# E0431 | IF (1:400) |
| Antibody | Streptavidin, Alexa Fluor 488 conjugate antibody | Molecular Probes (now: Invitrogen) | Cat# S32354 RRID:AB_2315383 | IF (1:100) |
| Antibody | Streptavidin, Alexa Fluor 568 conjugate antibody | Thermo Fisher Scientific | Cat# S-11226 RRID:AB_2315774 | IF (1:100) |
| Antibody | Biotinylated goat anti-rabbit IgG | Dako (now: Agilent) | Cat# E0432 RRID:AB_2313609 | IF (1:400) |
| Antibody | Anti-h/m Gli3 (Goat polyclonal) | R and D Systems | Cat# AF3690 RRID:AB_2232499 | WB (1:500) |
| Antibody | Anti-β-Actin (clone AC-15) (Mouse monoclonal) | Abcam | Cat# ab6276 RRID:AB_2223210 | WB (1:15,000) |
| Antibody | IRDye 680RD Donkey anti-Goat IgG | LI-COR Biosciences | Cat# 926–68074 RRID:AB_10956736 | WB (1:15,000) |
| Antibody | IRDye 800CW Donkey anti-Mouse IgG | LI-COR Biosciences | Cat# 925–32212 RRID:AB_2716622 | WB (1:15,000) |
| Commercial assay or kit | VECTASTAIN Elite ABC-Peroxidase Kit | Vector Laboratories | Cat# PK-6100 RRID:AB_2336819 | |
| Chemical compound, drug | IdU 5-Iodo-2′-deoxyuridine | Sigma Aldrich | Cat# I7125 | (10 mg/ml) |
| Chemical compound, drug | BrdU 5-Bromo-2′-deoxyuridine | Sigma Aldrich | Cat# B5002 | (10 mg/ml) |
| Software, algorithm | Fiji | PMID:22743772? | PRID:SCR_002285 | http://imagej.net/Fiji |
| Software, algorithm | Image Studio Lite | Li-Cor | 4.0 | |
| Software, algorithm | GraphPad Prism | GraphPad Software | 8.4.2 (679) | |
| Software, algorithm | Adobe Photoshop | Adobe Inc | 12.1 | |
| Other | DAPI (4',6-Diamidino-2-Phenylindole, Dihydrochloride) | Thermo Fisher Scientific | Cat# D1306 RRID:AB_2629482 | IF (1:2000) |
Additional files
-
Supplementary file 1
Summary of statistical tests.
- https://cdn.elifesciences.org/articles/58162/elife-58162-supp1-v2.xlsx
-
Transparent reporting form
- https://cdn.elifesciences.org/articles/58162/elife-58162-transrepform-v2.docx
Download links
A two-part list of links to download the article, or parts of the article, in various formats.
Downloads (link to download the article as PDF)
Open citations (links to open the citations from this article in various online reference manager services)
Cite this article (links to download the citations from this article in formats compatible with various reference manager tools)
A transient role of the ciliary gene Inpp5e in controlling direct versus indirect neurogenesis in cortical development
eLife 9:e58162.
https://doi.org/10.7554/eLife.58162


