Marked synergy by vertical inhibition of EGFR signaling in NSCLC spheroids shows SOS1 is a therapeutic target in EGFR-mutated cancer
- Department of Pharmacology and Molecular Therapeutics, Uniformed Services University of the Health Sciences, United States
Figures
Figure 1 with 2 supplements
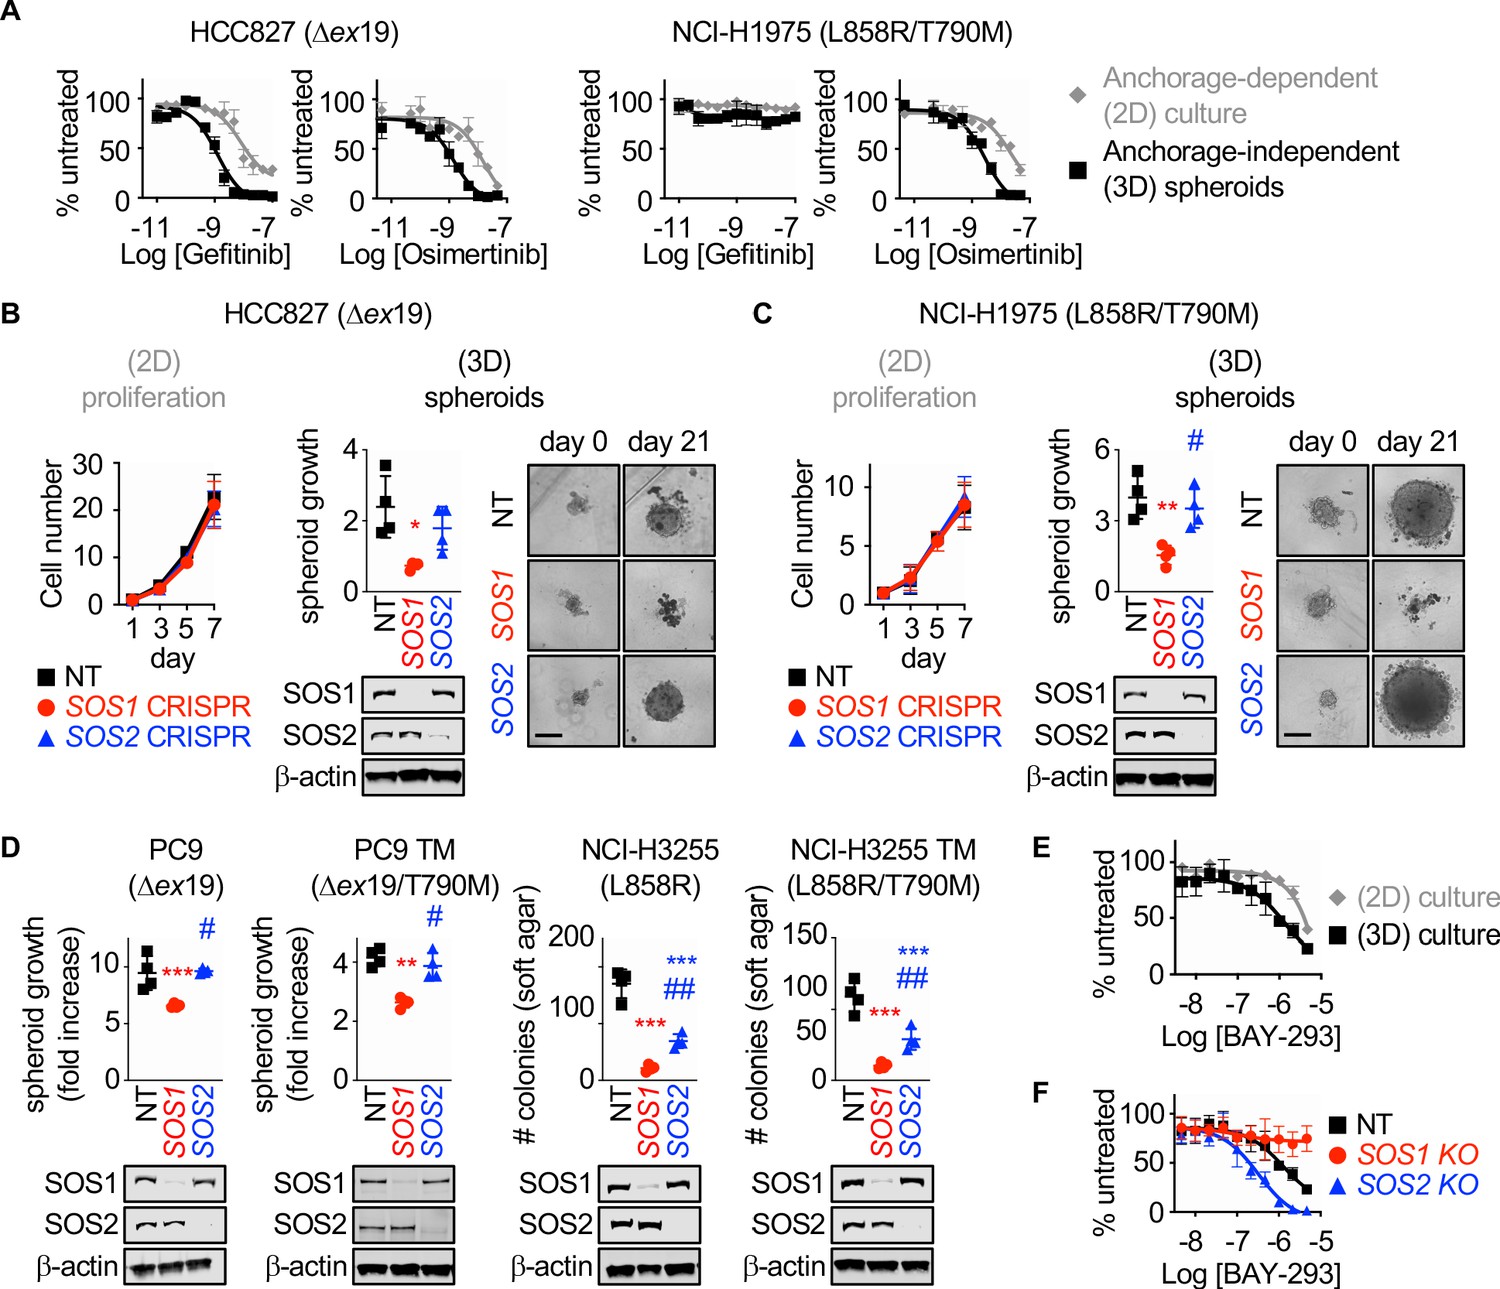
SOS1 deletion inhibits anchorage-dependent (3D) transformation in EGFR-mutated NSCLC cell lines.
(A) Dose-response curves of EGFR-mutated HCC827 (Δex19) (left) or NCI-H1975 (L858R/T790M) (right) cells treated with gefitinib or osimertinib under 2D anchorage-dependent (gray diamonds) or 3D spheroid (black squares) culture conditions. (B-C) 2D proliferation (left) or 3D spheroid growth (right) in pooled populations of (B) HCC827 or (C) NCI-H1975 cells where SOS1 or SOS2 has been deleted using CRISPR/Cas9 vs NT controls. 10x images of representative spheroids at day 0 and 21 are shown, scale bar = 250 mm. (D) 3D transformation in pooled populations of the indicated EGFR-mutated NSCLC cell lines where SOS1 or SOS2 has been deleted using CRISPR/Cas9 vs NT controls. (E) Dose-response curve cells of NCI-H1975 cells treated with the SOS1 inhibitor BAY-293 under 2D anchorage-dependent (gray diamonds) or 3D spheroid (black squares) culture conditions. Data are represented as cell # versus untreated for each individual cell line. (F) Dose-response curves of NCI-H1975 cells where SOS1 (red circles) or SOS2 (blue triangles) has been deleted using CRISPR/Cas9 vs NT controls (black squares) treated with BAY-293 under 3D spheroid culture conditions. For each condition, the untreated sample was set to 100%, and drug-treated samples were compared to untreated for each cell line. Dose-response curves and 2D proliferation are presented as mean +/- s.d. from a least three independent experiments. For transformation studies, data are from four independent experiments. Each individual experiment was performed using populations (not clones) of independently CRISPR’d cells. For each experiment, three technical replicates were assessed. Statistical significance was determined by ANOVA using Tukey’s method for multiple comparisons. *p<0.05, **p<0.01, ***p<0.001 vs. NT cells. # p<0.05, ##p<0.01 vs. SOS1 KO cells.
-
Figure 1—source data 1
The SOS1 inhibitor BAY-293 is specific for SOS1 and is enhanced bySOS2deletion in EGFR (T790M) mutated NSCLC cell lines.
- https://cdn.elifesciences.org/articles/58204/elife-58204-fig1-data1-v1.xlsx
Figure 1—figure supplement 1
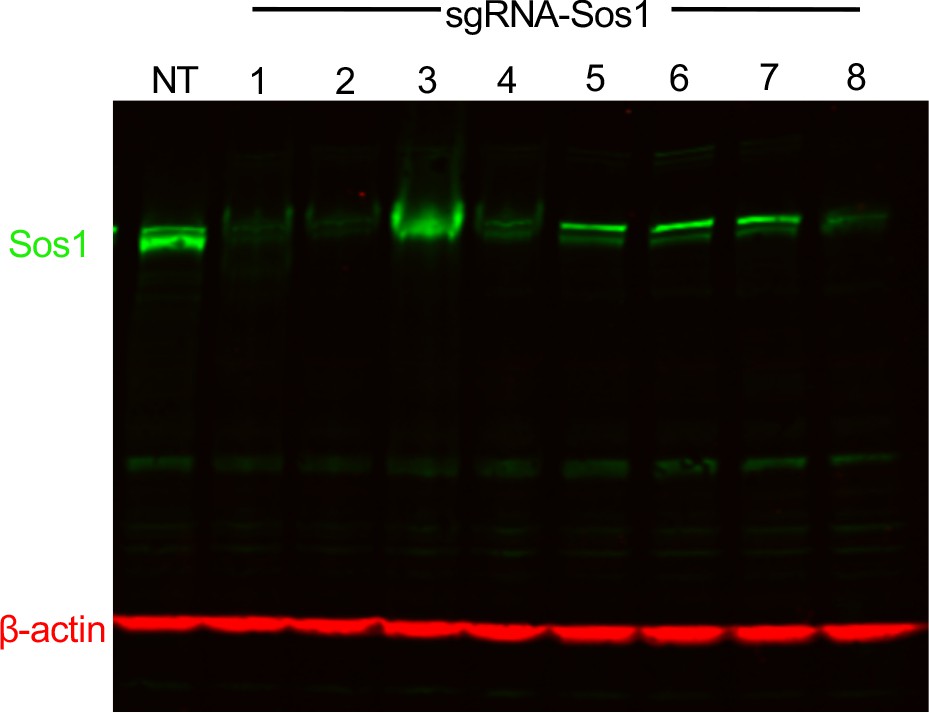
Deletion of SOS1 using CRISPR/Cas9.
293 T cells were transduced with lentiviruses expressing Cas9 and either a non-targeting sgRNA (NT) or one of eight different sgRNAs targeting SOS1. Whole cell lysates (WCLs) were analyzed by western blotting with antibodies specific for SOS1 or β-actin. SOS1 sgRNA constructs #1, #2, and #8 consistently showed >90% reduction in total SOS1 protein abundance. SOS1-2 was used for experiments in Figure 1.
Figure 1—figure supplement 2
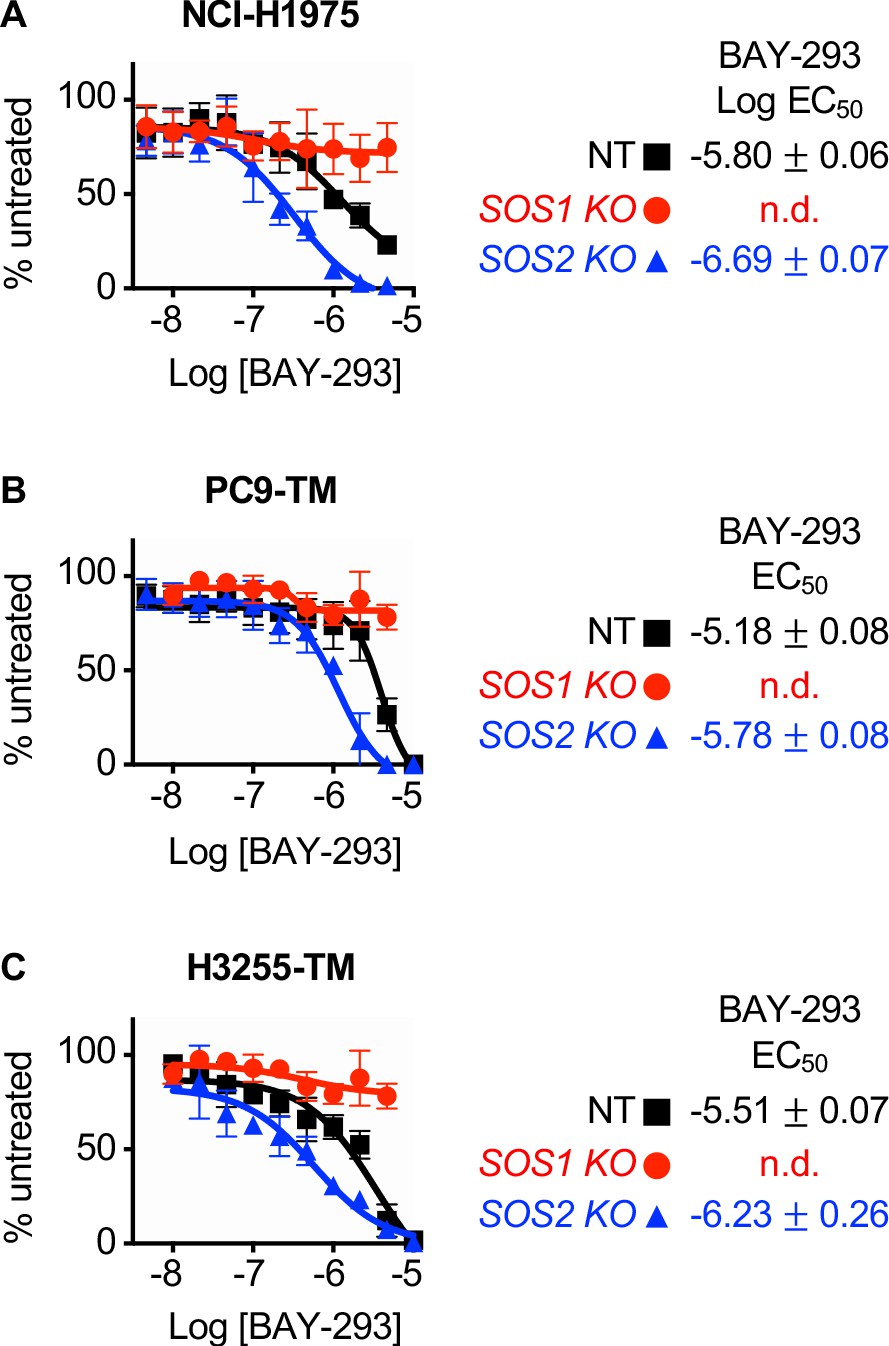
The SOS1 inhibitor BAY-293 is specific for SOS1 and is enhanced by SOS2 deletion in EGFR (T790M) mutated NSCLC cell lines.
(A-C) Dose-response curves of NCI-H1975 (A), PC9-TM (B), or H3255-TM (C) cells where SOS1 (red circles) or SOS2 (blue triangles) has been deleted using CRISPR/Cas9 vs NT controls (black squares) treated with BAY-293 under 3D spheroid culture conditions. For each condition, the untreated sample was set to 100%, and drug-treated samples were compared to untreated for each cell line. Data are presented as mean +/- s.d. from at least three independent experiments. Data are represented as cell # versus untreated for each individual cell line. For each experiment, three technical replicates were assessed.
Figure 2
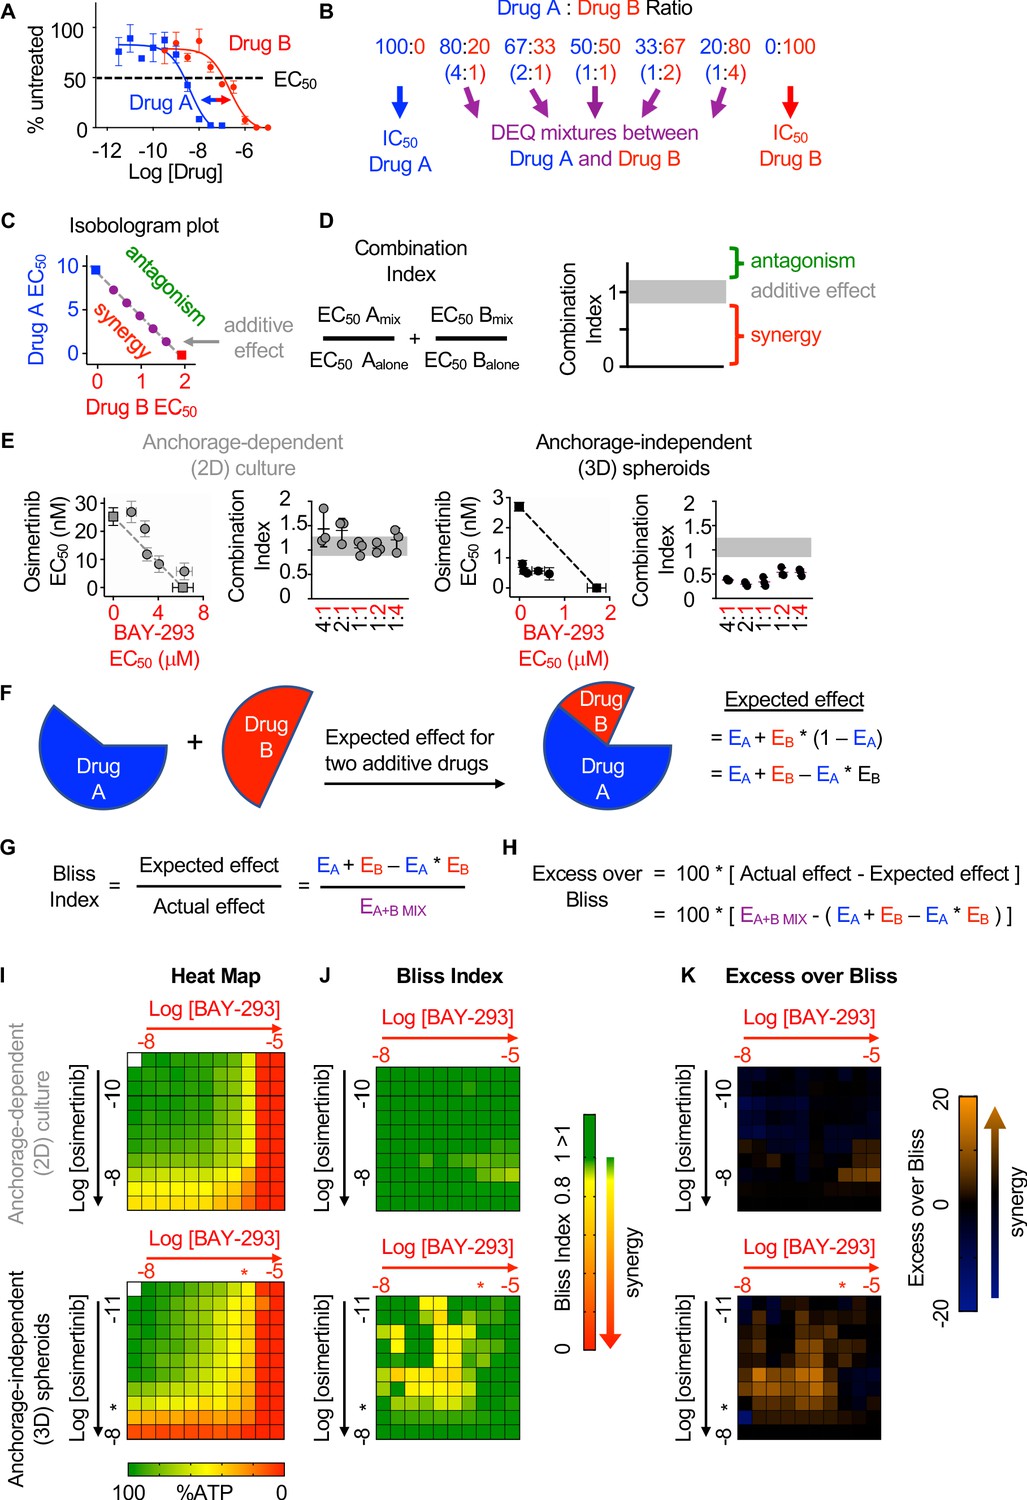
SOS1 inhibition synergizes with the EGFR-TKI inhibitor osimertinib to inhibit cell survival under anchorage-independent (3D) culture conditions.
(A-D) Isobologram analysis examines drug-drug synergy by comparing dose equivalent (DEQ) mixtures of two drugs based on their EC50 values to treatment with either drug alone (A and B). From the dose-response curves of the DEQ mixtures, plotting the fractional EC50 for each drug in the combination (purple) relative to the individual drug EC50 values (blue, red) on an isobologram plot (C) and calculation of the combination index (CI, D and E) allows assessment of drug-drug synergy. Additive effects occur on the dashed lines of the isobologram plot and have a CI 0.8–1.2 (gray box), whereas synergistic interactions fall below the dashed lines and have a CI <0.8. (E) Isobologram plots and CI from dose-equivalent treatments of H1975 EGFR-mutated NSCLC cells treated with DEQ combinations of osimertinib and BAY-293. Isobologram and CI data are presented as mean +/- s.d. from three independent experiments. (F) Bliss additivity evaluates whether the overall effect of an individual drug combination (EA+B mix) is greater than should be expected for two drugs with independent effects on the overall population (EA + EB – EA * EB). (G) The Bliss Index compares the ratio of the expected effect to the actual effect. Synergistic interactions have a Bliss Index < 0.85. (H) Excess over Bliss evaluates the magnitude of the difference between the actual and expected effects. Increasingly synergistic interactions show an excess over Bliss Index > 0. (I) Heat map of H1975 cells treated with the indicated doses of osimertinib and/or BAY-293 grown in either 2D (adherent) culture conditions or as 3D spheroids. Green indicates more cells, red indicates fewer cells. EC50 values for each individual drug are indicated by an *. (J) Heat map of Bliss Index assessing drug-drug synergy between osimertinib and BAY-293 at each dose combination from D. (K) Heat map of excess over Bliss assessing drug-drug synergy between osimertinib and BAY-293 at each dose combination from D. Bliss Index and excess-over Bliss are presented as the mean from three independent experiments. For each experiment, three technical replicates were assessed.
-
Figure 2—source data 1
SOS1 inhibition synergizes with the EGFR-TKI inhibitor osimertinib to inhibit cell survival under anchorage-independent (3D) culture conditions.
- https://cdn.elifesciences.org/articles/58204/elife-58204-fig2-data1-v1.xlsx
Figure 3 with 1 supplement
Isobologram analysis showing that SOS1 inhibition synergizes with EGFR-TKI treatment to inhibit survival in multiple EGFR-mutated NSCLC cell lines.
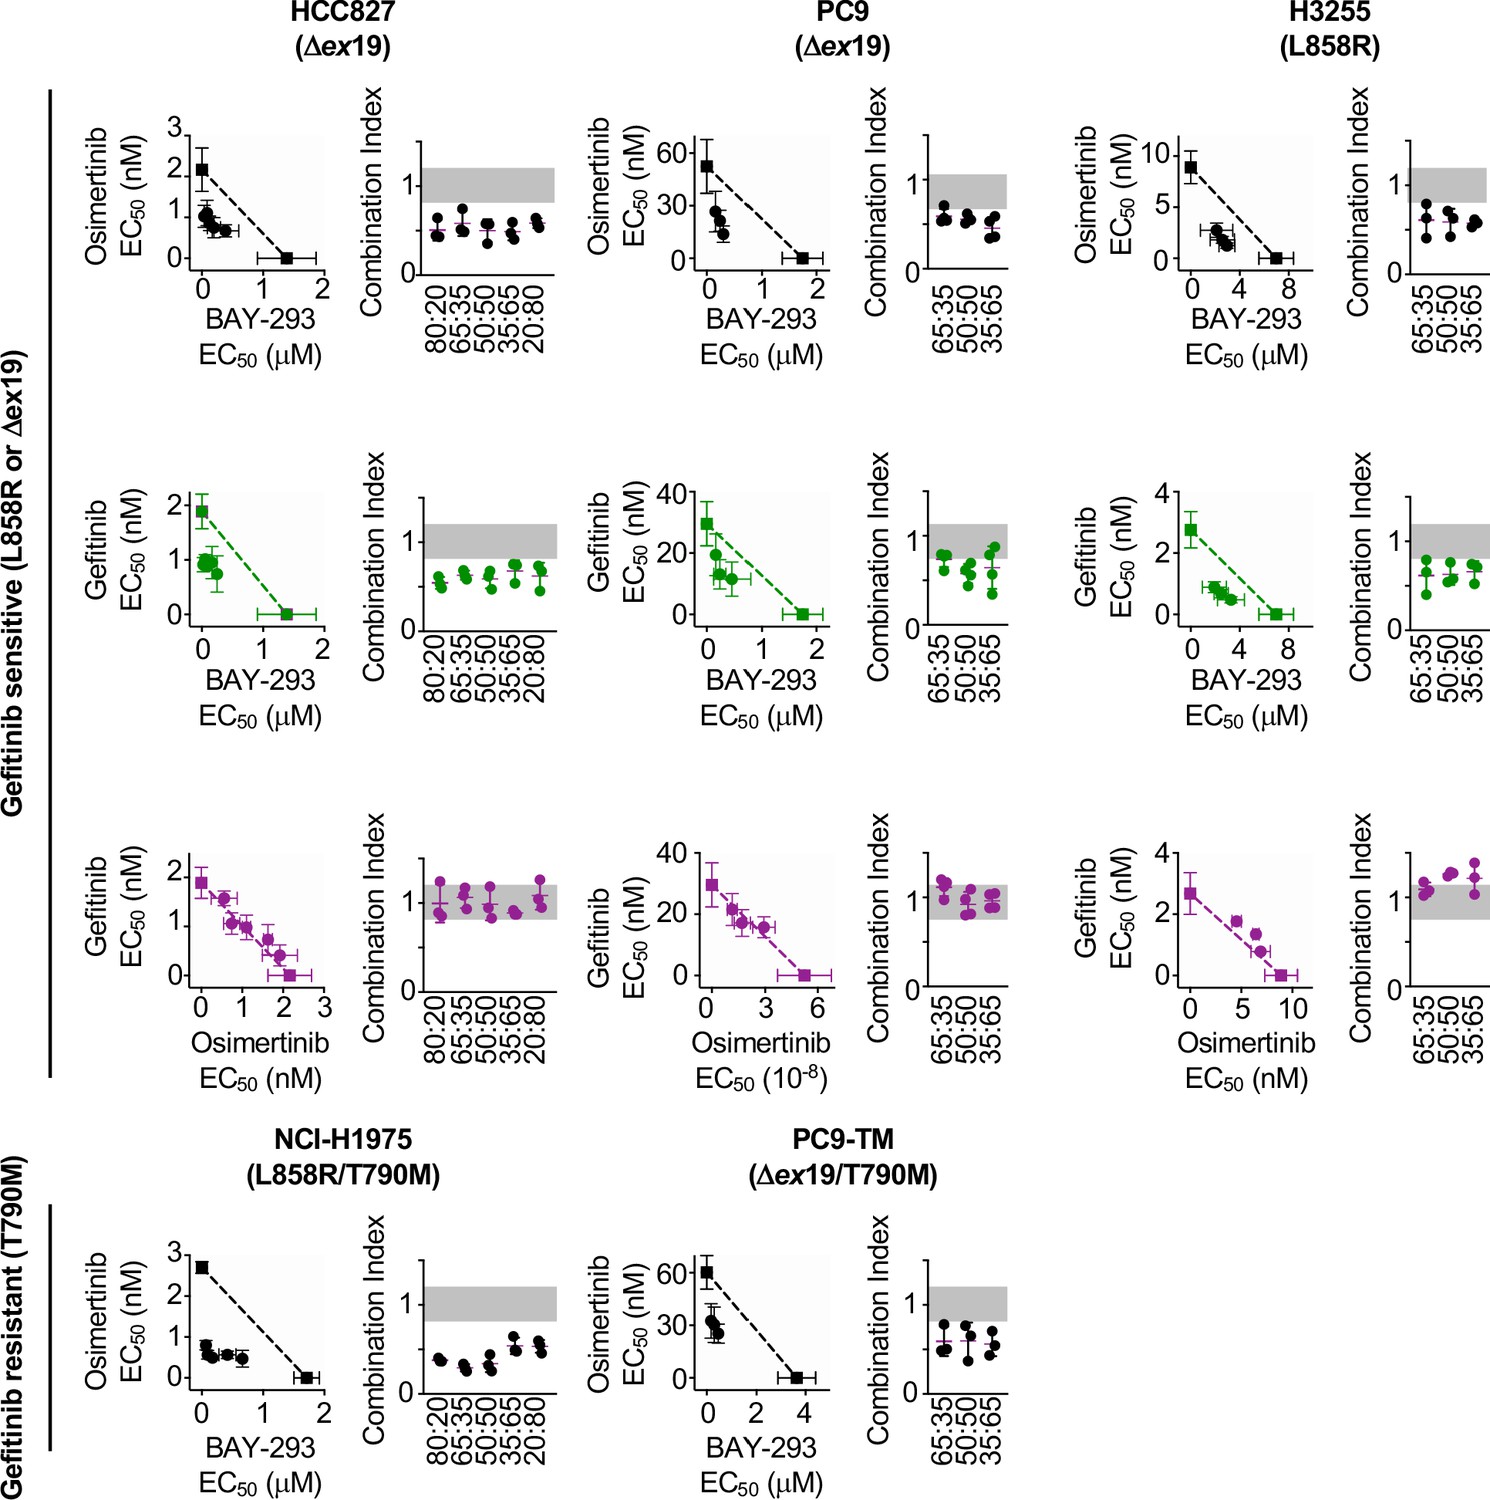
Isobologram analysis and Combination Index (CI) from dose-equivalent treatments of the indicated EGFR-mutated gefitinib-sensitive (L858R or Δex19, top) or gefitinib-resistant (T790M, bottom) NSCLC cell lines with combinations of gefitinib, osimertinib, and BAY-293. Additive effects occur on the dashed lines of the isobologram plot and have a CI 0.8–1.2 (gray box), whereas synergistic interactions fall below the dashed lines and have a CI <0.8. Data are presented as mean +/- s.d. from three independent experiments. For each experiment, three technical replicates were assessed.
-
Figure 3—source data 1
EGFR mutated NSCLC cell lines are responsive to osimertinib, BAY-293, and gefitinib in 3D spheroid cultures.
- https://cdn.elifesciences.org/articles/58204/elife-58204-fig3-data1-v1.xlsx
Figure 3—figure supplement 1
EGFR mutated NSCLC cell lines are responsive to osimertinib, BAY-293, and gefitinib in 3D spheroid cultures.
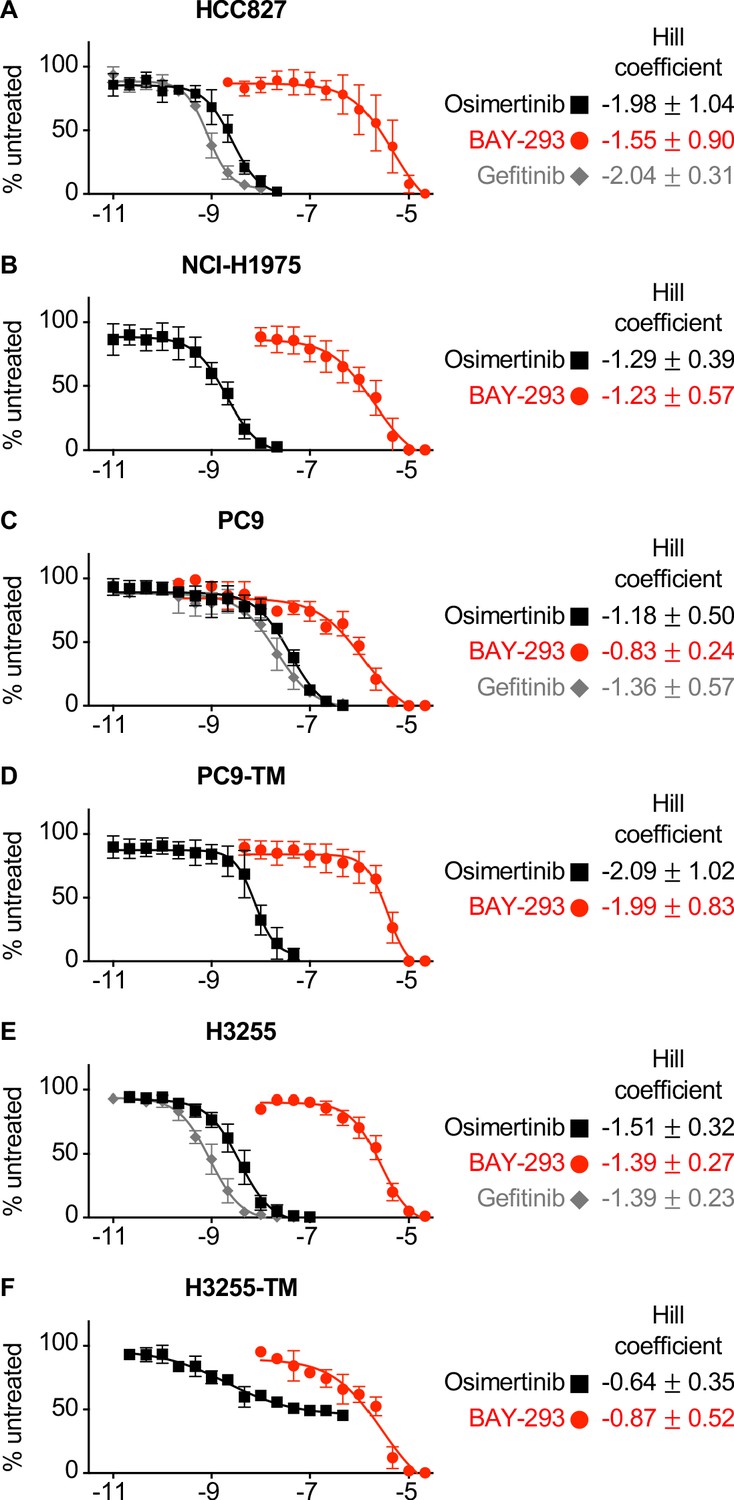
(A-F) Dose-response curves of 3D spheroid cultured HCC827 (A), NCI-H1975 (B), PC9 (C), PC9-TM (D), H3255 (E), or H3255-TM (F) cells to osimertinib (black squares), BAY-293 (red circles) or gefitinib (grey diamonds). Hill coefficients +/- s.d. are shown to the right. Data are presented as mean +/- s.d. from at least three independent experiments. For each experiment, three technical replicates were assessed.
Figure 4
Bliss Independence analysis showing that SOS1 inhibition synergizes with EGFR-TKI treatment to inhibit survival in multiple EGFR-mutated NSCLC cell lines.
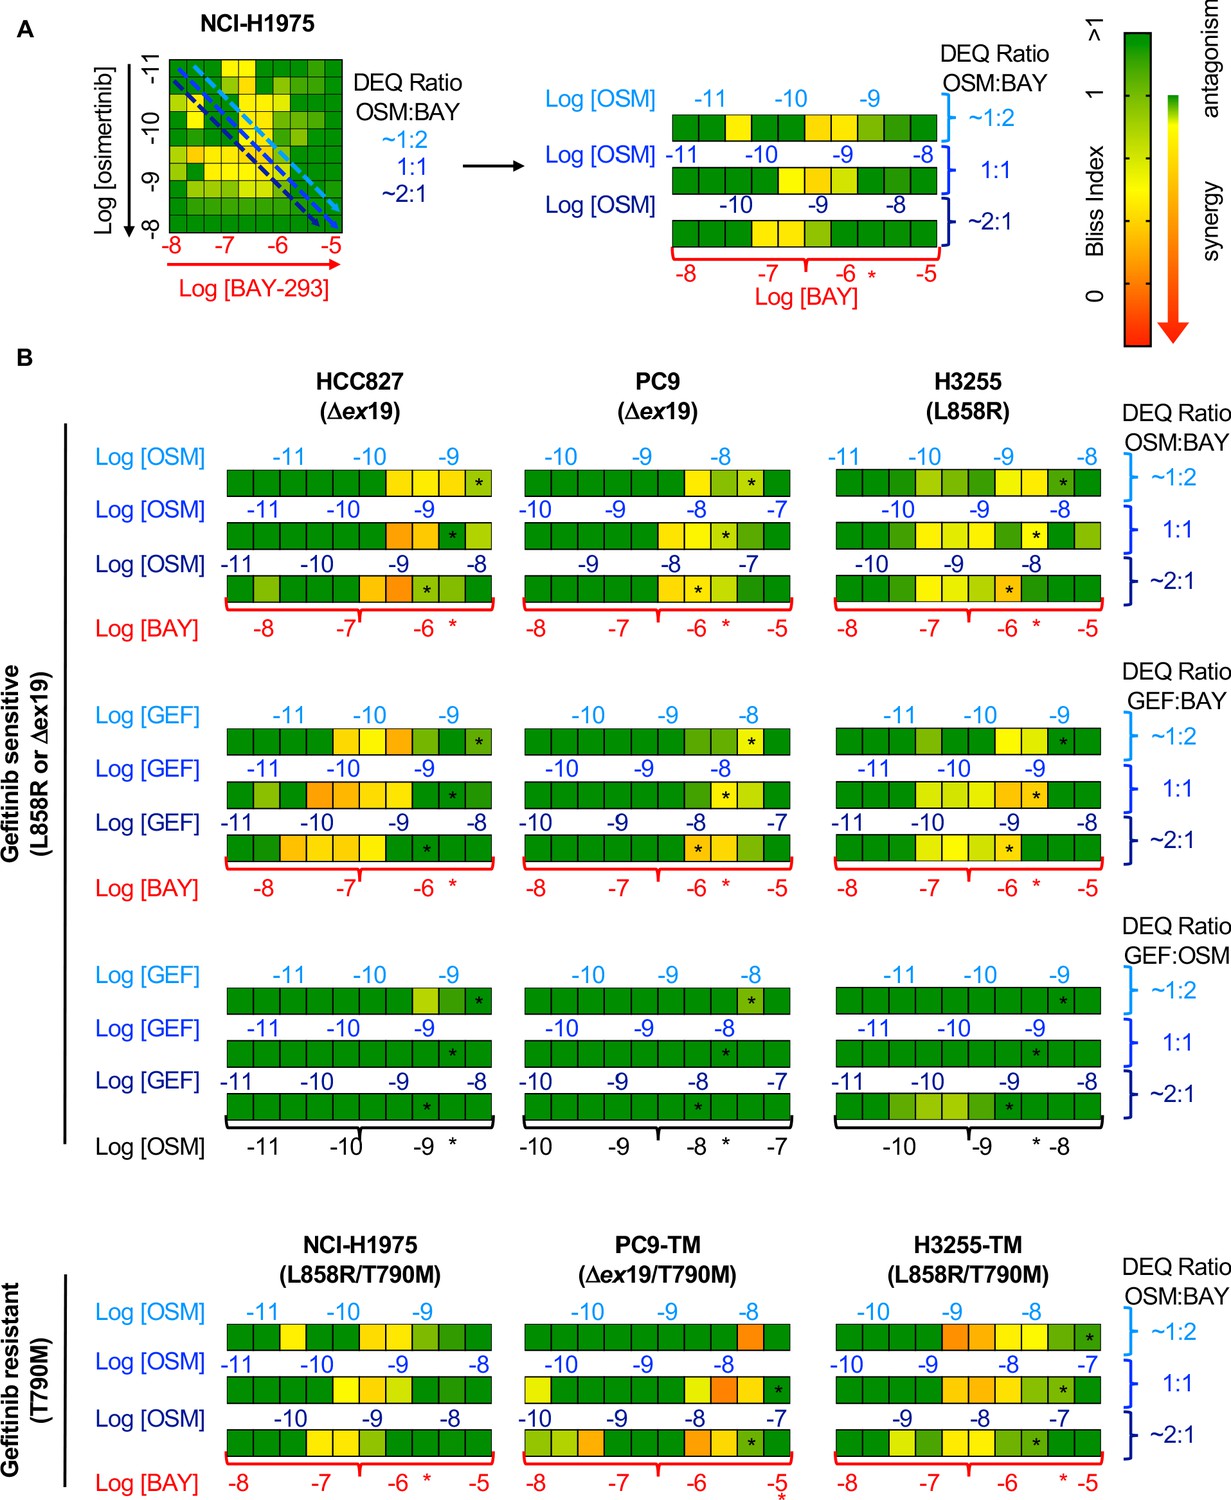
(A) Bliss Index heatmap from 3D spheroid cultured NCI-H1975 cells Figure 2A (left) and horizontal projections of Bliss Indices of drug treatments at 2:1, 1:1, and 1:2 ratios of osimertinib:BAY-293 based on dose equivalencies (right). Increasingly synergistic interactions (Bliss index <0.85) are indicated by the corresponding heat map. The concentration of BAY-293 (held constant, bottom) and of osimertinib (above each horizontal projection) are given. The IC50 for each individual drug are shown (*). (B) Bliss Index heatmaps based on A for the indicated gefitinib-sensitive and gefitinib-resistant cell lines at 2:1, 1:1, and 1:2 ratios of osimertinib, gefitinib, and BAY-293 based on dose equivalencies. Data for NCI-H1975 cells are the same as in A. Data are presented as the mean from three independent experiments. For each experiment, three technical replicates were assessed.
-
Figure 4—source data 1
Bliss Independence analysis showing that SOS1 inhibition synergizes with EGFR-TKI treatment to inhibit survival in multiple EGFR-mutated NSCLC cell lines.
- https://cdn.elifesciences.org/articles/58204/elife-58204-fig4-data1-v1.xlsx
Figure 5
SOS2 deletion does not enhance the synergistic interaction between SOS1 inhibition and EGFR-TKI treatment.
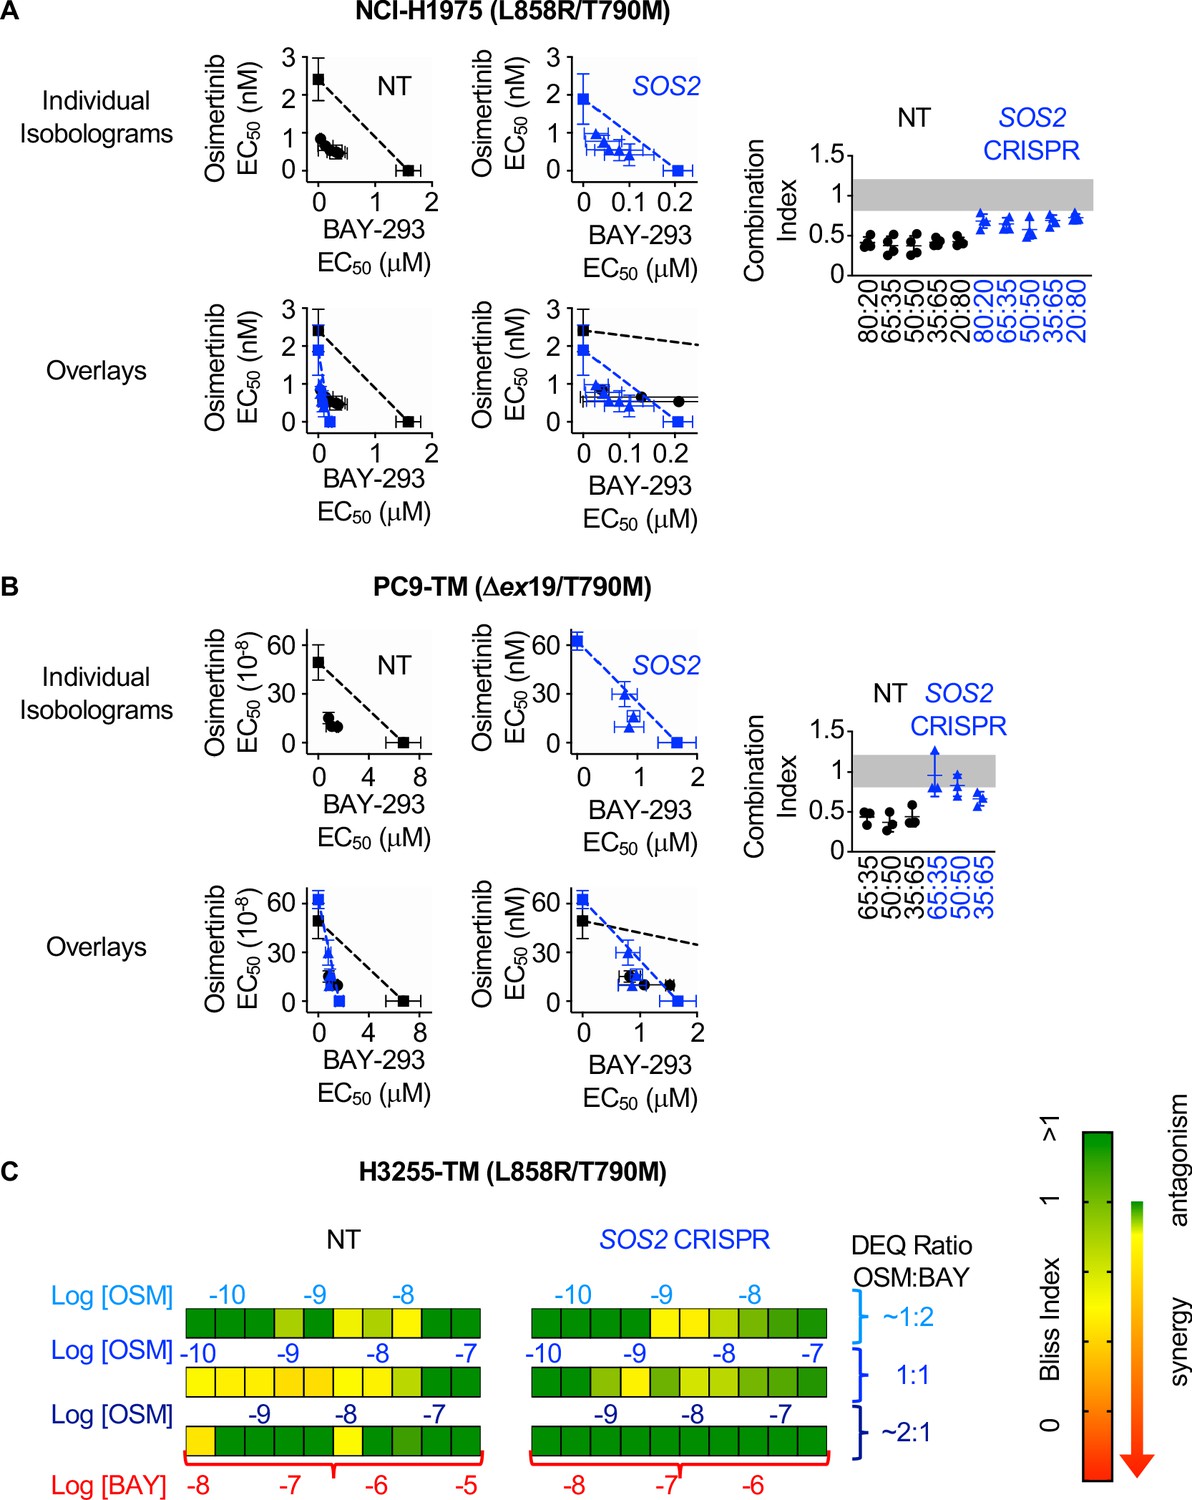
(A-B) Isobologram analysis (left) and Combination Index (right) from dose-equivalent treatments of osimertinib and BAY-293 in H1975 (A) or PC9-TM (B) cells where SOS2 has been deleted (blue) versus NT controls (black). Overlay plots on two different BAY-293 dosing scales are shown below the individual isobologram plots. Additive effects occur on the dashed lines of the isobologram plot and have a CI 0.8–1.2 (gray box), whereas synergistic interactions fall below the dashed lines and have a CI <0.8. (C) Bliss Index heatmaps for H3255-TM cells where SOS2 has been deleted versus NT controls treated at at 1:2, 1:1, and 2:1 ratios of osimertinib and BAY-293 based on dose equivalencies. Data are presented as mean +/- s.d. from three independent experiments. For each experiment, three technical replicates were assessed.
-
Figure 5—source data 1
SOS2 deletion does not enhance the synergistic interaction between SOS1 inhibition and EGFR-TKI treatment.
- https://cdn.elifesciences.org/articles/58204/elife-58204-fig5-data1-v1.xlsx
Figure 6
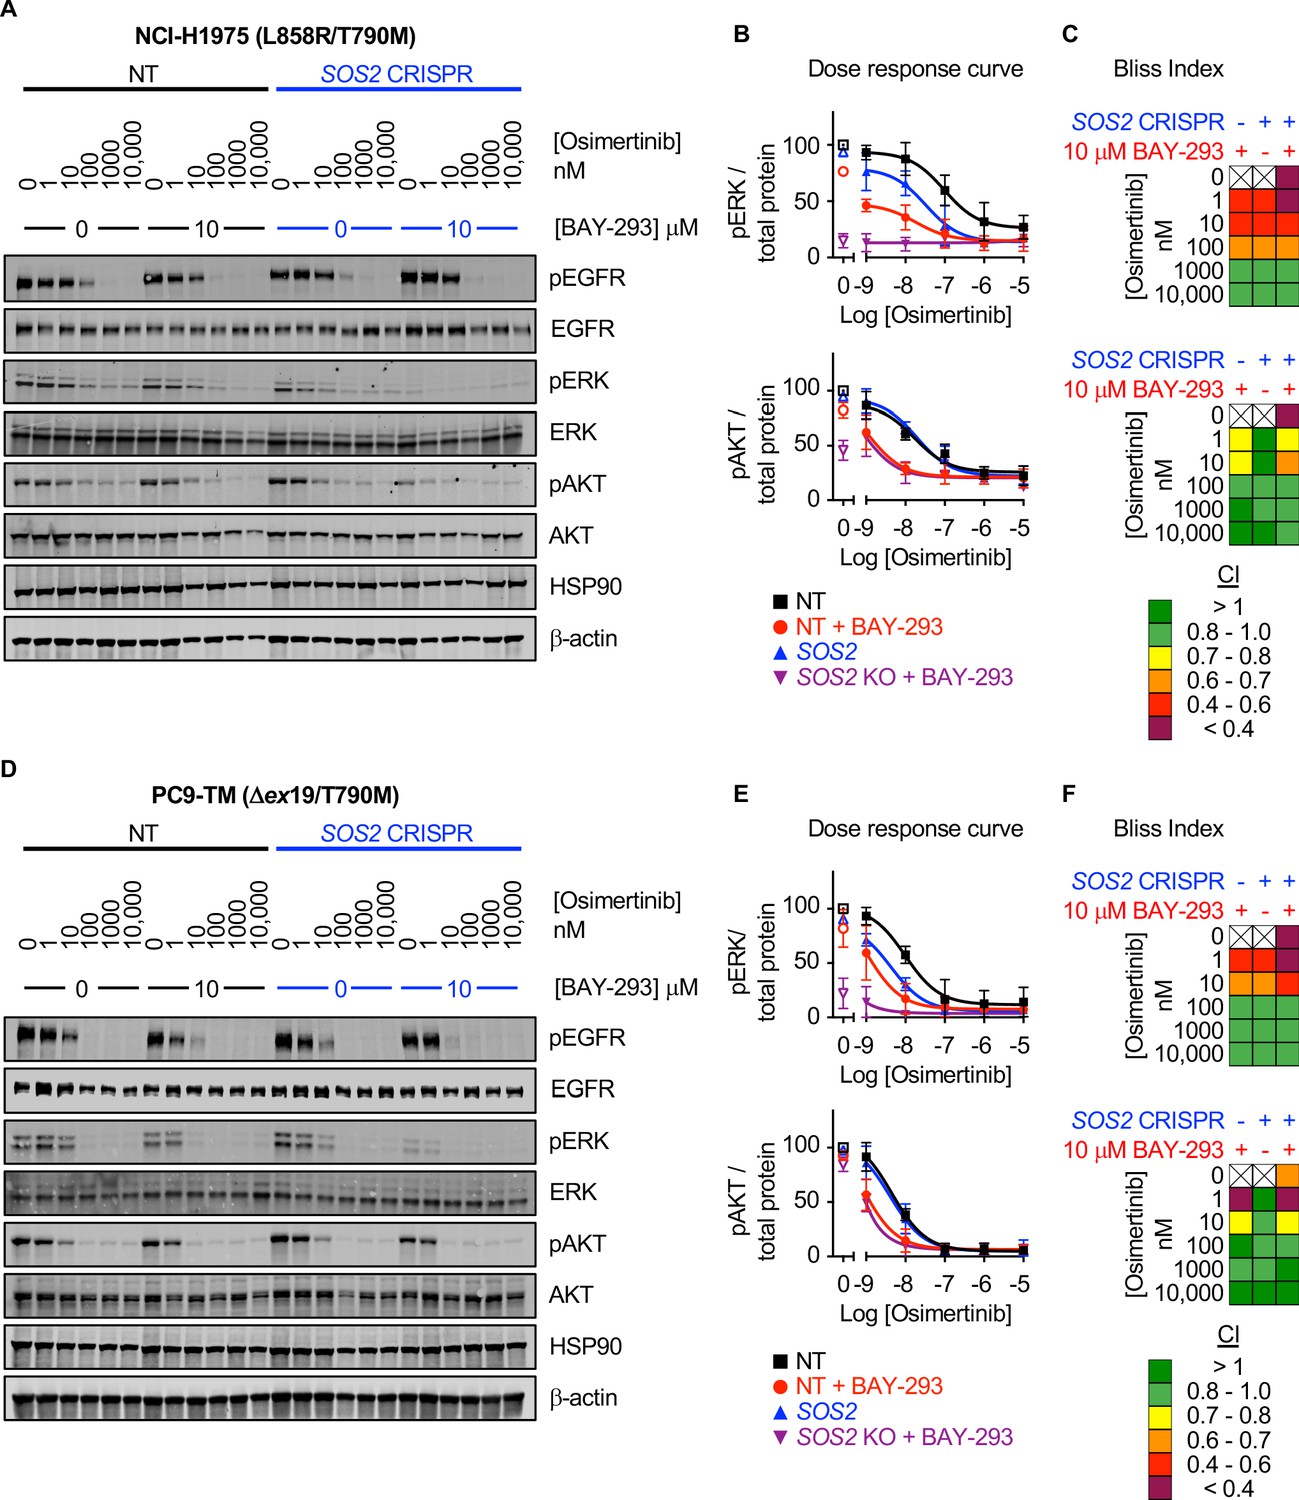
SOS1 inhibition synergizes with mutant EGFR inhibition to inhibit downstream effector signaling.
Western blots (A, D), pERK and pAKT quantitation (B, E), and Bliss Indices (C, F) of WCLs of NCI-H1975 cells (A-C, top) or PC9-TM cells (D-F, bottom) cultured under 3D spheroid conditions for 48 hr and then treated with the indicated concentrations of the EGFR-TKI osimertinib and/or the SOS1 inhibitor BAY-293 for 6 hr. Western blots are for pEGFR, EGFR, pAKT, AKT, pERK1/2, ERK1/2, HSP90, and β-actin. pERK and pAKT quantifications were calculated using a weighted average of total protein western blots. Combination Indices are based on pERK/Total protein and pAKT/Total protein quantitations. Increasingly synergistic combinations are indicated in yellow, orange, red, or purple. Phosphoprotein quantitations are presented as mean +/- s.d. from three independent experiments. Bliss indices are presented as mean from three independent experiments. For each experiment, three technical replicates were assessed.
-
Figure 6—source data 1
SOS1 inhibition synergizes with mutant EGFR inhibition to inhibit downstream effector signaling.
- https://cdn.elifesciences.org/articles/58204/elife-58204-fig6-data1-v1.xlsx
Figure 7
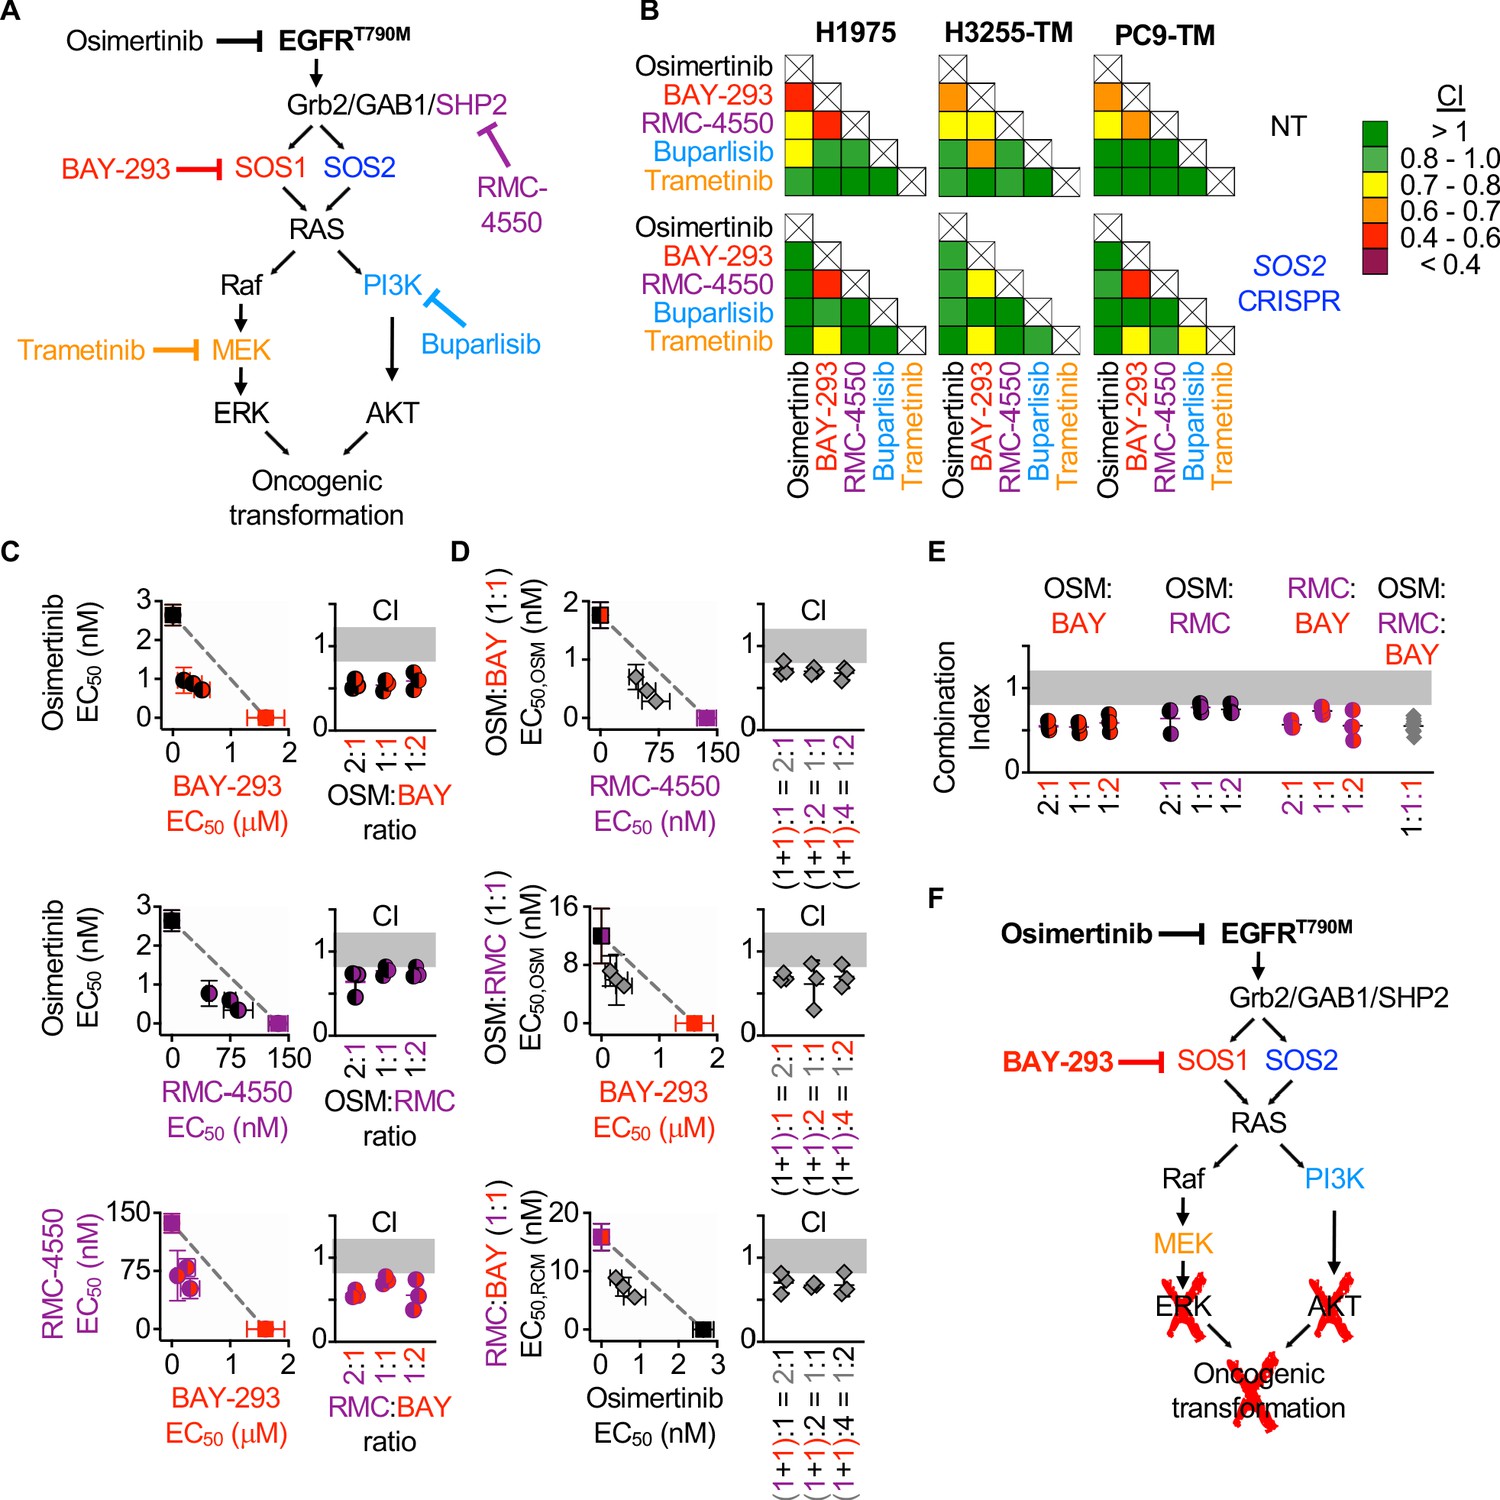
Assessment of the EGFR/RAS pathway ‘inhibitor landscape’ suggests that combination therapies inhibiting mutated EGFR, SOS1, and SHP2 have therapeutic potential in EGFR-mutated NSCLC.
(A) Signaling diagram showing EGFR/RAS pathway inhibitors that were assessed for pairwise synergy by isobologram analysis using 50:50 dose-equivalent mixes of each drug pair. (B) Heat map of Combination Indices from isobologram analyses of the indicated drug-drug combinations in NT and SOS2 KO NSCLC cell lines. Synergistic combinations are indicated in yellow, orange, or red. Data are presented as the mean from three independent experiments. (C-D) Isobologram analysis and Combination Index (CI) from dose-equivalent treatments of 3D spheroid cultured NCI-H1975 cells treated with the indicated two-drug (C) or three-drug (D) combinations of osimertinib (black), RMC-4550 (purple), and BAY-293 (red). For three drug combination, the two drugs indicated on the y-axis were held at a 1:1 ratio, and then mixed at dose equivalent ratiow with the third drug. CI values indicate enhanced synergy beyond the two drug combination on the y-axis of the isobologram plot and are calculated based on the y-axis drug combination calculated a s single drug treatment. Additive effects occur on the dashed lines of the isobologram plot and have a CI 0.8–1.2 (gray box), whereas synergistic interactions fall below the dashed lines and have a CI <0.8. (E) Combination indices from two-drug combinations of osimertinib (black), RMC-4550 (purple), and BAY-293 (red) mixed at 2:1, 1:1, or 1:2 ratios or the three drug combination at a 1:1:1 ratio (grey). CI are calculated based on three individual drug treatments. (F) Signaling model based on data from Figures 1–7 showing that combined targeting of mutated EGFR and SOS1 provides sufficient vertical inhibition of upstream signaling to inhibit RAS effector signaling and block oncogenic transformation. This synergistic inhibition can be further enhanced by SHP2 inhibition, providing multiple potential drug combinations for therapeutic intervention in EGFR-mutated NSCLC. Isobologram and CI data are presented as mean +/- s.d. from three independent experiments. For each experiment, three technical replicates were assessed.
-
Figure 7—source data 1
Assessment of the EGFR/RAS pathway ‘inhibitor landscape’ suggests that combination therapies inhibiting mutated EGFR, SOS1, and SHP2 have therapeutic potential in EGFR-mutated NSCLC.
- https://cdn.elifesciences.org/articles/58204/elife-58204-fig7-data1-v1.xlsx
Tables
Key resources table
| Reagent type (species) or resource | Designation | Source or reference | Identifiers | Additional information |
|---|---|---|---|---|
| Cell line (Homo sapiens) | Lung; adenocarcinoma; non-small cell lung cancer | Obtained from Udayan Guha, available at ATCC | NCI-H1975 CRL-5908 RRID:CVCL_UE30 | |
| Cell line (Homo sapiens) | Lung; adenocarcinoma; epithelial | Obtained from Udayan Guha, available at ATCC | HCC827 CRL-2868 RRID:CVCL_DH92 | |
| Cell line (Homo sapiens) | Lung; adenocarcinoma; non-small cell lung cancer | Obtained from Udayan Guha, available at NCI-DTP or ATCC | NCI-H3255 CRL-2882NCI-DTP Cat# NCI-H3255, RRID:CVCL_6831 | |
| Cell line (Homo sapiens) | Lung; adenocarcinoma; non-small cell lung cancer | de Bruin et al., 2014 | NCI-H3255TM | |
| Cell line (Homo sapiens) | Dermal fibroblast (normal, Adult) | Obtained from Udayan Guha, available at Millipore Sigma or BCRJ | PC9 #90071810 BCRJ Cat# 0331, RRID:CVCL_B260 | |
| Cell line (Homo sapiens) | Lung; adenocarcinoma; non-small cell lung cancer | Engelman et al., 2006 | PC9-TM | |
| Cell line (Homo sapiens) | Kidney; epithelial fibroblast (fetus) | ATCC | HEK-293T ATCC Cat# CRL-3216, RRID:CVCL_0063 | |
| Other | TransIT-Lenti | Mirus | Catalogue # MIR 6605 | Lentiviral transduction reagent |
| Other | MISSION Lentiviral packaging mix | Millipore Sigma | Catalogue # SHP001 | |
| Other | Bovine Serum Albumin | Millipore Sigma | Catalogue # A8022 | Cell culture reagent for ACL-4 media |
| Other | apo-Transferrin (human) | Millipore Sigma | Catalogue # T5391 | Cell culture reagent for ACL-4 media |
| Other | Sodium Selenite | Millipore Sigma | Catalogue # S9133 | Cell culture reagent for ACL-4 media |
| Other | Hydrocortisone | Millipore Sigma | Catalogue # H0135 | Cell culture reagent for ACL-4 media |
| Other | Ethanolamine | Millipore Sigma | Catalogue # E0135 | Cell culture reagent for ACL-4 media |
| Other | O-Phosphorylethanolamine | Millipore Sigma | Catalogue # P0503 | Cell culture reagent for ACL-4 media |
| Other | 3,3’,5-Triiodo-L-thyronine [T3] | Millipore Sigma | Catalogue # T5516 | Cell culture reagent for ACL-4 media |
| Other | Sodium Pyruvate | Millipore Sigma | Catalogue # P4562 | Cell culture reagent for ACL-4 media |
| Other | HEPES | Invitrogen | Catalogue # 15630–080 | Cell culture reagent for ACL-4 media |
| Other | Epidermal Growth Factor [EGF] | Millipore Sigma | Catalogue # E4127 | Cell culture reagent for ACL-4 media |
| Other | Recombinant Human Insulin | Millipore Sigma | Catalogue # I9278 | Cell culture reagent for ACL-4 media |
| Other | AggreWell 400 low-attachment culture plates | Stem Cell | Catalogue # 34415 | |
| Other | ultra-low attachment 96-well round bottomed plates | Corning Corstar | Catalogue # 7007 | |
| Other | Nunc Nucleon Sphera microplates | ThermoFisher | Catalogue # 174929 | |
| Other | coated 96-well white-walled CulturePlates | Perken Elmer | Catalogue # 6005688 | |
| Antibody | anti-Sos 1 Antibody (C-23): sc-256, rabbit polyclonal | Santa Cruz | sc-256 | (1:500) |
| Antibody | anti-SOS2 antibody (C-19): sc-258, rabbit polyclonal | Santa Cruz | sc-258 | (1:500) |
| Antibody | anti-β-actin antibody AC15, mouse monoclonal | Millipore Sigma | #A1978 | (1:5000) |
| Antibody | anti-Phospho-EGF Receptor (Tyr1068) (D7A5) XP Rabbit mAb #3777 | Cell Signaling Technology | #3777 | (1:1000) |
| Antibody | anti-phospho p44/42 MAPK (Erk1/2) (Thr202/Tyr204) (D13.14.4E) XPRabbit mAb #4370 | Cell Signaling Technology | #4370 | (1:1000) |
| Antibody | anti-p44/42 MAPK (Erk1/2) (L34F12) Mouse mAb #4696 | Cell Signaling Technology | #4696 | (1:1000) |
| Antibody | anti- Phospho-Akt (Ser473) (D9E) XPRabbit mAb #4060 | Cell Signaling Technology | #4060 | (1:1000) |
| Antibody | anti- Akt (pan) (40D4) Mouse mAb #2920 | Cell Signaling Technology | #2920 | (1:1000) |
| Antibody | anti-HSP 90α/β Antibody (H-114): sc-7947 | Santa Cruz | #sc-7947 | (1:1000) |
| Antibody | anti-EGF Receptor (D38B1) XPRabbit mAb #4267 | Cell Signaling Technology | #4267 | (1:1000) |
| Recombinant DNA Reagent | pLentiCrispr v2 | Sanjana et al., 2014 | ||
| Other | CellTiter-Glo 2.0 | Promega | G9243 | |
| Recombinant DNA reagent | pLentiCrispr. NT | Sheffels et al., 2018 | NT | sgRNA: CCATATCGGGGCGAGACATG |
| Recombinant DNA reagent | pLentiCrispr. SOS2-9 | Sheffels et al., 2018 | SOS2-9 | sgRNA: GAGAACAGTCCGAAATGGCG |
| Recombinant DNA reagent | pLentiCrispr. SOS1-1 | This manuscript | SOS1-1 | sgRNA: GGGCAGCTGCTGCGCCTGCA |
| Recombinant DNA reagent | pLentiCrispr. SOS1-2 | This manuscript | SOS1-2 | sgRNA: GCATCCTTTCCAGTGTACTC |
| Recombinant DNA reagent | pLentiCrispr. SOS1-3 | This manuscript | SOS1-3 | sgRNA: TATTCTGCATTGCTAGCACC |
| Recombinant DNA reagent | pLentiCrispr. SOS1-4 | This manuscript | SOS1-4 | sgRNA: AGTGGCATATAAGCAGACCT |
| Recombinant DNA reagent | pLentiCrispr. SOS1-5 | This manuscript | SOS1-5 | sgRNA: ATTGCAAGAGACAATGGACC |
| Recombinant DNA reagent | pLentiCrispr. SOS1-6 | This manuscript | SOS1-6 | sgRNA: GCTTATATGCCACTCAACTG |
| Recombinant DNA reagent | pLentiCrispr. SOS1-7 | This manuscript | SOS1-7 | sgRNA: GAAGGAACTCTTACACGTGT |
| Recombinant DNA reagent | pLentiCrispr. SOS1-8 | This manuscript | SOS1-8 | sgRNA: CTATTGGGTGTAAGGTGAGC |
Additional files
-
Source data 1
Supplemental raw data.
- https://cdn.elifesciences.org/articles/58204/elife-58204-data1-v1.xlsx
-
Transparent reporting form
- https://cdn.elifesciences.org/articles/58204/elife-58204-transrepform-v1.docx
Download links
A two-part list of links to download the article, or parts of the article, in various formats.
Downloads (link to download the article as PDF)
Open citations (links to open the citations from this article in various online reference manager services)
Cite this article (links to download the citations from this article in formats compatible with various reference manager tools)
Marked synergy by vertical inhibition of EGFR signaling in NSCLC spheroids shows SOS1 is a therapeutic target in EGFR-mutated cancer
eLife 9:e58204.
https://doi.org/10.7554/eLife.58204


