IL18 signaling promotes homing of mature Tregs into the thymus
- Department of Immunology, Weizmann Institute of Science, Israel
- Centre for Genomic Regulation (CRG), Barcelona Institute of Science and Technology (BIST), Spain
- Universitat Pompeu Fabra (UPF), Spain
Figures
Figure 1 with 2 supplements
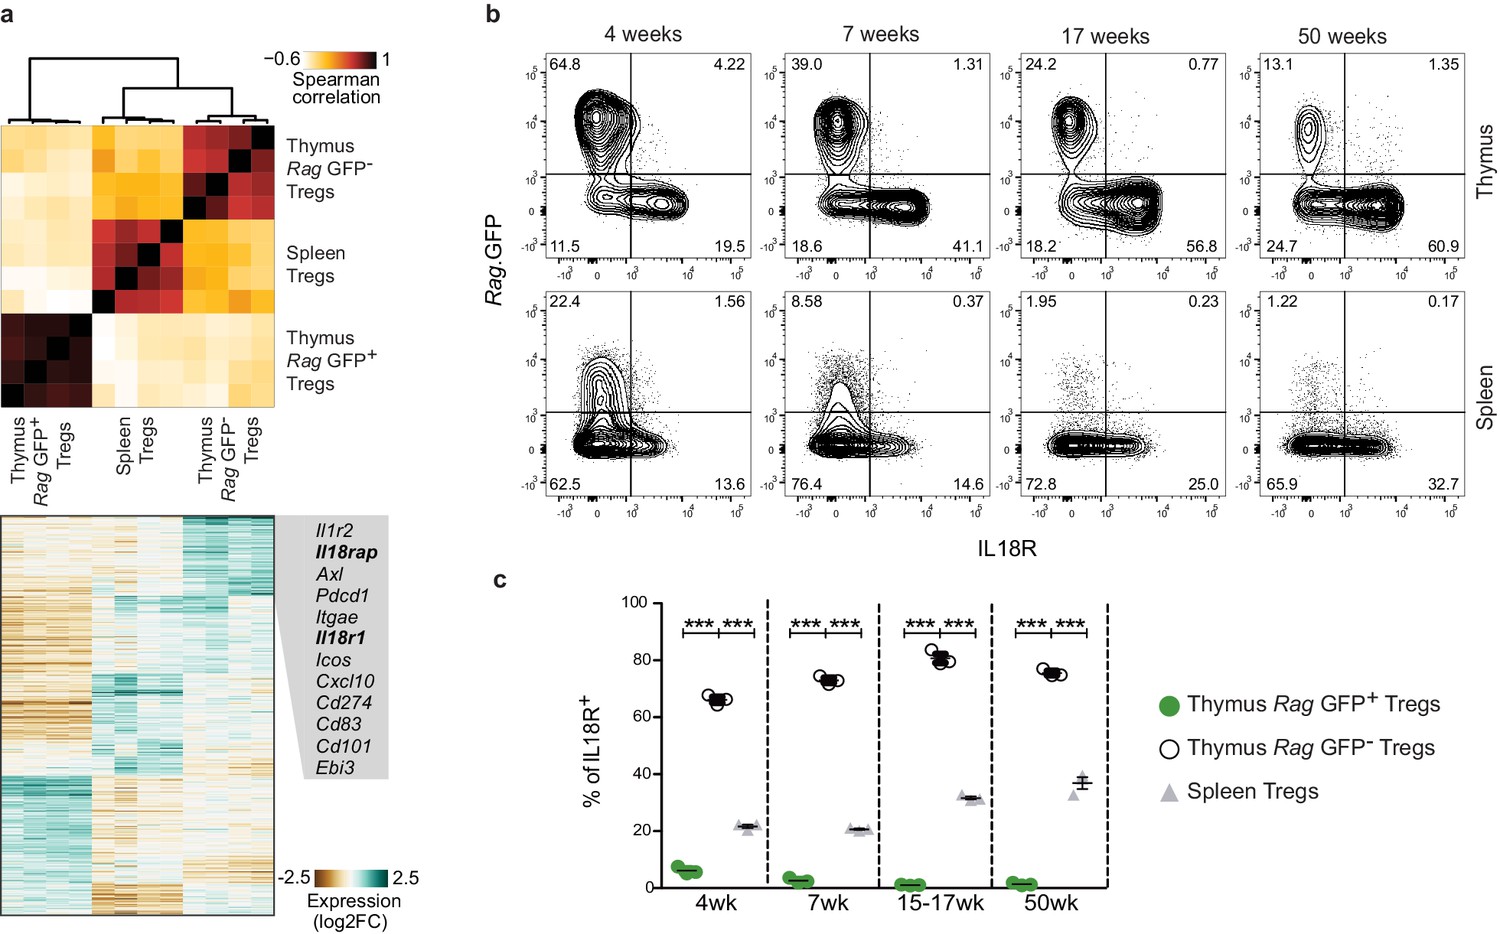
A subpopulation of mature Tregs in the thymus expresses IL18R.
(a) Top, a heatmap showing Spearman's correlation coefficient between different samples based on the expression of differentially expressed genes. Samples include four biological replicates each of Rag.GFP- Tregs from the thymus, Tregs from the spleen, and Rag.GFP+ Tregs from the thymus. Bottom, a heatmap showing the normalized expression of variable genes across samples. Specific genes upregulated in Rag.GFP- Tregs are highlighted. (b) Representative flow cytometry plot showing the expression of IL18R in Tregs from the thymus (up) and the spleen (down). Numbers indicate the percentage of cells within each gate. (c) Frequency of IL18R+ cells among ‘newly produced’ Rag.GFP+ Tregs in the thymus (green dots), ‘mature’ Rag.GFP- Tregs in the thymus (white dots) and Tregs in the spleen (gray triangles) in mice from different ages. Each dot represents an individual mouse. The mean ± SEM (standard error of the mean) is shown. Data are from one representative experiment with three biological replicates. Significant differences were determined using a 2-way ANOVA, corrected for multiple comparisons by the Bonferroni method and indicated by asterisks ***p<0.001.
Figure 1—figure supplement 1
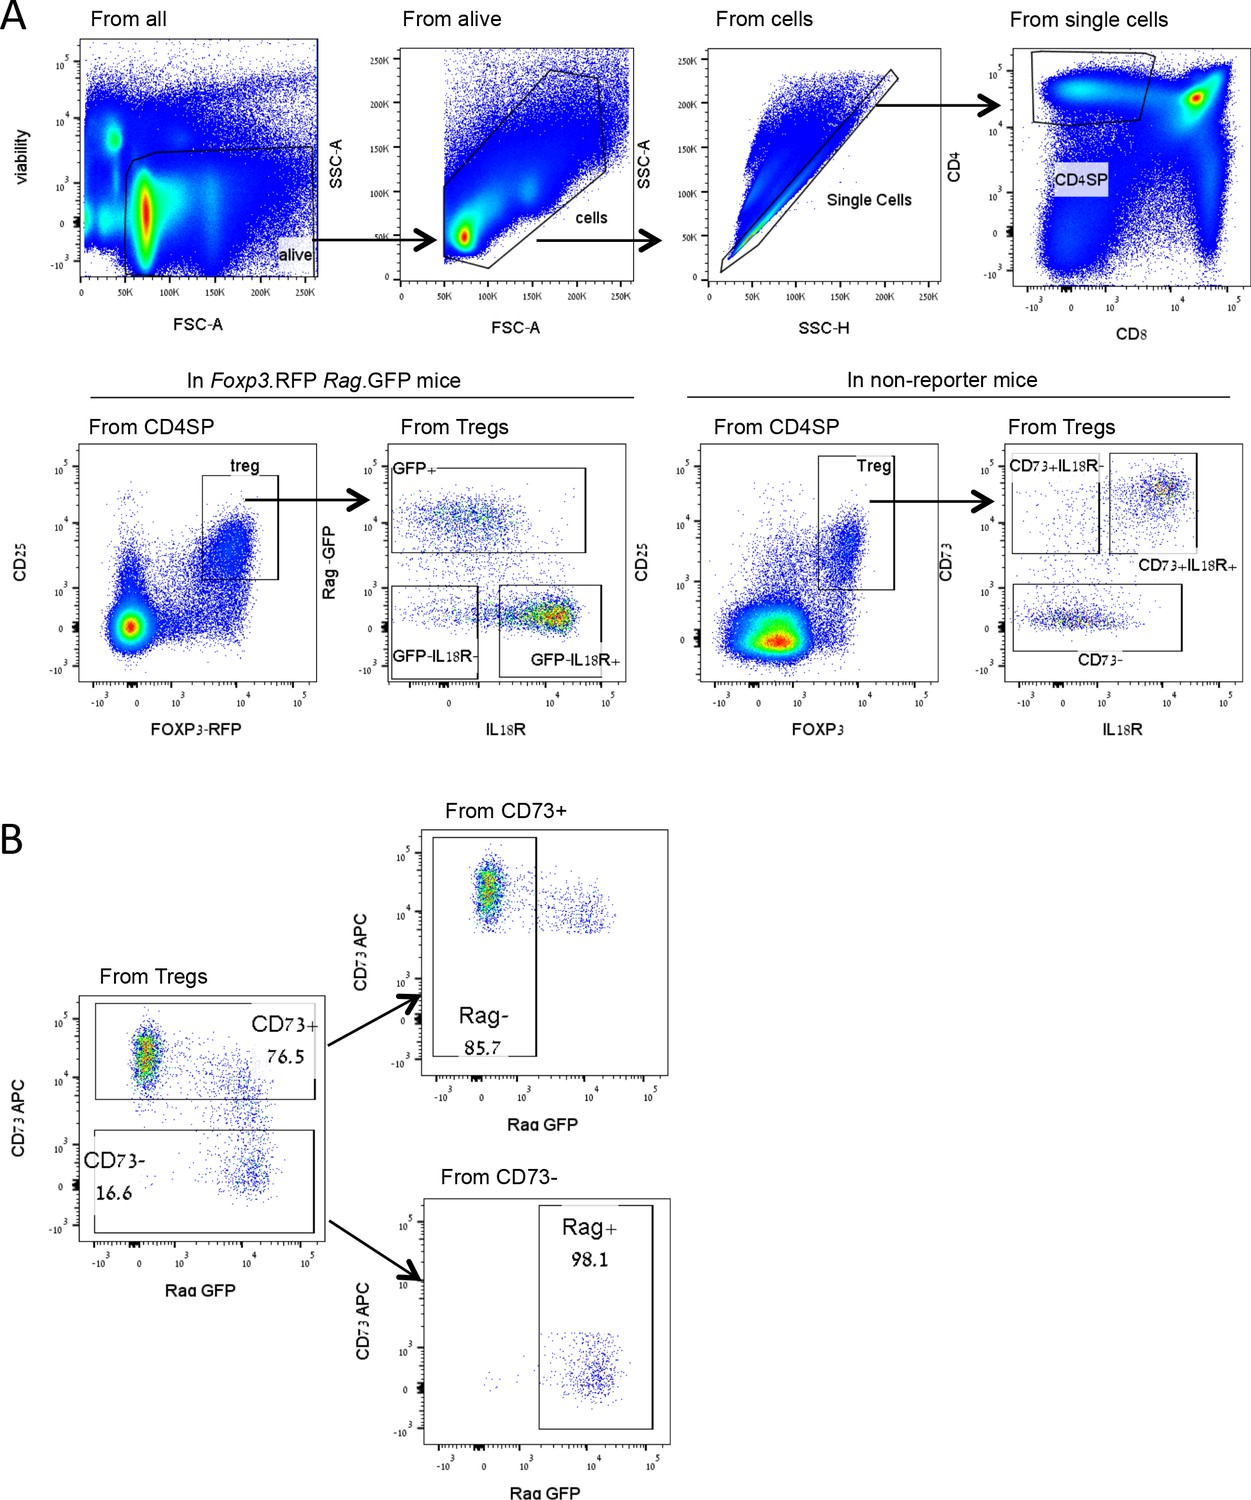
Treg gating strategy.
(A) Representative FACS plots demonstrating the Treg gating strategy used to identify newly produced Tregs (GFP+ or CD73-) and mature Tregs (older) (GFP- or CD73+) in the thymus of Foxp3.RFP Rag.GFP reporter mice or mice without reporter, respectively. (B) Validation of CD73 staining as a marker for mature Tregs in the thymus. Thymocytes of Rag.GFP Foxp3.RFP mice were stained with fluorescently labeled antibodies. The frequency of Rag.GFP+ or Rag.GFP- Tregs from CD73+ and CD73- Treg populations were analyzed. Numbers indicate the percentage of cells within each gate. Over 85% of CD73+ Tregs are Rag.GFP-, while over 98% of CD73- Tregs are RagGFP+ as previously described by Owen et al., 2019. Representative FACS plots from mice 8–10 weeks old are shown.
Figure 1—figure supplement 2
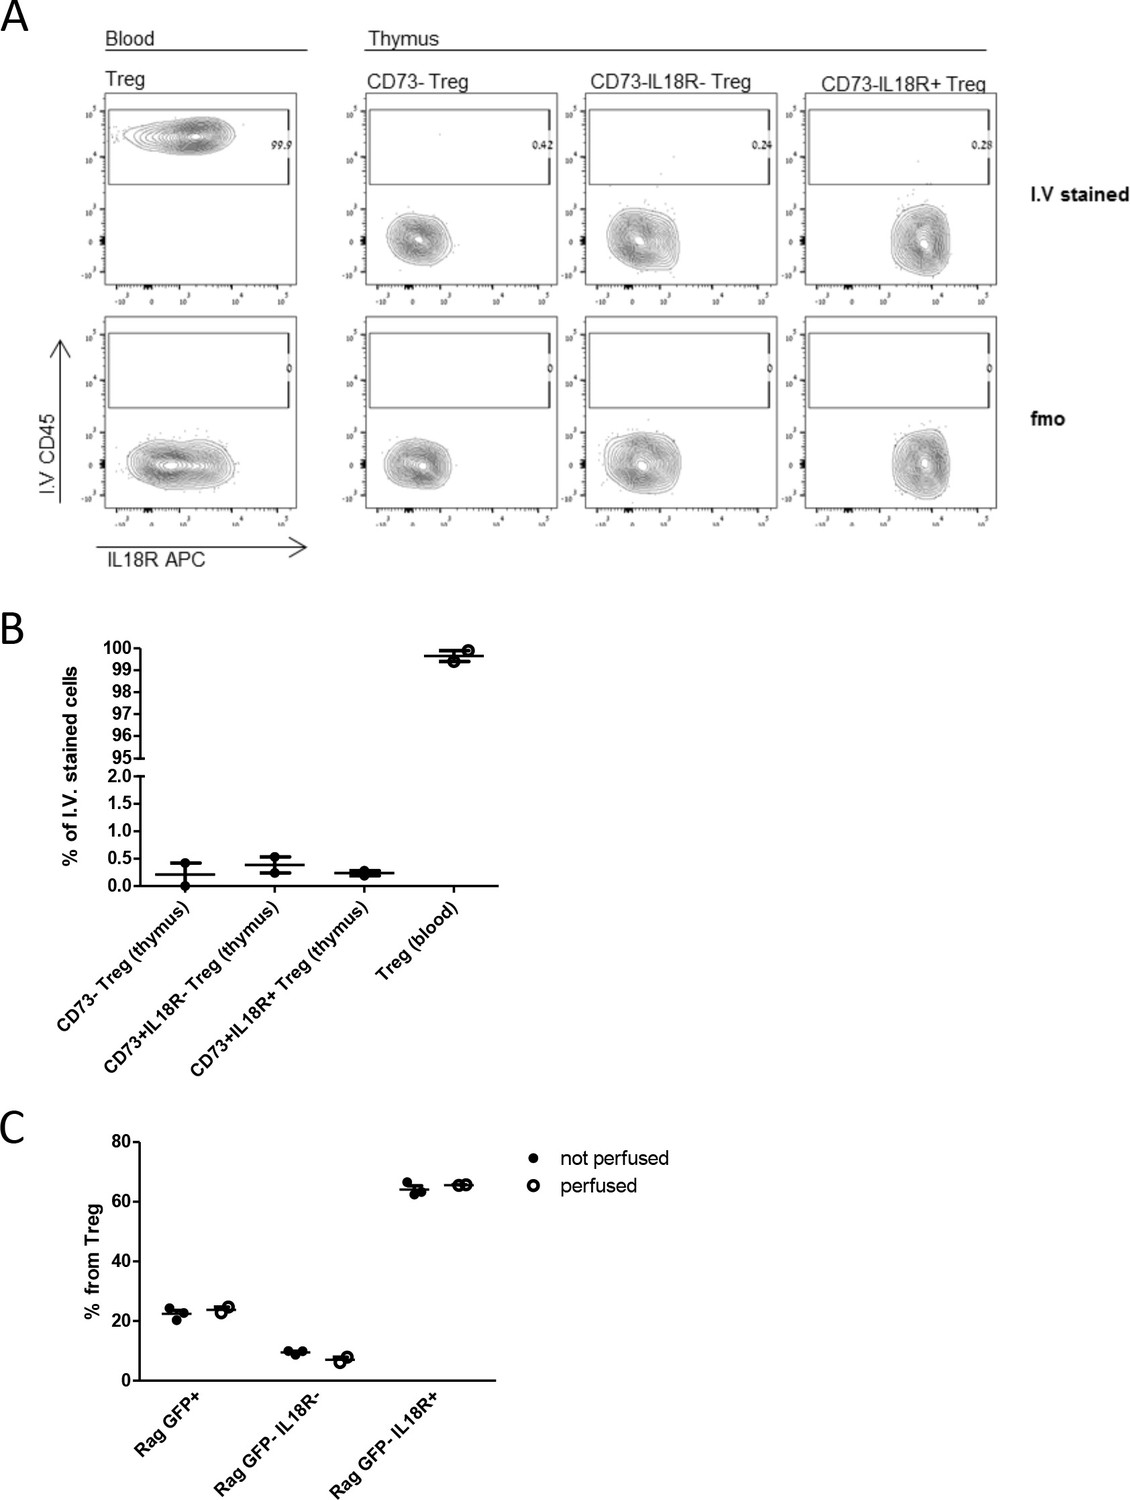
Mature (Rag.GFP–or CD73+) Tregs are intrathymic (not a contamination from the bloodstream).
(A) Representative FACS plots of intravascular CD45 staining followed by regular staining in blood and thymus. The frequency of CD45 intravascular stain (I.V.) is shown from left to right in Tregs from the blood (positive control) and from the thymus (CD73- Tregs, CD73+IL18R- Tregs, and CD73+ IL18R+ Tregs). Upper panels correspond to CD45 intravascular stained mouse, while lower panels correspond to the FMO (fluorescence minus one control: mouse without CD45 intravascular staining). (B) Frequency of intravascular stained cells. (C) Frequency of Rag.GFP+ Treg, Rag.GFP-Il18R-Treg, and Rag.GFP-IL18R+Treg populations in the thymus of perfused and non-perfused mice. In B and C, each dot represents an individual mouse. The mean ± SEM (standard error of the mean) is shown. Data are from experiments with two biological replicates (B) and three biological replicates (C).
Figure 2 with 2 supplements
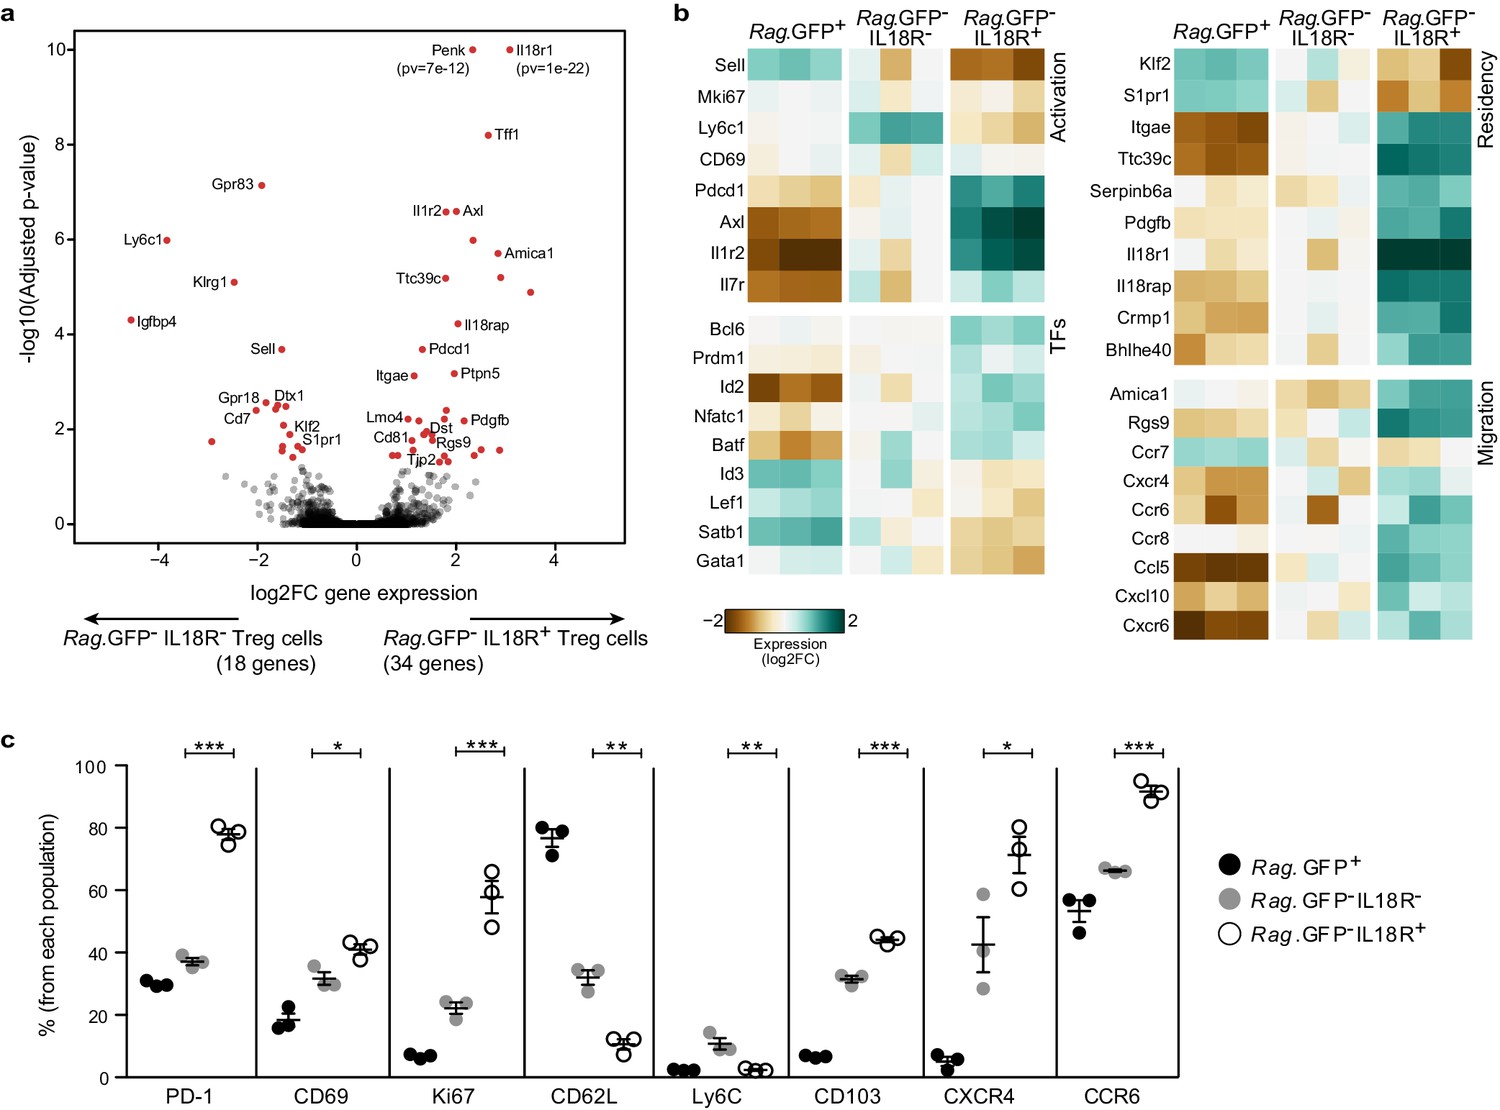
IL18R- and IL18R+ represent molecularly distinct subsets of mature Tregs in the thymus.
(a) A volcano plot showing differential gene expression between thymic Rag.GFP-IL18R- Tregs and Rag.GFP- IL18R+ Tregs. Genes in red have an adjusted p-value <0.05. Y axis is cut at 1e-10 for visualization. (b) A heatmap showing the normalized expression of selected variable genes in Rag.GFP+ Tregs, Rag.GFP-IL18R- Tregs, and Rag.GFP-IL18R+ Tregs from the thymus. (c) Frequencies of different markers analyzed using flow cytometry in Rag.GFP+ Tregs, Rag.GFP-IL18R- Tregs, and Rag.GFP-IL18R+ Tregs from the thymus. Each dot represents an individual mouse. The mean ± SEM (standard error of the mean) is shown. Data are from one experiment with three biological replicates. Significant differences were determined using ANOVA, corrected for multiple comparisons by the Bonferroni method and indicated by asterisks *p<0.05, **p<0.01, ***p<0.001.
Figure 2—figure supplement 1
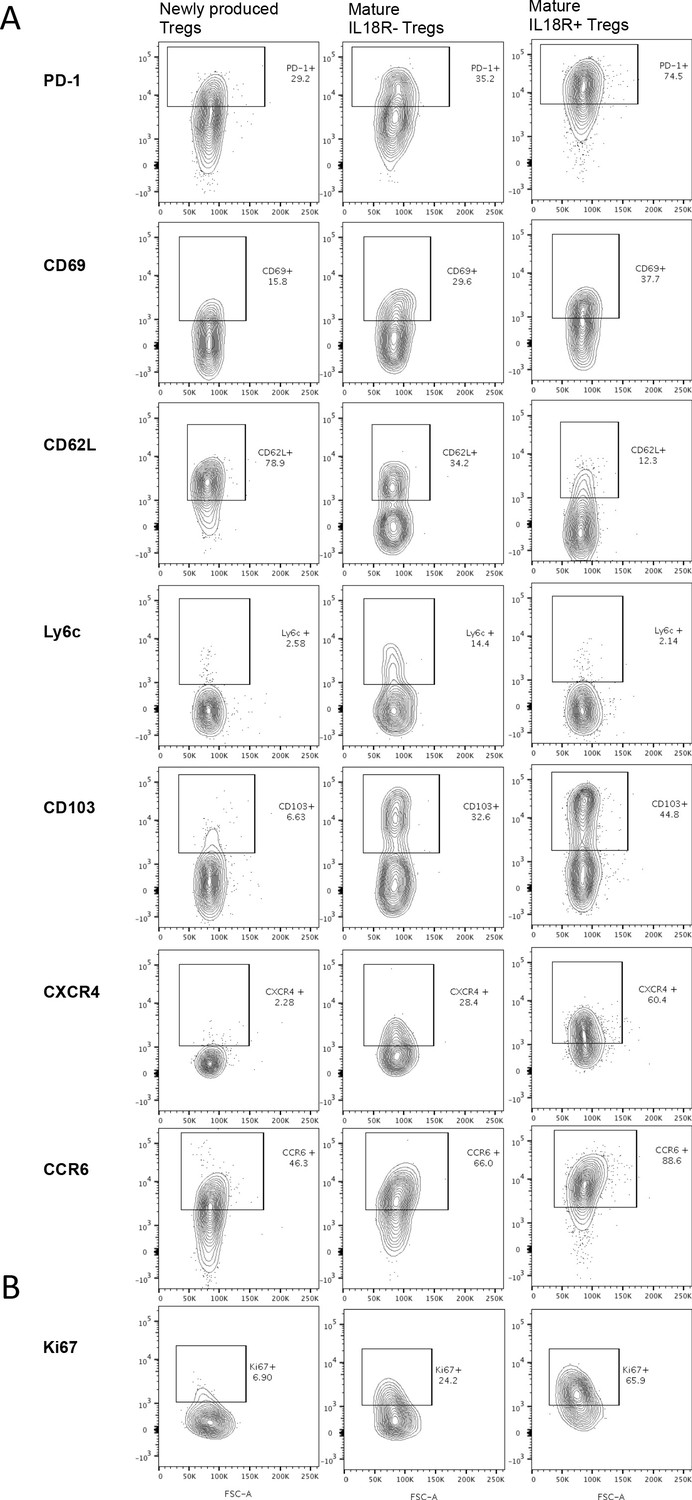
RNA Sequencing protein validation, Representative gating from Figure 2c.
(A) Thymocytes of Rag.GFP Foxp3.RFP mice were stained with fluorescently labeled antibodies. The frequency of different markers in newly produced Tregs (Rag.GFP+), mature IL18R- Tregs (Rag.GFP-IL18R-) or mature IL18R+ Tregs (Rag.GFP- IL18R+) is shown. (B) Thymocytes of wild-type mice were stained with fluorescently labeled antibodies. The frequency of intracellular Ki67 marker in newly produced Tregs (CD73-), mature IL18R- Tregs (CD73+IL18R-), or mature IL18R+ Tregs (CD73+IL18R+) is shown. Numbers indicate the percentage of cells within each gate.
Figure 2—figure supplement 2
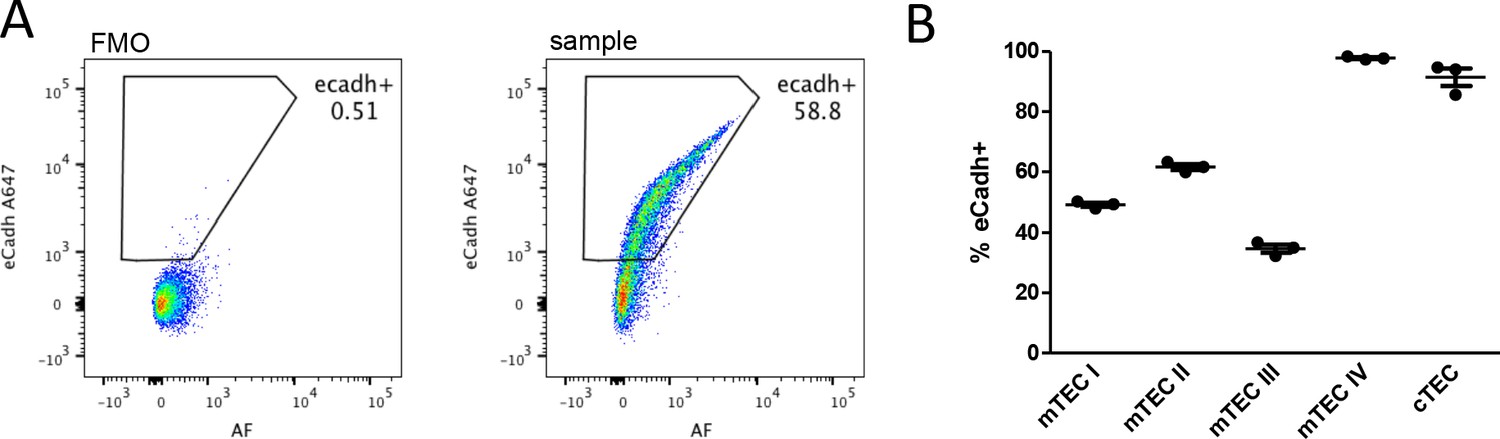
E-cadherin (the ligand for CD103) is expressed by thymic epithelial cells.
(A) Representative FACS plots showing the expression of E-cadherin (y-axis) plotted against AF (Autofluorescence, natural fluorescence; x-axis) in total thymic epithelial cells (TEC). Numbers indicate the percentage of E-cadherin positive cells. FMO (fluorescence minus one) control (left) and sample (right) are shown. (B) Frequency of E-cadherin positive cells in different populations of thymic epithelial cells (CD45-EpCAM+): mTECI (Ly51- MHCIIlo Itgb4+), mTECII (Ly51-MHCIIhi), mTECIII (Ly51-MHCIIlo Itgb4-), mTECIV (Ly51-MHCIIlo L1CAM+), and cTEC (Ly51+). Each dot represents an individual mouse. The mean ± SEM (standard error of the mean) is shown. Data are from one experiment with three biological replicates.
Figure 3 with 1 supplement
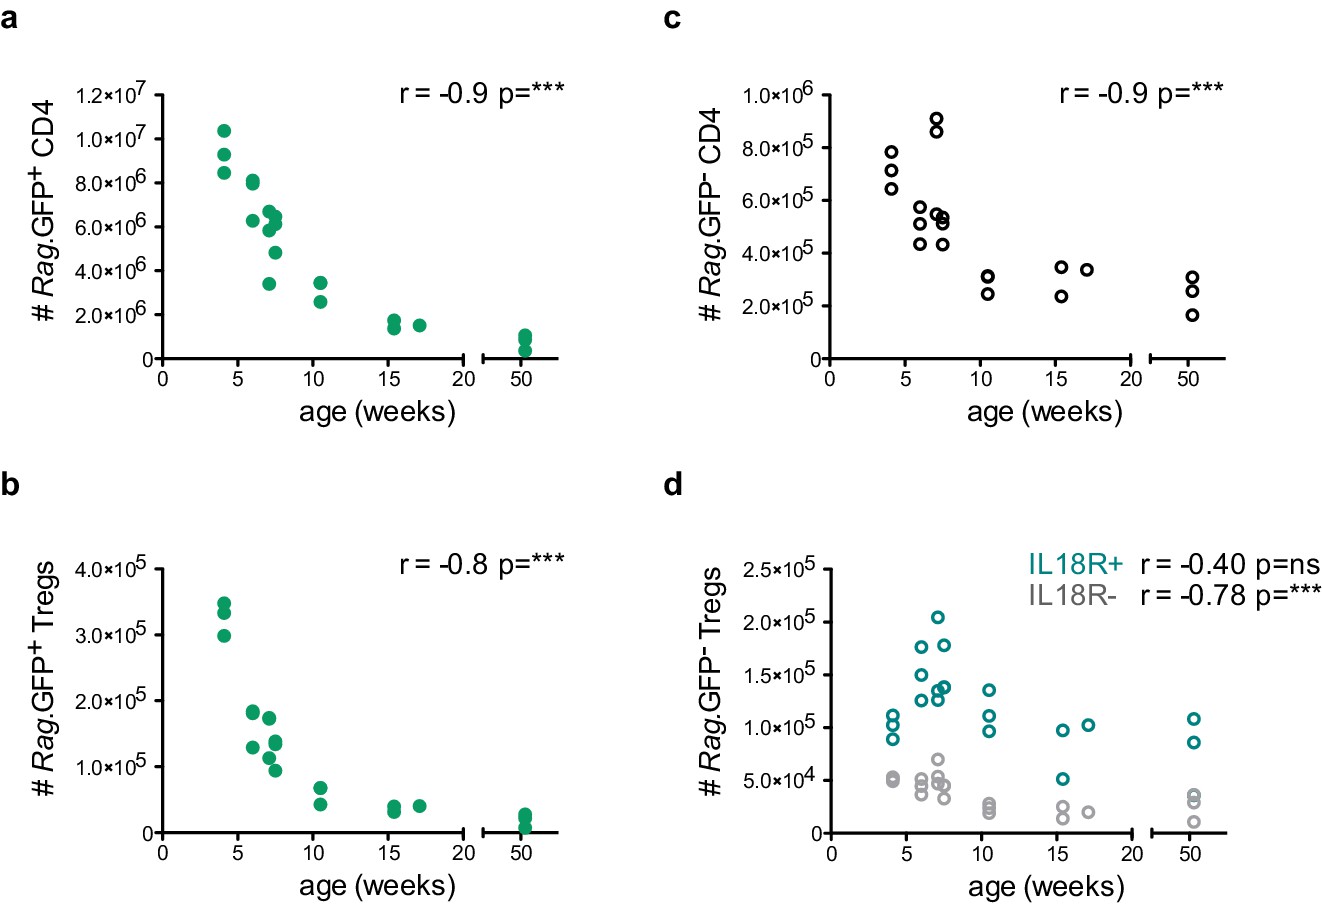
IL18R+ Tregs are resistant to age-dependent thymus involution.
Thymocyte counts as a function of age in weeks. (a) Rag.GFP+ CD4 conventional T cells, (b) Rag.GFP+ Tregs, (c) Rag.GFP- CD4 conventional T cells, and (d) Rag.GFP- IL18R- Tregs (in gray) and Rag.GFP- IL18R+ Tregs (in blue). Each symbol represents an individual mouse. Data are from two independent experiments with 21 total mice. The Spearman’s rank correlation coefficient (r) and p-value (p) for the correlations between cell counts and mice age are indicated by asterisks ***p<0.001, ns: non-significant.
Figure 3—figure supplement 1
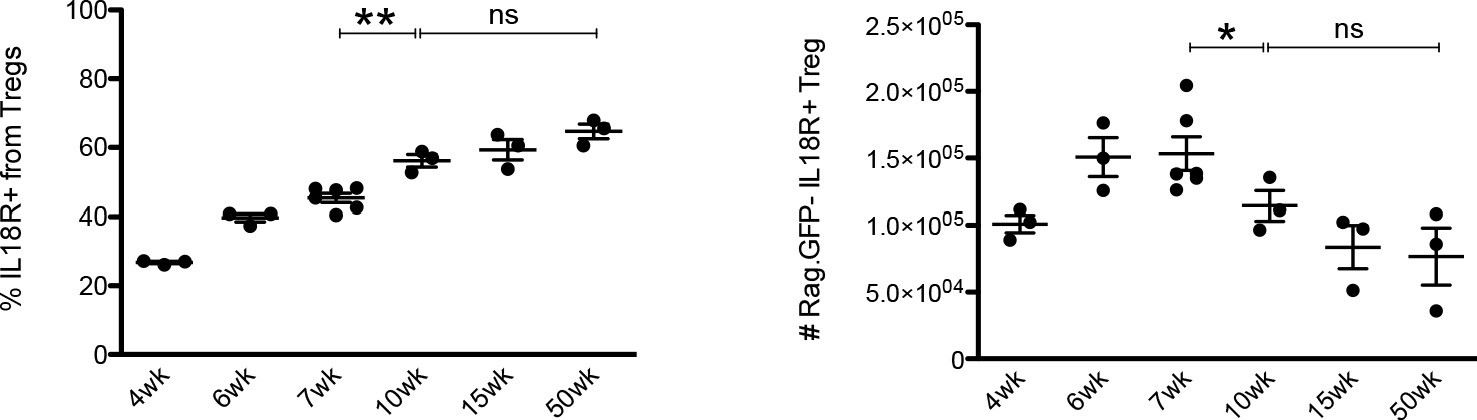
Frequency and counts of IL18R+ Rag.
GFP–Tregs at different ages. Frequency (left) and counts (right) of IL18R+ Rag.GFP– Tregs at different ages in Rag.GFP Foxp3.RFP mice strain. Each dot represents an individual mouse. The mean ± SEM (standard error of the mean) is shown. Data are from two experiments with three to six biological replicates. Significant differences were determined using ANOVA, corrected for multiple comparisons by the Bonferroni method and indicated by asterisks (*p<0.05,ns: non-significant).
Figure 4
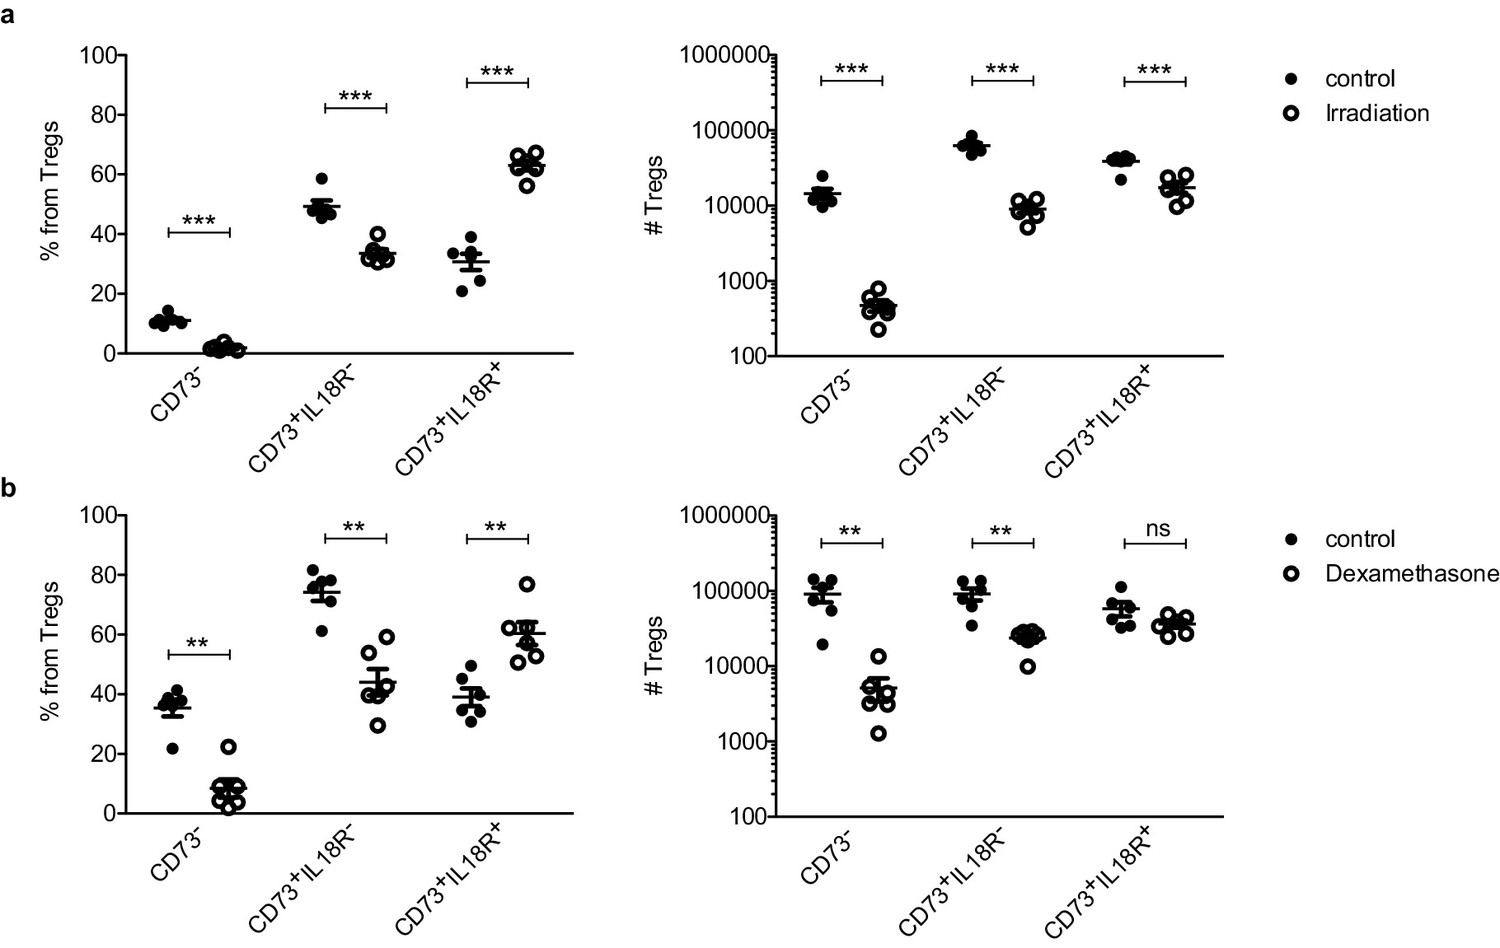
IL18R+ Tregs are resistant to stress-dependent thymus involution.
Frequencies (left) and counts (right) of ‘newly produced’ CD73- Tregs, ‘mature’ CD73+IL18R- Tregs and ‘mature’ CD73+IL18R+ Tregs in control mice (solid dots) and treated mice (empty dots) upon different perturbations: (a) 7 days after 425cGy irradiation and (a) 7–10 days after 20 mg/kg dexamethasone injection. Each dot represents an individual mouse. The mean ± SEM (standard error of the mean) is shown. Data in (a,b) are from a representative experiment with six biological replicates. Significant differences were determined using 2-way ANOVA, corrected for multiple comparisons by the Bonferroni method and indicated by asterisks **p<0.01, ***p<0.001, ns: non-significant.
Figure 5 with 4 supplements
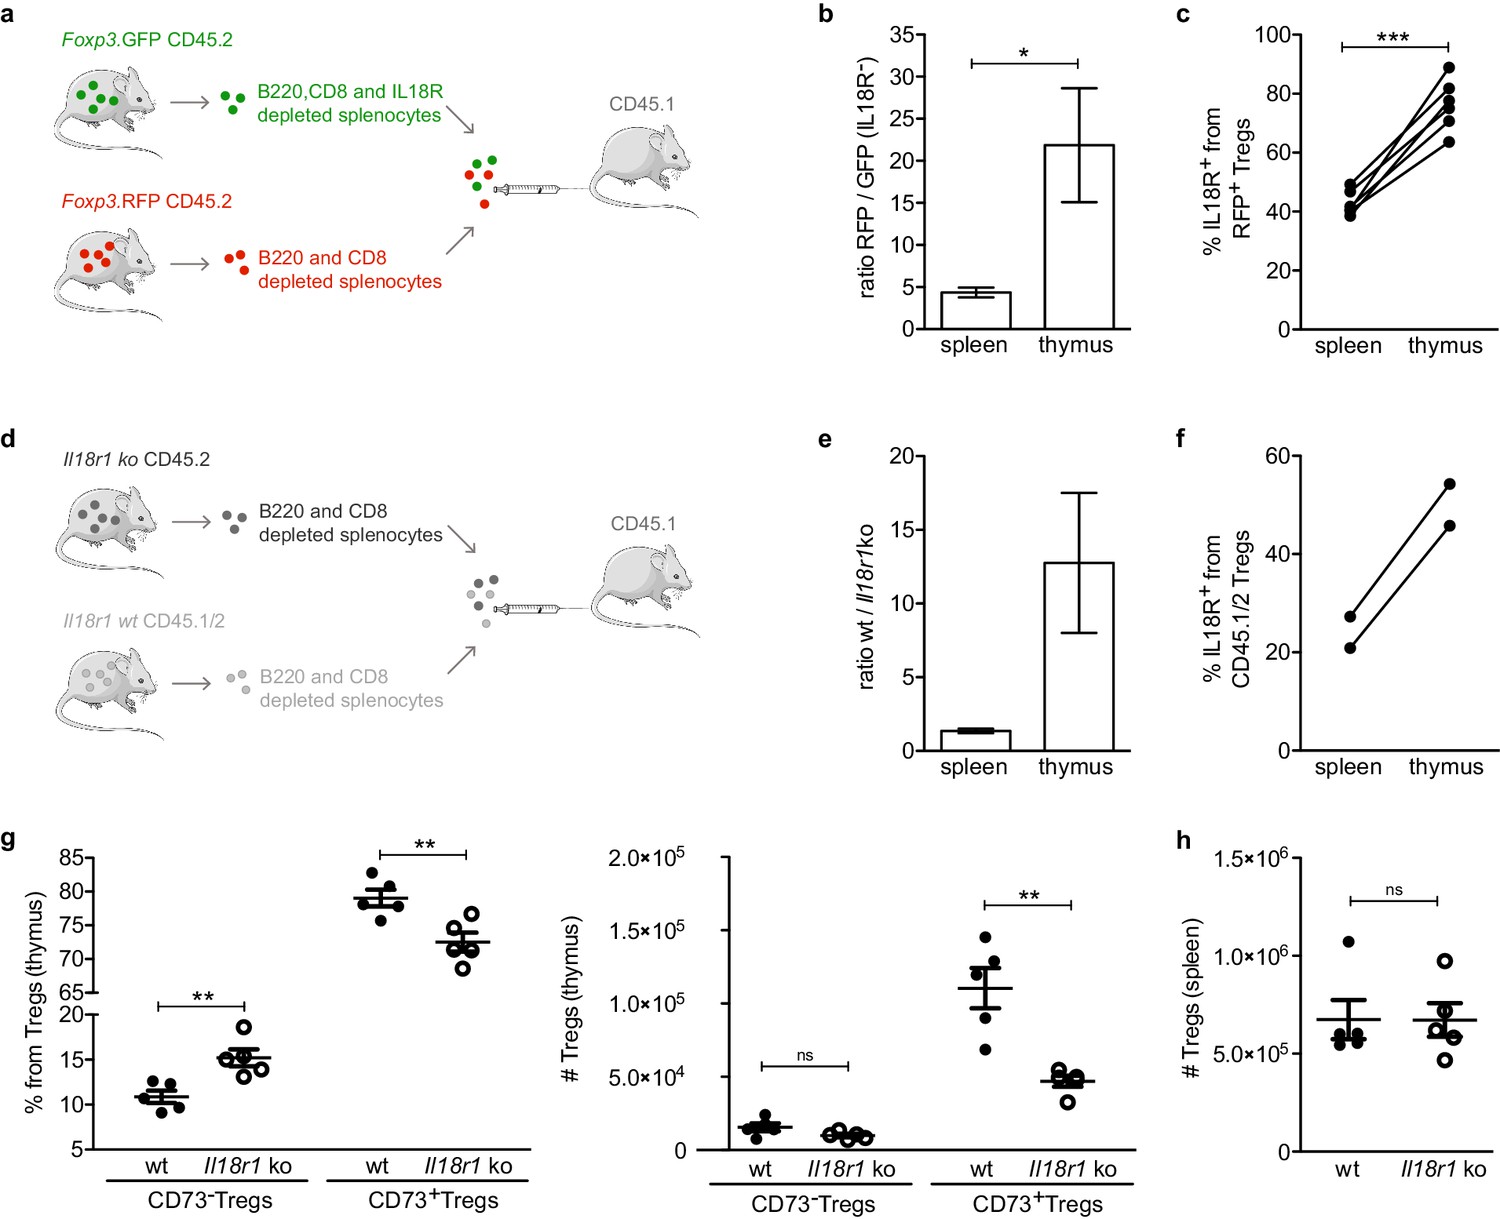
IL18R contributes to maintain mature Tregs in the thymus.
(a) Schematic representation of the experiment in which IL18R depleted splenocytes from Foxp3. GFP mice were injected together with non-IL18R depleted splenocytes from Foxp3.RFP into CD45.1 recipients. (b) The ratio of RFP to GFP injected cells found in the spleen and thymus of recipient mice. (c) Frequency of IL18R+ Tregs from the Foxp3.RFP CD45.2 injected cells found in the spleen and thymus of recipient mice. (d) Schematic representation of the experiment in which Il18r1KO splenocytes were injected together with wild-type (wt) splenocytes into CD45.1 recipients. (e) The ratio of wt/Il18r1KO cells found in the spleen and thymus of recipient mice. (f) Frequency of IL18R+ Tregs from the wt injected cells found in the spleen and thymus of recipient mice. (g) Frequencies (left) and counts (right) of different Treg populations in the thymus of wt mice (solid dots) and Il18r1KO mice (empty dots). (h) Counts of Tregs in the spleen of wt and Il18r1KO mice. Each dot represents an individual mouse. The mean ± SEM (standard error of the mean) is shown. Data in (b,c) are from three independent experiments with a total of 6 biological replicates. (e,f) are from one experiment with a total of 2 biological replicates. Data in (g,h) are from one representative experiment with 12 total mice. Significant differences were determined in (b,c,e,f) using a paired t-test and in (g,h) using an unpaired t-test and indicated by asterisks *p<0.05, **p<0.01, ***p<0.001, ns: non-significant.
Figure 5—figure supplement 1
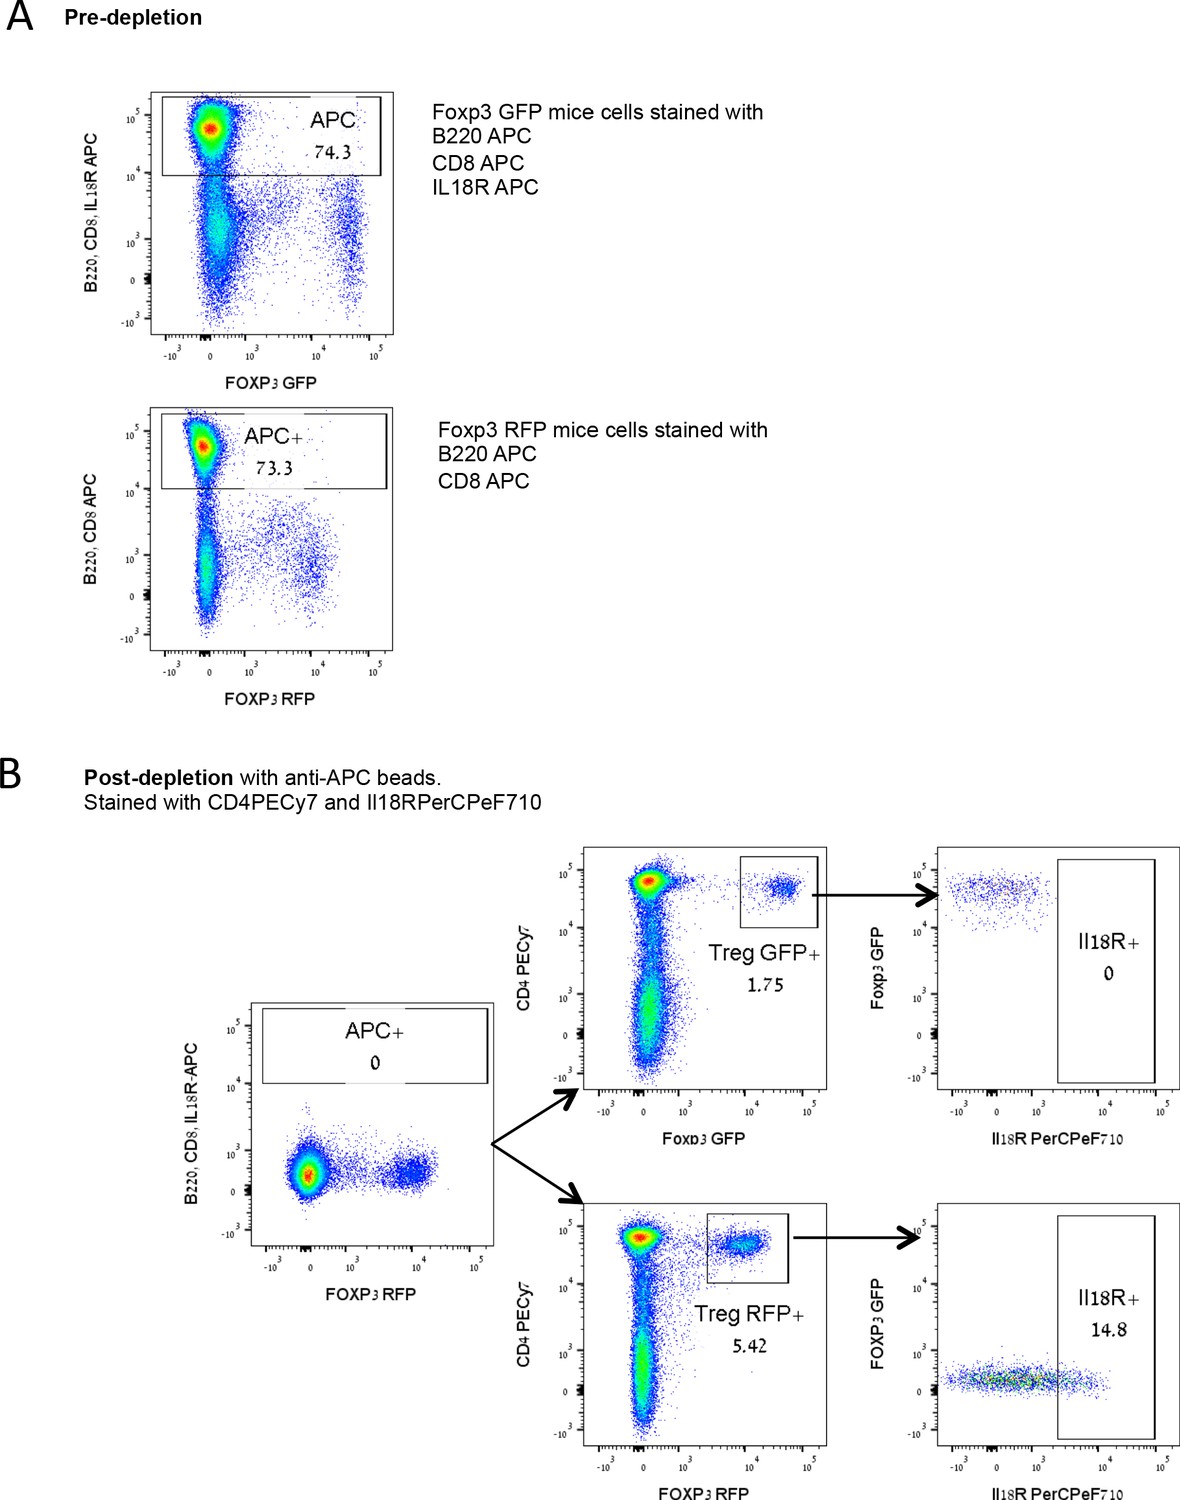
Purity of the injected splenocytes in the adoptive transfer experiments shown in Figure 5.
(A) Representative FACS plots of pre-depletion samples, including pooled Foxp3.GFP mice splenocytes stained with B220 APC, CD8 APC, and IL18R APC (up) and Foxp3.RFP mice splenocytes stained with B220 APC and CD8 APC (down) (B) Representative FACS plots of post-depletion samples composed of a mix of B220-, CD8-, IL18R- depleted Foxp3.GFP splenocytes and B220-, CD8- depleted Foxp3.RFP splenocytes. Numbers indicate the percentage of cells within each gate.
Figure 5—figure supplement 2
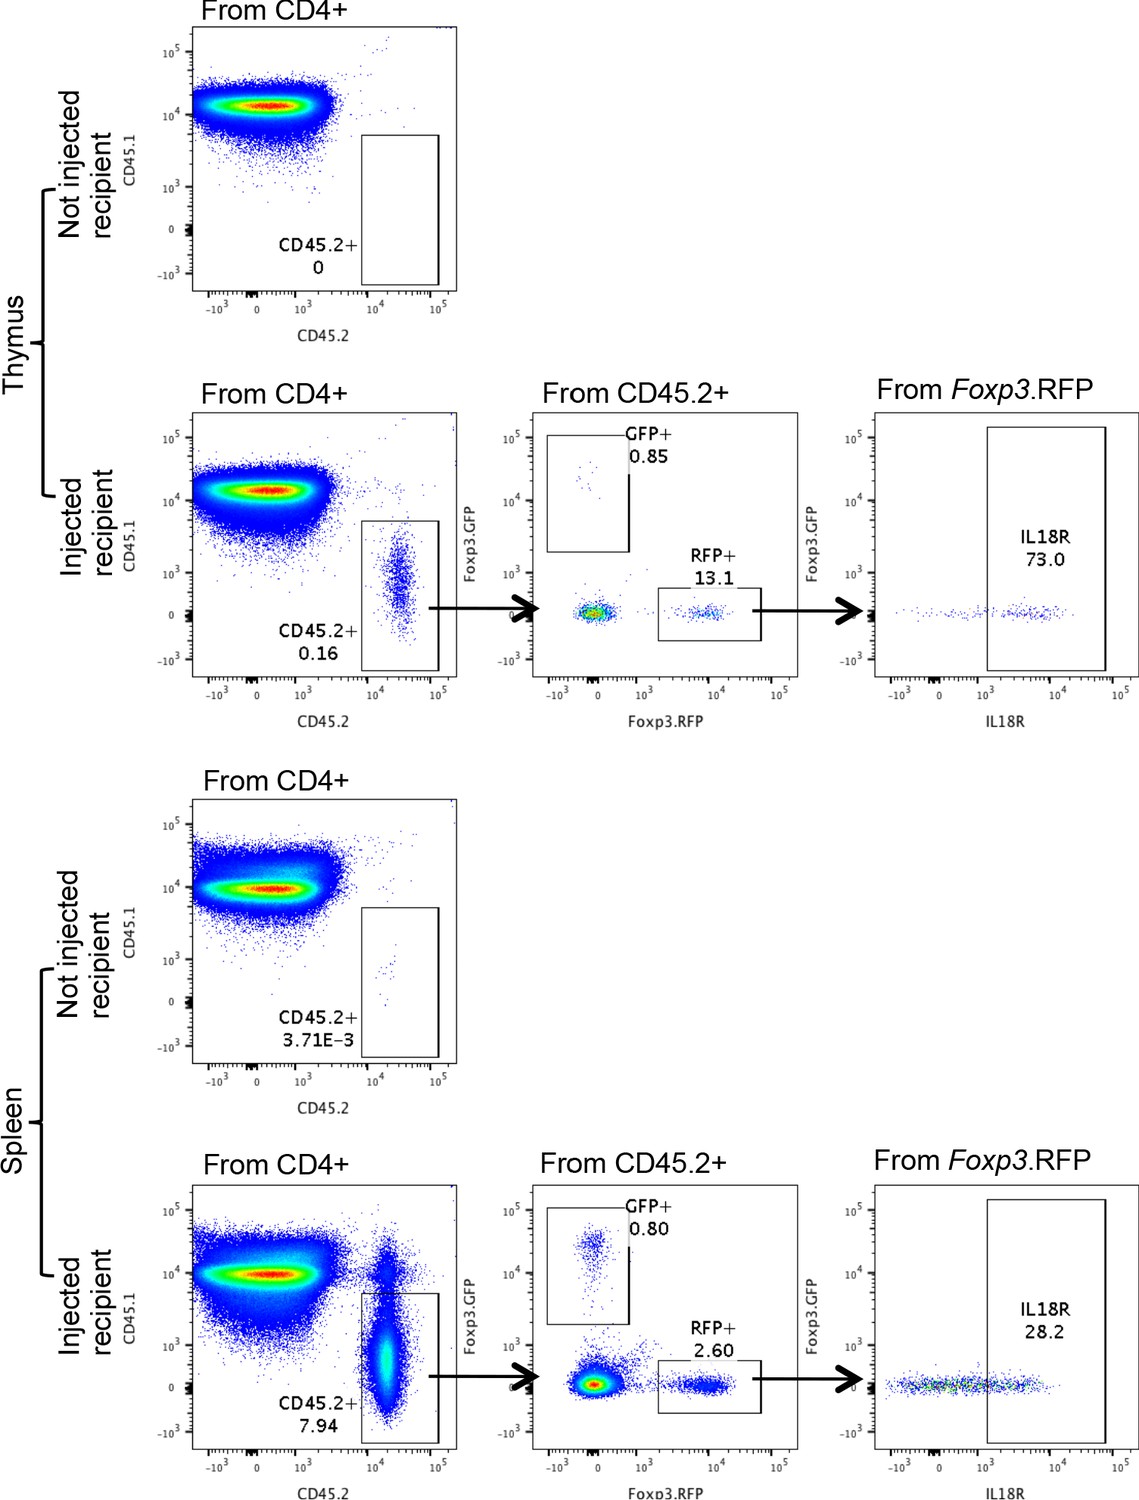
Representative gating from Figure 5a,b,c.
Representative flow cytometry dot plots showing the gating of the injected CD45.2 cells (GFP and RFP) in the thymus (up) or the spleen (down) of CD45.1 recipients. Numbers indicate the percentage of cells within each gate.
Figure 5—figure supplement 3
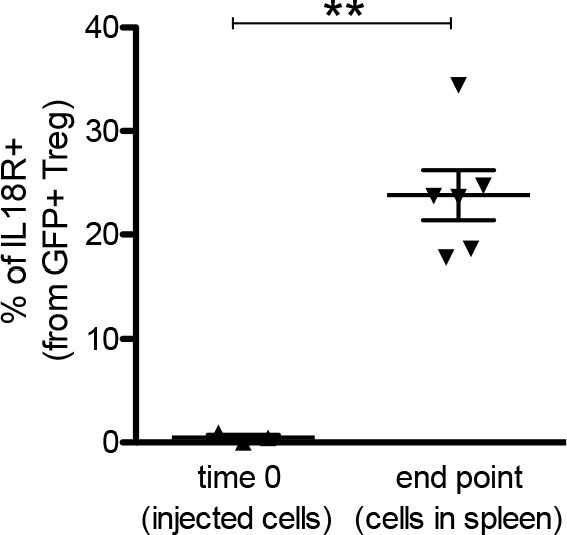
IL18R– could give rise to IL18R+ Tregs.
Frequency of IL18R in Foxp3.GFP Tregs at the time of injection to the recipient (time 0) and 12 days after the injection (end point). Foxp3.GFP Tregs were IL18R depleted before injection, and therefore frequencies of IL18R shown at time 0, also correspond to purity of the sorted cells. Each dot represents an individual mouse. The mean ± SEM (standard error of the mean) is shown. Data are from three independent experiments with a total of 6 biological replicates. Significant differences were determined using a paired t-test and indicated by asterisks (**p<0.01).
Figure 5—figure supplement 4
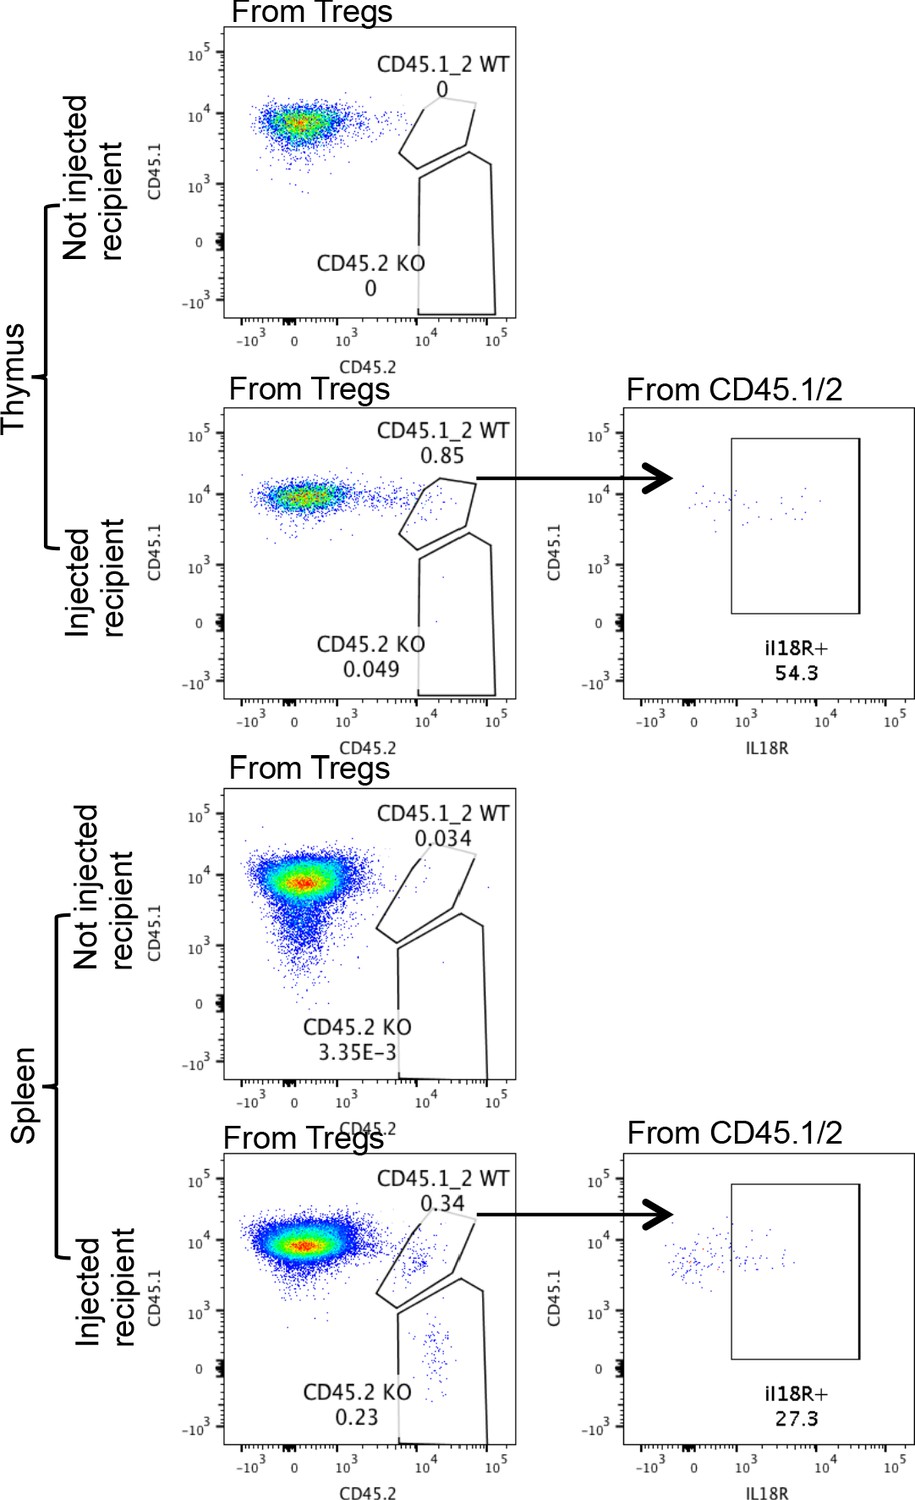
Representative gating from Figure 5d,e,f.
Representative flow cytometry dot plots showing the gating of the injected CD45.2 cells (Il18r1 KO) and CD45.1/2 cells (WT) in the thymus (up) or the spleen (down) of CD45.1 recipients. Numbers indicate the percentage of cells within each gate.
Figure 6
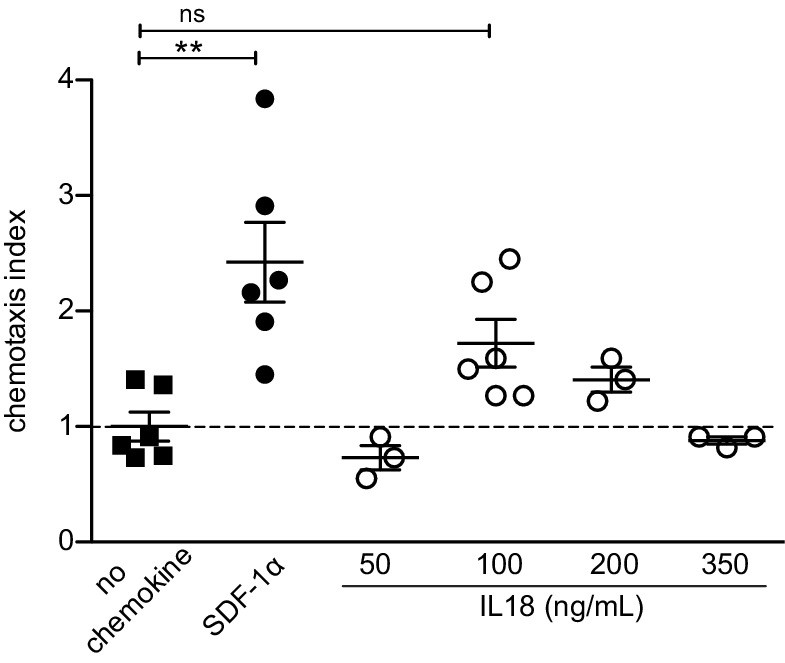
IL18 does not chemoattract Tregs.
In vitro transwell chemotaxis assay showing migration of splenic Tregs in the presence of IL18 added to the lower wells at indicated doses. SDF-1α (CXCL12) was added at a concentration of 100 ng/mL and served as a positive control. The mean ± SEM (standard error of the mean) is shown. Data are from two independent experiments. The chemotaxis index was calculated as % migrated Tregs in the presence of stimulus/% migrated Tregs in the presence of medium alone (no chemokine). Significant differences were determined using ANOVA, corrected for multiple comparisons by the Bonferroni method and indicated by asterisks **p<0.01, ns: non-significant.
Figure 7 with 1 supplement
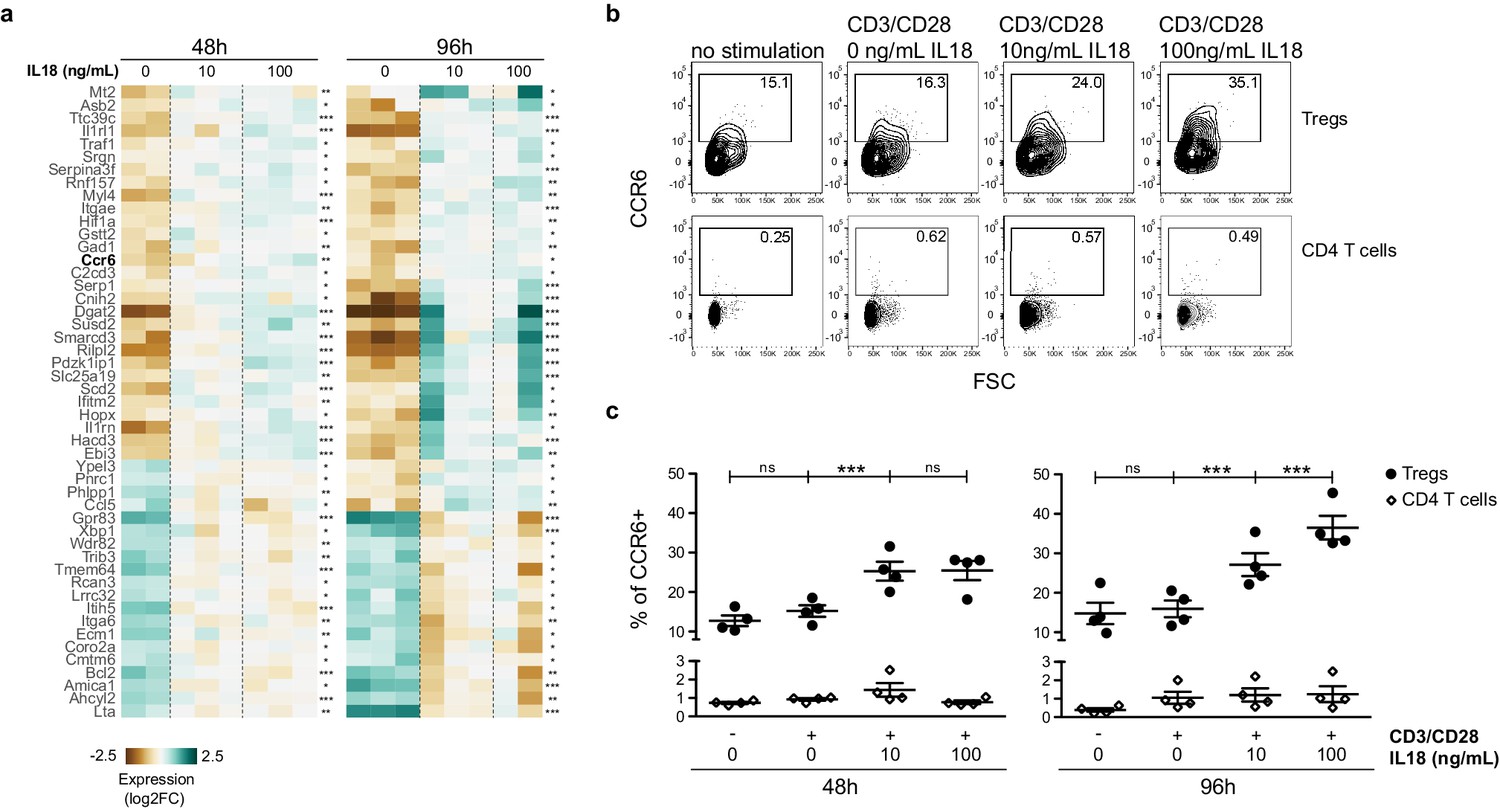
IL18/IL18R signaling upregulates CCR6.
(a) A heatmap showing normalized expression of variable genes in splenic Tregs cultured with CD3/CD28 beads and absence/presence of IL18 (0, 10, 100 ng/mL). Selected genes have an adjusted p-value <0.1 in both 48 and 96 hr treatment versus control tests. Asterisks indicate adjusted p-values in each test *p<0.1, **p<0.01, ***p<0.001. (b) Representative flow cytometry plots showing CCR6 expression in CD25+FOXP3+Tregs (up) or CD25-FOXP3-CD4 T cells (down) cultured for 96 hr with no stimulation, CD3/CD28 beads, or CD3/CD28 beads plus absence/presence of IL18 (0, 10, 100 ng/mL). Numbers indicate the percentage of cells within each gate. (c) Frequency of CCR6 in CD25+FOXP3+Tregs (black dots) and CD25-FOXP3-CD4 T cells (empty rhombus) cultured for 48 or 96 hr with no stimulation, CD3/CD28 beads, or CD3/CD28 beads plus absence/presence of IL18 (0, 10, 100 ng/mL). Data are from two independent experiments with four biological replicates. Significant differences were determined using ANOVA, corrected for multiple comparisons using the Bonferroni method. For Tregs, differences are indicated by asterisks ***p<0.001, ns:non-significant. For CD4 T cells, ANOVA between conditions in both time-points was not significant.
Figure 7—figure supplement 1
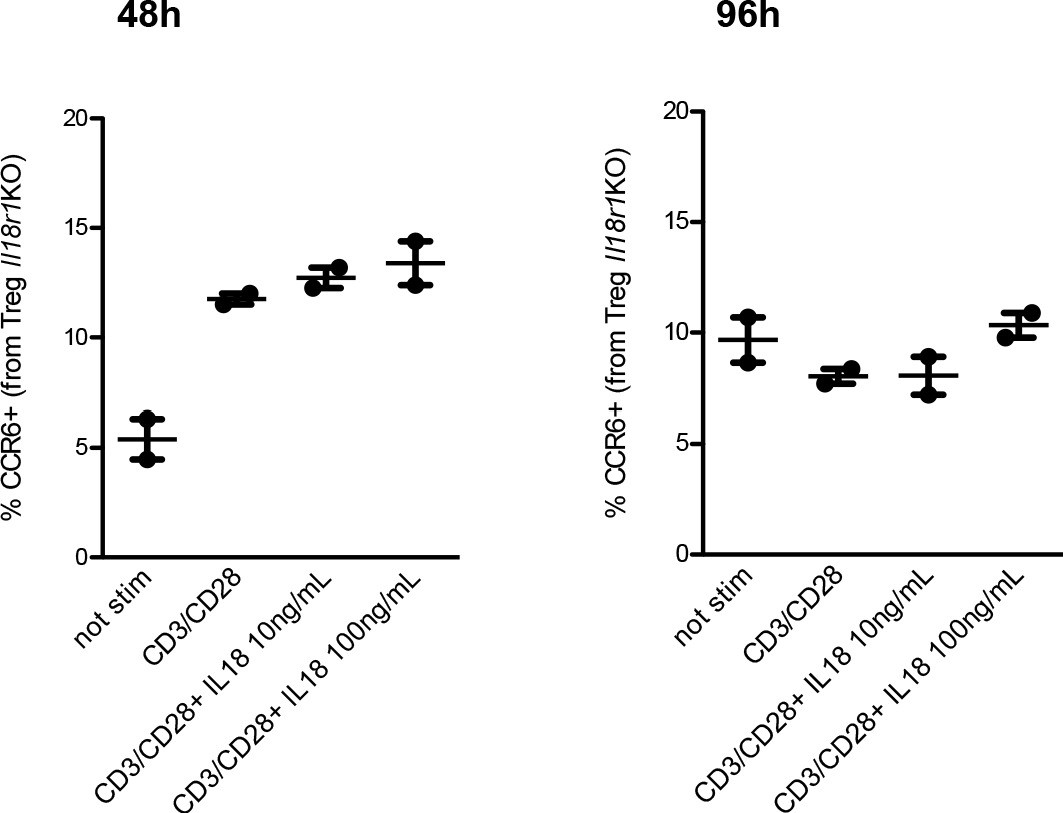
CCR6 upregulation upon IL18 is dependent on IL18R signaling.
Frequency of CCR6 expression in Tregs from Il18r1 KO mice cultured in vitro for 48 hr (left plot) or 96 hr (right plot) at different conditions (from left to right): not stimulated, stimulated with CD3/CD28 beads, stimulated with CD3/CD28 beads and IL18 10 ng/mL, and stimulated with CD3/CD28 beads and IL18 100 ng/mL. Data from two replicates are shown. The mean ± SEM (standard error of the mean) is shown.
Tables
Appendix 1—key resources table
| Reagent type (species) or resource | Designation | Source or reference | Identifiers | Additional information |
|---|---|---|---|---|
| Antibody | anti-CD3 APC (rat monoclonal) | Biolegend | Cat#100236 | FACS (1uL/test) |
| Antibody | anti-CD3 PerCP/Cy5.5 (rat monoclonal) | Biolegend | Cat#100218 | FACS (1,5uL/test) |
| Antibody | anti-CD4 PB (rat monoclonal) | Biolegend | Cat#100428 | FACS (1uL/test) |
| Antibody | anti-CD4 PECy7 (rat monoclonal) | Biolegend | Cat#100422 | FACS (0,5uL/test) |
| Antibody | anti-CD8a PB (rat monoclonal) | Biolegend | Cat#100725 | FACS (0,5uL/test) |
| Antibody | anti-CD8a APC (rat monoclonal) | Biolegend | Cat#100712 | FACS (0,5uL/test) |
| Antibody | anti-CD25 PE (rat monoclonal) | Biolegend | Cat#101904 | FACS (2uL/test) |
| Antibody | anti-CD25 BV711 (rat monoclonal) | Biolegend | Cat#102049 | FACS (0,5uL/test) |
| Antibody | anti-CD45 PerCP/Cy5.5 (rat monoclonal) | Biolegend | Cat#103132 | 8μg in 200μL PBS iv/mouse |
| Antibody | anti-CD45 unconjugated (rat monoclonal) | Biolegend | Cat#103101 | 1.25μg in 2mL Macs/organ |
| Antibody | anti-CD45.1 APC/Cy7 (mouse monoclonal) | Biolegend | Cat#110715 | FACS (2uL/test) |
| Antibody | anti-CD45.2 PerCP/Cy5.5 (mouse monoclonal) | Biolegend | Cat#109827 | FACS (1uL/test) |
| Antibody | anti-CD45.2 APC (mouse monoclonal) | Biolegend | Cat#109814 | FACS (0,5uL/test) |
| Antibody | anti-CD45R(B220) APC (rat monoclonal) | Biolegend | Cat#103212 | FACS (1uL/test) or 6μL (in total600μL) /spleen for depletion |
| Antibody | anti-CD62L APC/Cy7 (rat monoclonal) | Biolegend | Cat#104427 | FACS (1uL/test) |
| Antibody | anti-CD69 APC/Cy7 (Armenian Hamster monoclonal) | Biolegend | Cat#104525 | FACS (1uL/test) |
| Antibody | anti-CD73 APC (rat monoclonal) | Biolegend | Cat#127210 | FACS (0,3uL/test) |
| Antibody | anti-CD73 PE (rat monoclonal) | Biolegend | Cat#127206 | FACS (0,3uL/test) |
| Antibody | anti-CD103 APC (Armenian Hamster monoclonal) | Biolegend | Cat#121413 | FACS (1uL/test) |
| Antibody | anti-CD184 (CXCR4) APC (rat monoclonal) | Biolegend | Cat#146507 | FACS (0,5uL/test) |
| Antibody | anti-CD196 (CCR6) BV605 (Armenian Hamster monoclonal) | Biolegend | Cat#129819 | FACS (2uL/test) |
| Antibody | anti-CD218a (IL18Ra) PerCPF710 (rat monoclonal) | eBiosciences | Cat#465183-80 | FACS (1uL/test) |
| Antibody | anti-CD218a (IL18Ra) APC (rat monoclonal) | eBiosciences | Cat#175183-82 | FACS (1uL/test) |
| Antibody | anti-CD279 (PD-1) PECy7 (rat monoclonal) | Biolegend | Cat#135215 | FACS (2uL/test) |
| Antibody | anti-Foxp3 AF488 (rat monoclonal) | Biolegend | Cat#126406 | FACS (1uL/test) |
| Antibody | anti-Ki67 BV605 (rat monoclonal) | Biolegend | Cat#652413 | FACS (1uL/test) |
| Antibody | anti-Ly6-G/Ly6-C APC (rat monoclonal) | Biolegend | Cat#108412 | FACS (2uL/test) |
| Other | Fixable viability dye e506 | eBioscience | Cat#65-0866-18 | FACS (0,1uL/test) |
| Other | Dapi | Merck | Cat#10236276001 | 1:1000 RT, 5min, no wash for sorting alive cells |
| Chemical compound, drug | Dexamethasone | Sigma | Cat#4902 | |
| Peptide, recombinant protein | CXCL12 (SDF-1α) | R&D Systems | Cat#460-SD | |
| Peptide, recombinant protein | IL18 | Biolegend | Cat#767002 | |
| Commercial assay or kit | Truenuclear Buffer kit | Biolegend | Cat#424401 | |
| Commercial assay or kit | CD8a Ly-2 Microbeads | Miltenyi | Cat#130-117-044 | |
| Commercial assay or kit | CD4 L3t4 Microbeads | Miltenyi | Cat#130-117-043 | |
| Commercial assay or kit | anti-APC Microbeads | Miltenyi | Cat#130-090-855 | |
| Commercial assay or kit | LD columns | Miltenyi | Cat#130-042-901 | |
| Commercial assay or kit | Lysis/Binding buffer | Invitrogen | Cat#61012 | |
| Commercial assay or kit | Dynabeads | Invitrogen | Cat#61012 | |
| Commercial assay or kit | CD3/CD28 beads | Miltenyi | Cat#130-095-925 | |
| Strain, strain background (M. musculus) | C57/BL6 mice (C57/BL6JOlaHsd) | Envigo-Israel | ||
| Strain, strain background (M. musculus) | Rag.GFP mice (FVB- Tg (Rag2- egfp)1Mnz/J) | The Jackson laboratory | JAX stock 005688 | |
| Strain, strain background (M. musculus) | Foxp3.RFP mice (C57BL/6-Foxp3tm1Flv/J) | The Jackson laboratory Y.Merbl | JAX stock 008374 | |
| Strain, strain background (M. musculus) | Foxp3.GFP mice | G. Shakhar Bettelli et al., 2006 | ||
| Strain, strain background (M. musculus) | CD45.1 mice (B6.SJL-Ptprca Pepcb/BoyJ) | The Jackson laboratory I. Schachar | JAX stock 002014 | |
| Strain, strain background (M. musculus) | Il18r1 KO mice (B6.129P2- Il18r1tm1Aki/J) | The Jackson laboratory | JAX stock 004131 | |
| Software, algorithm | Flow Jo | Treestar | www.flowjo.com | |
| Software, algorithm | Graphpad Prism | Graphpad | www.graphpad.com | |
| Other | counting beads | Spherotech | Cat#ACBP-100-10 | |
| Other | 6.5mm transwells, 5µm pore inserts | Corning | Cat#3421 |
Additional files
Download links
A two-part list of links to download the article, or parts of the article, in various formats.
Downloads (link to download the article as PDF)
Open citations (links to open the citations from this article in various online reference manager services)
Cite this article (links to download the citations from this article in formats compatible with various reference manager tools)
IL18 signaling promotes homing of mature Tregs into the thymus
eLife 9:e58213.
https://doi.org/10.7554/eLife.58213


