Bacterial OTU deubiquitinases regulate substrate ubiquitination upon Legionella infection
- Institute of Biochemistry II, Faculty of Medicine, Goethe University Frankfurt, Germany
- Buchmann Institute for Molecular Life Sciences, Goethe University Frankfurt, Germany
- Max Planck Institute of Biophysics, Germany
- Department of Nano-Bioengineering, Incheon National University, Republic of Korea
- Oncode Institute and Department of Cell and Chemical Biology, Leiden University Medical Centre, Netherlands
- Institute of Biophysics, Goethe University Frankfurt, Germany
Figures
Figure 1 with 1 supplement
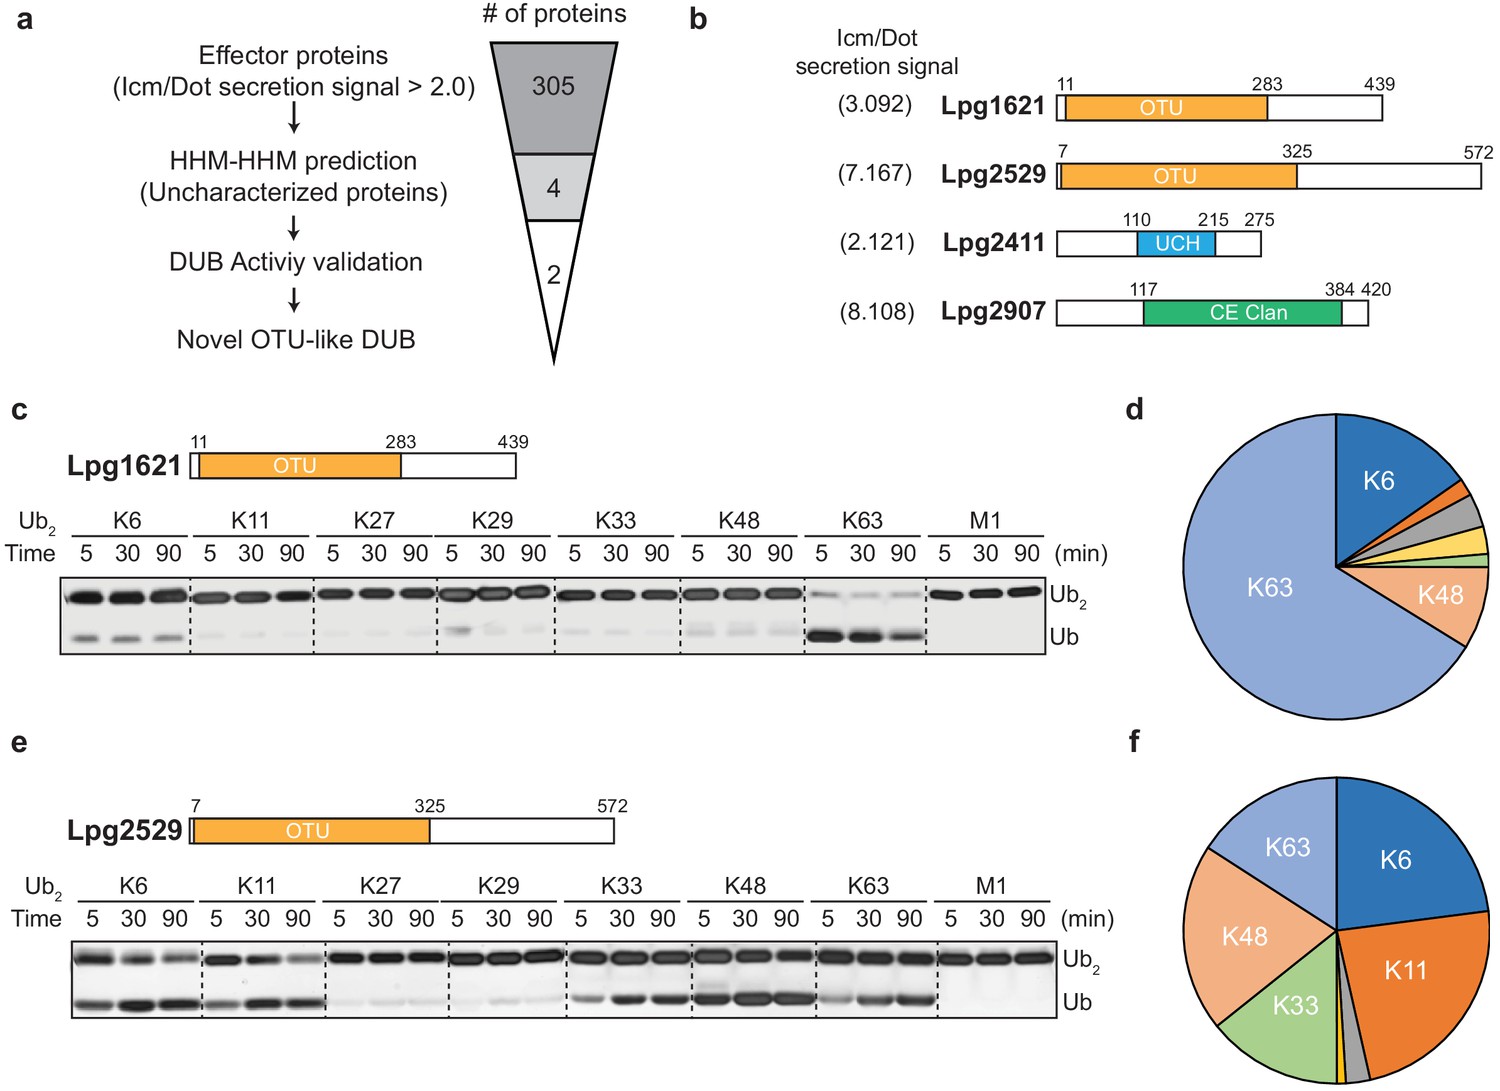
Identification of novel deubiquitinases (DUBs) in Legionella pneumophila.
(a) Graphical illustration of identification of novel DUBs from L. pneumophila effector proteins. (b) Predicted DUB domain of four putative Legionella DUBs. (c, e) Time-course di-ubiquitin panel cleavage assay with Lpg1621 (LotB) and Lpg2529 (LotC). (d, f) Linkage specificity diagram of Lpg1621 (LotB) and Lpg2529 (LotC). The percentage of cleaved ubiquitin species at 90 min was plotted.
Figure 1—figure supplement 1
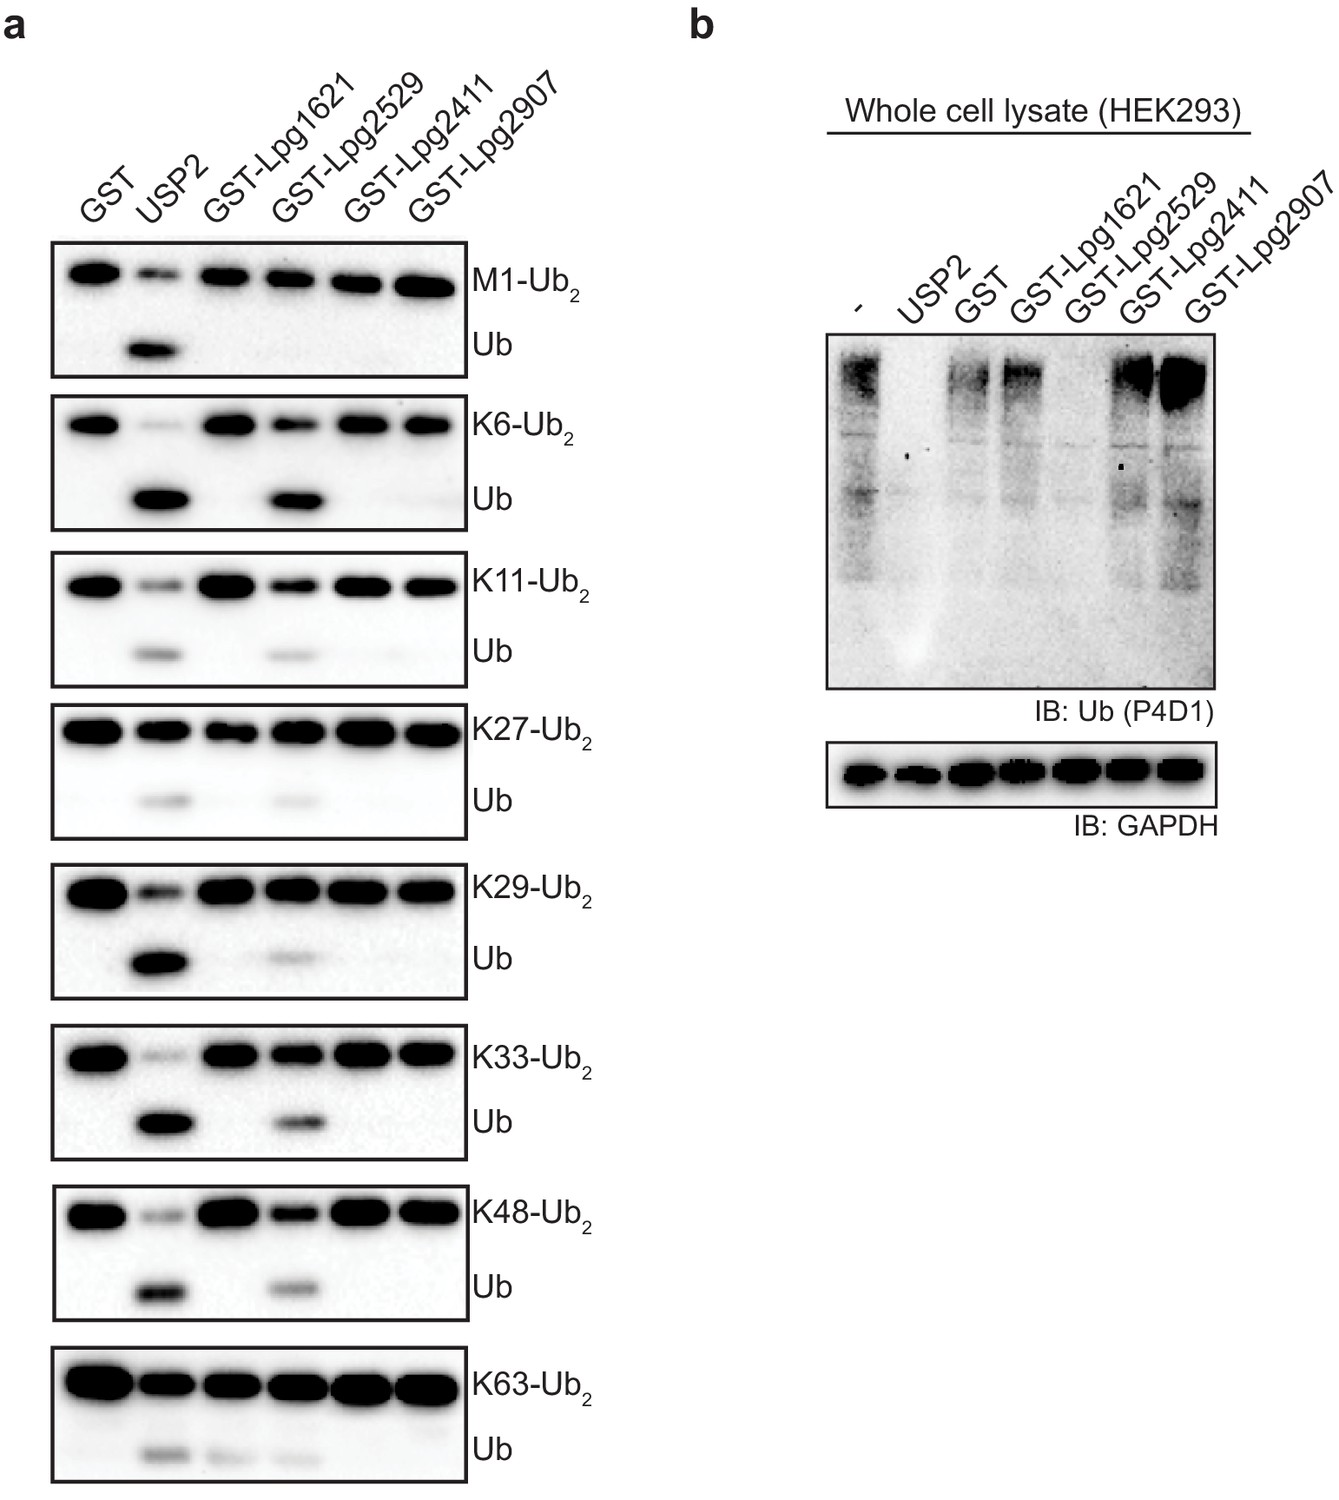
Ubiquitin cleavage assay with putative deubiquitinases (DUBs) from Legionella.
(a) Di-ubiquitin species were incubated with putative Legionella DUBs and analyzed by immuno-blotting with ubiquitin antibody. (b) HEK293 cell lysates were treated with purified Legionella DUBs and analyzed by immuno-blotting with indicated antibodies.
Figure 2 with 1 supplement
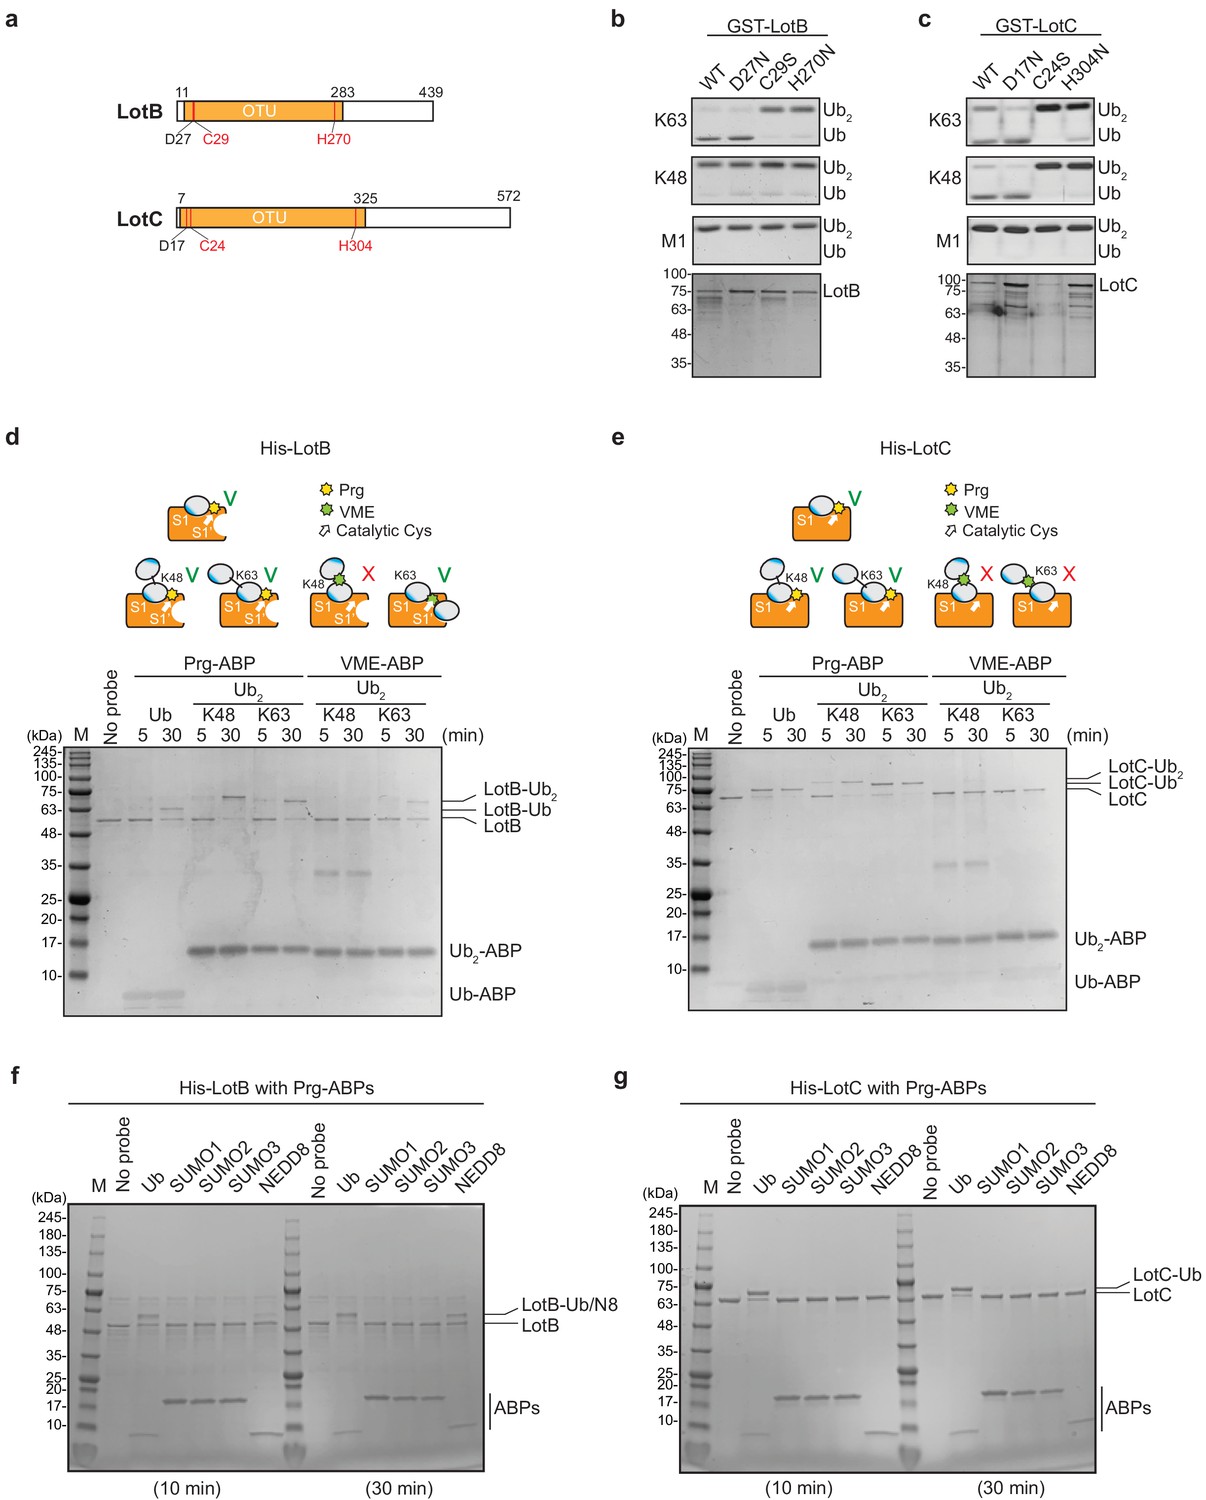
Biochemical properties of LotB and LotC.
(a) Predicted catalytic residues on LotB and LotC. (b, c) Di-Ub cleavage activity assay with wild-type and catalytic mutants of LotB and LotC. (d, e) Activity-based probes (ABPs) test on LotB and LotC. Propargyl-Ub-ABP (Prg-ABP) and vinylmethylester-ubiquitin-ABP (VME-ABP) were incubated as indicated time-points with LotB and LotC and analyzed on SDS-PAGE with coomassie staining. (f, g) Propargyl ubiquitin or ubiquitin-like modifiers reactivity test on LotB and LotC. Prg-ABPs are incubated with LotB and LotC with indicated time points.
Figure 2—figure supplement 1
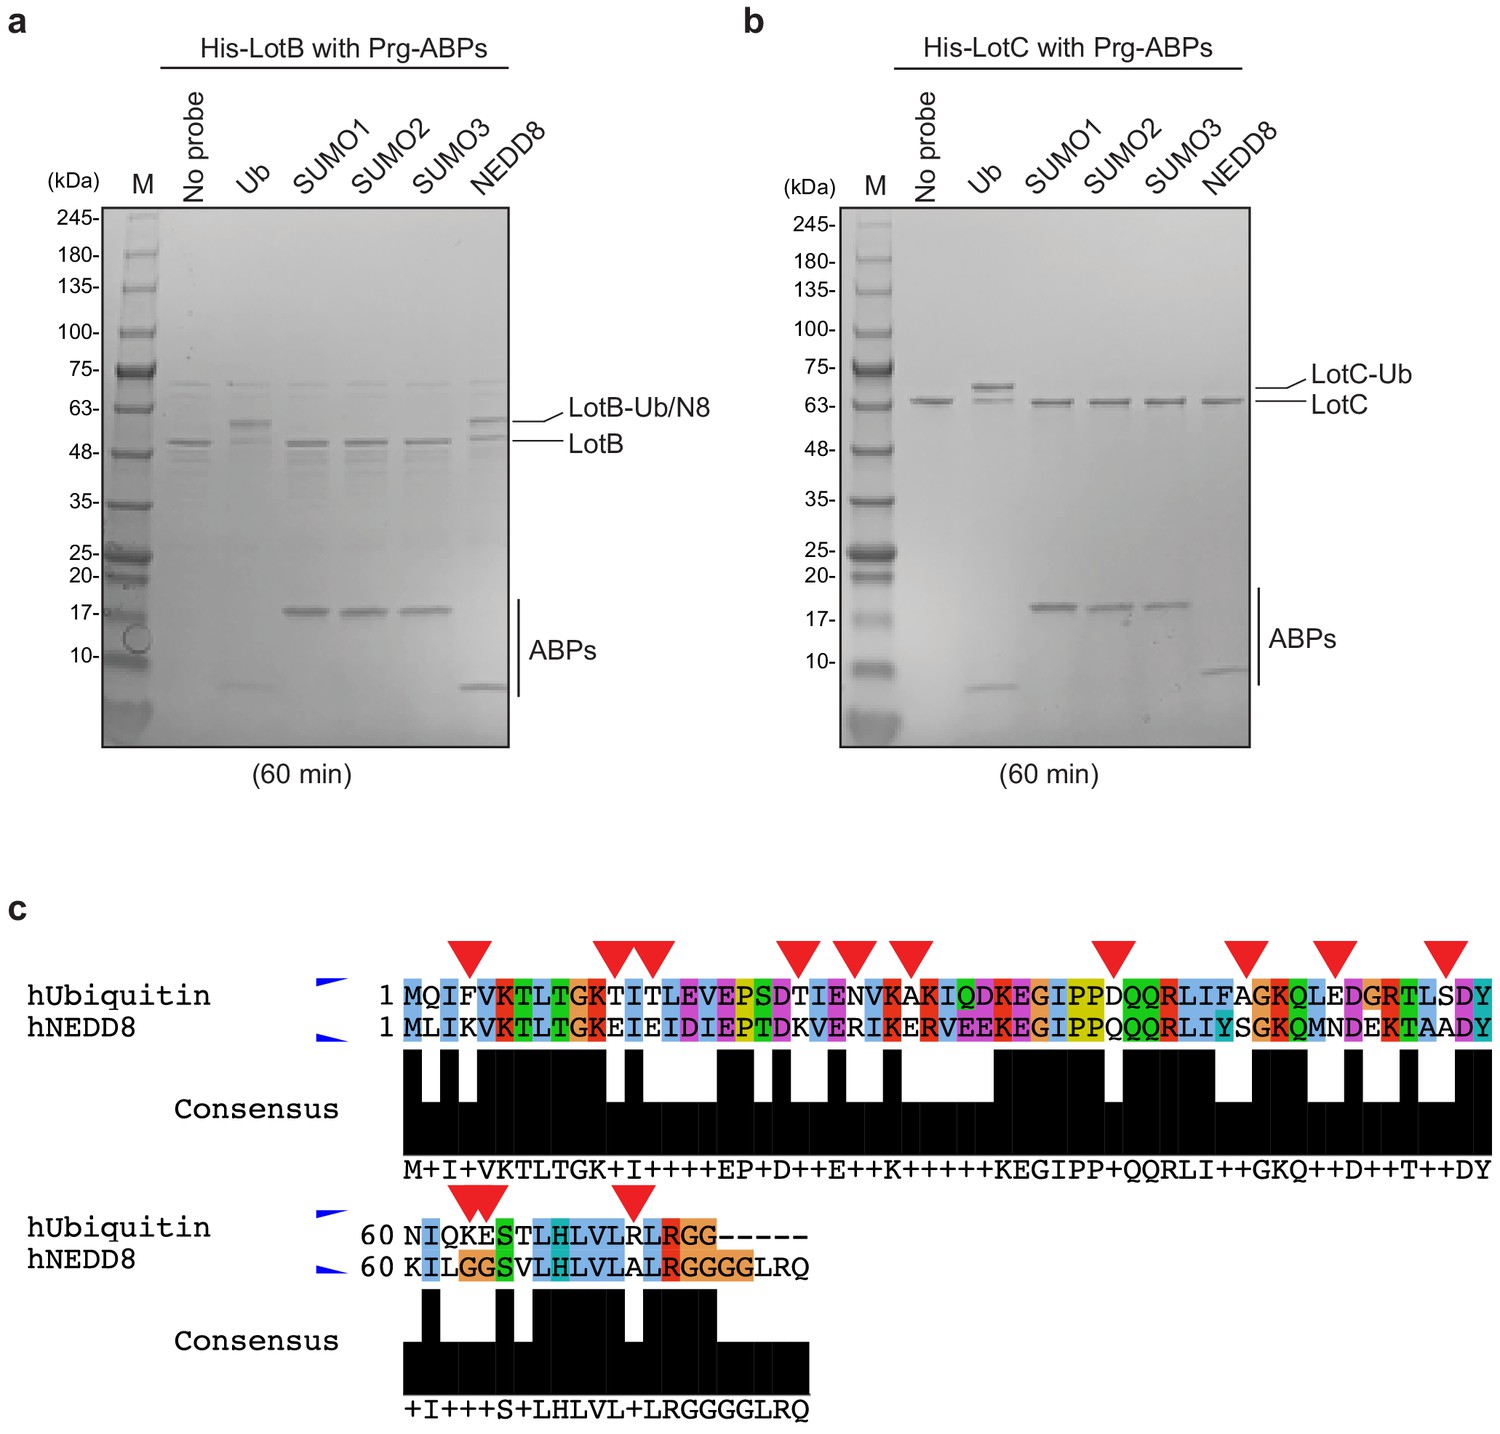
Biochemical properties of LotB and LotC.
(a, b) Propargyl (Prg) – ubiquitin or ubiquitin-like modifiers reactivity test on LotB and LotC. Prg-ABPs are incubated with LotB and LotC for 60 min. (c) Sequence alignment of ubiquitin with NEDD8. Non-conserved residues are marked with red-reversed triangle.
Figure 3 with 1 supplement
Structural comparison of Legionella OTU-deubiquitinases with other OTU-family.
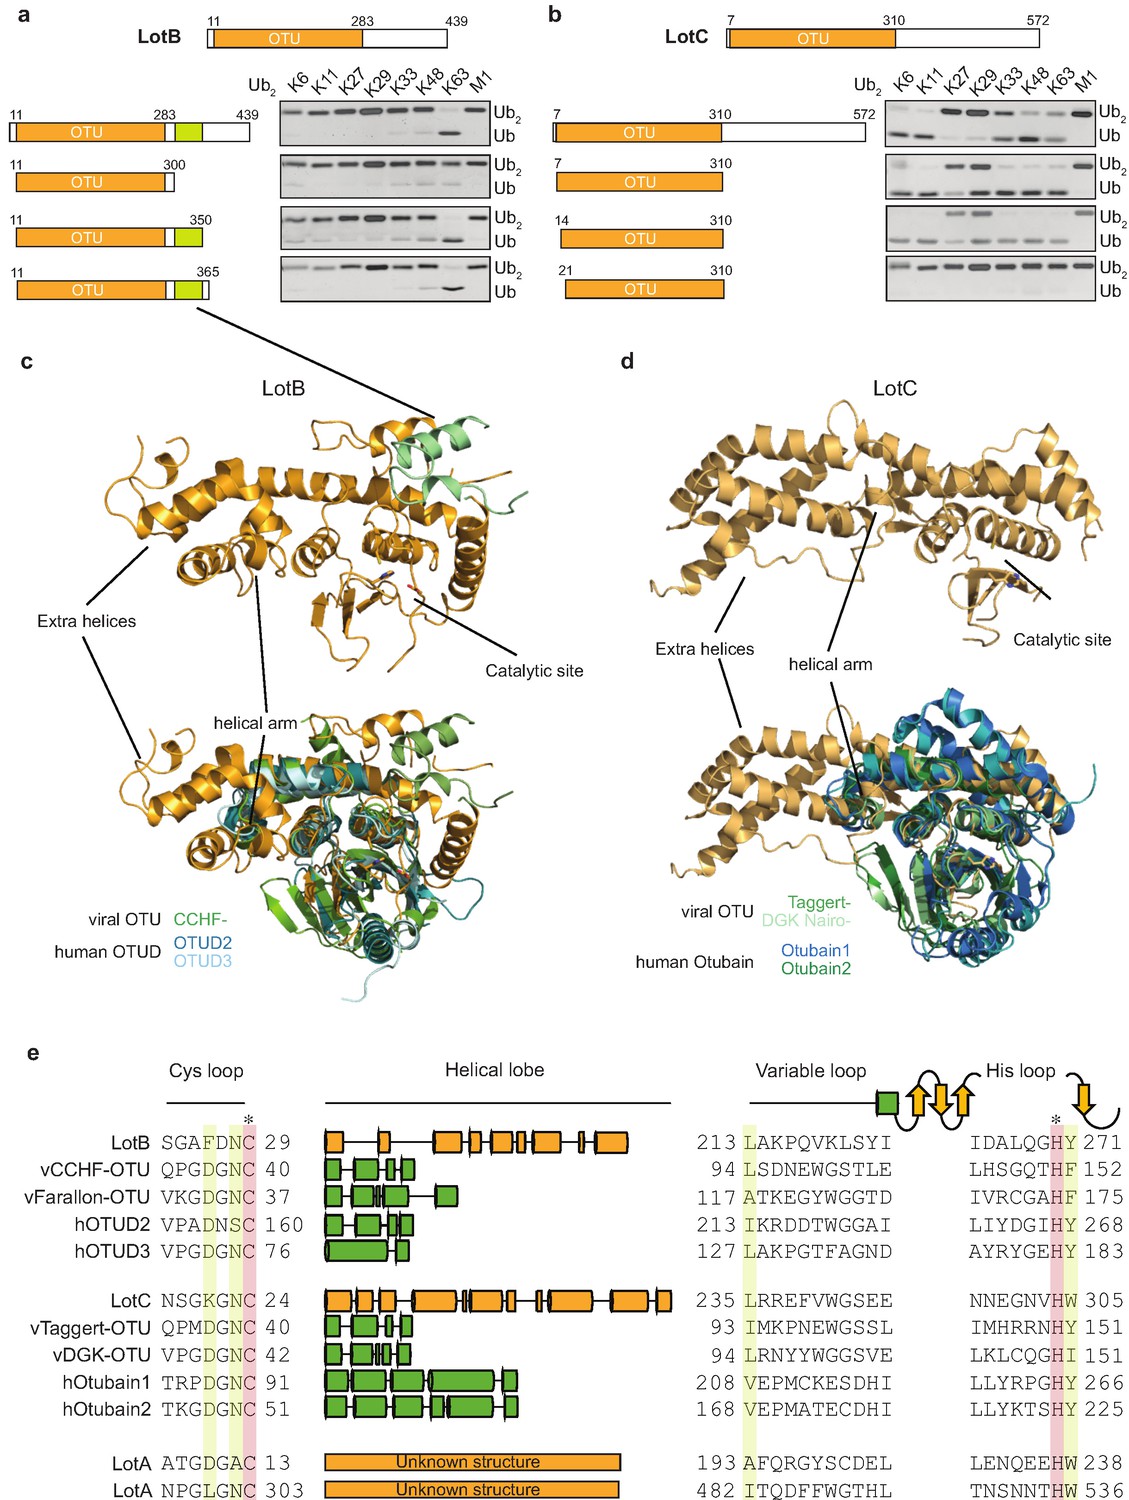
(a, b) Minimal domain boundaries of catalytically active LotB and LotC. Different constructs were cloned based on the predicted OTU-domains and their activity, and were tested with di-Ub panel. (c, d) Structural comparison of LotB and LotC with the closest homologues. CCHF- (PDB: 3PHU), OTUD2 (PDB: 4BOQ), OTUD3 (PDB: 4BOU), Taggert- (PDB: 6D × 3), DGK nairo- (PDB: 6D × 2), Otubain1 (PDB: 2ZFY), Otubain2 (PDB: 4FJV). (e) Sequence alignment of LotB and LotC with their closest homologues. Catalytic cysteine and histidine are highlighted in red and conserved residues are highlighted in yellow.
Figure 3—figure supplement 1
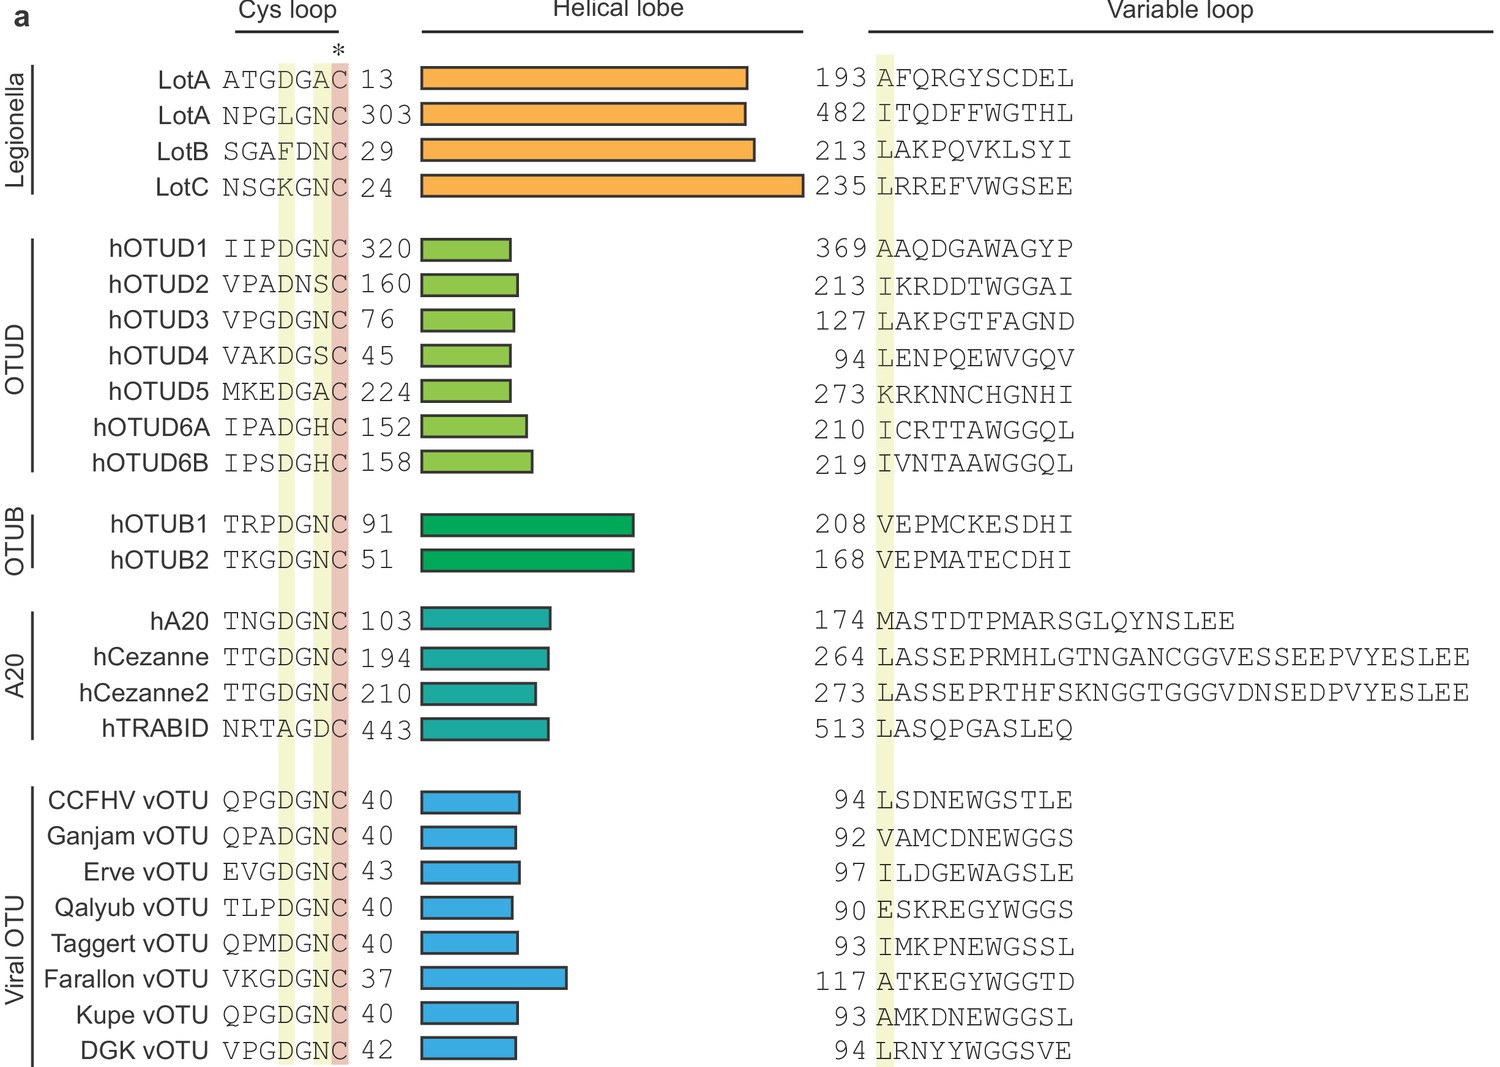
Sequence alignment of OTU deubiquitinase family.
The helical lobe between the catalytic Cys loop and the variable loop is shown as bar. The catalytic Cys is highlighted in red and conserved residues are highlighted in yellow.
Figure 4
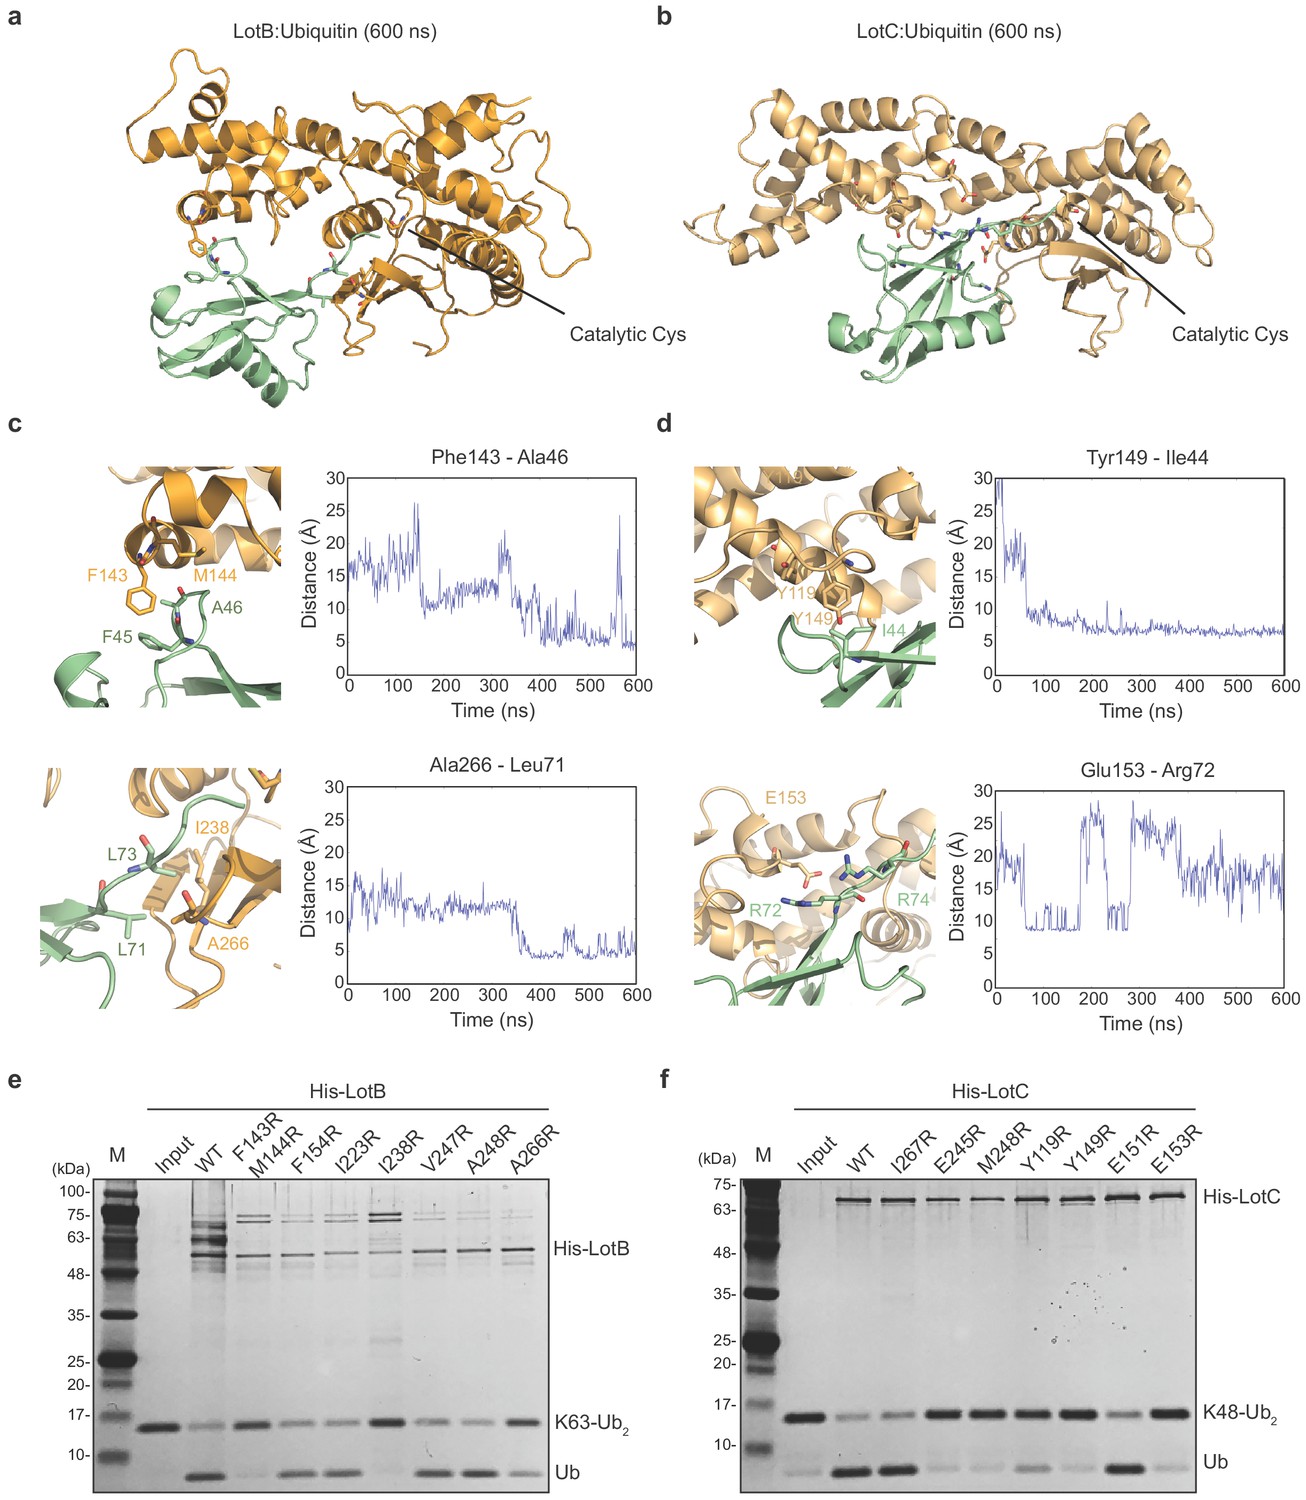
Ubiquitin-binding sites on LotB and LotC.
(a, b) Molecular docking and simulations of monoubiquitin to LotB and LotC. Shown are representative snapshots of the MD simulations. Catalytic cysteine and key residues for the interaction between ubiquitin and LotB or LotC are depicted as sticks. (c, d) Key residues mediating interactions between ubiquitin and LotB or LotC. Residues are highlighted in the structure (left). Side-chain center-of-mass distances are shown as a function of the simulation time (right). (e, f) Di-ubiquitin cleavage assay for mutants of LotB and LotC. The catalytic activity of LotB or LotC wild-type and their mutants was tested with K63- or K48-linked Ub2, respectively.
Figure 5 with 2 supplements
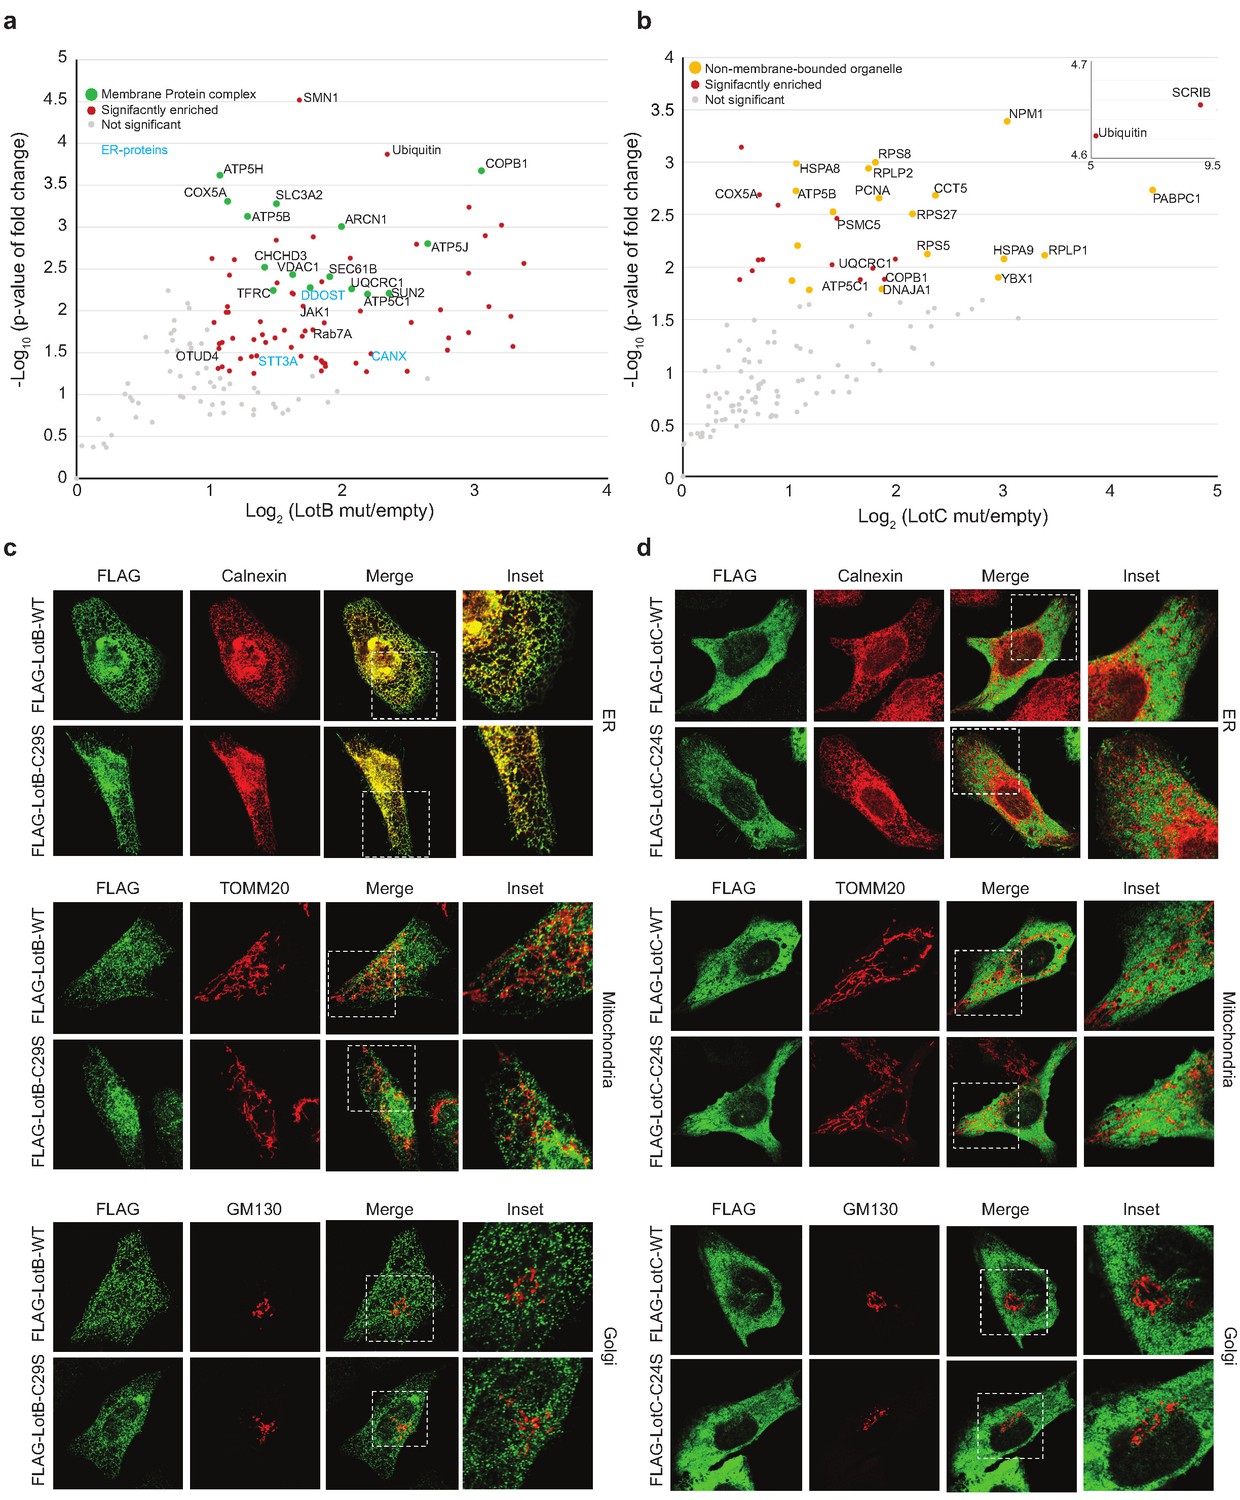
Host-interacting proteins and cellular localization of LotB and LotC.
(a, c) Proteomic analysis of interacting partners of LotB and LotC. Catalytically inactive FLAG-LotB (C29A) and FLAG-LotC (C24A) were transfected and immunoprecipitated. Co-precipitated interacting proteins were analyzed by mass spectrometry. (b, d) Cellular localization of LotB and LotC. FLAG-tagged LotB and LotC were ectopically expressed in U2OS cells and immune-stained with cellular organelle markers (endoplasmic reticulum: Calnexin, mitochondria: TOMM20, Golgi: GM130).
-
Figure 5—source data 1
Mass spectrometry data used in Figure 5a and b.
- https://cdn.elifesciences.org/articles/58277/elife-58277-fig5-data1-v2.xlsx
Figure 5—figure supplement 1
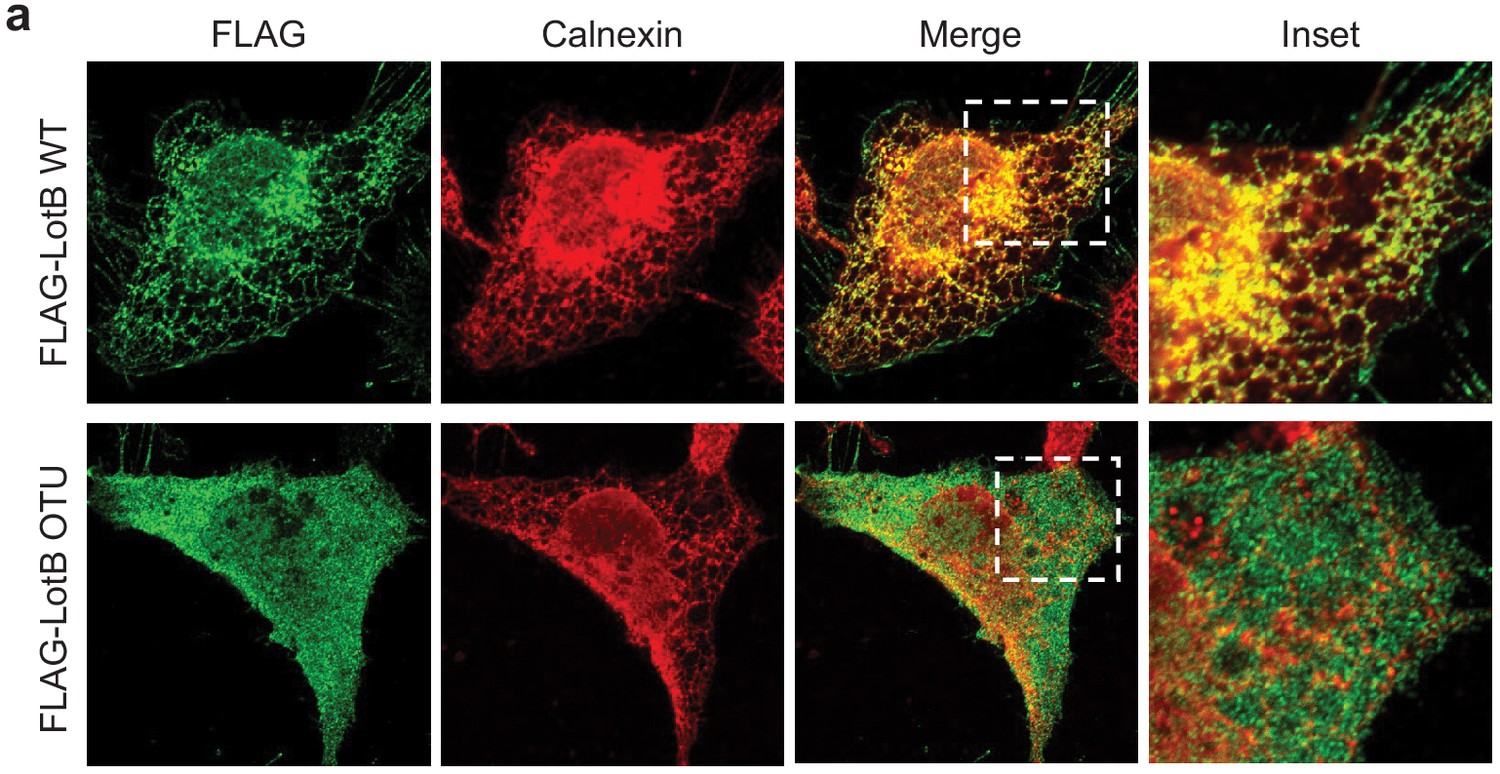
Cellular localization of LotB full-length and LotB-OTU.
FLAG-tagged LotB or LotC-OTU catalytic core was ectopically expressed in U2OS cells and immune-stained with cellular organelle markers (endoplasmic reticulum: Calnexin, mitochondria: TOMM20, Golgi: GM130).
Figure 5—figure supplement 2
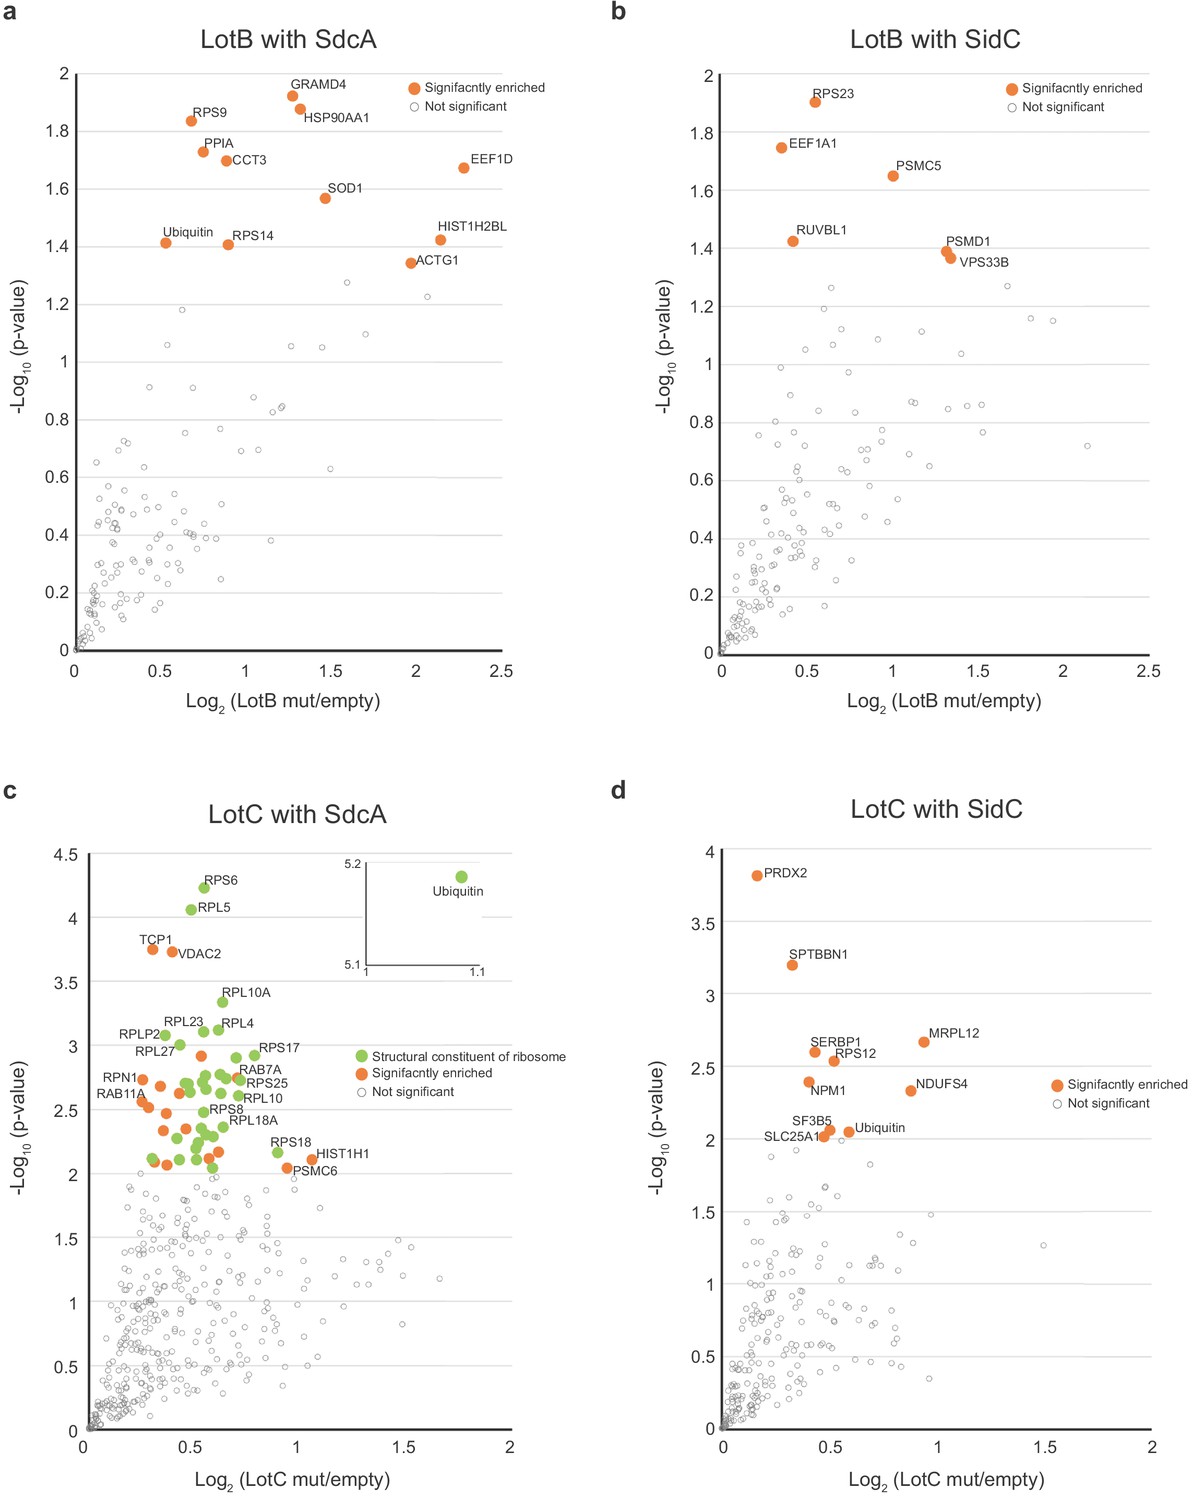
Proteomic analysis of interacting partners of LotB and LotC together with Legionella E3s.
(a, b) Proteomic analysis of interacting partners of LotB together with SdcA and SidC, respectively. Catalytically inactive FLAG-LotB (C29A) was co-transfected with either SdcA or SidC and immunoprecipitated. Co-precipitated interacting proteins were analyzed by mass spectrometry. (c, d) Proteomic analysis of interacting partners of LotC together with SdcA and SidC, respectively. Catalytically inactive FLAG-LotC (C24A) was co-transfected with either SdcA or SidC and immunoprecipitated. Co-precipitated interacting proteins were analyzed by mass spectrometry.
-
Figure 5—figure supplement 2—source data 1
Mass spectrometry data used in Figure 5—figure supplement 2a, b.
- https://cdn.elifesciences.org/articles/58277/elife-58277-fig5-figsupp2-data1-v2.xlsx
-
Figure 5—figure supplement 2—source data 2
Mass spectrometry data used in Figure 5—figure supplement 2c, d.
- https://cdn.elifesciences.org/articles/58277/elife-58277-fig5-figsupp2-data2-v2.xlsx
Figure 6

Substrate identification of LotB and LotC proteomic analysis of potential substrates of LotB and LotC.
(a–c) Schematic of the experiment and subsequent validation using western blot. (d, e) Volcano plot depicting the identified proteins with corresponding fold change and p-values. Comparison was done between Mut and WT deubiquitinase (DUB). Enriched proteins with Log2 Fold change ≥ 0.5 along with −Log10 p-value ≥ 1.3 was considered for further validation. (f–h) Immunoprecipitation of myc from the infected lysates was performed to enrich the potential substrates for LotB, which are RYK, Rab13, and PCYT1A, and for LotC, which are VAT1, HMOX1, and PPP2R1A, respectively. The enriched potential substrates were further incubated with wild-type or catalytic dead mutant DUB, followed by western blotting to detect ubiquitin and myc expression.
-
Figure 6—source data 1
Mass spectrometry data used in Figure 6d.
- https://cdn.elifesciences.org/articles/58277/elife-58277-fig6-data1-v2.xlsx
-
Figure 6—source data 2
Mass spectrometry data used in Figure 6e.
- https://cdn.elifesciences.org/articles/58277/elife-58277-fig6-data2-v2.xlsx
Tables
Table 1
TOP five candidates for putative deubiquitinases (DUBs) from Legionella effector proteins.
| Legionella proteins | Target proteins | |||||
|---|---|---|---|---|---|---|
| Name | Aligned region | Name | Aligned region | Probability (%) | Identities (%) | PDB ID_Chain |
| Lpg1621 | 195–274 | Viral OTU (CC hemorrhagic fever virus) | 69–157 | 92.59 | 16 | 3PHU_B |
| 195–274 | Human OTUD2 | 63–140 | 92.52 | 17 | 4BOQ_A | |
| 195–279 | Human OTUD3 | 59–142 | 92.40 | 13 | 4BOU_A | |
| 193–278 | Human OTUD5 | 100–183 | 91.18 | 21 | 3PFY_A | |
| 192–279 | Viral OTU (Farallon virus) | 88–183 | 91.08 | 16 | 6D × 5_B | |
| Lpg2529 | 1–310 | Viral OTU (Erve virus) | 17–157 | 96.24 | 18 | 5JZE_A |
| 7–310 | Viral OTU (Dera Ghazi Khan orthonairovirus) | 25–156 | 96.15 | 18 | 6D × 2_B | |
| 20–310 | Human Otubain1 | 50–234 | 96.02 | 13 | 2ZFY_A | |
| 20–310 | Human Otubain2 | 50–233 | 95.84 | 13 | 4FJV_C | |
| 7–310 | Viral OTU (Taggert virus) | 23–156 | 95.71 | 13 | 6D × 3_D | |
| Lpg2411 | 110–216 | Yeast UCH8 | 152–259 | 37.94 | 11 | 3MHS_A |
| 183–272 | EntA-im (Enterococcus faecium) | 7–89 | 37.06 | 15 | 2BL8_B | |
| 33–94 | Uncharacterized protein (Corynebacterium diphtheriae) | 7–72 | 36.65 | 21 | 3KDQ_D | |
| 120–212 | PG0816 (Porphyromonas gingivalis) | 53–139 | 35.31 | 16 | 2APL_A | |
| 104–114 | PSII reaction center protein K (Cyanidium caldarium) | 2–12 | 32.96 | 36 | 4YUU_X2 | |
| Lpg2907 | 117–384 | AvrA (Salmonella typhimurium) | 59–299 | 100 | 11 | 6BE0_A |
| 158–398 | PopP2 (Arabidopsis thaliana) | 99–339 | 99.93 | 13 | 5W3X_C | |
| 115–390 | HopZ1a (Pseudomonas syringae) | 54–342 | 99.88 | 10 | 5KLP_C | |
| 118–275 | XopD (Xanthomonas campestris) | 1–148 | 95.53 | 11 | 2OIX_A | |
| 95–276 | Human SENP1 | 2–177 | 95.21 | 16 | 2G4D_A | |
-
Values are obtained from the HHpred server (MPI Bioinformatics Toolkit).
Additional files
-
Supplementary file 1
Data collection and refinement statistics table.
- https://cdn.elifesciences.org/articles/58277/elife-58277-supp1-v2.docx
-
Transparent reporting form
- https://cdn.elifesciences.org/articles/58277/elife-58277-transrepform-v2.docx
Download links
A two-part list of links to download the article, or parts of the article, in various formats.
Downloads (link to download the article as PDF)
Open citations (links to open the citations from this article in various online reference manager services)
Cite this article (links to download the citations from this article in formats compatible with various reference manager tools)
Bacterial OTU deubiquitinases regulate substrate ubiquitination upon Legionella infection
eLife 9:e58277.
https://doi.org/10.7554/eLife.58277


