The host exosome pathway underpins biogenesis of the human cytomegalovirus virion
- Infection and Immunity Program, Monash Biomedicine Discovery Institute, Department of Microbiology, Monash University, Australia
- School of Biological Sciences, Monash University, Australia
- Department of Immunobiology and BIO5 Institute, University of Arizona, United States
- Infection and Immunity Program, Monash Biomedicine Discovery Institute, Department of Biochemistry and Molecular Biology, Monash University, Australia
- ARC Centre of Excellence in Advanced Molecular Imaging, Monash University, Australia
- University of Warwick, United Kingdom
Figures
Figure 1 with 1 supplement
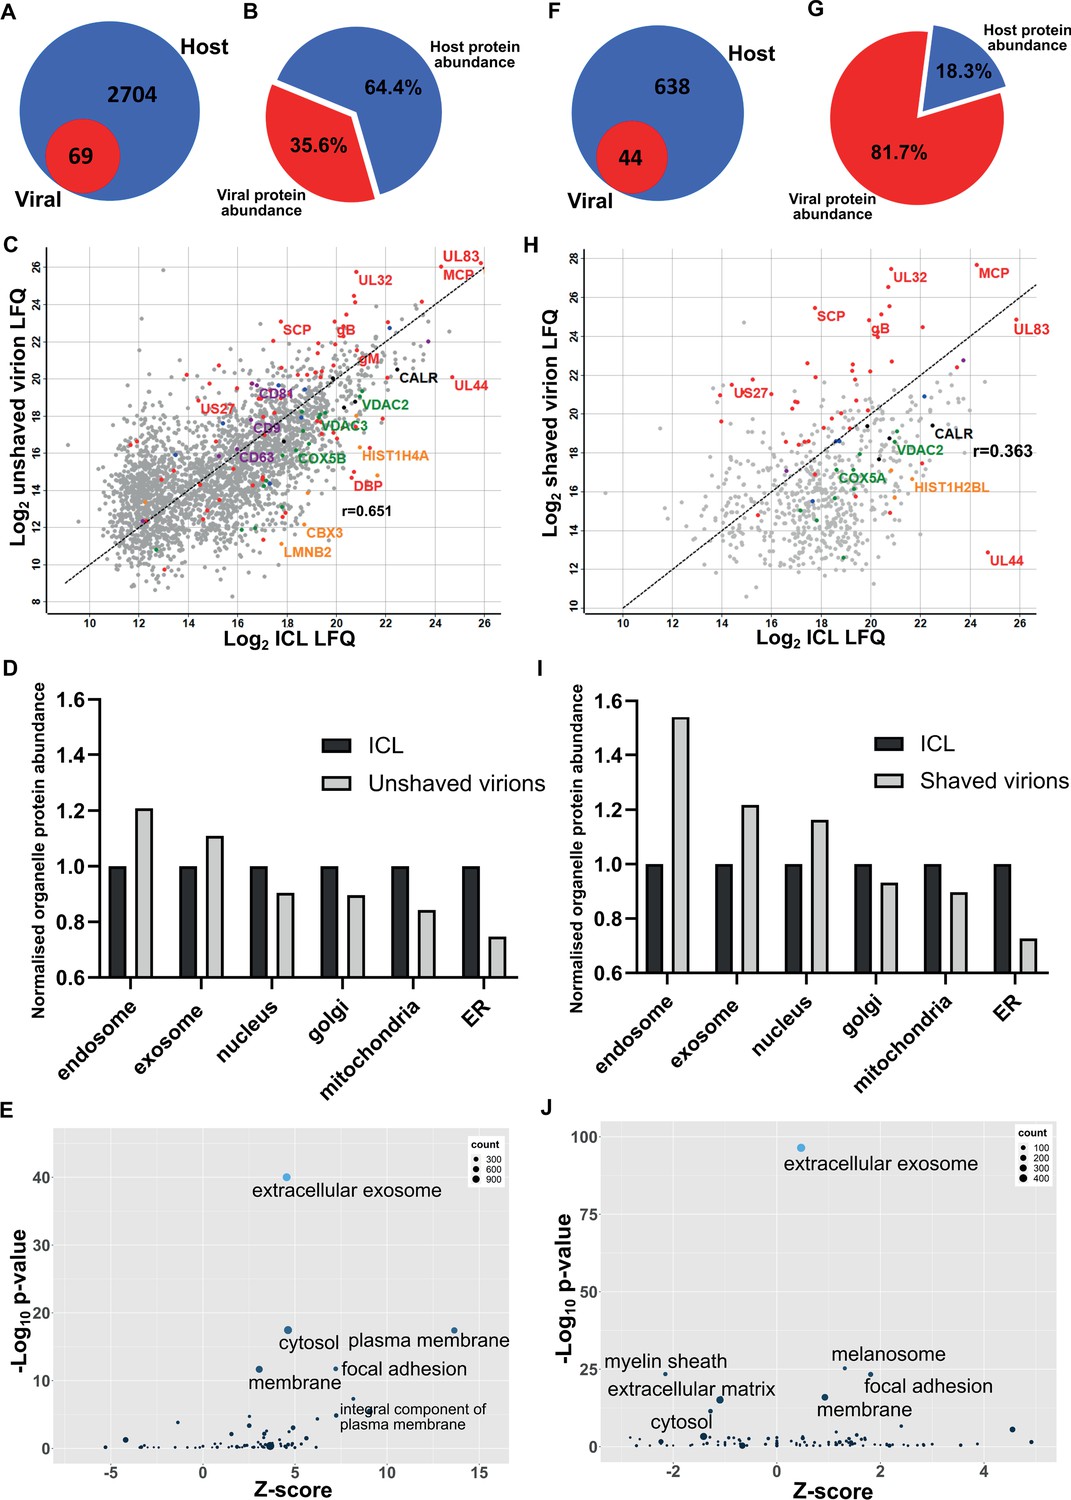
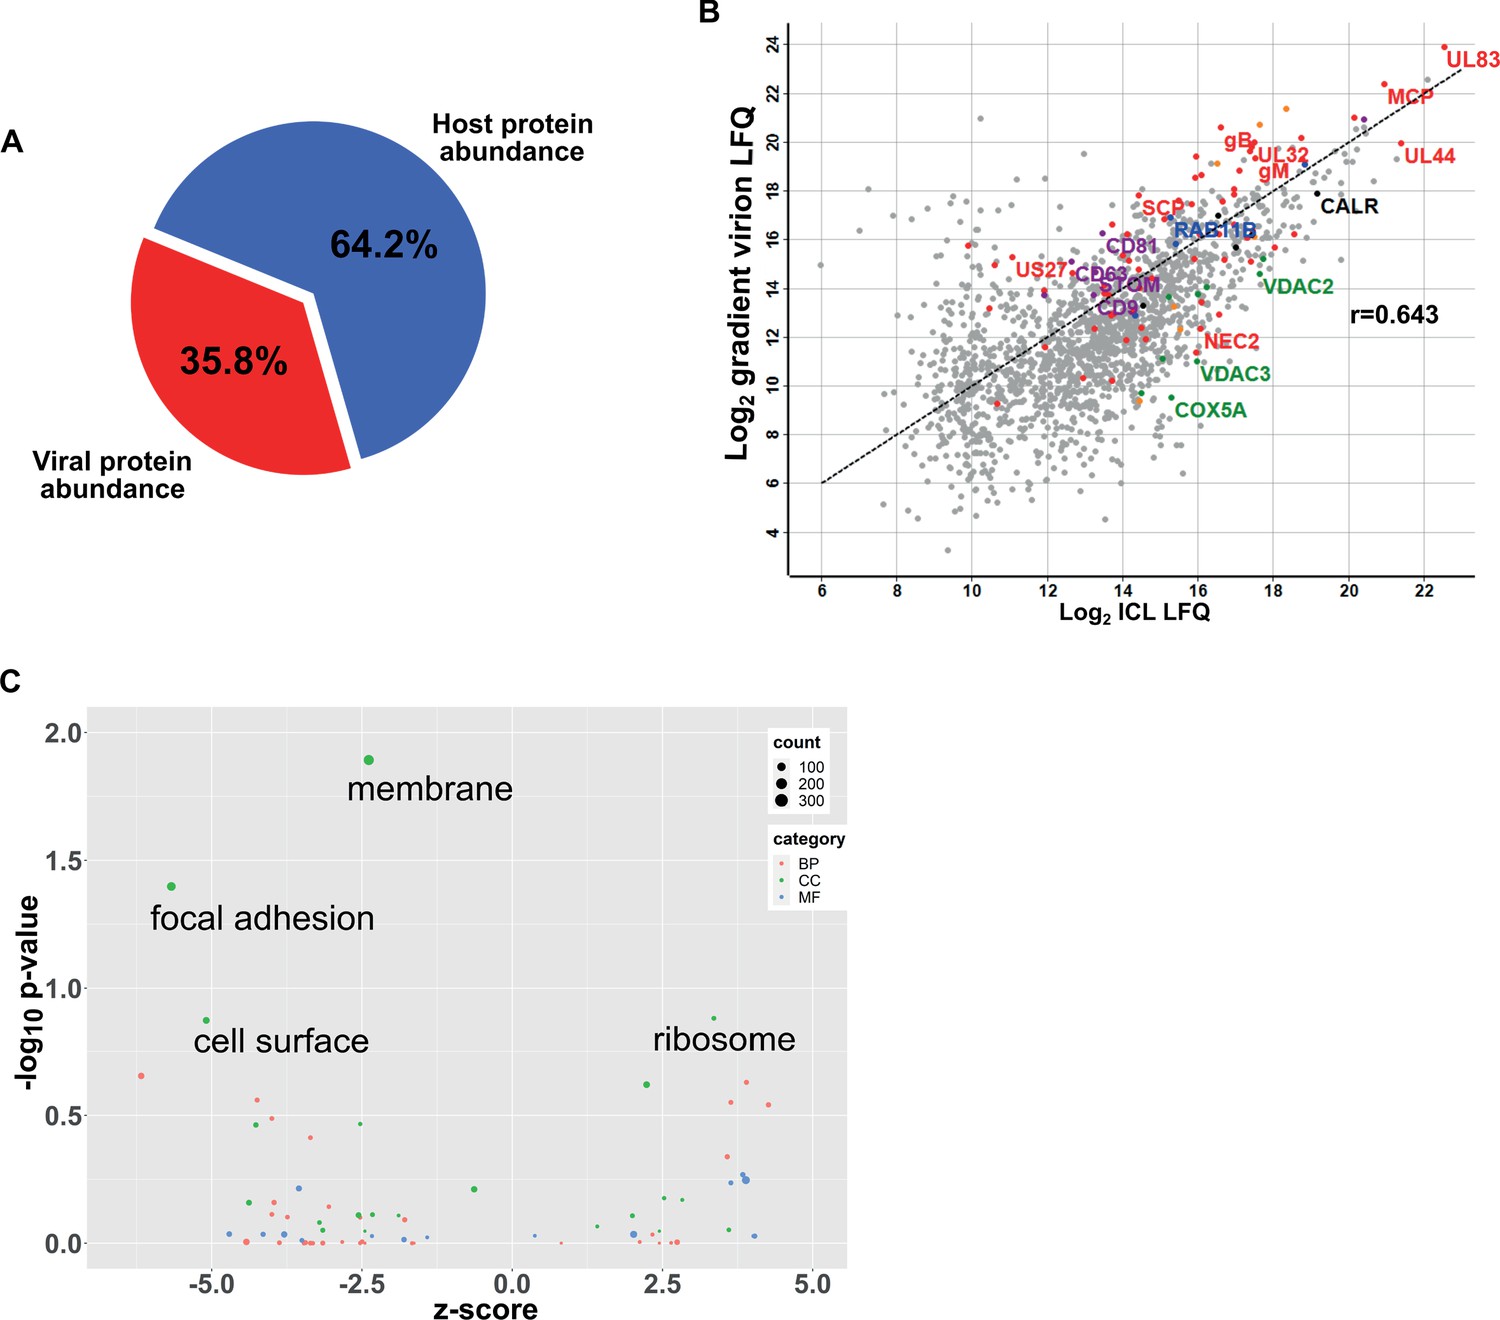
Proteomic analysis reveals HCMV virions are significantly enriched with host exosome proteins.
(A) Total number of host and viral proteins identified in the virion by mass spectrometry. (B) Abundance proportions of host and viral proteins in the virion, as determined by MaxQuant label-free quantitation (LFQ). (C) Scatter plot of unshaved virion proteins versus HCMV infected cellular lysate (ICL), 5 DPI, MOI = 3. Red: HCMV proteins, green: select mitochondrial marker proteins, orange: nuclear markers, black: endoplasmic reticulum markers, blue: endosome markers, purple: exosome markers. Equation of line: y = x, r = 0.651. (D) Relative abundance of various host organelles in ICL compared to virions purified from infected cell culture supernatant. Total organelle abundance was calculated by summing individual protein abundance. (E) Gene ontology (cellular component) enrichment analysis of unshaved virions compared to ICL background. Analysis was performed using DAVID Functional Annotation and results plotted with GOPlot. (F) Number of host and viral proteins identified in the virion following proteinase K surface shaving. (G) Abundance proportions of host and viral proteins in surface shaved virions. (H) Scatter plot of all proteinase K shaved virion proteins versus HCMV ICL. Red: HCMV proteins, green: select mitochondrial marker proteins, orange: nuclear markers, black: endoplasmic reticulum markers, blue: endosome markers, purple: exosome markers. Equation of line: y = x, r = 0.363. (I) Relative abundance of various host organelles in ICL compared to proteinase K-shaved HCMV virions. (J) Gene ontology (cellular component) enrichment analysis of proteinase K shaved virions compared to ICL background. Performed with DAVID as for (E).
Figure 1—figure supplement 1
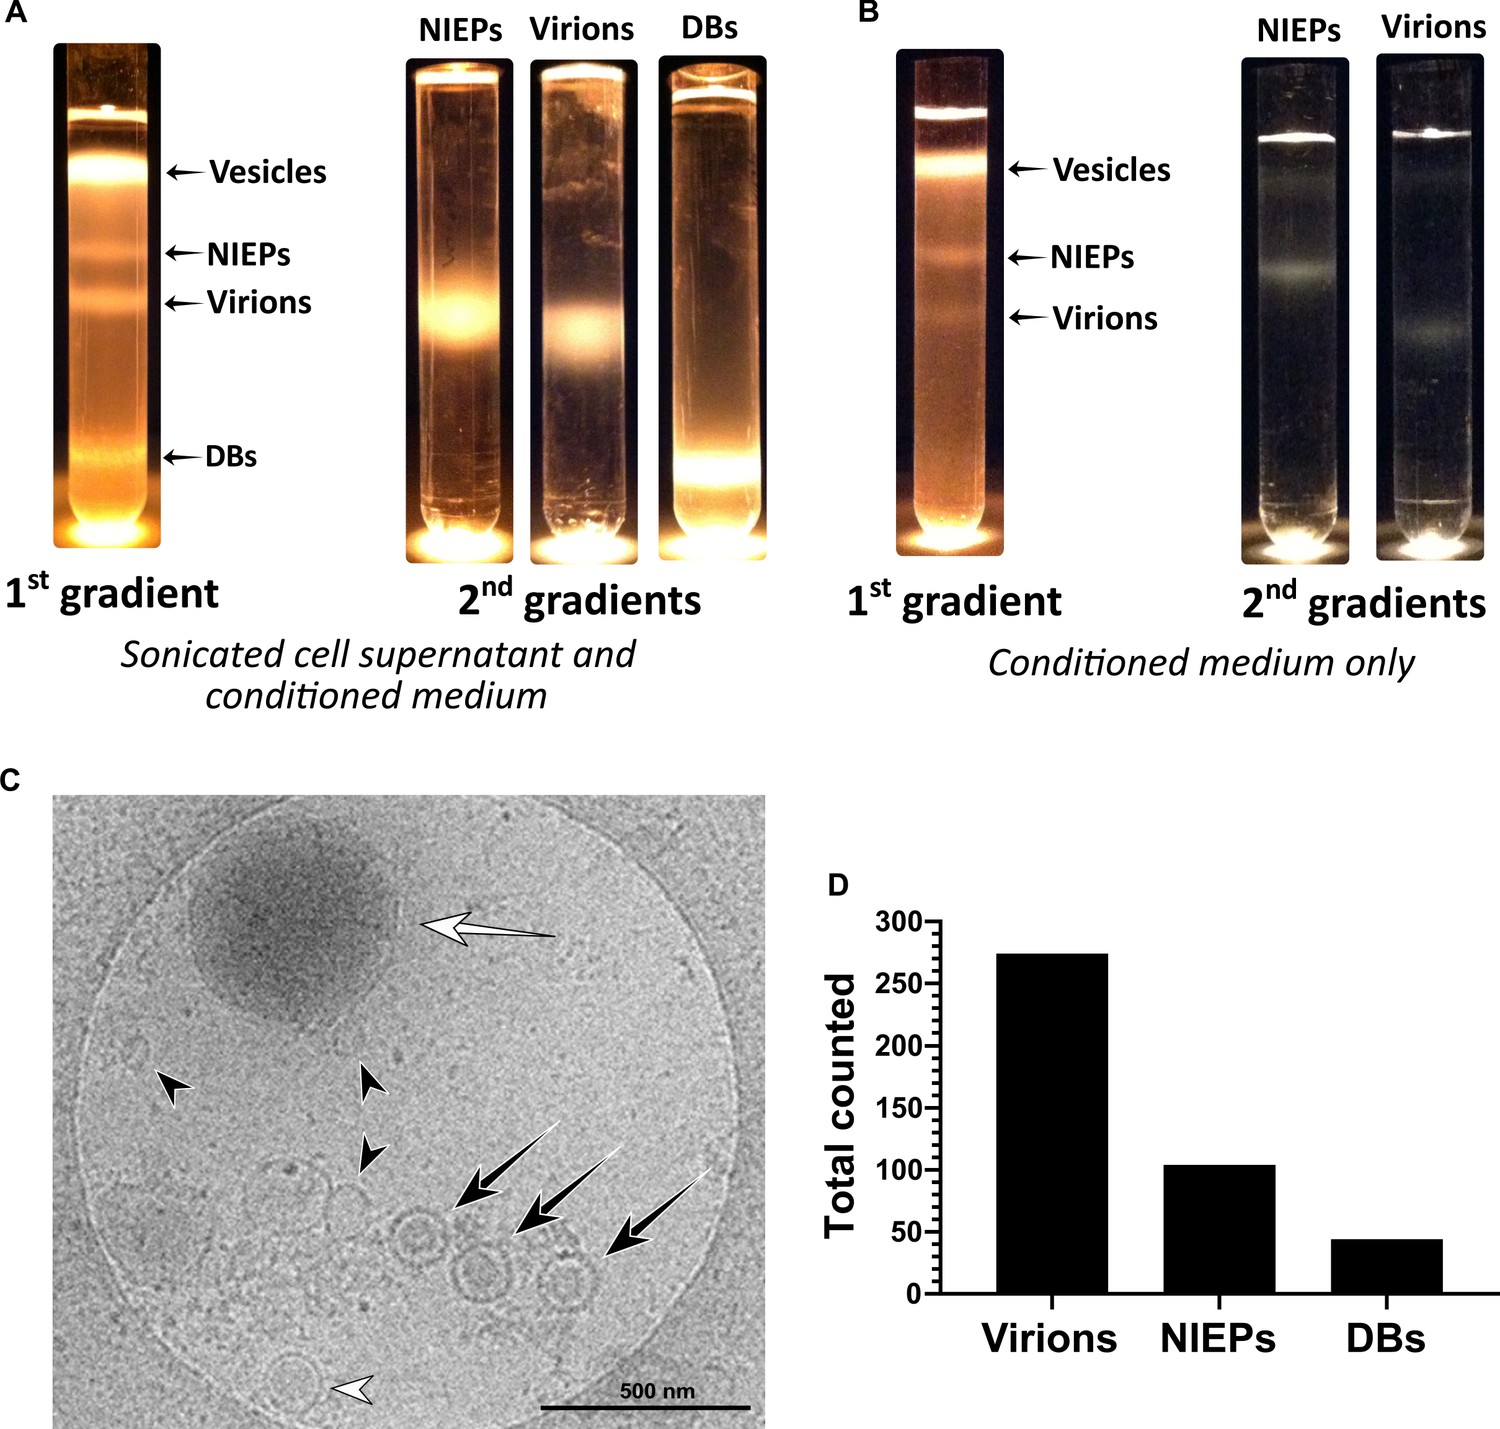
Separation of virions, NIEPs and Dense Bodies using glycerol-tartrate gradient centrifugation.
(A) Conditioned medium from HCMV infected cells was collected and combined with supernatant released from sonicated cells, passed through a sorbitol cushion, and then loaded onto a glycerol-tartrate gradient for ultracentrifugation-based separation. NIEP, virion and DB bands were individually extracted and re-isolated on secondary gradients. (B) Conditioned medium from HCMV infected cells was collected (cell disruption omitted), and processed as in (A). (C) Representative electron micrograph of HCMV particles and vesicles in conditioned medium. White arrow: DB, white arrowhead: NIEP, black arrows: virions, black arrowheads: vesicles. Scale bar = 500 nm. (D) Quantitation of each particle type from (C). NIEP: Non-Infectious Enveloped Particle, DB: Dense body.
Figure 2 with 4 supplements
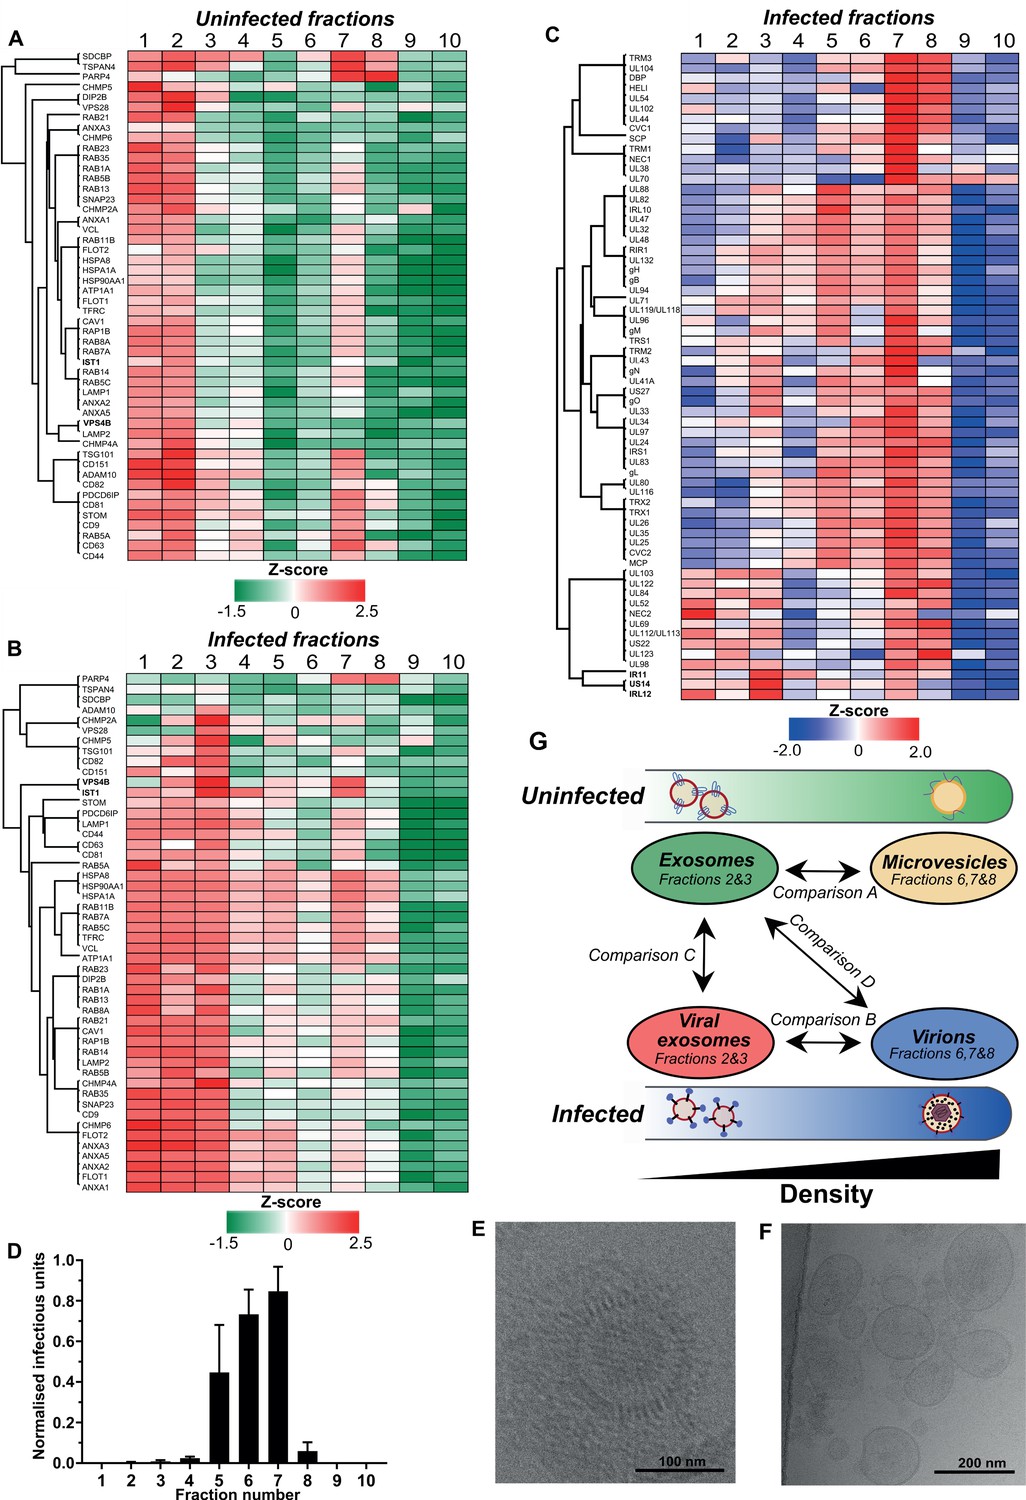
Exosomes and HCMV virions can be separated by their buoyant density.
Supernatant from uninfected and infected cells was collected, resolved by Optiprep density gradient ultracentrifugation, 10 fractions (increasing density) extracted and proteins identified by mass spectrometry (n = 3 for each condition). Protein abundance was determined by MaxQuant label-free quantitation, and mean values from the triplicate were Z-scored across gradient fractions, and plotted using Perseus. Heatmap distribution of 50 exosome markers, across (A) uninfected gradient fractions, or (B) HCMV infected gradient fractions. (C) Enrichment of HCMV proteins across infected gradient fractions. (D) Infectious units in each fraction, as determined by the IE1 reporter plate assay (n = 4, bars = SEM). (E-F) Representative cryogenic transmission electron micrographs of infected gradient fractions 7 (E) and 3 (F). (G) Schematic summary of all vesicle populations that resolved across density gradients in the current study.
Figure 2—figure supplement 1
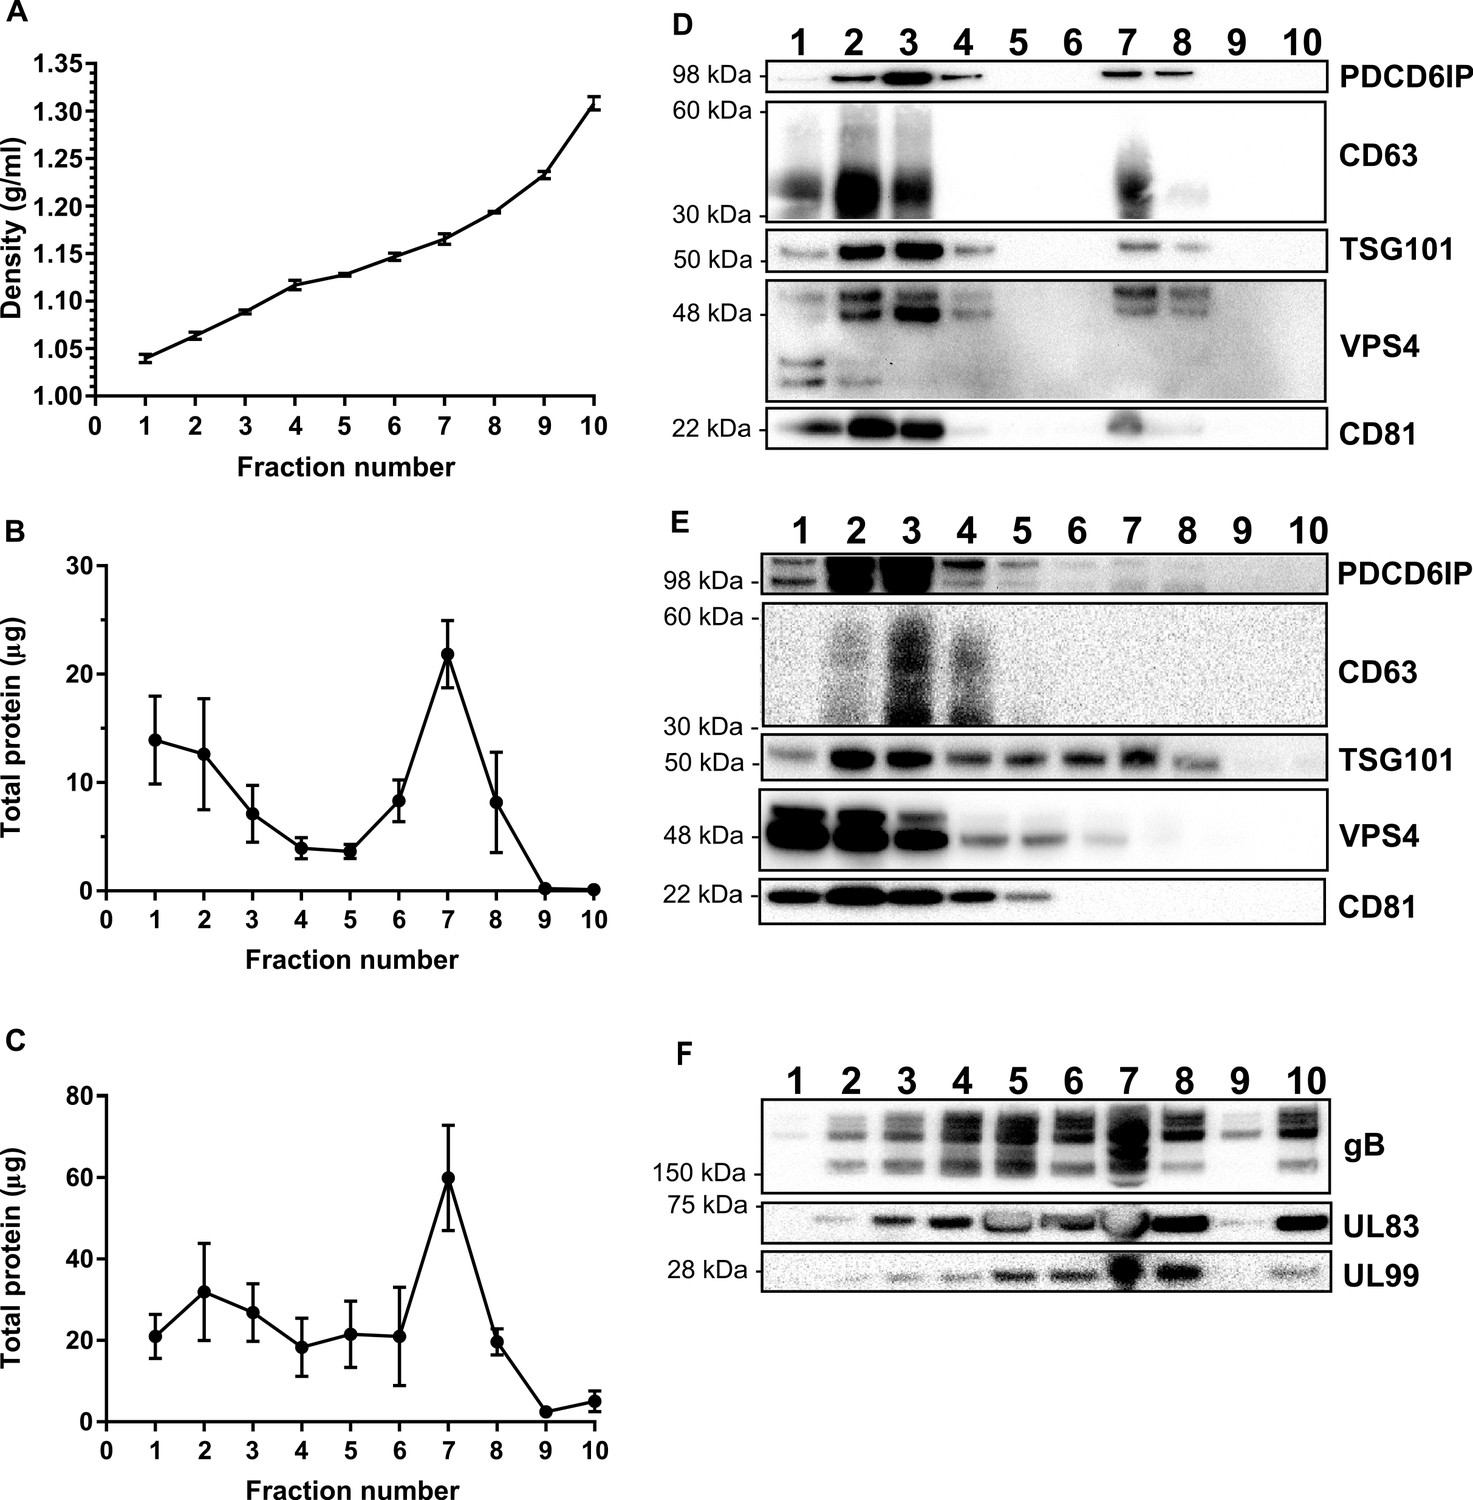
Separation and characterization of vesicles and particles resolved by OptiPrep gradients.
(A) Calculated density of individual gradient fractions. Control fractions were diluted according to manufacturers instructions (AXIS SHIELD), the absorbance measured in triplicate at 340 nm, and density determined using the AXIS SHIELD standard curve equation: density = (Abs+3.8304)/3.8133 g/ml (n = 3, bars = SEM). (B-C) Proteins in each fraction were separated by SDS-PAGE, stained with SYPRO ruby, and quantified by densitometry against the BenchMark Protein Ladder. Uninfected fractions (F) and infected fractions (G), n = 3, bars = SEM. Representative western blot analysis of classical exosome markers across (D) uninfected and (E) HCMV infected gradient fractions. (F) Viral protein marker expression across HCMV infected gradient fractions.
Figure 2—figure supplement 2
Cluster analysis of all proteins detected from OptiPrep gradient fractions.
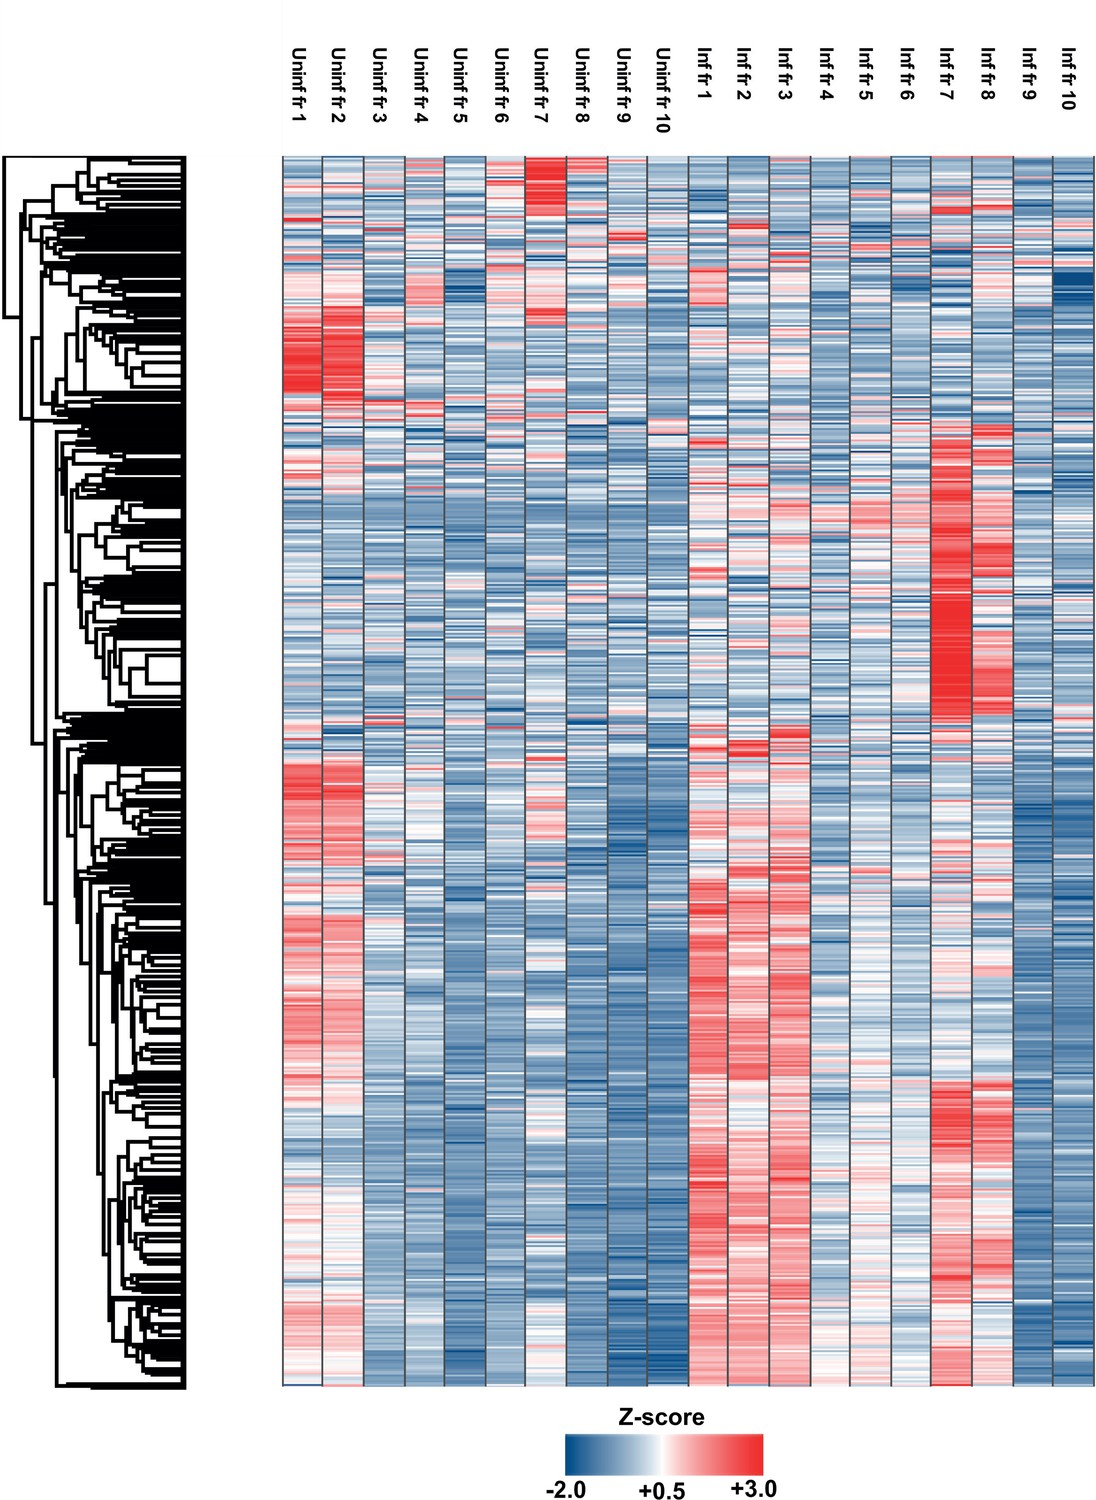
Conditioned medium from uninfected and infected cells was collected, resolved by Optiprep density gradient ultracentrifugation, and proteins from 10 fractions from each condition (increasing density) extracted and analyzed by mass spectrometry (n = 3 for each condition). Protein abundance was determined by MaxQuant-based label-free quantitation, and mean values from the triplicate were Z-scored across gradient fractions, and plotted using Perseus. Heatmap shows the distribution of all 2012 proteins detected across uninfected and infected gradients clustered using k-means.
Figure 2—figure supplement 3
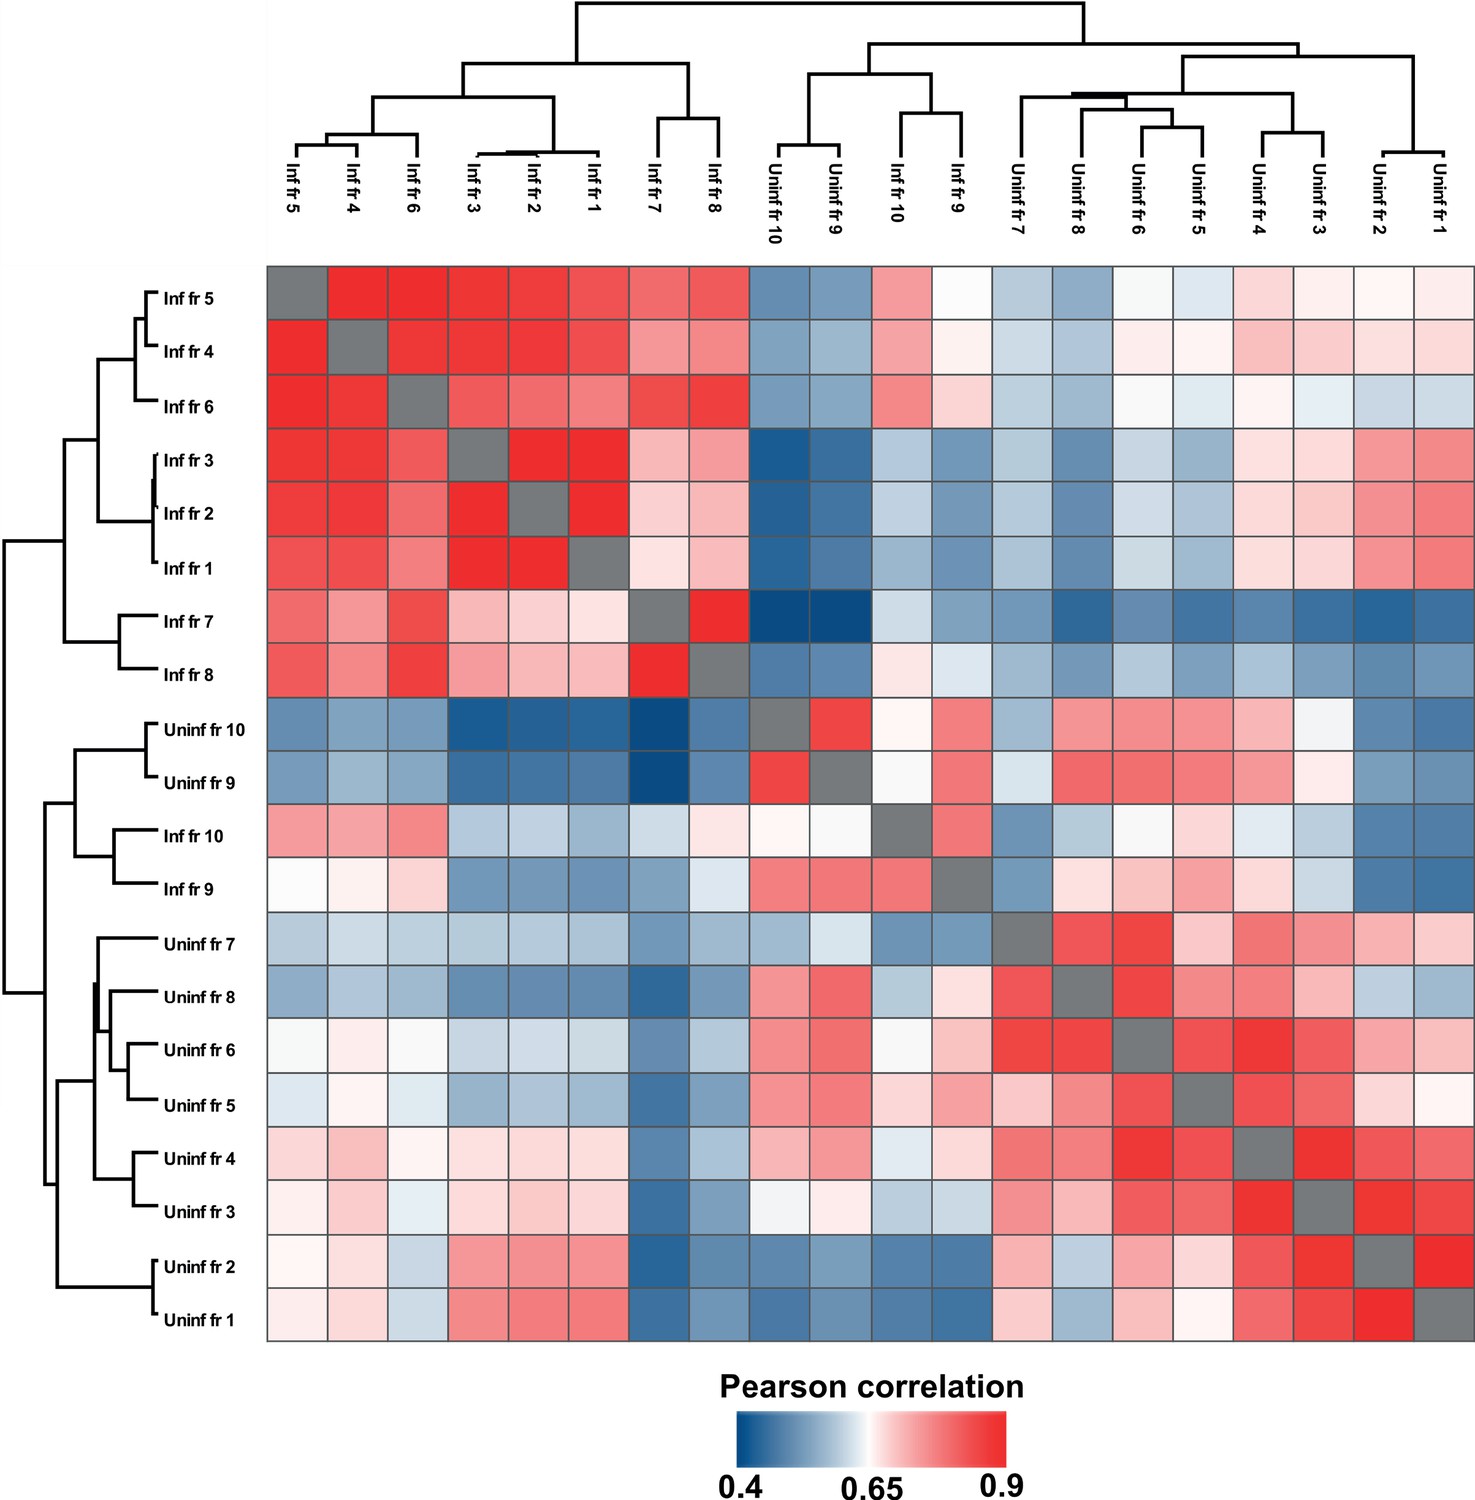
Pearson correlation of all OptiPrep gradient fractions.
Comparison of protein profiles from all uninfected and infected gradient fractions, as correlated by Pearson coefficient analysis (mean of 3 biological replicates). Populations were hierarchically clustered using k-means.
Figure 2—figure supplement 4
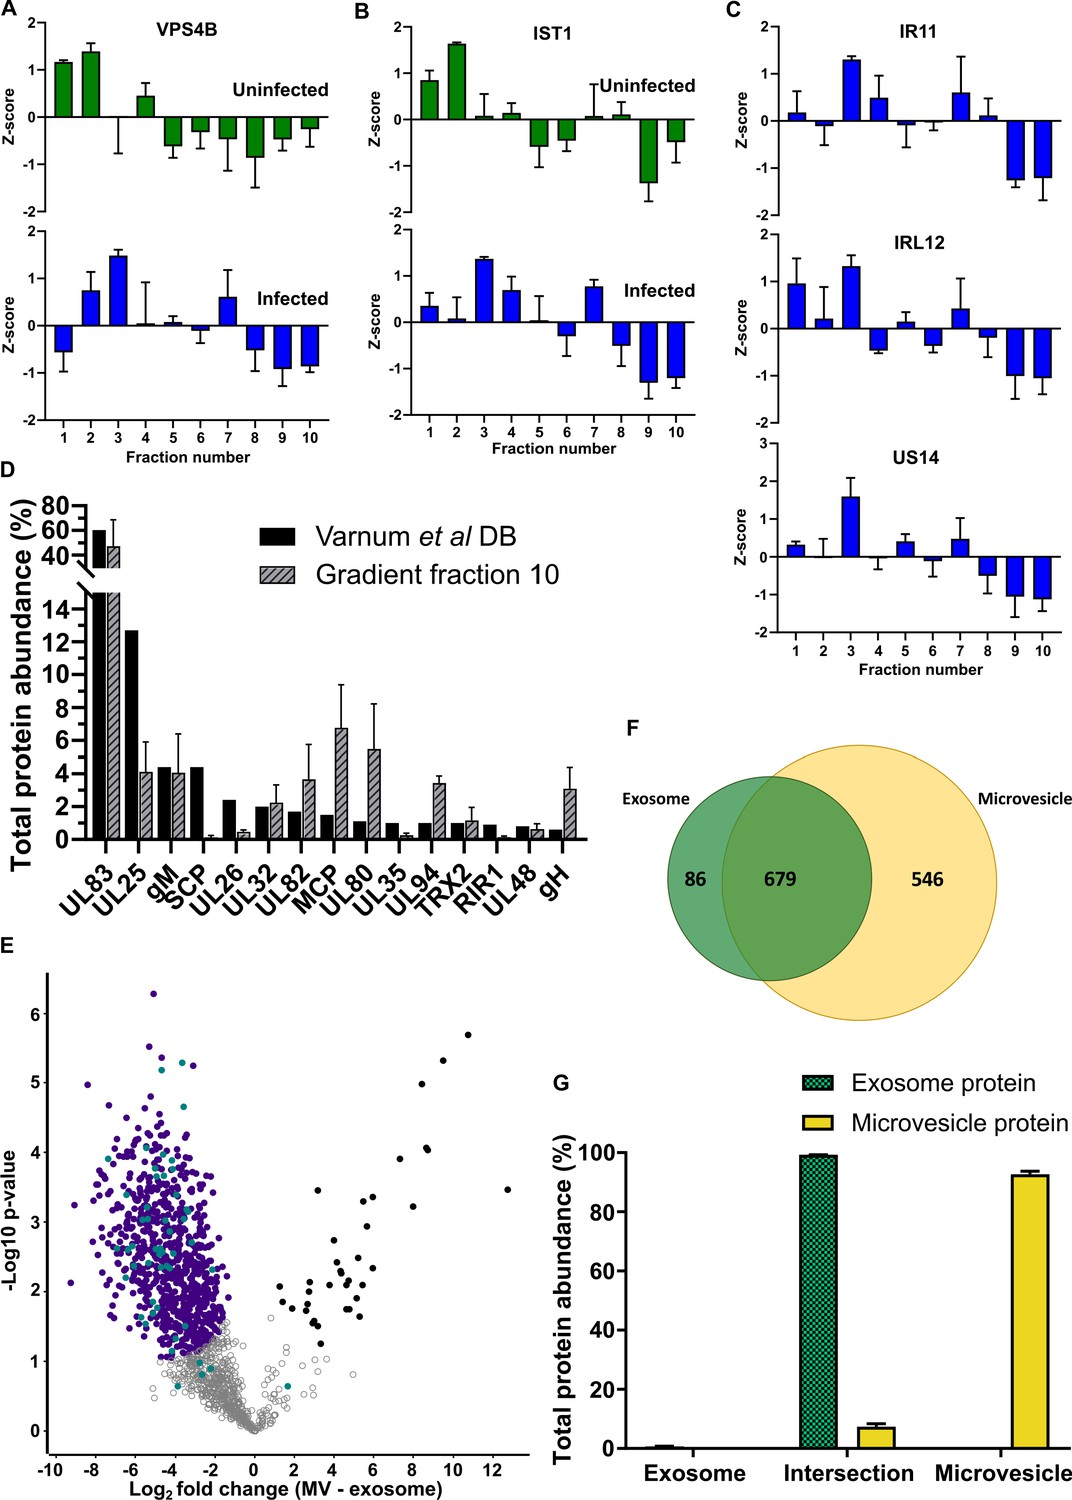
Enrichment of selected proteins across density gradients and exosome refinement.
Z-scores for each gradient fraction across uninfected and infected conditions for (A) VPS4B and (B) IST1. Green rectangles: uninfected fractions, Blue rectangles: infected fractions, (n = 3, bars = SEM). (C) Z-scores for viral exosome enriched viral proteins IR11, IRL12 and US14 across infected gradient fractions, (n = 3, bars = SEM). (D) Total protein abundance of the 15 top proteins identified by Varnum et al., 2004 in Dense Bodies compared to infected fraction 10. For OptiPrep gradient, (n = 3, bars = SEM). (E) Refinement of the exosome population. A more stringent exosome population was defined based on significant enrichment of proteins, compared to microvesicles. Purple circles: significantly enriched in exosomes, Teal circles: classical exosome markers, Black circles: significantly enriched in MVs, (n = 3, S0 = 0.4, FDR < 0.05, fold change >2). (F) Venn diagram depicting the total number, and proteins commonly identified in the refined exosomes (from E) and microvesicles. (G) Abundance of individual protein groups (based on Venn diagram in panel F), as a proportion of overall total protein abundance, in exosomes or microvesicles (n = 3, bars = SEM).
Figure 3 with 1 supplement
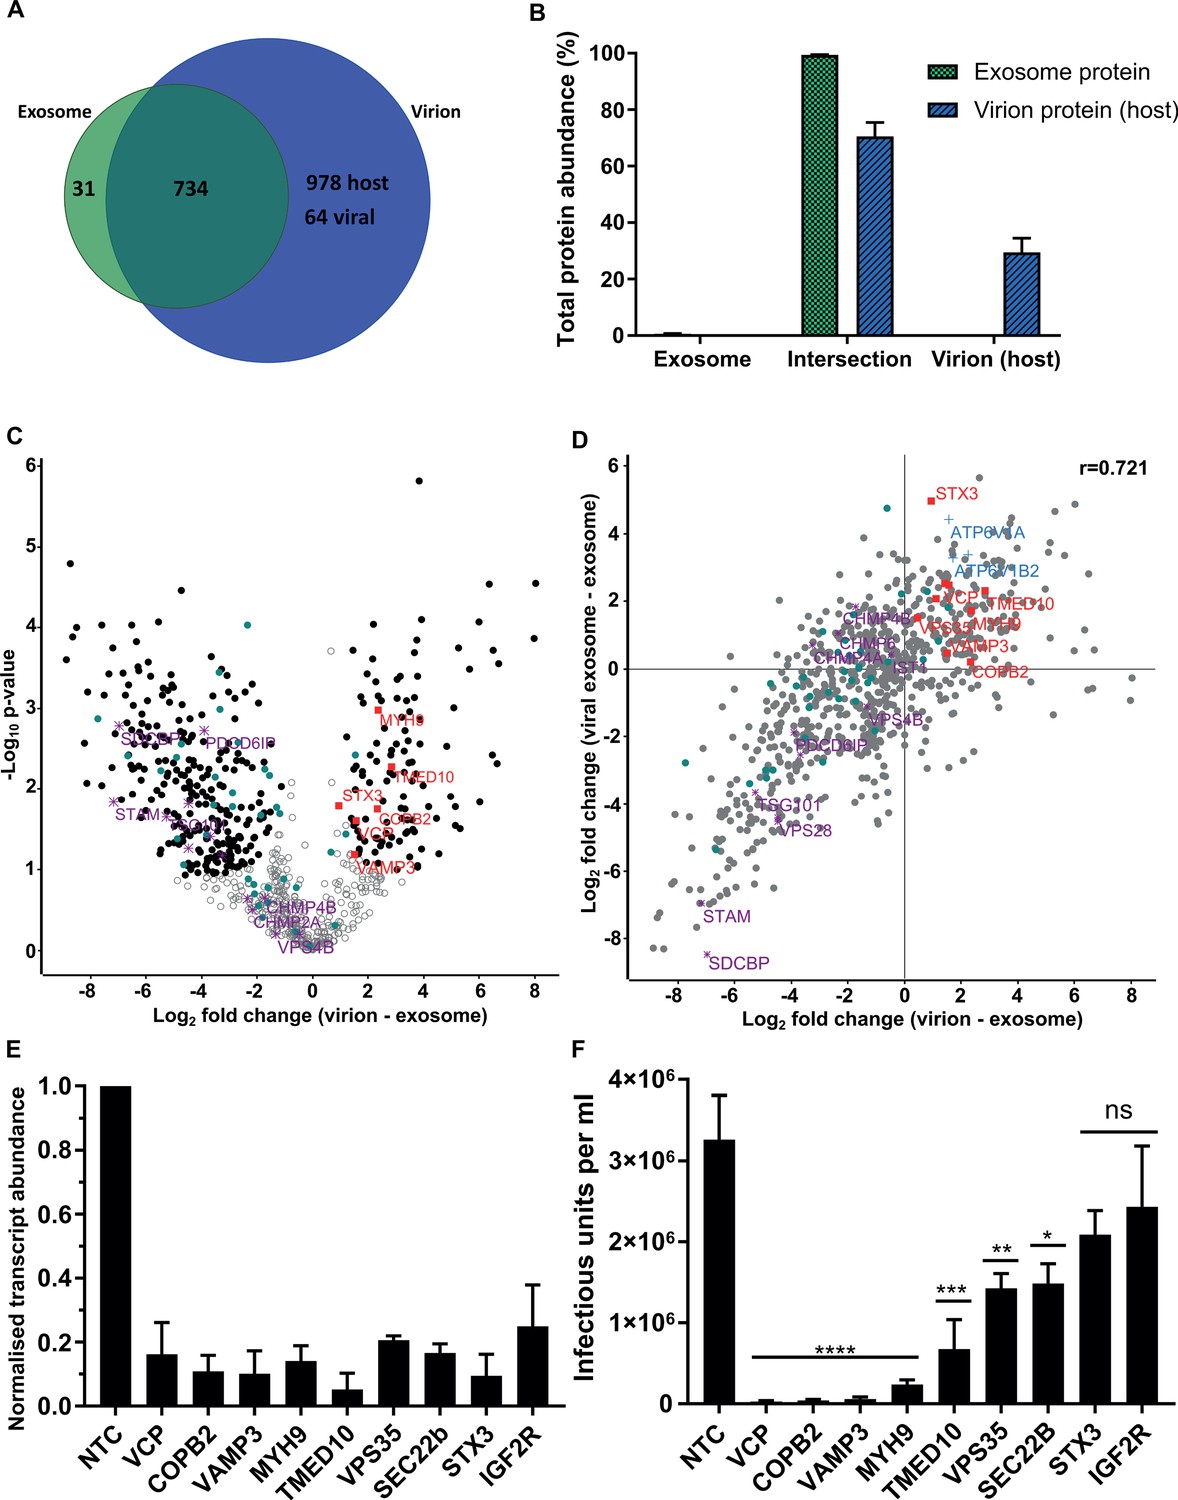
HCMV induces release of viral exosomes with remodelled host and viral cargo.
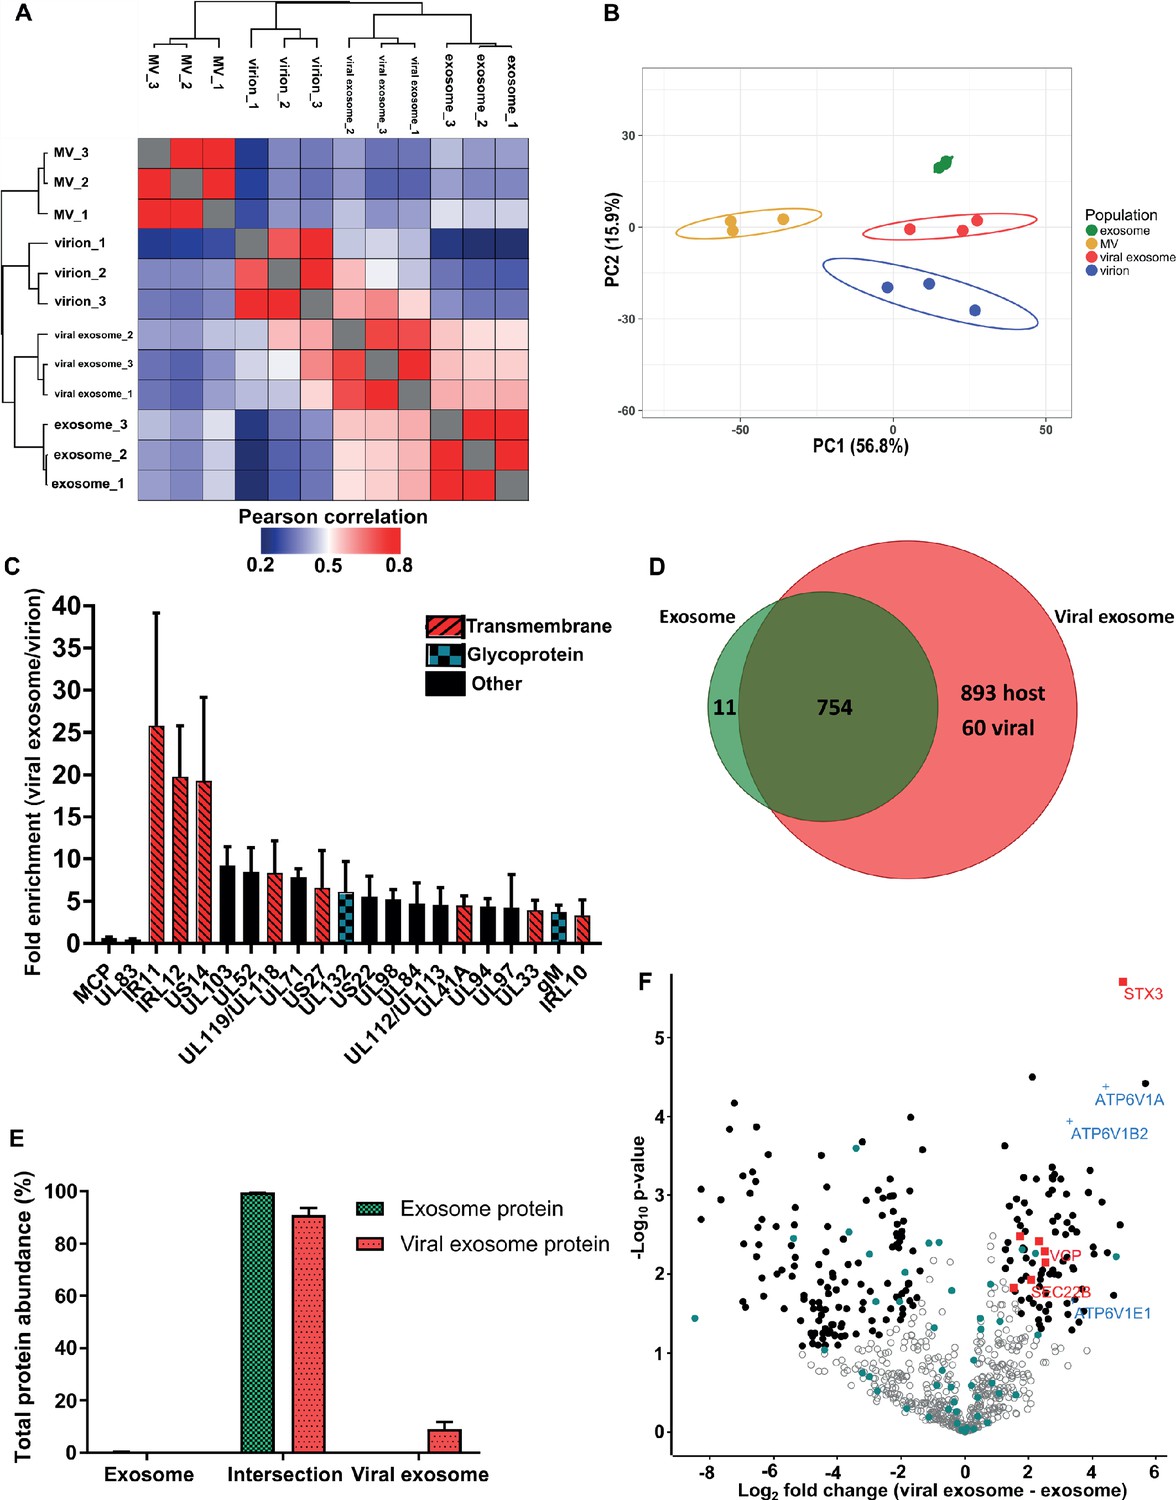
(A) Comparison of protein profiles from all vesicle populations and biological replicates, as correlated by Pearson coefficient analysis. Populations were hierarchically clustered using k-means. (B) Comparison of vesicle population protein signatures by principle component analysis. Individual points plotted represent biological replicates, and circles represent 95% confidence intervals. (C) Histogram showing the relative enrichment of viral proteins in viral exosomes, compared to virions (n = 3, bars = SEM). Red hatching: predicted TMHMM transmembrane domain, solid black: no predicted TM domain, blue squares: viral glycoprotein. (D) Venn diagram depicting the total number, and proteins commonly identified in exosomes and viral exosomes. (E) Abundance of individual protein groups (based on Venn diagram in panel D), as a proportion of overall total protein abundance, in exosomes or viral exosomes (n = 3, bars = SEM). (F) Volcano plot showing relative enrichment of host proteins in viral exosomes (positive fold change), compared to exosomes (negative fold change). Red squares: envelopment/egress candidates, Blue crosses: V-ATPase sub-units, Teal circles: classical exosome markers, Black circles: significant differential expression (n = 3, S0 = 0.4, FDR < 0.05, fold change >2).
Figure 3—figure supplement 1
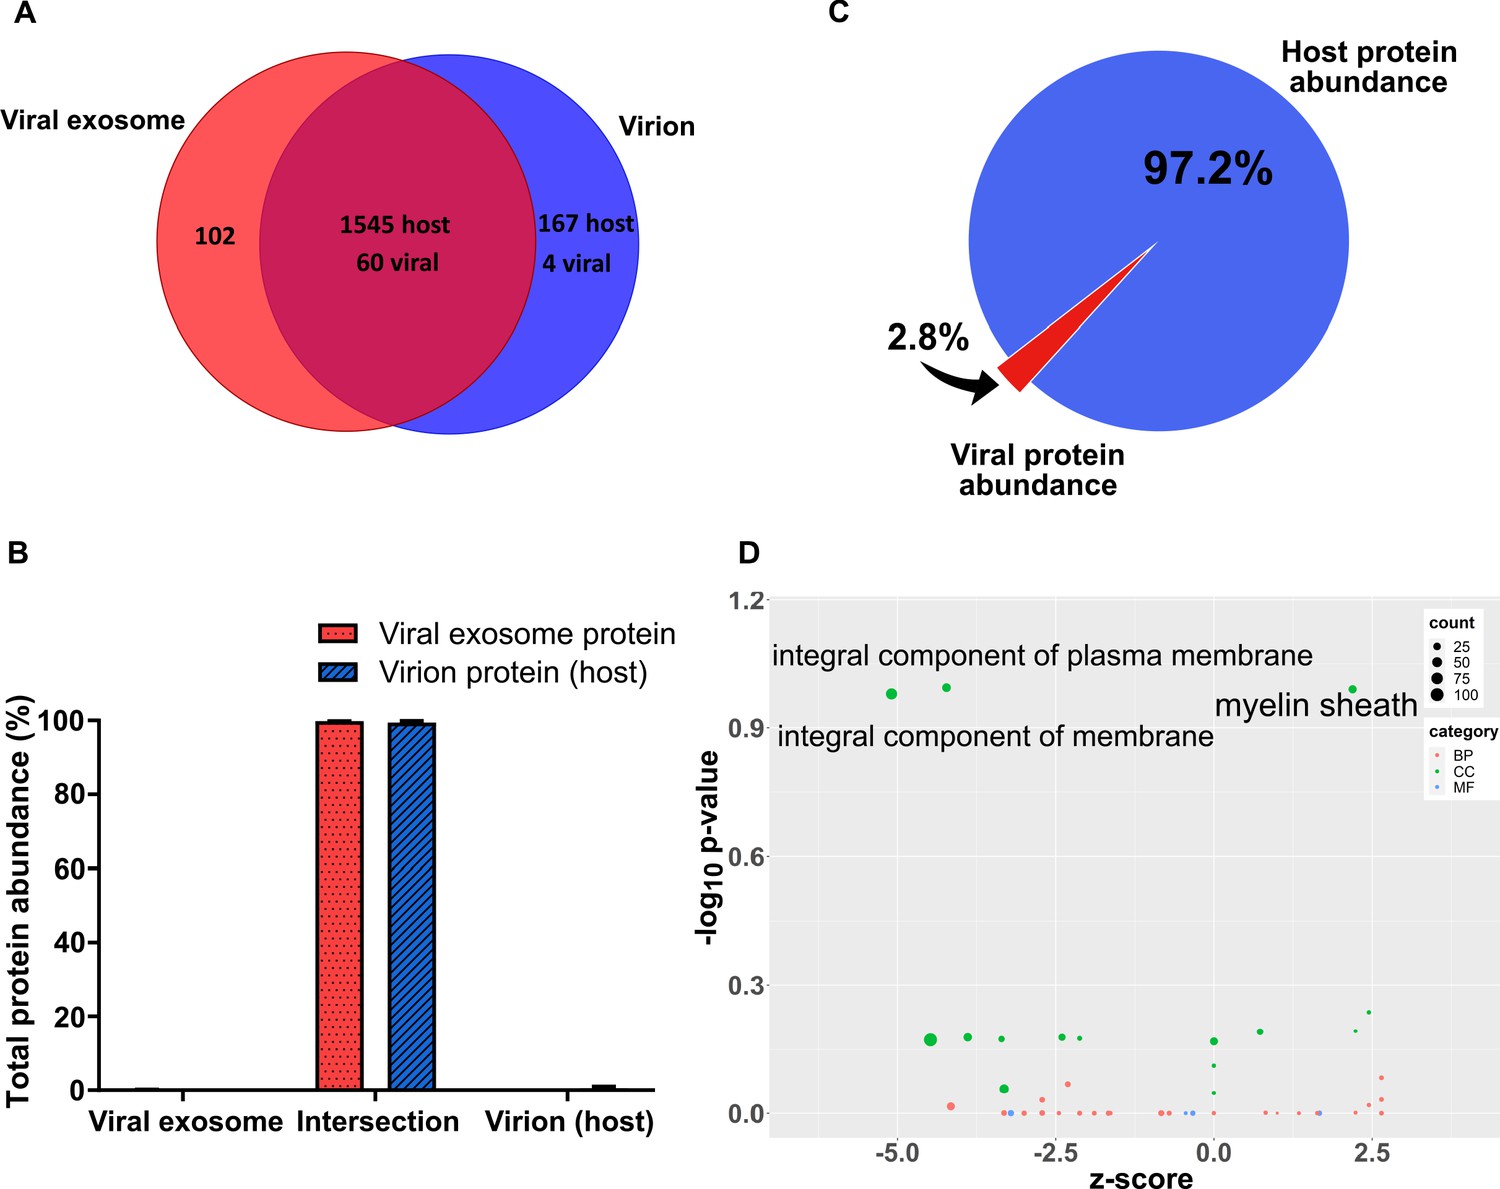
Characterization of viral exosomes isolated on OptiPrep gradients.
(A) Venn diagram depicting the total number, and commonly identified, proteins in viral exosomes and virions. (B) Abundance of individual protein groups (based on Venn diagram in panel A), as a proportion of overall total protein abundance, in viral exosomes or virions (n = 3, bars = SEM). (C) Abundance proportions of host and viral proteins in viral exosomes, as determined by MaxQuant label-free quantitation. Percentages were calculated based on mean abundances from three biological replicates (D) Gene ontology enrichment analysis of differentially enriched proteins between viral exosomes and exosomes (Figure 3F). Up and down regulated proteins were scored for enrichment against the total exosome protein background. Positive z-scores represent enrichment in viral exosomes. BP: biological process, CC: cellular component, MF: molecular function.
Figure 4 with 1 supplement
Host proteins in HCMV virions are predominantly exosome constituents.
(A) Venn diagram depicting the total number, and proteins commonly identified in exosomes and virions. (B) Abundance of individual protein groups (based on Venn diagram in panel A), as a proportion of overall total protein abundance, in exosomes or virion host proteins (n = 3, bars = SEM). (C) Volcano plot showing relative enrichment of host proteins in virions (positive fold change), compared to exosomes (negative fold change). Black circles: significant differential expression (n = 3, S0 = 0.4, FDR < 0.05, fold change >2). Red squares: envelopment/egress candidates, Teal circles: classical exosome markers, Purple stars: ESCRT sub-units. (D) Scatter plot correlating relative fold change comparisons of exosome vs viral exosome (Figure 3F), and exosome vs virion (C). Red squares: envelopment/egress candidates, Blue crosses: V-ATPase sub-units, Teal circles: classical exosome markers, Purple stars: ESCRT sub-units, (n = 3). (E) Relative transcript levels of host proteins following siRNA-mediated knock-down and HCMV infection (5 DPI, MOI = 3), normalized to cells treated with non-targeting control siRNA (n = 3, bars = SEM). (F) Quantification of infectious units released from siRNA-treated cells infected with HCMV AD169 5 DPI, MOI = 3. Infectious units in the supernatant were transferred to a reporter plate of uninfected cells, and IE1 assay conducted 24 HPI (n = 3, bars = SEM, ns: not significant, *p<0.05, **p<0.01, ***p<0.001, ****p<0.0001, one-way ANOVA with Dunnet’s post-test).
Figure 4—figure supplement 1
Characterization of HCMV virions isolated on OptiPrep gradients.
(A) Abundance proportions of host and viral proteins in virions, as determined by MaxQuant label-free quantitation. Percentages were calculated based on mean abundances from three biological replicates. (B) Scatter plot of OptiPrep isolated virion proteins versus HCMV infected cellular lysate (ICL), n = 3, 5 DPI, MOI = 3, Red: HCMV proteins, green: select mitochondrial marker proteins, orange: nuclear markers, black: endoplasmic reticulum markers, blue: endosome markers, purple: exosome markers. Equation of line: y = x, r = 0.643. (C) Gene ontology enrichment analysis of differentially enriched host proteins in the virion compared to exosomes (Figure 4C). Up and down regulated proteins were scored for enrichment against the total exosome protein background. Positive z-scores represent enrichment in HCMV virions. BP: biological process, CC: cellular component, MF: molecular function.
Figure 5 with 1 supplement
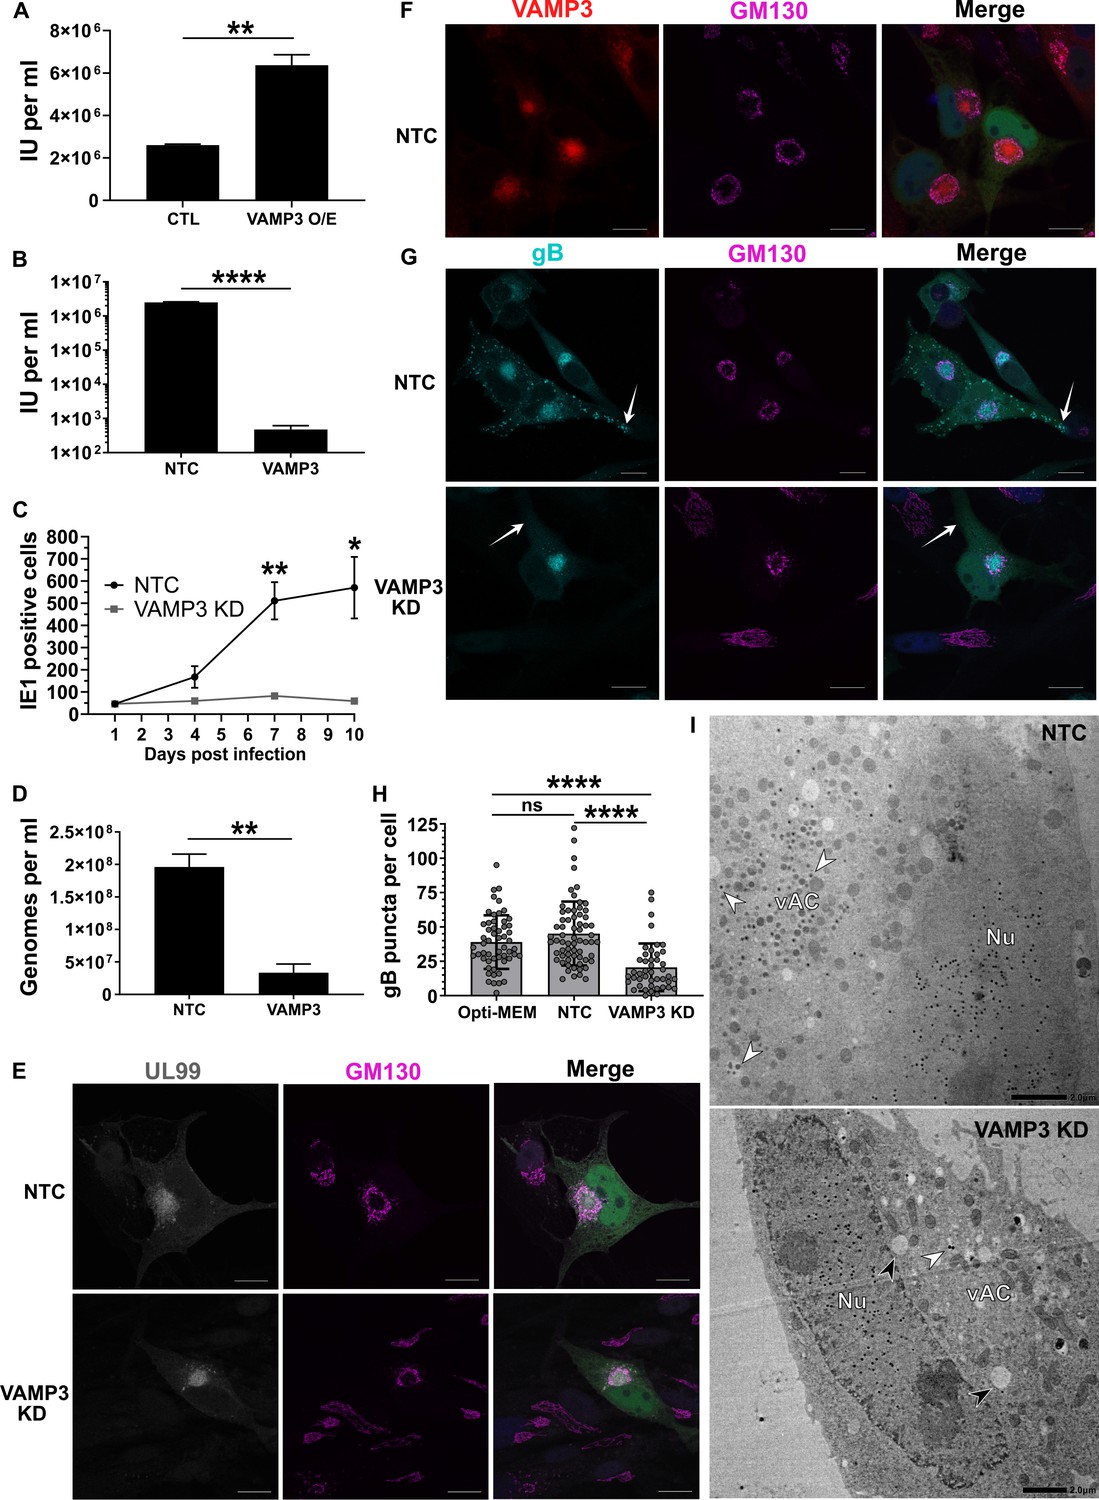
Host VAMP3 is essential for release of infectious HCMV progeny.
(A) Quantification of infectious units released from fibroblasts over-expressing (O/E) VAMP3 or GFP-FLAG (CTL) fusion proteins. Cells were infected with HCMV AD169 MOI = 3, and 5 DPI the supernatant was transferred to a reporter plate of uninfected cells, and IE1 assay conducted 24 HPI. (n = 3, bars = SEM, **p<0.01, Student’s t-test). (B) Quantification of infectious units released from siRNA-treated cells infected with HCMV strain Merlin (RCMV1158) MOI = 3. 7 DPI supernatant was transferred to a reporter plate of uninfected cells, and IE1 assay conducted 24 HPI (n = 3, bars = SEM, ****p<0.0001, Student’s t-test). (C) Quantitation of HCMV spread in ARPE-19 cells treated with siRNA. Cells were infected with Merlin (RCMV1120) at low MOI. At indicated time-points post infection, cells were fixed directly and IE1 positive nuclei quantified (n = 3, bars = SEM, *p<0.05, **p<0.01, Student’s t-test). (D) Quantitation of extracellular viral genomes in supernatant from siRNA treated cells infected with HCMV AD169, 5 DPI, MOI = 3. (n = 3, bars = SEM, **p<0.01, Student’s t-test). (E–G) Immunofluorescence staining of UL99, GM130, VAMP3, and gB in siRNA-treated cells infected with HCMV-GFP AD169, 4 DPI, MOI = 0.1. White arrows: peripheral gB puncta, Scale bars = 20 μm. (H) Quantification of peripheral gB-positive puncta (outside Golgi ring) in siRNA-treated or Opti-MEM control cells, infected with HCMV-GFP AD169, 4 DPI, MOI = 0.1. Between 44 and 65 cells were quantified in each condition (n = 3, bars = SD, ns: not significant, ****p<0.0001, one-way ANOVA with Tukey’s post-test). (I) Electron micrographs of VAMP3 siRNA and non-targeting control (NTC) treated cells infected with HCMV AD169, 5 DPI, MOI = 1. White arrows: maturing virions, Black arrows: enlarged empty vesicles, Scale bars = 2.0 μm.
Figure 5—figure supplement 1
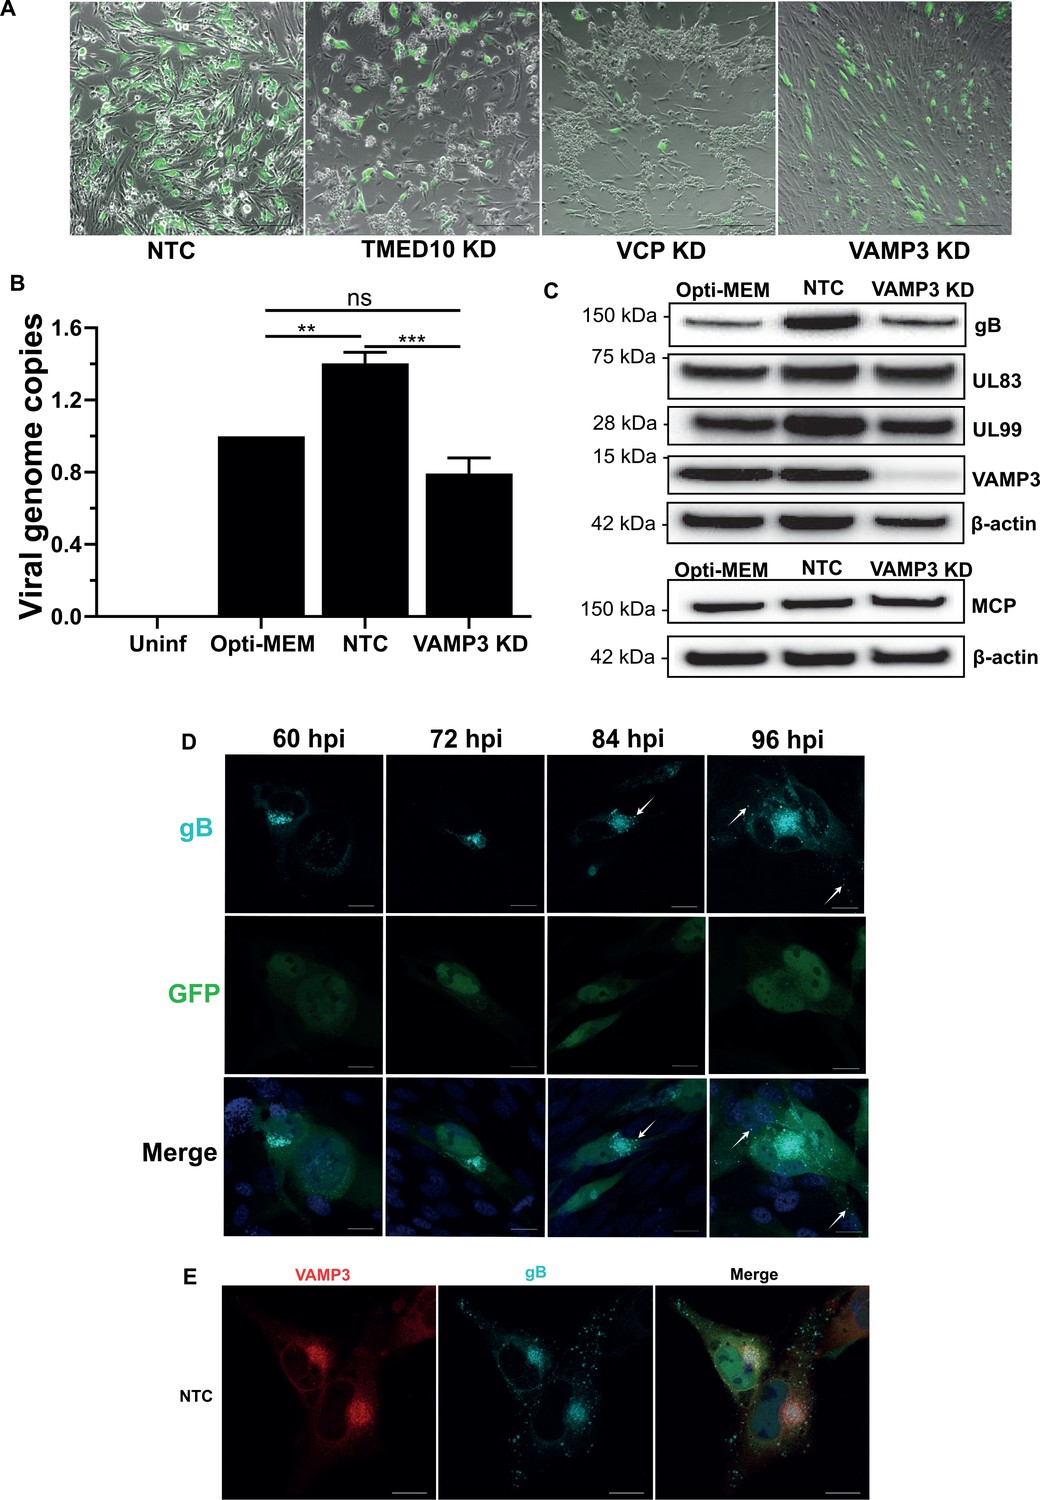
Involvement of VAMP3 during HCMV infection.
(A) Images of MRC5 cells transfected with siRNA for NTC, TMED10 KD, VCP KD and VAMP3 KD, and infected with HCMV-GFP AD169 (MOI = 0.1, 4 DPI). Scale bars = 300 μm. (B) Quantitation of intracellular viral genomes from siRNA treated cells infected with HCMV AD169, 5 DPI, MOI = 3 (n = 3, bars = SEM, ns: not significant, **p<0.01, ***p<0.001, one-way ANOVA with Tukey’s post-test). (C) Western blot of Opti-MEM, NTC and VAMP3 KD whole cell lysates infected with HCMV AD169 (MOI = 3, 5 DPI). Membranes were probed with antibodies against various late viral proteins as well as VAMP3 and β-actin loading control. (D) Time course of late stages of HCMV infection from 60 HPI to 96 HPI. At 12 hr intervals, HCMV-GFP AD169 infected cells were fixed and immuno-stained for viral envelope glycoprotein B. Scale bars = 20 μm. (E) Immuno-fluorescence staining of gB and VAMP3 in NTC siRNA treated cells infected with HCMV-GFP AD169 (MOI = 0.1, 4 DPI). Scale bars = 20 μm.
Figure 6
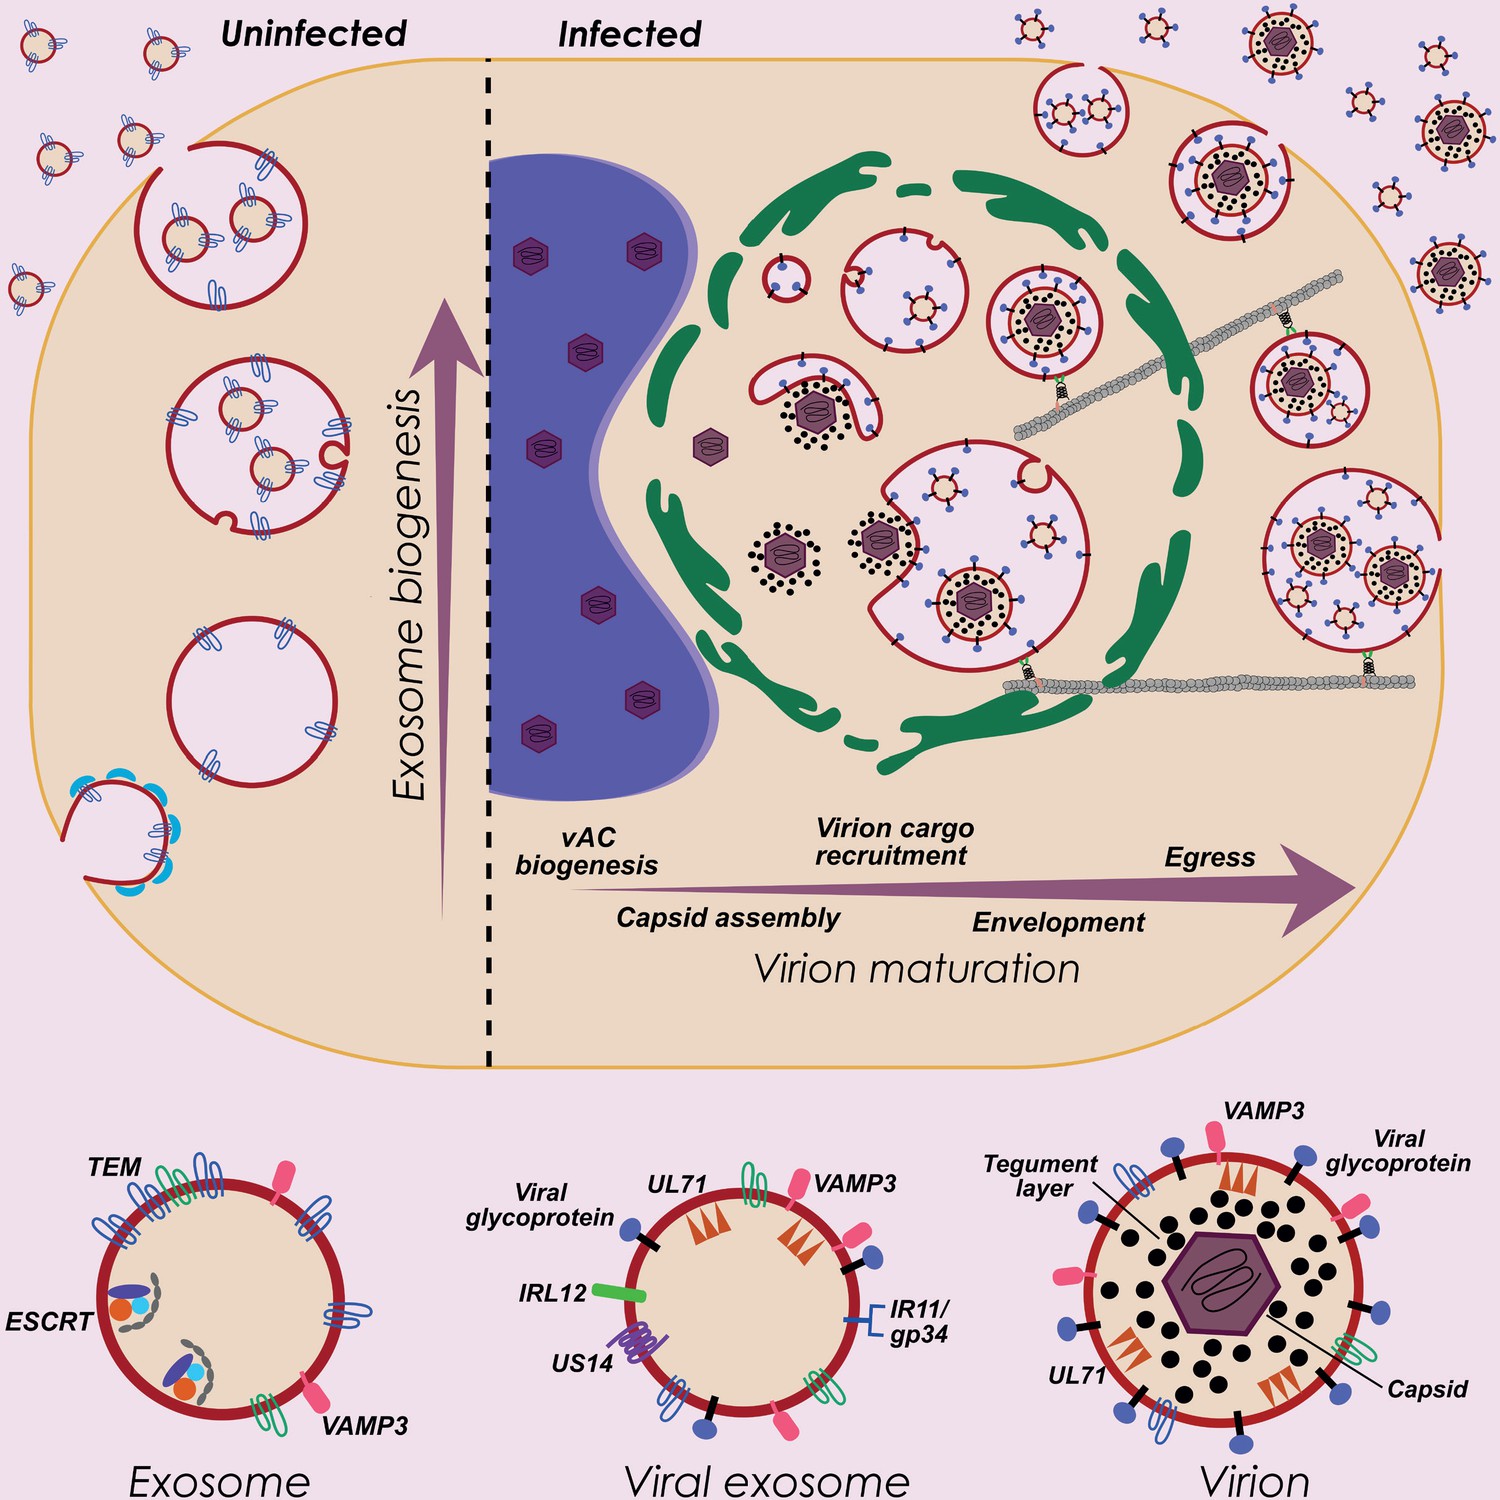
HCMV exploits host exosome biogenesis for virion assembly and egress.
Proposed model describing key stages of virion maturation. HCMV induces vAC generation to prepare the host cell architecture for virion assembly and egress. Endosome-derived membranes/MVBs that normally give rise to exosomes in uninfected cells, are sequestered within the vAC during infection, and provide the membrane for viral exosomes and virions. Virion cargo and genome-containing nucleocapsids enter the vAC and acquire their outer envelope by budding into the host endosome-derived membranes/MVBs. Subsequent cellular trafficking and fusion enables virions to egress and be released from infected cells. Inhibition of key host or viral modulators at associated stages can block virion maturation.
Tables
Key resources table
| Reagent type (species) or resource | Designation | Source or reference | Identifiers | Additional information |
|---|---|---|---|---|
| Cell line (Homo-sapiens) | MRC5 primary fetal lung fibroblasts | Purchased from ATCC | CCL-17 | |
| Cell line (Homo-sapiens) | ARPE-19 retinal pigment epithelial cells | Purchased from ATCC | CRL-2302 | |
| Cell line (Homo-sapiens) | Phoenix-AMPHO kidney epithelial cells | Purchased from ATCC | CRL-3213 | |
| Strain, strain background (Human Cytomegalovirus) | HCMV BAC clone | Thomas Shenk (Princeton University) (Yu et al., 2002) | AD169 | |
| Strain, strain background (Human Cytomegalovirus) | HCMV BAC clone | Richard Stanton (Cardiff University) (Stanton et al., 2010) | RCMV1158 | Unrepaired Merlin virus with GFP cassette |
| Strain, strain background (Human Cytomegalovirus) | HCMV BAC clone | Richard Stanton (Cardiff University) (Stanton et al., 2010) | RCMV1120 | UL128 repaired Merlin virus without tags |
| Recombinant DNA reagent | pLXSN | Clontech | 631509 | Retroviral construct to transduce and express VAMP3 |
| Sequence-based reagent | vamp3_F | This paper | PCR primer | 5’-TGACGAATTCATGTCTACAGGTCCA-3’ |
| Sequence-based reagent | vamp3_R | This paper | PCR primer | 5’-TGAGGATCCTCATGAAGAGACAAC-3’ |
| Sequence-based reagent | ul83_F | Gault et al., 2001 | qPCR primer | 5’-GTCAGCGTTCGTGTTTCCCA-3’ |
| Sequence-based reagent | ul83_R | Gault et al., 2001 | qPCR primer | 5’-GGGACACAACACCGTAAAGC-3’ |
| Sequence-based reagent | atg5_F | This paper | qPCR primer | 5’-TATTACCCTTTGATGCCTTTTTTTC-3’ |
| Sequence-based reagent | atg5_R | This paper | qPCR primer | 5’-AACTTGTACCACCAATTCTAAAATG-3’ |
| Sequence-based reagent | siRNA screen qPCR primers | This paper | All sequences available in Supplementary file 3 | |
| Sequence-based reagent | siGENOME SMARTpool siRNA | Dharmacon | All catalogue numbers available in Supplementary file 3 | All sequences available in Supplementary file 3 |
| Antibody | anti-human CD63 (Mouse monoclonal) | Santa Cruz | sc-5275 | WB (1:1000) |
| Antibody | anti-human CD81 (Mouse monoclonal) | Santa Cruz | sc-166029 | WB (1:1000) |
| Antibody | anti-human VPS4 (Mouse monoclonal) | Sigma | SAB4200215 | WB (1:1000) |
| Antibody | anti-human TSG101 (Mouse monoclonal) | GeneTex | GTX70255 | WB (1:1000) |
| Antibody | anti-human ALIX/PDCD6IP (Mouse monoclonal) | Cell Signalling Technology | #2171 | WB (1:1000) |
| Antibody | anti-HCMV gB (Mouse monoclonal) | Abcam | ab6499 | WB (1:1000) IF (1:500) |
| Antibody | anti-HCMV UL83 (Mouse monoclonal) | Thomas Shenk (Princeton University) Nowak et al., 1984 | Clone 8F5 | WB (1:1000) |
| Antibody | anti-HCMV UL99 (Mouse monoclonal) | Thomas Shenk (Princeton University) Silva et al., 2003 | Clone 10B4 | WB (1:1000) IF (1:500) |
| Antibody | anti-human β-actin (Mouse monoclonal) | Sigma | A2228 | WB (1:1000) |
| Antibody | anti-human VAMP3 (Rabbit monoclonal) | Abcam | ab200657 | WB (1:1000) IF (1:500) |
| Antibody | anti-HCMV IE1 (Mouse monoclonal) | Thomas Shenk (Princeton University) (Zhu et al., 1995) | Clone 1B12 | IF (1:100) |
| Antibody | anti-human GM130 (Mouse monoclonal) | BD Biosciences | 610822 | IF (1:500) |
| Antibody | anti-human GM130 (Rabbit monoclonal) | Abcam | ab52649 | IF (1:500) |
| Antibody | goat anti-mouse Alexa Fluor (568) | Invitrogen | A-11004 | IF (1:1000) |
| Antibody | goat anti-rabbit Alexa Fluor (633) | Invitrogen | A-21070 | IF (1:1000) |
| Antibody | goat anti-mouse HRP conjugate | Bio-Rad | #1706516 | WB (1:5000) |
| Antibody | goat anti-rabbit HRP conjugate | Bio-Rad | #1706515 | WB (1:5000) |
| Commercial assay or kit | Viral DNA spin kit | Qiagen | Cat No./ID: 57704 | |
| Software, algorithm | MaxQuant | MaxQuant (Cox and Mann, 2008) | version 1.6.0.13 | |
| Software, algorithm | Perseus | Perseus (Tyanova et al., 2016) | version 1.6.0.7 | |
| Software, algorithm | GOPlot | GOPlot (Walter et al., 2015) | v.1.0.2, CRAN |
Additional files
-
Supplementary file 1
Glycerol-tartrate gradient purified virion proteomics – unshaved and proteinase k shaved.
- https://cdn.elifesciences.org/articles/58288/elife-58288-supp1-v1.xlsx
-
Supplementary file 2
OptiPrep gradient fraction proteomics – uninfected and HCMV infected.
- https://cdn.elifesciences.org/articles/58288/elife-58288-supp2-v1.xlsx
-
Supplementary file 3
siGENOME SMARTpool siRNA sequences and qPCR primer sequences.
- https://cdn.elifesciences.org/articles/58288/elife-58288-supp3-v1.xlsx
-
Transparent reporting form
- https://cdn.elifesciences.org/articles/58288/elife-58288-transrepform-v1.pdf
Download links
A two-part list of links to download the article, or parts of the article, in various formats.
Downloads (link to download the article as PDF)
Open citations (links to open the citations from this article in various online reference manager services)
Cite this article (links to download the citations from this article in formats compatible with various reference manager tools)
The host exosome pathway underpins biogenesis of the human cytomegalovirus virion
eLife 9:e58288.
https://doi.org/10.7554/eLife.58288


