Myopalladin knockout mice develop cardiac dilation and show a maladaptive response to mechanical pressure overload
- Institute of Genetic and Biomedical Research (IRGB) - National Research Council (CNR), Milan unit, Italy
- IRCCS Humanitas Research Hospital, Italy
- Department of Cardiac Surgery, University of Verona, Italy
- Randall Centre for Cell and Molecular Biophysics, King's College London BHF Centre of Research Excellence, United Kingdom
- Department of Experimental and Clinical Medicine, University of Florence, Italy
- Telethon Institute of Genetics and Medicine (TIGEM), Italy
- Department of Medicine, University of California, San Diego, United States
- Humanitas University, Italy
- Institute of Physiology II, University of Muenster, Germany
Figures
Figure 1
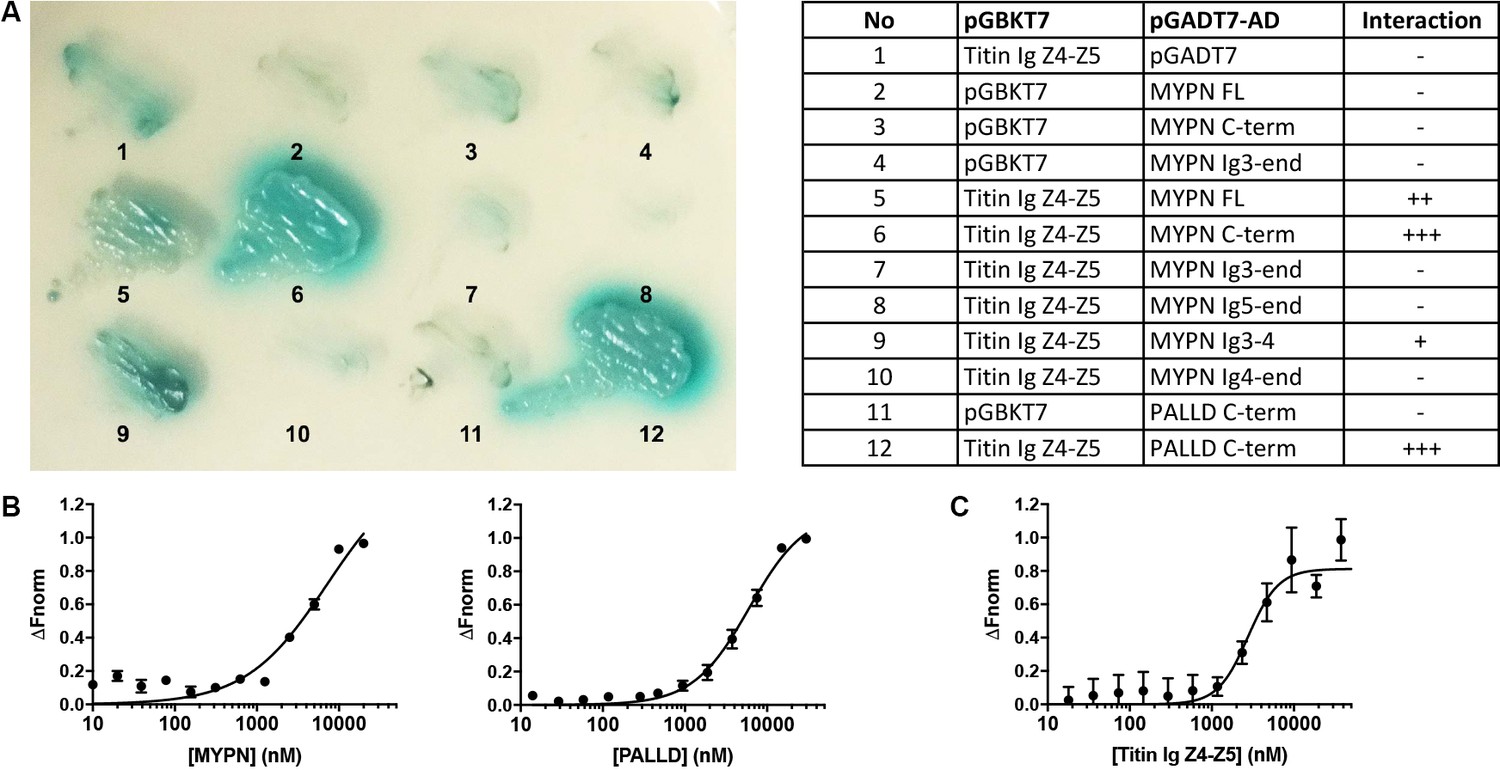
Myopalladin (MYPN) directly binds to titin in the Z-line.
(A) Yeast two-hybrid (Y2H) assay showing binding of the C-terminal region of MYPN and its homologue palladin (PALLD) to the titin Ig domains Z4-Z5 (titin Ig Z4-Z5) in the Z-line. A culture plate with different combinations of Y2H co-transformations is shown as indicated in the table. (B) Microscale thermophoresis (MST) analysis of 450 nM labeled titin Ig Z4-Z5 incubated with increasing concentrations of MYPN and PALLD C-terminal domains. Due to precipitation, signal saturation was not reached. The dose/response curve is representative of two independent experiments (n = 17 and n = 16 runs). Fnorm, normalized fluorescence. (C) MST analysis of 400 nM labeled MYPN C-terminal domain incubated with increasing concentrations of titin Ig Z4-Z5. The dose/response curve is representative of four independent experiments (n = 7 runs).
-
Figure 1—source data 1
Microscale thermophoresis binding (MST) analysis of myopalladin (MYPN)/titin interaction.
- https://cdn.elifesciences.org/articles/58313/elife-58313-fig1-data1-v2.xlsx
Figure 2 with 1 supplement

Histological and electron microscopy analyses of hearts from wild-type (WT) and myopalladin knockout (MKO) mice.
(A) Hematoxylin and eosin (H&E) (top) and Picro Sirius Red (bottom) stainings showing no morphological abnormalities or fibrosis in the heart of 6-month-old MKO male mice compared to WT mice (n = 3 per group). (B) Histograms and Gaussian distribution curves showing similar adult cardiomyocyte (CMC) length in 4-month-old WT and MKO male mice (n = 1292 CMCs from three WT mice and 1740 CMCs from three MKO mice). (C) Average CMC length in WT and MKO male mice. Data are represented as mean ± standard error of the mean (SEM). (D) Histograms and Gaussian distribution curves showing reduced adult CMC width in 4-month-old MKO male mice compared to WT mice (n = 1373 CMCs fromthree WT mice and 1193 CMCs from three MKO mice). (E) Average CMC width in WT and MKO male mice. Data are represented as mean ± SEM. ***p < 0.001; unpaired Student’s t-test. (F) Body weight to tibia length ratio (BW/TL) of 10-week-old WT and MKO male mice. Data are represented as mean ± SEM (n = 12–13 per group). ***p < 0.001; unpaired Student’s t-test. (G–H) Electron micrographs of papillary muscle from 8-month-old WT and MKO male mice, showing sarcomere (G) and intercalated disc (ICD) (H) structure. (I) Average ICD fold amplitude in WT and MKO mice. Data are represented as mean ± SEM (n = 11 ICDs from WT mice and 14 ICDs from MKO mice). *p < 0.05; unpaired Student’s t-test.
-
Figure 2—source data 1
Cardiomyocyte (CMC) size measurements in wild-type (WT) and myopalladin knockout (MKO) male mice.
- https://cdn.elifesciences.org/articles/58313/elife-58313-fig2-data1-v2.xlsx
-
Figure 2—source data 2
Body weight to tibia length ratio (BW/TL) measurements in wild-type (WT) and myopalladin knockout (MKO) male mice.
- https://cdn.elifesciences.org/articles/58313/elife-58313-fig2-data2-v2.xlsx
-
Figure 2—source data 3
Intercalated disc (ICD) fold amplitude measurements in wild-type (WT) and myopalladin knockout (MKO) male mice.
- https://cdn.elifesciences.org/articles/58313/elife-58313-fig2-data3-v2.xlsx
Figure 2—figure supplement 1

Cardiomyocyte (CMC) size in 4-month-old wild-type (WT) and myopalladin knockout (MKO) male mice.
(A) Histograms and Gaussian distribution curves showing reduced adult CMC size in MKO mice compared to WT mice (n = 1274 CMCs from 3 WT mice and 1587 CMCs from 4 MKO mice). (B) Average CMC size in WT and MKO mice. Data are represented as mean ± SEM. ***p < 0.001; Student’s t-test.
Figure 3 with 1 supplement
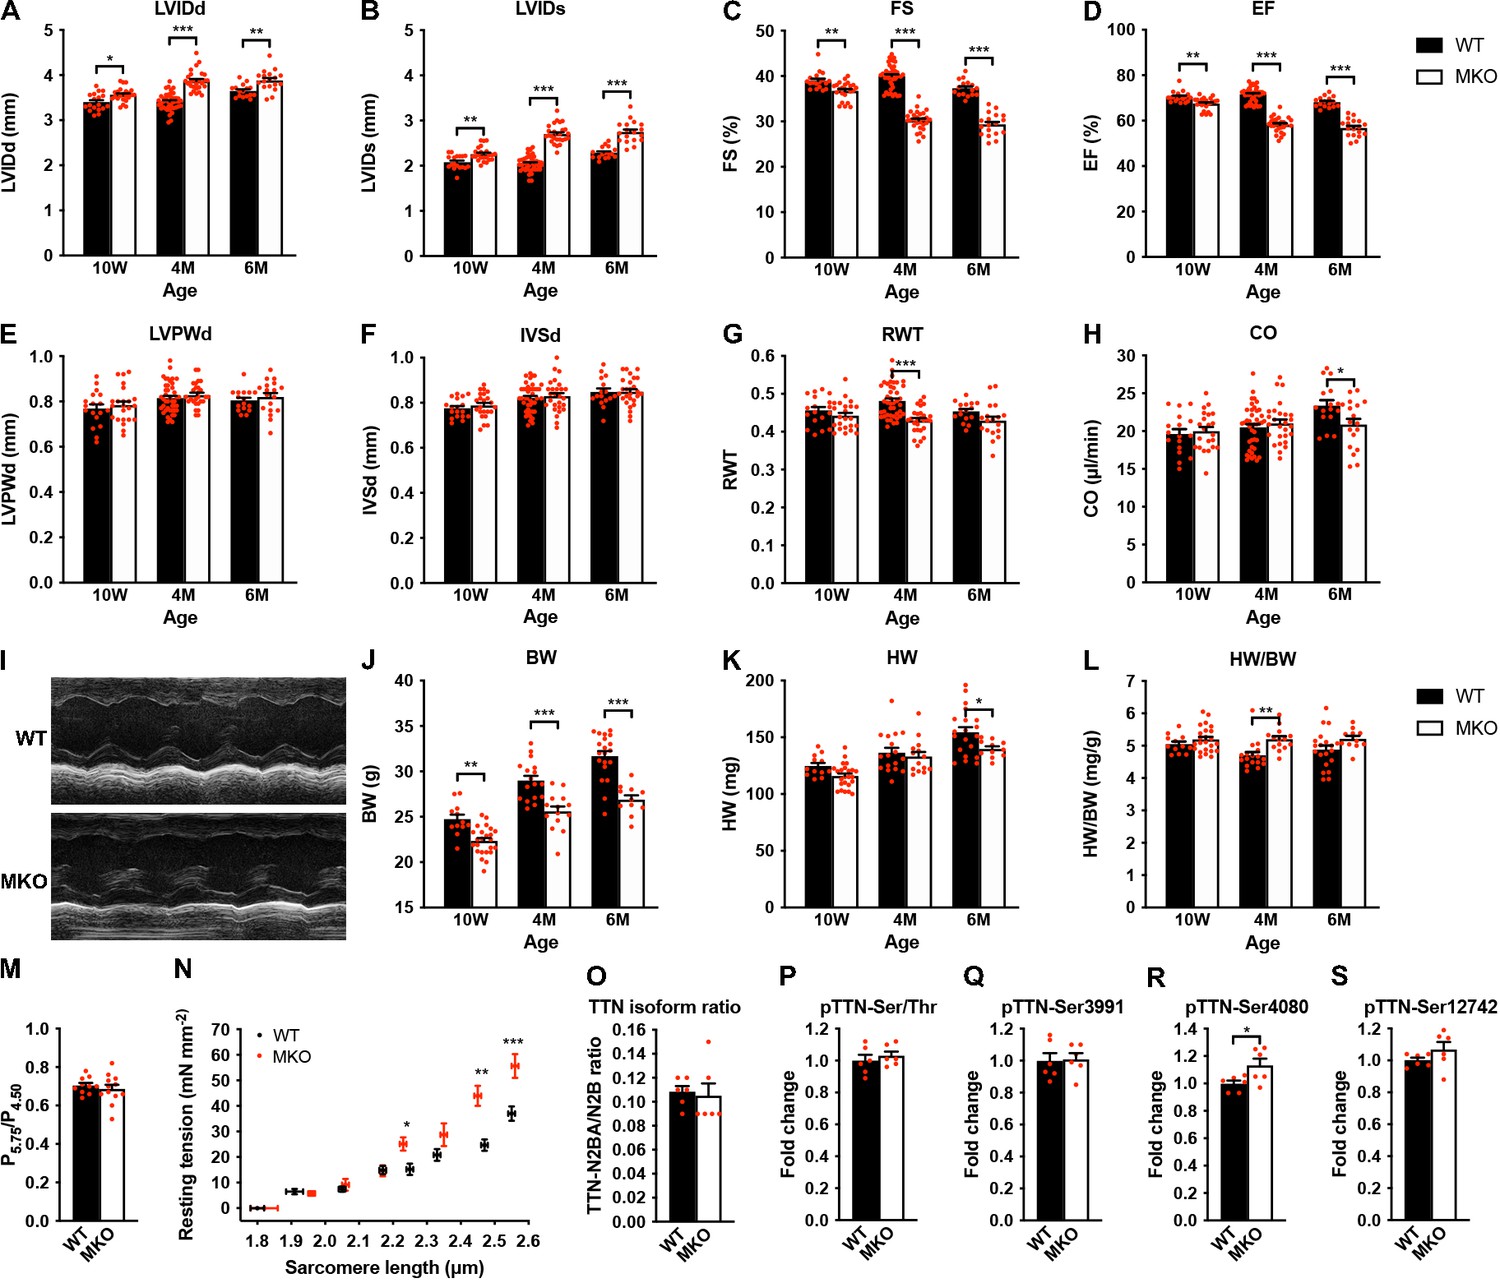
Echocardiographic analyses and sarcomere-length-tension relationship in cardiac myofibrils from wild-type (WT) and myopalladin knockout (MKO) mice.
(A–H) Echocardiographic analysis of WT and MKO male mice at 10 weeks (10 W), 4 months (4 M), and 6 months (6 M) of age. LVID, left ventricular inner diameter; FS, fractional shortening; EF, ejection fraction; LVPW, left ventricular posterior wall thickness; IVS, interventricular septum thickness; RWT, relative wall thickness ((LVPWd + IVSd)/LVIDd); CO, cardiac output; d, diastole; s, systole. Data are represented as mean ± standard error of the mean (SEM) (n = 16–42 per group). *p < 0.05; **p < 0.01; ***p < 0.001; two-way analysis of variance (ANOVA) with Bonferroni’s multiple comparison test. (I) Representative echocardiographic short-axis M-mode images from hearts of 6-month-old WT and MKO male mice. (J–L) Body weight (BW) (J), heart weight (HW) (K), and heart weight to body weight ratio (HW/BW) (L) of WT and MKO male mice at 10 W, 10 M, and 6 M of age. Data are represented as mean ± SEM (n = 12–24 per group). *p < 0.05; **p < 0.01; ***p < 0.001; two-way ANOVA with Bonferroni’s multiple comparison test. (M) Ratio of tension measured at pCa 5.75 (P5.75, submaximal activation) vs. pCa 4.50 (P4.50, maximal activation) in WT and MKO myofibrils using Ca2+ jump protocols. Data are represented as mean ± SEM (n = 10 myofibrils from two WT mice and 12 myofibrils from two MKO mice). (N) Average sarcomere-length-tension relationship in cardiac myofibrils from the left ventricle of 4-month-old WT and MKO male mice. Each data point is represented as mean ± SEM from 10 myofibrils from three WT mice and 16 myofibrils from three MKO mice. *p < 0.05; **p < 0.01; ***p < 0.001; unpaired Student’s t-test. (O–S) Densitometric analysis for (O) titin (TTN) N2BA/N2B isoform ratio as determined by sodium dodecyl sulfate (SDS)-PAGE and Coomassie blue staining, (P) titin serine/threonine phosphorylation as determined by Western blot analysis using anti-phosphoserine/threonine antibody, and (Q–R) site-specific titin phosphorylation on Ser3991 (corresponding to human pTTN-Ser4010, phosphorylated by PKA and ERK2) (Q), Ser4080 (corresponding to human pTTN-Ser4099, phosphorylated by PKG) (R), and Ser12742 (corresponding to human pTTN-Ser11878, phosphorylated by PKCα) (S) using titin phosphosite-specific antibodies. Normalization was performed to total protein content as determined by Coomassie blue staining of each blot. Data are represented as mean ± SEM (n = 6 per group). *p < 0.05; unpaired Student’s t-test.
-
Figure 3—source data 1
Echocardiographic parameters of wild-type (WT) and myopalladin knockout (MKO) male mice at different ages.
- https://cdn.elifesciences.org/articles/58313/elife-58313-fig3-data1-v2.docx
-
Figure 3—source data 2
Echocardiographic analyses and heart weight to body weight ratio (HW/BW) measurements on wild-type (WT) and myopalladin knockout (MKO) male mice under basal conditions.
- https://cdn.elifesciences.org/articles/58313/elife-58313-fig3-data2-v2.xlsx
-
Figure 3—source data 3
Heart weight to body weight (HW/BW) measurements on wild-type (WT) and myopalladin knockout (MKO) male mice under basal conditions.
- https://cdn.elifesciences.org/articles/58313/elife-58313-fig3-data3-v2.xlsx
-
Figure 3—source data 4
Sarcomere-length-tension relationship and calcium jump experiments in cardiac myofibrils from wild-type (WT) and myopalladin knockout (MKO) male mice.
- https://cdn.elifesciences.org/articles/58313/elife-58313-fig3-data4-v2.xlsx
-
Figure 3—source data 5
Densitometry of titin blots.
- https://cdn.elifesciences.org/articles/58313/elife-58313-fig3-data5-v2.xlsx
Figure 3—figure supplement 1

Titin isoform expression and phosphorylation in the left ventricle of 4-month-old wild-type (WT) and myopalladin knockout (MKO) male mice.
Titin (TTN) isoform expression was determined by SDS-PAGE and Coomassie blue staining. The TTN N2B isoform is the principal isoform in mouse heart. Titin phosphorylation was determined by Western blot analysis using anti-phosphoserine/threonine antibody (pTTN-Ser/Thr) and titin phosphosite-specific antibodies against Ser3991, Ser4080, and Ser12742. Total protein was determined by Coomassie blue staining of each blot.
Figure 4
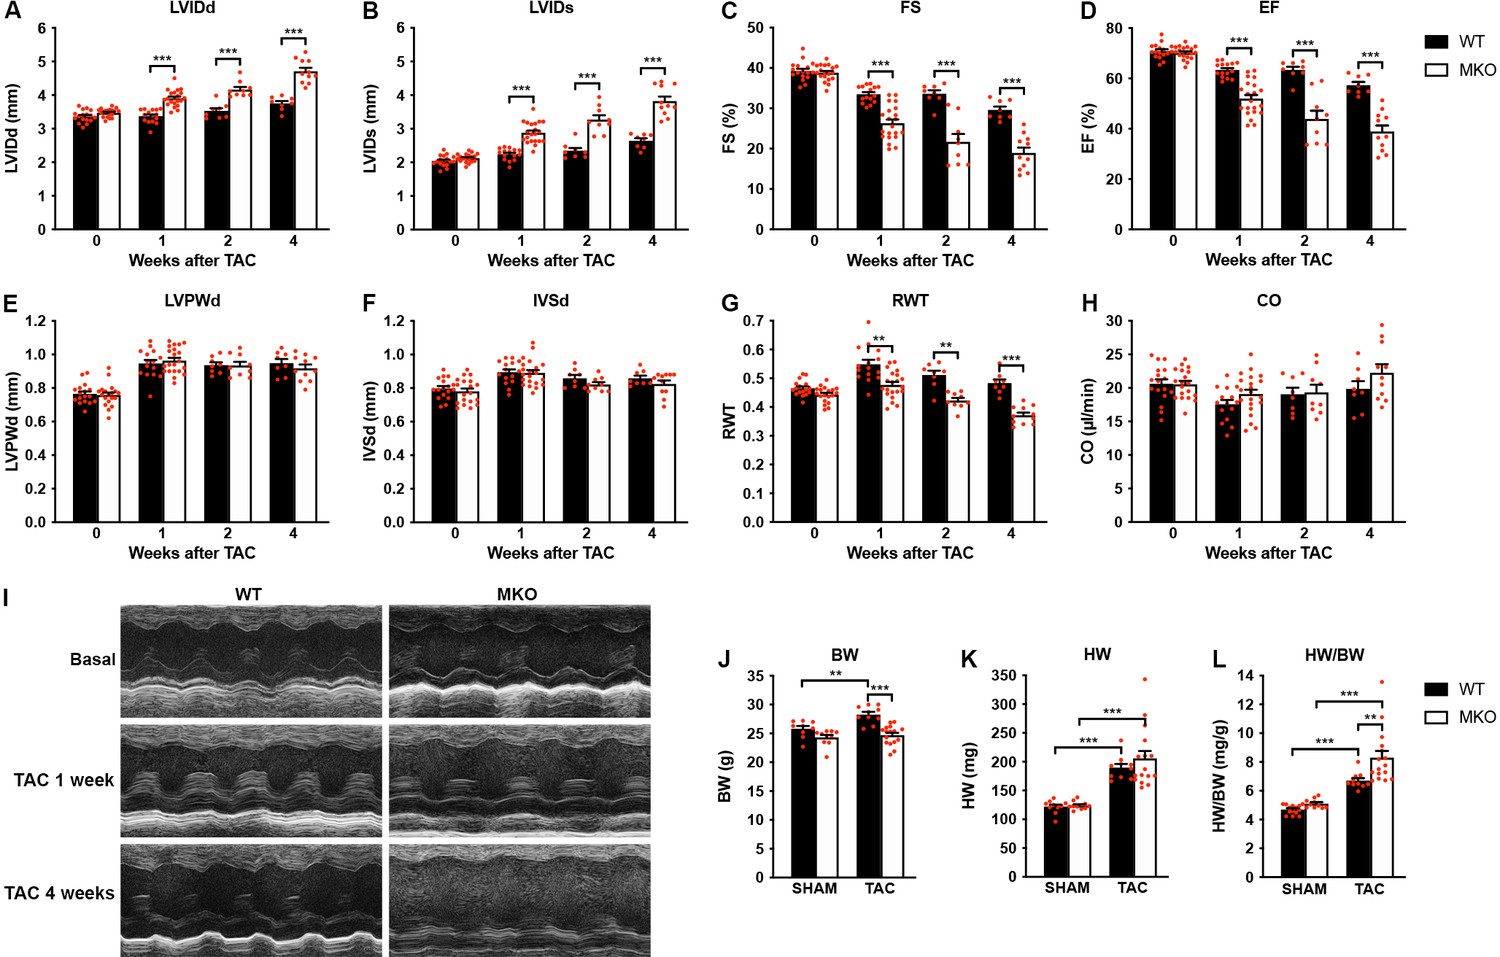
Echocardiographic analyses of wild-type (WT) and myopalladin knockout (MKO) mice following transaortic constriction (TAC).
(A–H) Echocardiography analyses of WT and MKO male mice under basal conditions and 1, 2, and 4 weeks after TAC. Pressure gradient >70 mmHg. LVID, left ventricular inner diameter; FS, fractional shortening; EF, ejection fraction; LVPW, left ventricular posterior wall thickness; IVS, interventricular septum thickness; RWT, relative wall thickness ((LVPWd + IVSd)/LVIDd); CO, cardiac output; d, diastole; s, systole. Data are represented as mean ± standard error of the mean (SEM) (n = 8–19 per group). **p < 0.01; ***p < 0.001; linear mixed model (LMM) with Bonferroni’s multiple comparison test. (I) Representative echocardiographic short-axis M-mode images from hearts of WT and MKO male mice under basal conditions and 1 and 4 weeks after TAC. (J–L) Body weight (BW) (J), heart weight (HW) (K), and heart weight to body weight ratio (HW/BW) (L) of WT and MKO male mice 4 weeks after TAC or SHAM surgery. Data are represented as mean ± SEM (n = 9–11 per group). **p < 0.01; ***p < 0.001; two-way analysis of variance (ANOVA) with Bonferroni’s multiple comparison test.
-
Figure 4—source data 1
Echocardiographic parameters of 8-week-old wild-type (WT) and myopalladin knockout (MKO) male mice before and after transaortic constriction (TAC).
- https://cdn.elifesciences.org/articles/58313/elife-58313-fig4-data1-v2.docx
-
Figure 4—source data 2
Echocardiographic analysis on wild-type (WT) and myopalladin knockout (MKO) male mice subjected to transaortic constriction (TAC) or SHAM.
- https://cdn.elifesciences.org/articles/58313/elife-58313-fig4-data2-v2.xlsx
-
Figure 4—source data 3
Measurements of heart weight to body weight ratio (HW/BW) in wild-type (WT) and myopalladin knockout (MKO) male mice subjected to transaortic constriction (TAC) or SHAM.
- https://cdn.elifesciences.org/articles/58313/elife-58313-fig4-data3-v2.xlsx
Figure 5
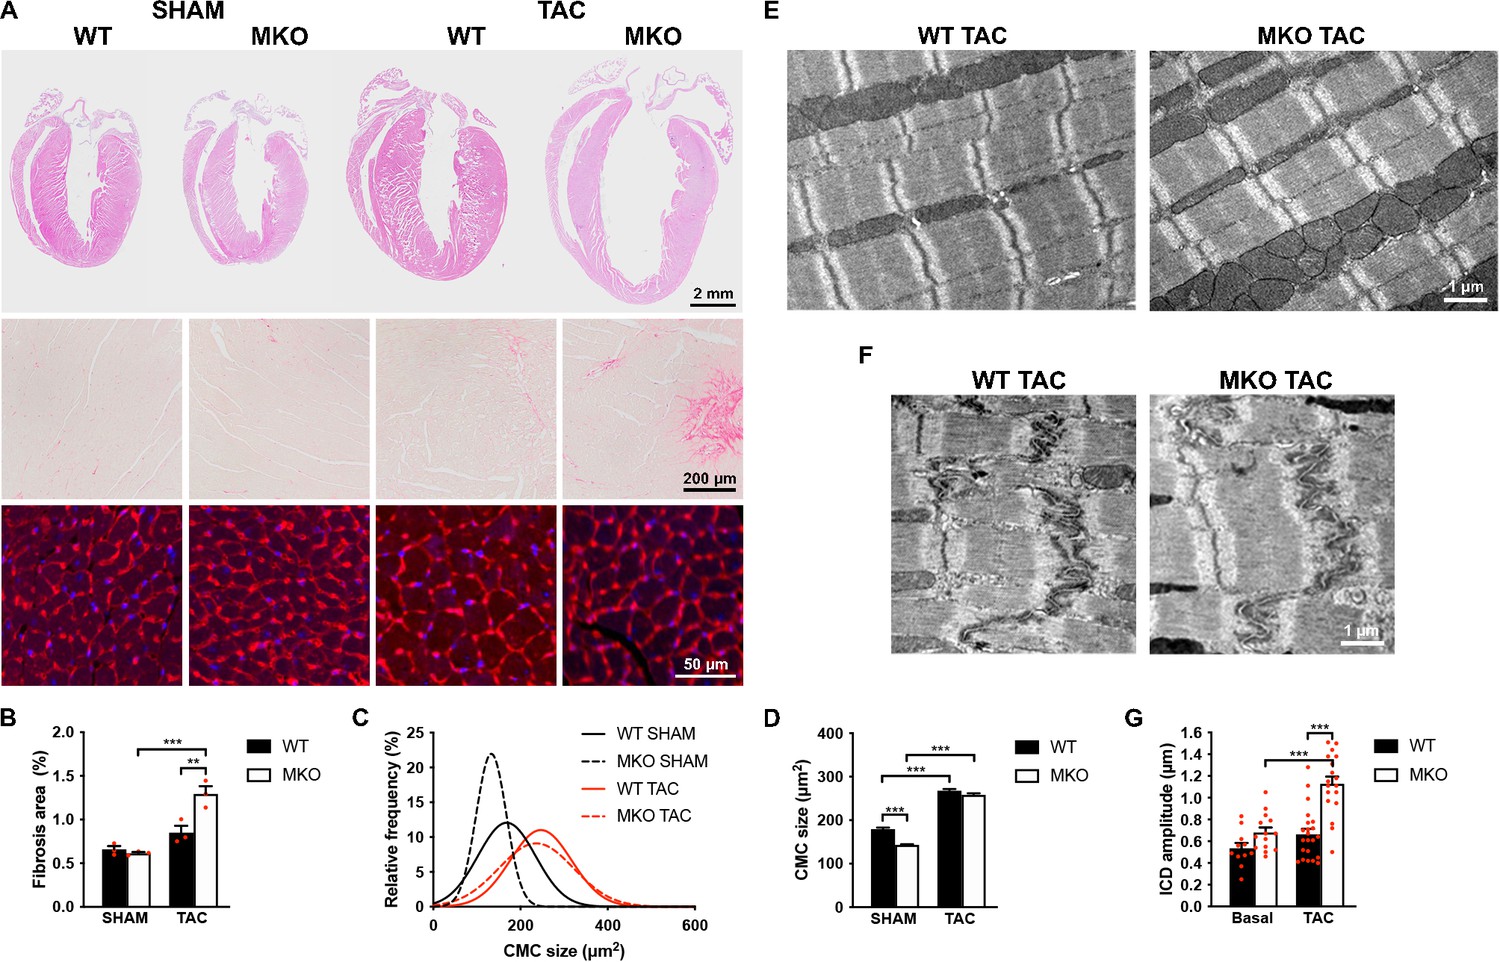
Histological and transmission electron microscopy analyses of hearts from wild-type (WT) and myopalladin knockout (MKO) male mice 4 weeks after transaortic constriction (TAC) or SHAM.
(A) Top, Hematoxylin and eosin (H&E) stainings of hearts from WT and MKO mice subjected to TAC or SHAM. Middle, Representative Picro Sirius Red stainings of the left ventricle, showing fibrosis in MKO mice after TAC. Bottom, Representative wheat germ agglutinin (WGA) stainings of the left ventricle (red). Nuclei are visualized by DAPI (blue). (B) Percent area of interstitial fibrosis in the left ventricle. Data are represented as mean ± standard error of the mean (SEM) (n = 3 per group). **p < 0.01; ***p < 0.001; two-way analysis of variance (ANOVA) with Bonferroni’s multiple comparison test. (C) Gaussian distribution curves from histograms of cardiomyocyte (CMC) size in the left ventricle of WT and MKO mice subjected to TAC or SHAM (n = 333 CMCs from three WT mice and 809 CMCs from three MKO mice subjected to SHAM; 423 CMCs from three WT mice and 665 CMCs from three MKO mice subjected to TAC). (D) Average CMC size in WT and MKO mice subjected to TAC or SHAM. Data are represented as mean ± SEM. **p < 0.01; ***p < 0.001; two-way ANOVA with Bonferroni’s multiple comparison test. (E–F) Electron micrographs of papillary muscle from WT and MKO mice 4 weeks after TAC, showing sarcomere (E) and intercalated disc (ICD) (F) structure. (G) Average ICD fold amplitude in WT and MKO mice. Data are represented as mean ± SEM (n = 11 ICDs from WT mice and n = 14 ICDs from MKO mice, n = 22 ICDs from WT mice, and n = 18 ICDs from MKO mice subjected to TAC). ***p < 0.001; two-way ANOVA with Bonferroni’s multiple comparison test.
-
Figure 5—source data 1
Measurements of fibrotic area in the left ventricle of wild-type (WT) and myopalladin knockout (MKO) male mice 4 weeks after transaortic constriction (TAC) or SHAM.
- https://cdn.elifesciences.org/articles/58313/elife-58313-fig5-data1-v2.xlsx
-
Figure 5—source data 2
Cardiomyocyte (CMC) size measurements in wild-type (WT) and myopalladin knockout (MKO) male mice 4 weeks after transaortic constriction (TAC) or SHAM.
- https://cdn.elifesciences.org/articles/58313/elife-58313-fig5-data2-v2.xlsx
-
Figure 5—source data 3
Intercalated disc (ICD) fold amplitude measurements in wild-type (WT) and myopalladin knockout (MKO) male mice 4 weeks after transaortic constriction (TAC).
- https://cdn.elifesciences.org/articles/58313/elife-58313-fig5-data3-v2.xlsx
Figure 6 with 1 supplement
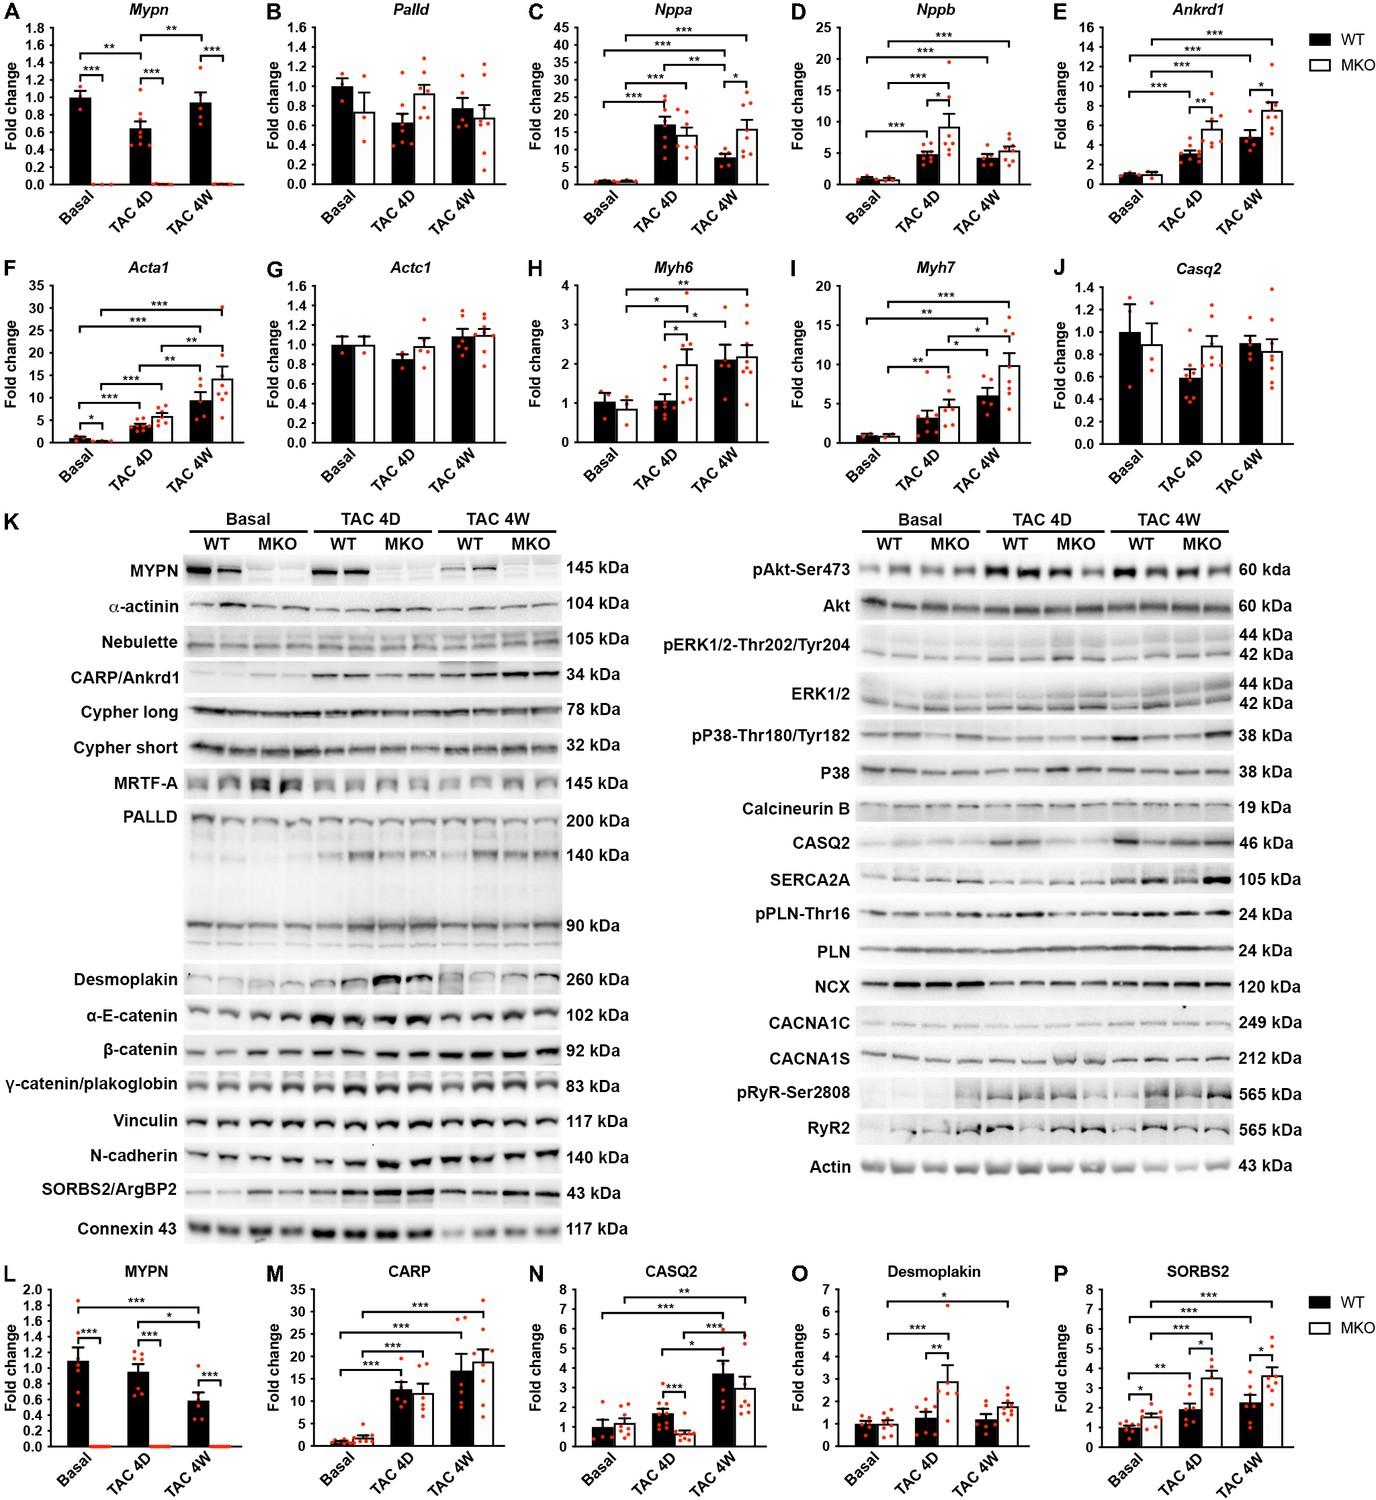
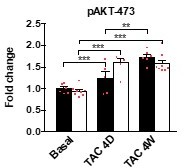
Quantitative real-time PCR (qRT-PCR) and Western blot analyses on wild-type (WT) and myopalladin knockout (MKO) mice at basal conditions and following transaortic constriction (TAC).
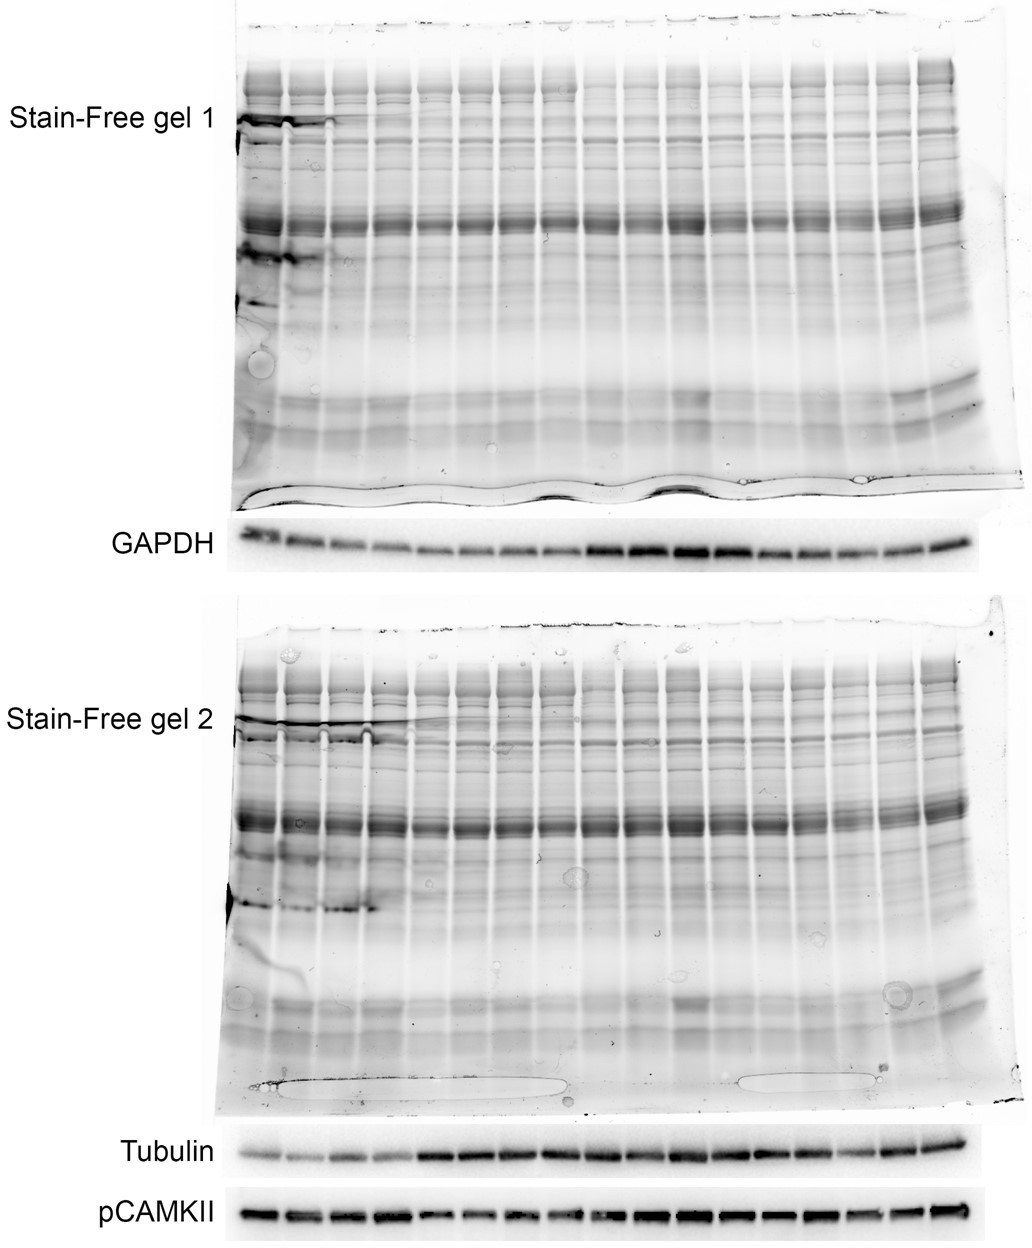
(A) qRT-PCR analysis for Mypn, Palld, and markers of cardiac remodeling on left ventricular RNA from WT and MKO male mice at basal conditions and 4 days (D) and 4 weeks (W) after TAC. B2m was used for normalization. Data are represented as mean ± standard error of the mean (SEM) (n = 3–8 per group performed in triplicate). *p < 0.05, **p < 0.01, **p < 0.001; two-way analysis of variance (ANOVA) with Bonferroni’s multiple comparison test. (B) Western blot analysis on left ventricular lysate from WT and MKO male mice at basal conditions and 4 days (D) and 4 weeks (W) after TAC. Representative blots are shown (n = 3–4 per group). (C) Densitometric analysis for proteins that were significantly altered in MKO mice. Normalization was performed to total protein content as assessed on TGX Stain-Free gels (Bio-Rad Laboratories). Data are represented as mean ± SEM (n = 3–4 per group). *p < 0.05, **p < 0.01, ***p < 0.001; two-way ANOVA with Bonferroni’s multiple comparison test.
-
Figure 6—source data 1
Quantitative real-time PCR (qRT-PCR) and densitometry analysis on wild-type (WT) and myopalladin knockout (MKO) male mice subjected to transaortic constriction (TAC) or SHAM.
- https://cdn.elifesciences.org/articles/58313/elife-58313-fig6-data1-v2.xlsx
Figure 6—figure supplement 1
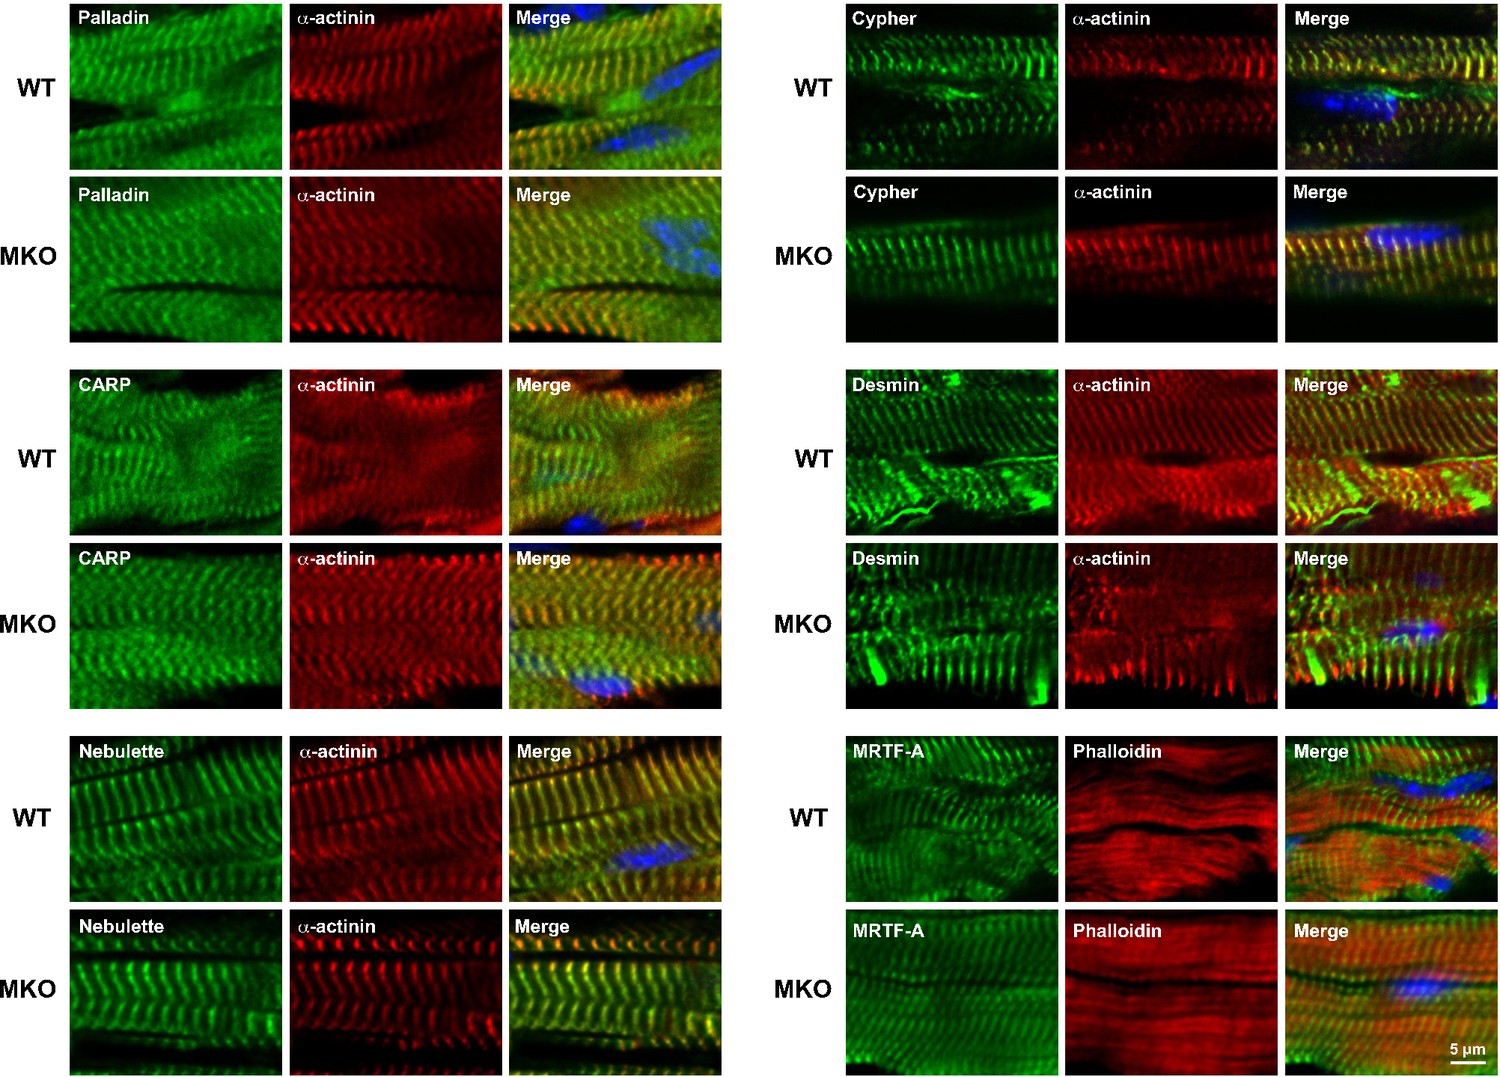
Immunofluorescence stainings of left ventricular tissue from the heart of 4-month-old wild-type (WT) and myopalladin knockout (MKO) male mice for palladin (PALLD) and myopalladin (MYPN)-interacting proteins.
Nuclei are visualized by DAPI (blue).
Figure 7
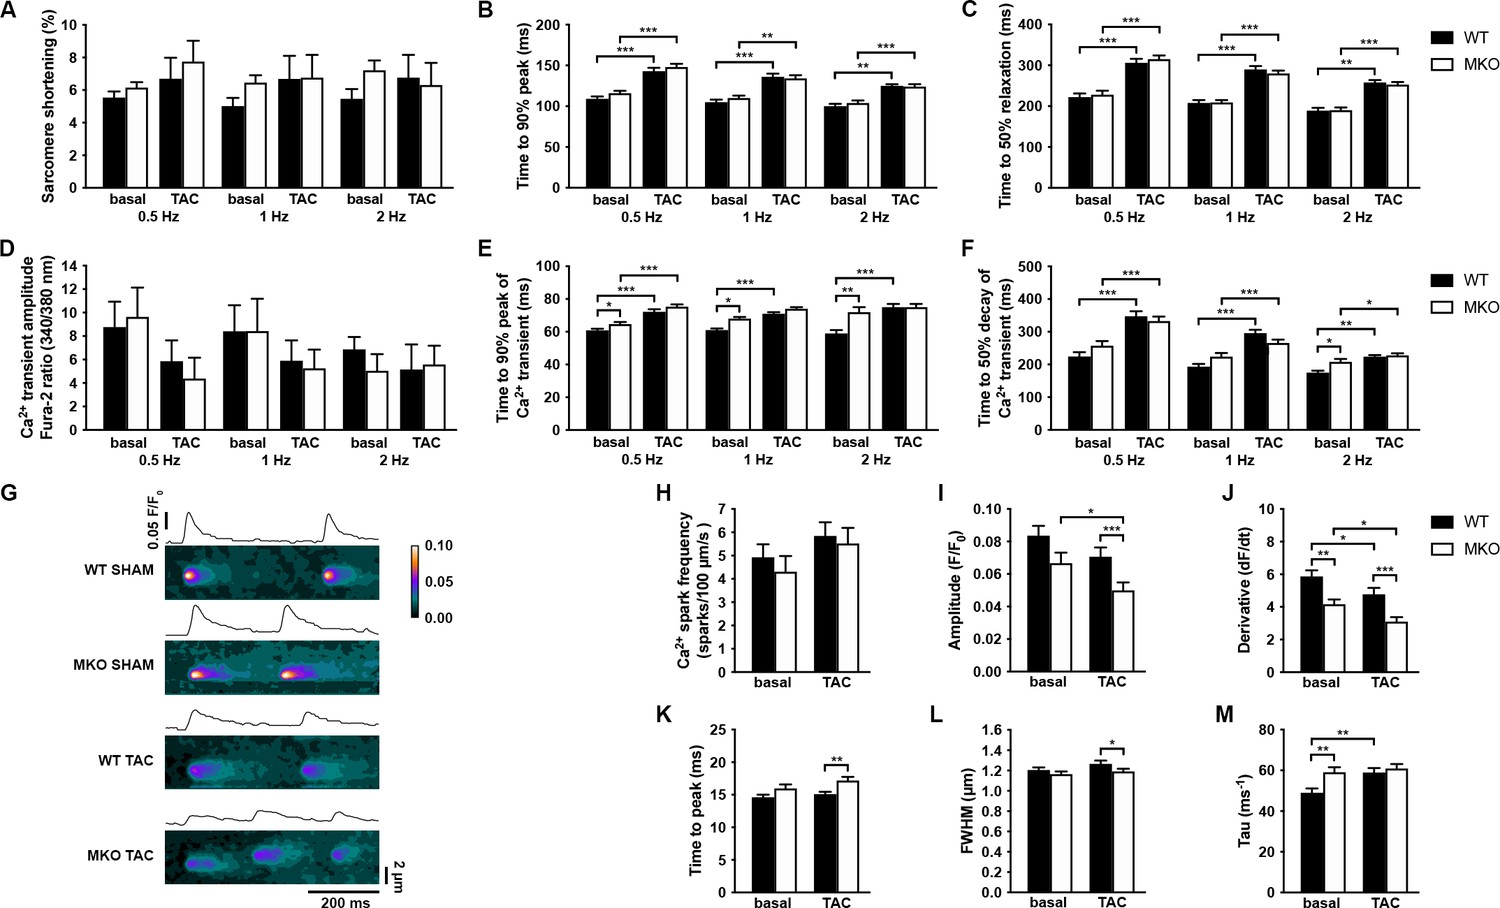
Functional analyses on adult cardiomyocytes (CMCs) from wild-type (WT) and myopalladin knockout (MKO) male mice 7 days after transaortic constriction (TAC) or SHAM surgery.
(A–C) Sarcomere shortening, time to 90% peak, and time to 50% relaxation (n = 62 cells from nine WT mice and 71 cells from seven MKO mice). (D–F) Amplitude of Ca2+ transient, time to 90% peak of Ca2+ transient, and time to 50% decay of Ca2+ transient (n = 29 cells from eight WT mice and 16 cells from six MKO mice). (G) Representative Ca2+ spark images from WT and MKO male mice subjected to TAC or SHAM for 7 days. (H–M) Ca2+ spark frequency, amplitude, velocity of Ca2+ release (derivative; dF/dt), time to peak, full width at half maximum (FWHM), and tau (n = 355 sparks from 33 cells from three WT SHAM mice, 403 sparks from 27 cells from three MKO SHAM mice, 462 sparks from 31 cells from three WT TAC mice, and 429 sparks from 33 cells from three MKO TAC mice). Data are represented as mean ± standard error of the mean (SEM) as determined by hierarchical analysis (Sikkel et al., 2017). *p < 0.05, **p < 0.01, ***p < 0.001; two- or three-level hierarchical testing with Bonferroni correction, as appropriate.
-
Figure 7—source data 1
Analysis of sarcomere shortening, Ca2+ transients, and Ca2+ sparks in cardiomyocytes (CMCs) from wild-type (WT) and myopalladin knockout (MKO) male mice subjected to transaortic constriction (TAC) or SHAM.
- https://cdn.elifesciences.org/articles/58313/elife-58313-fig7-data1-v2.xlsx
Figure 8

Overview figure illustrating the phenotype of myopalladin knockout (MKO) mice under basal conditions and following transaortic constriction (TAC).
M, month; LV, left ventricle; SL, sarcomere length, ICD, intercalated disc.
Author response image 1
Author response image 2
Tables
Table 1
Tension generation and relaxation in ventricular myofibrils from wild-type (WT) and myopalladin knockout (MKO) male mice.
| Myofibril batch | Resting conditions | Tension generation | Relaxation | |||||
|---|---|---|---|---|---|---|---|---|
| Slow phase | Fast phase | |||||||
| SL(µm) | RT(mN/mm2) | P0(mN/mm2) | kACT(s–1) | Duration(ms) | kREL(s–1) | kREL(s–1) | ||
| WT | 2.22 ± 0.02 (26) | 11.1 ± 1.4 (26) | 161 ± 11 (26) | 5.17 ± 0.29 (23) | 74 ± 4 (20) | 1.96 ± 0.18 (20) | 47 ± 4 (23) | |
| MKO | 2.21 ± 0.01 (27) | 10.3 ± 1.3 (26) | 112 ± 6***(27) | 5.38 ± 0.40 (26) | 72 ± 3 (22) | 2.03 ± 0.15 (19) | 30 ± 4 (24) | |
-
All values are presented as mean ± standard error of the mean (SEM). Numbers in parentheses are number of myofibrils. SL, sarcomere length, RT, resting tension, P0, maximum isometric tension; kACT, rate constant of tension rise following step-wise pCa decrease (8.0→4.5) by fast solution switching. Full tension relaxation kinetics were characterized by the duration and rate constant of tension decay of the isometric slow relaxation phase (slow kREL) and the rate constant of the fast relaxation phase (fast kREL). ***p < 0.001 vs. WT; unpaired Student’s t-test.
Appendix 1—key resources table
| Reagent type (species) or resource | Designation | Source or reference | Identifiers | Additional information |
|---|---|---|---|---|
| Strain, strain background (male Mus musculus) | MYPN knockout (MKO) mice (in C57BL/6J background) | Filomena et al., 2020 | N/A | |
| Strain, strain background (Mus musculus) | C57BL/6J | The Jackson Laboratories | Cat# 000664RRID:IMSR_JAX:000664 | |
| Strain, strain background (Escherichia coli) | DH5α electrocompetent cells | New England BioLabs | Cat# C2989K | |
| Strain, strain background (Escherichia coli) | BL21-CodonPlus (DE3)-RIPL strain | Agilent Technologies | Cat# 230280 | |
| Strain, strain background (Saccharomyces cerevisiae) | Y2H Gold yeast strain | Takara Bio | Cat# 630498 | |
| Strain, strain background (Saccharomyces cerevisiae) | L40 yeast strain | Takara Bio | N/A | |
| Antibody | Anti-MYPN (rabbit polyclonal) | Yamamoto et al., 2013 | N/A | WB (1:1000) |
| Antibody | Anti-PALLD 621 (rabbit polyclonal) | Pogue-Geile et al., 2006 | Kindly provided by Prof. Carol Otey, University of North Carolina, Chapel Hill, NC, USA | WB (1:500) IF (1:30) |
| Antibody | Anti-NEBL (rabbit polyclonal) | Mastrototaro et al., 2015 | N/A | WB (1:500) |
| Antibody | Anti-ANKRD1/CARP (rabbit polyclonal) | Miller et al., 2003 | N/A | WB (1:200) IF (1:20) |
| Antibody | Anti-Cypher (rabbit polyclonal) | Zhou et al., 2001 | Kindly provided by Prof. Ju Chen, University of California San Diego, La Jolla, CA, USA | WB (1:500) IF (1:50) |
| Antibody | Anti-α-actinin (mouse monoclonal) | Merck Life Science | Cat# A7811RRID:AB_476766 | WB (1:50000) IF (1:250) |
| Antibody | Anti-desmin (rabbit polyclonal) | Abcam | Cat# Ab8592RRID:AB_306653 | IF (1:80) |
| Antibody | Anti-MKL1/MRTF-A (rabbit polyclonal) | Merck Life Science | Cat# AV37504RRID:AB_1853972 | IF (1:30) |
| Antibody | Anti-MKL1/MRTF-A (rabbit polyclonal) | Immunological Sciences | Cat# AB-84312RRID:AB_2892156 | WB (1:500) |
| Antibody | Anti-desmoplakin 1/2 (mouse monoclonal) | Bio-Rad Laboratories | Cat# 2722–5204RRID:AB_619950 | WB (1:750) |
| Antibody | Anti-α-E-catenin (mouse monoclonal) | Santa Cruz Biotechnology | Cat# sc-9988RRID:AB_626805 | WB (1:1000) |
| Antibody | Anti-β-catenin (rabbit monoclonal) | Cell Signaling Technology | Cat# 8480RRID:AB_11127855 | WB (1:1000) |
| Antibody | Anti-γ-catenin (rabbit polyclonal) | Immunological Sciences | AB-90215RRID:AB_2892157 | WB (1:1000) |
| Antibody | Anti-vinculin (mouse monoclonal) | Merck Life Science | Cat# V9264RRID:AB_10603627 | WB (1:2000) |
| Antibody | Anti-N-cadherin (mouse monoclonal) | Cell Signaling Technology | Cat# 4061RRID:AB_10694647 | WB (1:1000) |
| Antibody | Anti-SORBS2 (mouse monoclonal) | Merck Life Science | Cat# SAB4200183RRID:AB_10638778 | WB (1:750) |
| Antibody | Anti-connexin 43 (mouse monoclonal) | Thermo Fisher Scientific | Cat# 35–5000RRID:AB_87322 | WB (1:400) |
| Antibody | Anti-pAkt-Ser473 (rabbit monoclonal) | Immunological Sciences | MAB-94111RRID:AB_2892158 | WB (1:500) |
| Antibody | Anti-Akt (rabbit polyclonal) | Cell Signaling Technology | Cat# 9272RRID:AB_329827 | WB (1:1000) |
| Antibody | Anti-pErk1/2-Thr202/Tyr204 (rabbit polyclonal) | Cell Signaling Technology | Cat# 4370RRID:AB_2315112 | WB (1:500) |
| Antibody | Anti-Erk1/2 (mouse monoclonal) | Santa Cruz Biotechnology | Cat# sc-514302RRID:AB_2571739 | WB (1:1000) |
| Antibody | Anti-pP38-Tyr182 (mouse monoclonal) | Santa Cruz Biotechnology | Cat# sc-166182RRID:AB_2141746 | WB (1:500) |
| Antibody | Anti-P38α/β (mouse monoclonal) | Santa Cruz Biotechnology | Cat# sc-7972RRID:AB_628079 | WB (1:500) |
| Antibody | Anti-calcineurin B (rabbit polyclonal) | Novus Biochemical | Cat# NBP1-32720RRID:AB_2168483 | WB (1:500) |
| Antibody | Anti-calsequestrin - (mouse monoclonal) | BD Trasduction Labs | Cat# C16420 | WB (1:5000) |
| Antibody | Anti-SERCA2A (mouse monoclonal) | Affinity Bio Reagent (ABR) | Cat# ma3-919RRID:AB_325502 | WB (1:1000) |
| Antibody | Anti-pPLN-Thr16 (rabbit polyclonal) | Badrilla | Cat# 010–12RRID:AB_2617047 | WB (1:500) |
| Antibody | Anti-PLN (mouse monoclonal) | Novus Biochemical | Cat# NB300-582RRID:AB_10000946 | WB (1:500) |
| Antibody | Anti-RyR2 (mouse monoclonal) | Affinity Bio Reagent (ABR) | Cat# ma3-916RRID:AB_2183054 | WB (1:1000) |
| Antibody | Anti-pRyR-Ser2808 (rabbit polyclonal) | Badrilla | Cat# A010-30APRRID:AB_2617052 | WB (1:500) |
| Antibody | Anti-sodium calcium exchanger (NCX) (mouse monoclonal) | Merck Life Science | Cat# N216RRID:AB_260750 | WB (1:1000) |
| Antibody | Anti-CACNA1C (rabbit polyclonal) | Abcam | Cat# Ab58552RRID:AB_879800 | WB (1:500) |
| Antibody | Anti-CACNA1S (mouse monoclonal) | Abcam | Cat# Ab2862RRID:AB_2069567 | WB (1:500) |
| Antibody | Anti-phosphoserine/ threonine (rabbit polyclonal) | ECM Biosciences | Cat# PP2551RRID:AB_1184778 | WB (1:500) |
| Antibody | Anti-pTTN-Ser3991 (rabbit polyclonal) | Kötter et al., 2013 | N/A | WB (1:500) |
| Antibody | Anti-pTTN-Ser4080 (rabbit polyclonal) | Kötter et al., 2013 | N/A | WB (1:500) |
| Antibody | Anti-pTTN-Ser12742 (rabbit polyclonal) | Kötter et al., 2013 | N/A | WB (1:500) |
| Antibody | Anti-actin (goat polyclonal) | Santa Cruz Biotechnology | Cat# sc-1615RRID:AB_630835 | WB (1:10000) |
| Antibody | Goat anti-mouse IgG (H + L) secondary antibody Alexa Fluor 488-conjugated IgG | Thermo Fisher Scientific | Cat# A11029RRID:AB_138404 | IF (1:500) |
| Antibody | Goat anti-rabbit IgG (H + L) secondary antibody Alexa Fluor 488-conjugated IgG | Thermo Fisher Scientific | Cat# A11034RRID:AB_2576217 | IF (1:500) |
| Antibody | Goat anti-mouse IgG (H + L) Secondary antibody Alexa Fluor 568-conjugated conjugate | Thermo Fisher Scientific | Cat# A11031RRID:AB_144696 | IF (1:500) |
| Antibody | Goat anti-rabbit IgG (H + L) Secondary antibody Alexa Fluor 568-conjugated conjugate | Thermo Fisher Scientific | Cat# A11036RRID:AB_10563566 | IF (1:500) |
| Antibody | Goat anti-mouse IgG (H + L) Secondary antibody Alexa Fluor 647-conjugated conjugate | Thermo Fisher Scientific | Cat# A21236RRID:AB_2535805 | IF (1:500) |
| Antibody | Goat anti-rabbit IgG (H + L) Secondary antibody Alexa Fluor 647-conjugated conjugate | Thermo Fisher Scientific | Cat# A21245RRID:AB_2535813 | IF (1:500) |
| Antibody | Goat anti-rabbit IgG Horseradish Peroxidase (HRP) | Thermo Fisher Scientific | Cat# 31460RRID:AB_228341 | WB (1:5000) |
| Antibody | Goat anti-mouse IgG-HRP | Thermo Fisher Scientific | Cat# 31430RRID:AB_228307 | WB (1:5000) |
| Antibody | Donkey anti-goat IgG-HRP | Santa Cruz Biotechnology | Cat# sc-2020RRID:AB_631728 | WB (1:2000) |
| Recombinant DNA reagent | Modified pLexA vector | Stenmark et al., 1995 | N/A | |
| Recombinant DNA reagent | pGBKT7 DNA-BD vector | Takara Bio | Cat# 630443 | |
| Recombinant DNA reagent | pGADT7 AD vector | Takara Bio | Cat# 630442 | |
| Recombinant DNA reagent | Human skeletal muscle cDNA library in the pGAD10 vector | Clontech Laboratories | HL4010AB | |
| Recombinant DNA reagent | pET-3d vector | Merck Life Science | Cat# 69421 | |
| Recombinant DNA reagent | pETM-14 | Dümmler et al., 2005 | N/A | |
| Recombinant DNA reagent | pET-3d 6xHis human MYPN C-term | This paper | N/A | Cloning primers in Supplementary file 1 |
| Recombinant DNA reagent | pETM-14 human MYPN C-term | This paper | N/A | Cloning primers in Supplementary file 1 |
| Recombinant DNA reagent | pET-3d-6xHis human Titin Z4-Z5 | This paper | N/A | Cloning primers in Supplementary file 1 |
| Recombinant DNA reagent | pETM-14 human PALLD C-term | This paper | N/A | Cloning primers in Supplementary file 1 |
| Recombinant DNA reagent | pGBKT7 human Titin IgZ4-Z5 | This paper | N/A | Cloning primers in Supplementary file 1 |
| Recombinant DNA reagent | pGADT7 human MYPN full-length | This paper | N/A | Cloning primers in Supplementary file 1 |
| Recombinant DNA reagent | pGADT7 human MYPN Ig3-end | This paper | N/A | Cloning primers in Supplementary file 1 |
| Recombinant DNA reagent | pGADT7 human MYPN Ig5-end | This paper | N/A | Cloning primers in Supplementary file 1 |
| Recombinant DNA reagent | pGADT7 human MYPN Ig3-4 | This paper | N/A | Cloning primers in Supplementary file 1 |
| Recombinant DNA reagent | pGADT7 human MYPN Ig4-end | This paper | N/A | Cloning primers in Supplementary file 1 |
| Recombinant DNA reagent | pGADT7 human PALLD C-term | This paper | N/A | Cloning primers in Supplementary file 1 |
| Recombinant DNA reagent | pLexA-titin Z3-Z5 | This paper | N/A | Cloning primers in Supplementary file 1 |
| Recombinant DNA reagent | pLexA-titin Z4-Z5 | This paper | N/A | Cloning primers in Supplementary file 1 |
| Sequence-based reagent | qRT-PCR primers | This paper | N/A | Supplementary file 1 |
| Commercial assay or kit | In-Fusion HD Cloning kit | Takara Bio | Cat# 639650 | |
| Commercial assay or kit | Monolith NT Protein Labeling Kit RED-NHS | NanoTemper Technologies | Cat# L001 | |
| Commercial assay or kit | DC Protein Assay Kit II | Bio-Rad Laboratories | Cat# 5000112 | |
| Commercial assay or kit | Frozen-EZ Yeast Transformation II kit | Zymo Research | Cat# T2001 | |
| Chemical compound, drug | Aureobasidin A | Takara Bio | Cat# 630499 | |
| Chemical compound, drug | X-α-Gal | Takara Bio | Cat# 630,463 | |
| Chemical compound, drug | HisTrap column | GE Healthcare | ||
| Chemical compound, drug | HiLoad 16/600 Superdex 75 pg column | GE Healthcare | Cat# 28989333 | |
| Chemical compound, drug | TRIzol Reagent | Thermo Fisher Scientific | Cat# 15596026 | |
| Chemical compound, drug | High Capacity cDNA Reverse Transcription kit | Thermo Fisher Scientific | Cat# 4368814 | |
| Chemical compound, drug | GoTaq qPCR Master Mix | Promega | Cat# A6002 | |
| Chemical compound, drug | COmplete Protease Inhibitor Cocktail Tablets | Merck Life Science | Cat# 11697498001 | |
| Chemical compound, drug | Pierce Phosphatase Inhibitor Mini Tablets | Thermo Fisher Scientific | Cat# A32957 | |
| Chemical compound, drug | Immobilon Western Chemiluminescent HRP Substrate | Merck Life Science | Cat# WBKLS0500 | |
| Chemical compound, drug | Rhodamine phalloidin | Thermo Fisher Scientific | Cat# R415 | IF (1:100) |
| Chemical compound, drug | Wheat Germ Agglutinin, Alexa Fluor 594 Conjugate | Thermo Fisher Scientific | Cat# W11262 | IF (1:500) |
| Chemical compound, drug | VECTASHIELD Vibrance Antifade Mounting Medium with DAPI | D.B.A. Italia Srl. | Cat# H-1800–10 | |
| Chemical compound, drug | Collagenase, Type 2 | Worthington Biochemical Corporation | Cat# LS004177 | |
| Chemical compound, drug | Fura-2, AM, cell permeant | Thermo Fisher Scientific | Cat# F1201 | |
| Chemical compound, drug | Fluo-4, AM, cell permeant | Thermo Fisher Scientific | Cat# F14201 | |
| Other | 4–20% Criterion TGX Stain Free protein gel,18 well | Bio-Rad Laboratories | Cat# 5678094 | |
| Software, algorithm | Prism, version 7.0 | GraphPad Software Inc | https://www.graphpad.com/scientific-software/prism/RRID:SCR_002798 | |
| Software, algorithm | Fiji (ImageJ) (analysis software, version 2.0.0-rc-69/1.52 p) | National Institute of Health (NIH) | https://fiji.sc/RRID:SCR_002285 | SparkMaster plugin used for Ca2+ spark analysis |
| Software, algorithm | NT Affinity Analysis software, version 2.0.1334 | NanoTemper Technologies | N/A | |
| Software, algorithm | Ion Wizard, software, version 6.6.11 | IonOptix B.V. | N/A |
Additional files
-
Supplementary file 1
Oligos used for quantitative real-time PCR (qRT-PCR) and clonings.
- https://cdn.elifesciences.org/articles/58313/elife-58313-supp1-v2.docx
-
Transparent reporting form
- https://cdn.elifesciences.org/articles/58313/elife-58313-transrepform1-v2.pdf
Download links
A two-part list of links to download the article, or parts of the article, in various formats.
Downloads (link to download the article as PDF)
Open citations (links to open the citations from this article in various online reference manager services)
Cite this article (links to download the citations from this article in formats compatible with various reference manager tools)
Myopalladin knockout mice develop cardiac dilation and show a maladaptive response to mechanical pressure overload
eLife 10:e58313.
https://doi.org/10.7554/eLife.58313


