A new no-report paradigm reveals that face cells encode both consciously perceived and suppressed stimuli
- Division of Biology and Biological Engineering, Computation and Neural Systems, United States
- Howard Hughes Medical Institute, United States
Figures
Figure 1
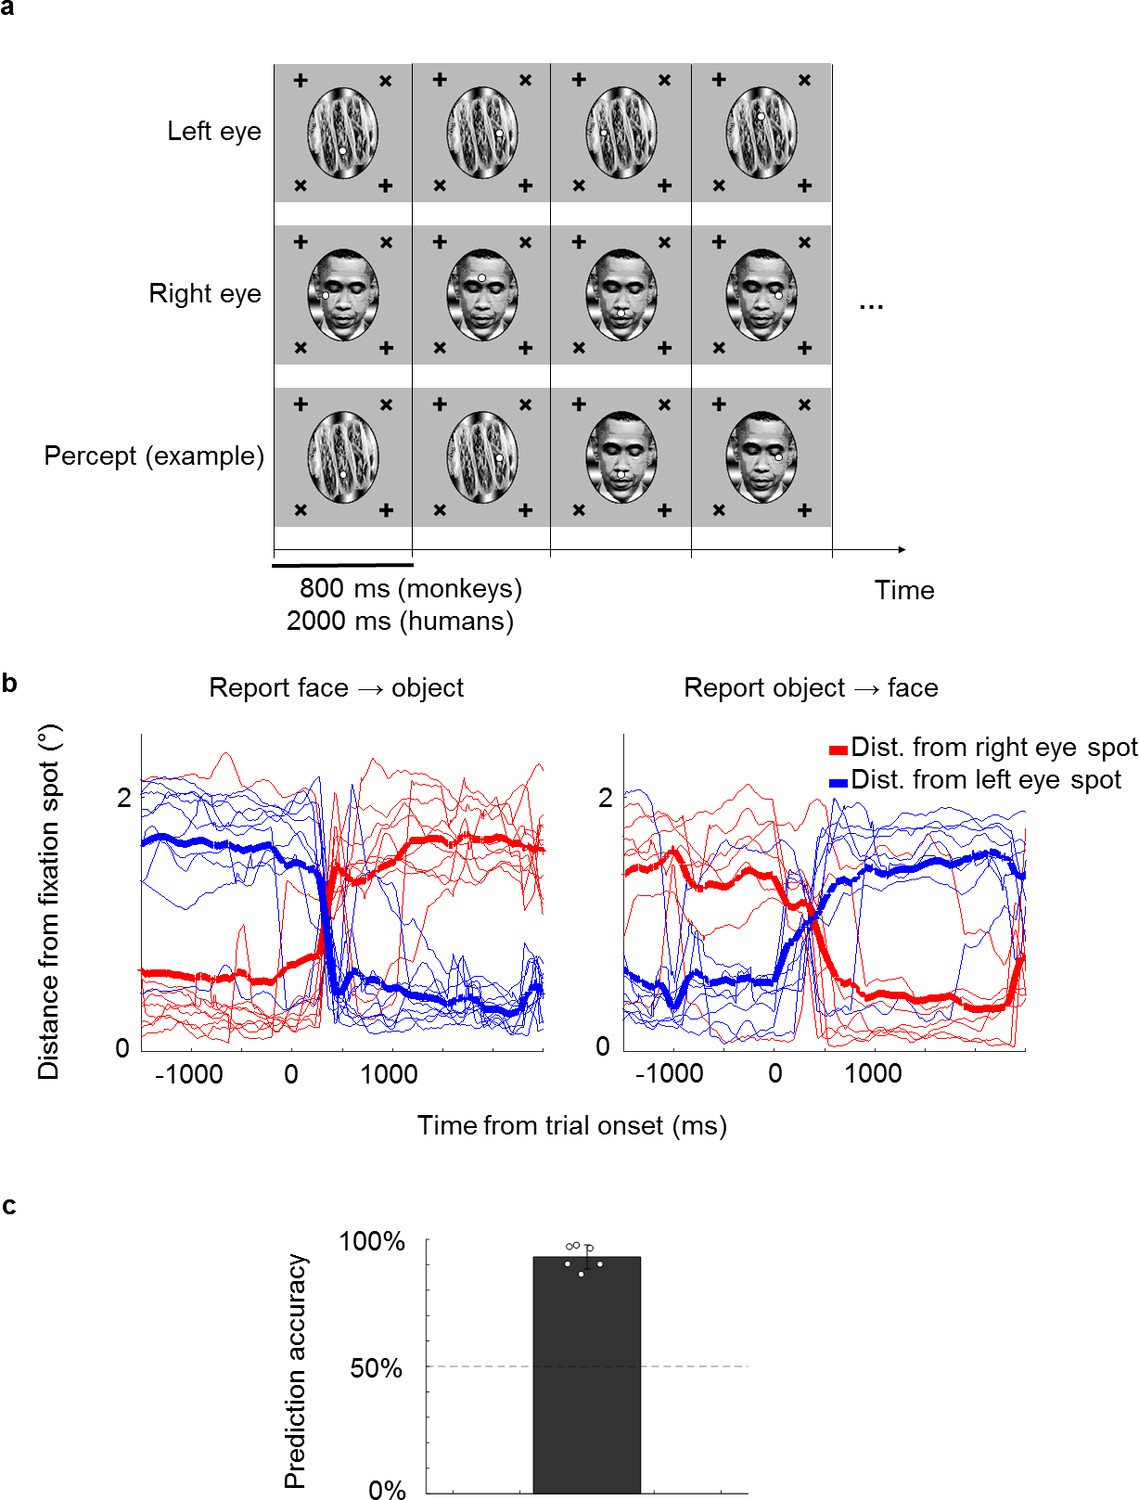
A novel no-report paradigm.
(a) Illustration of binocular rivalry stimuli used in the paradigm. Four example trials are shown. Each trial was presented continuously for 800 ms without blank period between trials. The first and second rows show stimuli in the left and right eyes, respectively. If different stimuli are shown to the left and right eyes, as in this example, one’s percept will spontaneously alternate between the two, as shown in the example perceptual trajectory in the third row. Stimuli in each eye contained a fixation spot at one of four possible positions. (b) Example eye traces from a human subject. Red and blue traces show the distance of the eye position from the fixation spot in the right and left eyes, respectively. Thick lines show the average. Traces are aligned to the onset of a trial where the subject reported that the percept switched from face to object (left) or object to face (right). (c) The bar plot shows the average proportion of trials where the percept inferred matched the percept reported by button press. White circles show accuracies of individual subjects. We inferred that a subject was perceiving face or object if the subject fixated on the face fixation spot (i.e., fixation spot in the eye of the face stimulus) or object fixation spot (i.e., fixation spot in the eye of the object stimulus), respectively, for at least half of the trial.
Figure 2

Example face cells modulated by both physical and perceptual switches.
(a) Top: Example eye traces from a macaque performing the task aligned to a trial where the inferred percept switched from face to object (left) and from object to face (right). Red and blue curves indicate distances from the face and object fixation spots, respectively (as in Figure 1b). Bottom: Spike raster of an example ML cell recorded in the same session as for the top panel. Responses are aligned to all trials where the inferred percept switched from face to object (left) and from object to face (right). (b) Left: Coronal slices from magnetic resonance imaging scan showing recording locations for the two example cells in this figure (top: face patch ML, bottom: face patch AM). Color overlay shows functional magnetic resonance imaging activation to visually presented faces vs. non-face objects. Middle: Peristimulus histograms (PSTHs) show neuronal response time courses aligned to trial onsets where the visual stimulus was physically switched from face to object (blue) or from object to face (red). Right: PSTHs aligned to trial onsets where the inferred percept switched from face to object (blue) or object to face (red). ML cell is same cell as in (a). Shaded areas indicate standard error of the mean across trials.
Figure 3 with 1 supplement
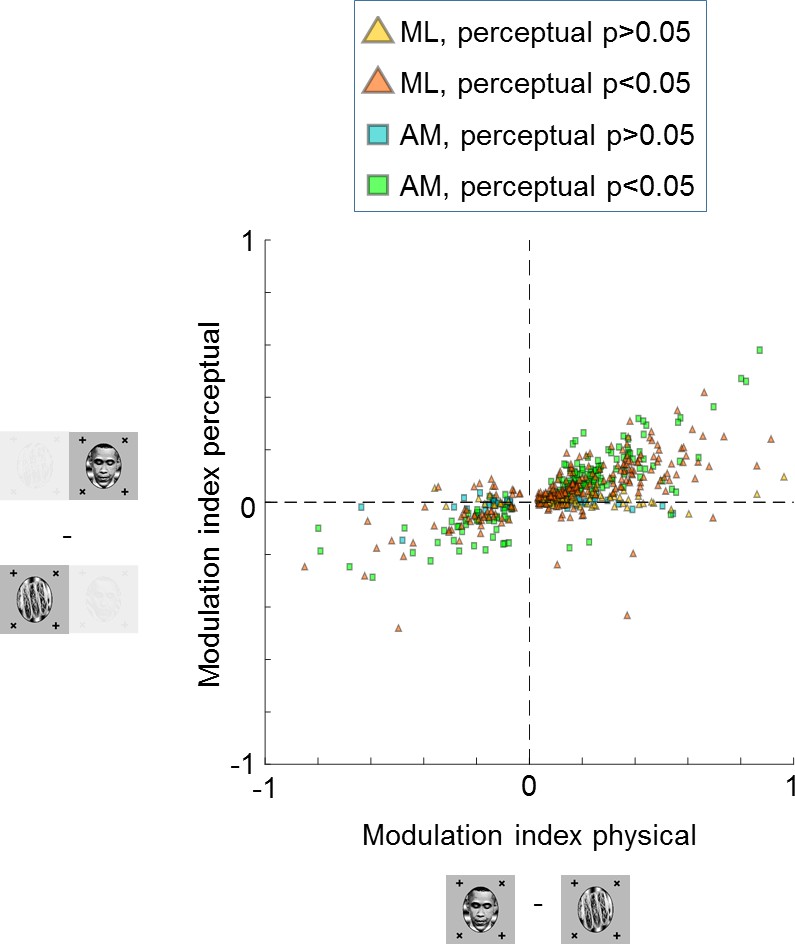
Large proportions of face cells show modulation by conscious percept.
The scatterplot shows modulation indices measuring the difference in responses (i.e., average spike count ) on trials where the inferred percept was face vs. trials where the inferred percept was object for the physical monocular condition (x-axis) and perceptual binocular rivalry condition (y-axis). Yellow and orange triangles show cells from ML without and with significant difference between perceived face and perceived object response in the binocular rivalry condition, respectively. Blue and green squares show cells from AM without and with significant difference between perceived face and perceived object response in the binocular rivalry condition, respectively.
Figure 3—figure supplement 1
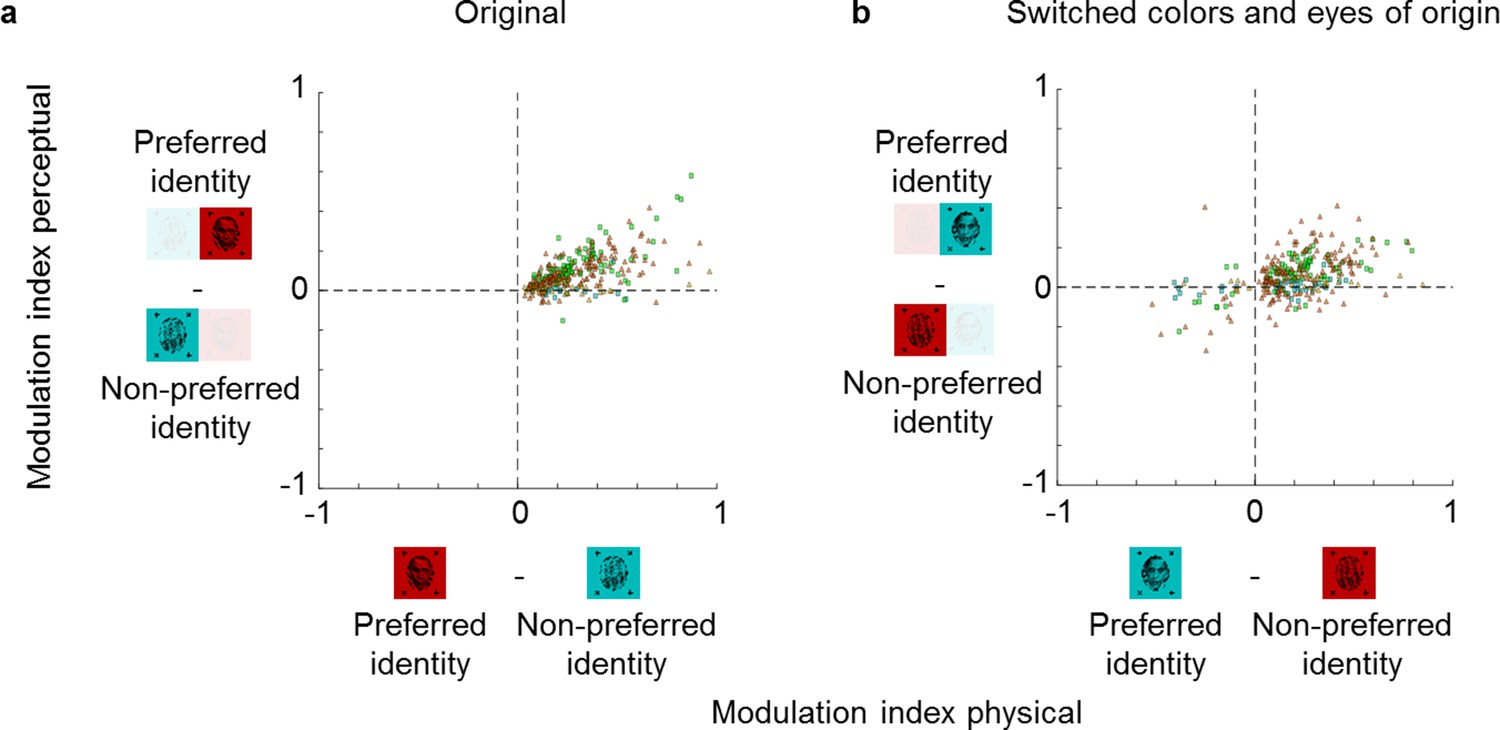
Color and eye-of-origin confound control.
Left: Scatterplot similar to Figure 3 but modulation indices now show the difference between preferred and non-preferred stimulus. The preferred stimulus is face if the response to face is higher and non-face object if the response to non-face object is higher in the physical condition. Thus, by definition the x-values of all cells are positive. Right: Scatterplot of modulation indices for the same preferred and non-preferred object identities of stimuli when the colors and eye-of-origin of the two stimuli were switched. Importantly, the preference of a given stimulus identity was assigned based on responses to stimuli of the original color and eye-of-origin. N = 193 for ML and N = 120 for AM for both plots. Symbols have same conventions as in Figure 3.
Figure 4

Multi-channel recordings allow decoding of conscious percept on single trials.
(a) Left: Average responses (baseline-subtracted and normalized) of cells (rows) to 96 stimuli (columns) from six categories, including faces and other objects. Right: Waveforms of cells corresponding to rows on the left. Gray vertical bar on left indicates cells that significantly preferred face over object in the physical condition (p<0.05). (b) Top: Example eye trace across 24 trials as in Figure 1b during binocular rivalry (i.e., only perceptual, no physical switches). The inferred percept across trials according to eye trace is indicated by shading (red = face, blue = non face object). Small black dots on top of eye traces indicate time points where our method detected saccades (see Materials and methods), which are used in Figure 5. Bottom: Response time course snippet of a population of 81 neurons recorded with a Neuropixels-like probe in ML simultaneously to the eye trace at top. Each row represents one cell; ordering same as in (a). Face-selective cells indicated by gray vertical bar on left. (c) Normalized average population response across all significantly face-selective ML cells recorded from one Neuropixels session (same session as in a and b) to perceptual switch from object to face (red) and face to object (blue). Shaded areas indicate standard error mean across cells. (d) Cross-validated decoding accuracy of a linear classifier trained to discriminate trials of inferred percept face vs. inferred percept object for the physical switch condition (x-axis) and perceptual switch condition (y-axis). Each plus symbol represents a session of neurons recorded simultaneously with multi-channel electrodes.
Figure 5 with 1 supplement
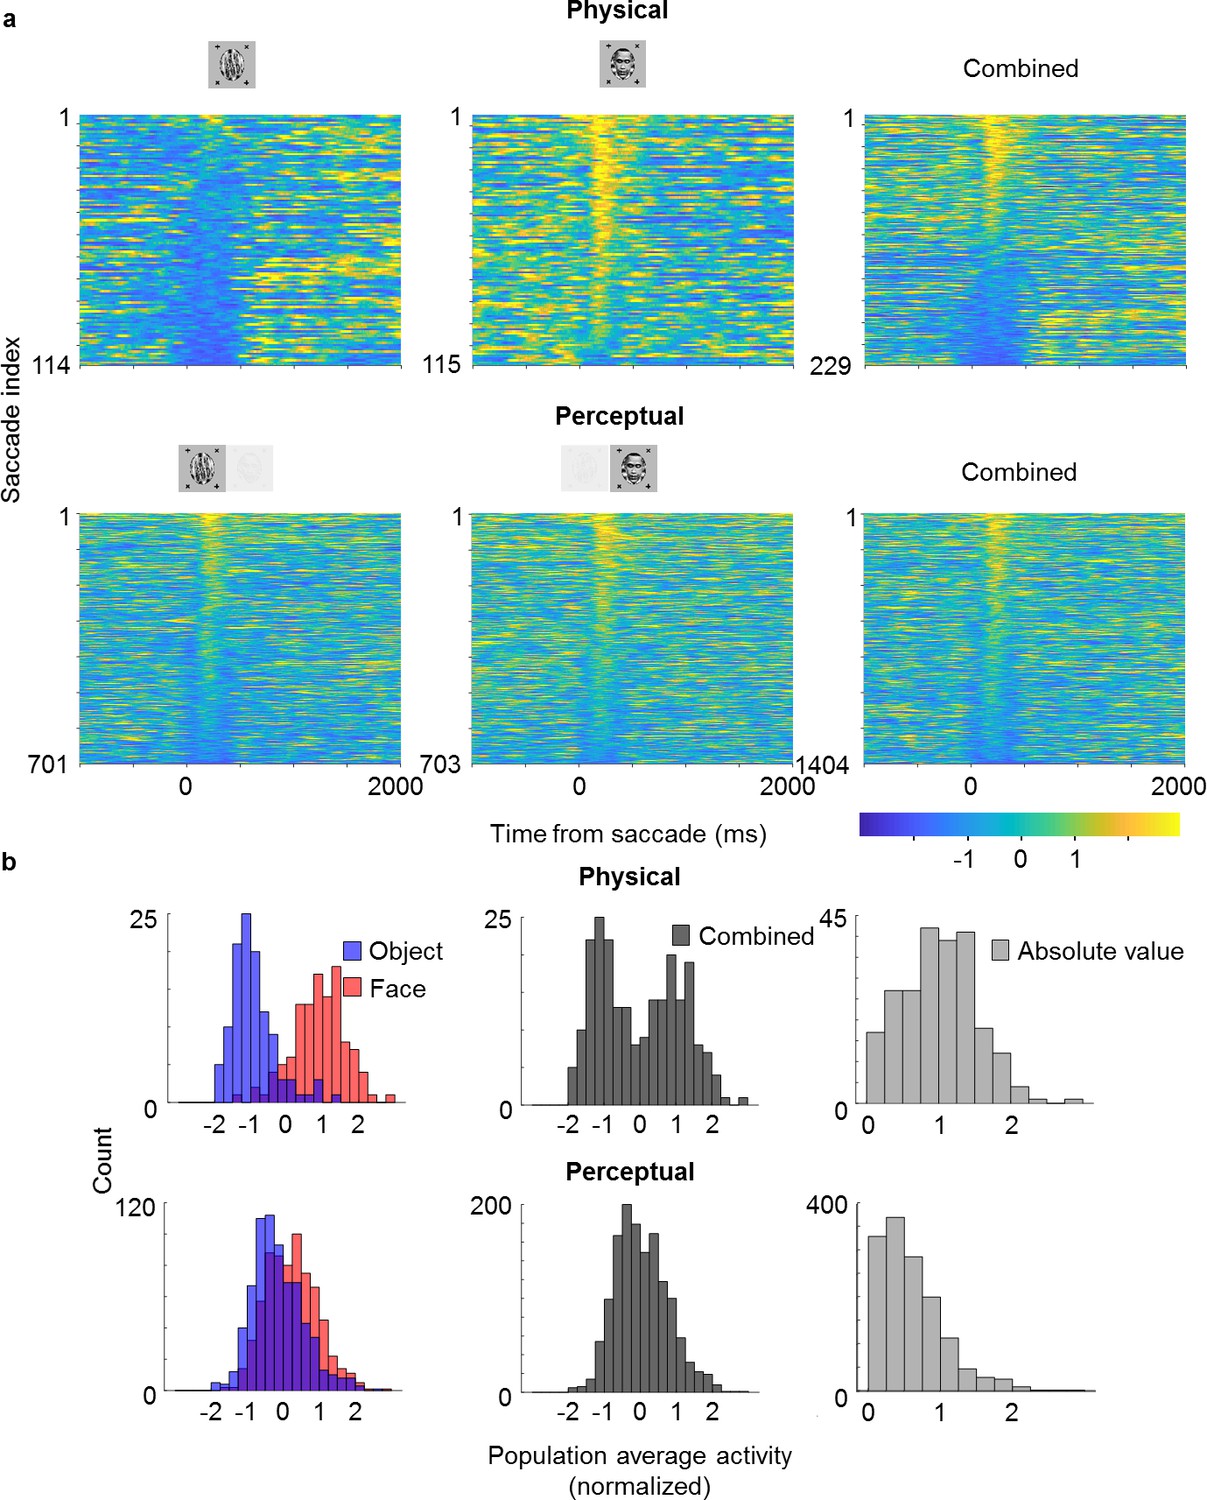
Saccade-triggered responses are less bimodal during rivalry.
(a) Single-trial responses during saccades averaged across simultaneously recorded ML neurons from the same session as in Figure 4b that were significantly face-selective for both physical and perceptual conditions. Individual neuron responses were normalized to make the mean object response −1 and the mean face response +1. Rows of each plot correspond to response time courses to individual saccades, aligned to saccade onset, and sorted by average response during 0–400 ms after saccade onset. Top: Physical condition. Bottom: Perceptual condition. Left, middle, and right columns correspond to saccades during object epochs, face epochs, and across both, respectively. The difference between perceptual and physical conditions in the third column shows that this difference cannot be simply attributed to mislabeling of perceptual state by the no-report paradigm. (b) Histograms of saccade-aligned responses averaged across a time window of 0–400 ms after saccade onset and across neurons (after normalizing as in (a)) that were significantly modulated for both physical and perceptual conditions. Top: Physical condition. Bottom: Perceptual condition. Left: Saccades for face and object plotted separately in red and blue, respectively. Middle: Saccades for either face or object epochs plotted in gray. Right: Absolute values of normalized responses plotted in light gray.
Figure 5—figure supplement 1

Lack of bimodality is a general trademark of rivalry.
(a) Trial responses in ML are less bimodal during rivalry. Histograms have same conventions as Figure 5b but instead of averaging neuron responses for individual saccades, responses are averaged across trial duration for individual trials. (b) Trial responses in AM are less bimodal during rivalry. Same conventions as in (a), but instead of the Neuropixels-like probe in ML, cells were recorded simultaneously from AM using a 32-channel S-probe.
Figure 6
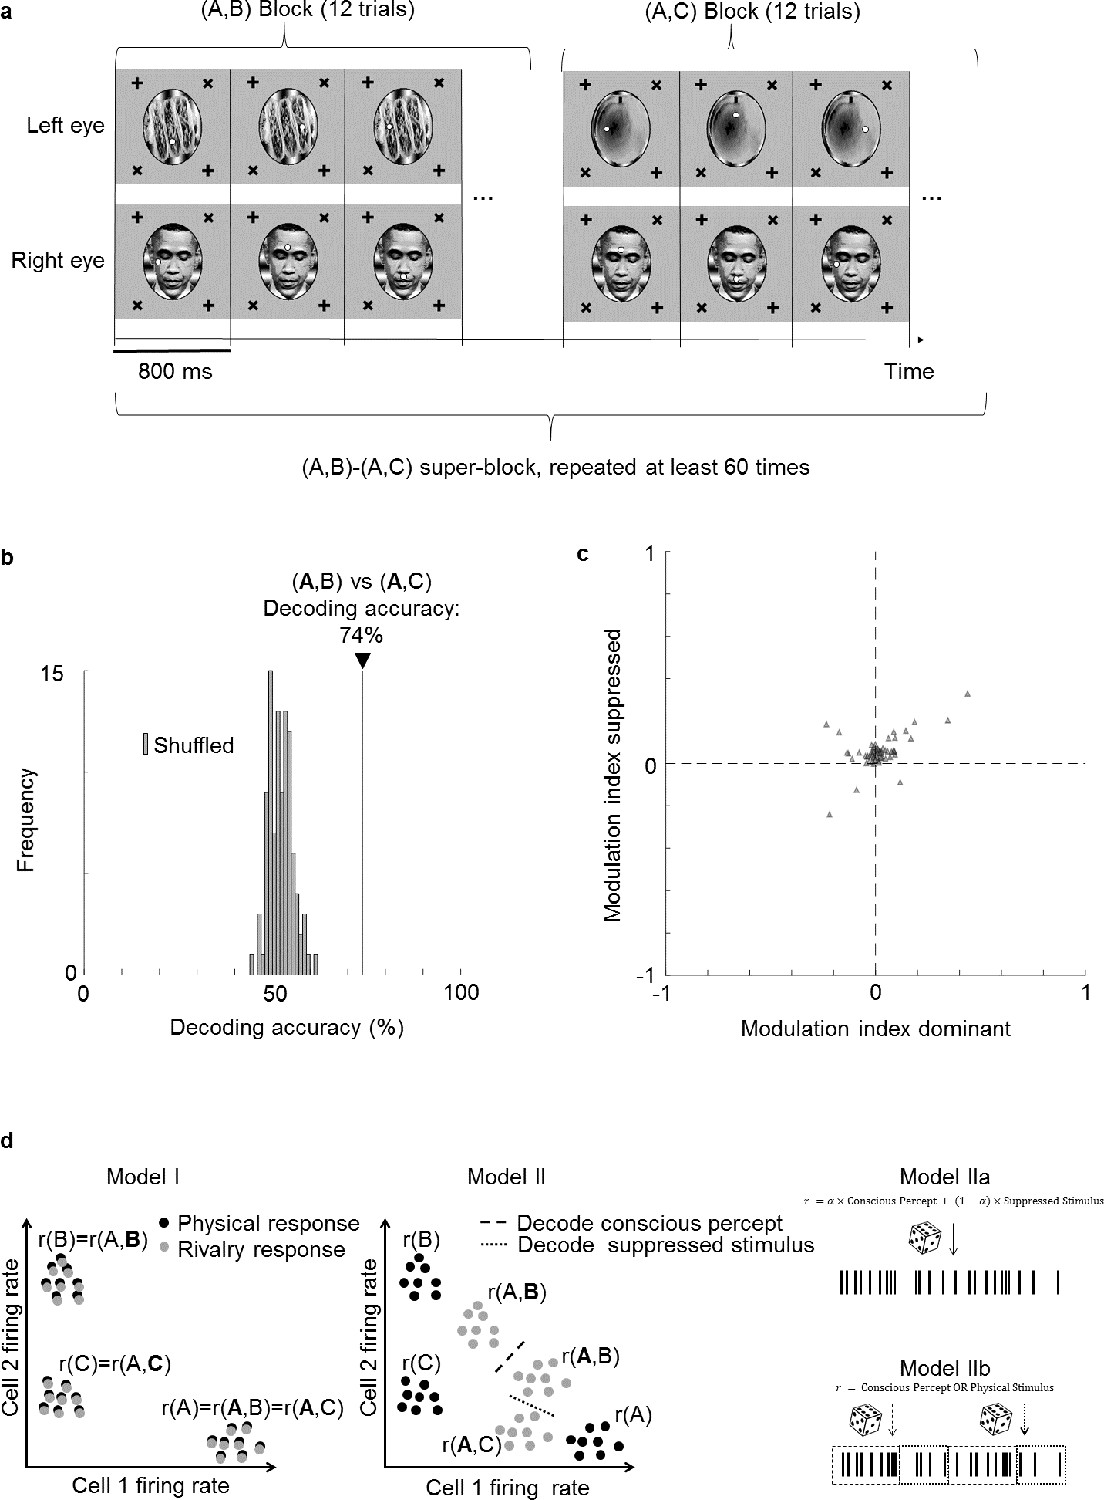
Face cells multiplex information about both the perceptually dominant and perceptually suppressed stimulus.
(a) Schematic of experiment design. Two types of binocular rivalry stimuli consisting of image pairs (A,B) and (A,C), respectively, were presented. During one image pair block, 12 trials corresponding to the 12 positions of the two fixation spots were presented in randomized order before the next block corresponding to the other image pair was presented. This was repeated more than 60 times. (b) Decoding accuracy for distinguishing (A,B) from (A,C) was 74% (black vertical line), even though the conscious percept was A for both trial types. As a control, we shuffled labels 100 times and attempted to perform decoding. Gray bars show the distribution of decoding accuracies for these 100 shuffle iterations. (c) Scatterplot showing dominant stimulus modulation indices on the x-axis and suppressed stimulus modulation indices on the y-axis. Each triangle represents 1 of 66 physically selective cells recorded in one session from face patch ML with a 64-ch S-probe. (d) Schematic of three possible models for how perceptually modulated neurons may encode consciously perceived and suppressed stimuli during binocular rivalry. Left: (I) Neural responses encode the conscious percept in binocular rivalry identically to the corresponding unambiguous physical stimulus; x and y axes represent two dimensions of neural state space. Middle: (II) Responses during binocular rivalry lie in between the two stimuli but are biased toward the dominant stimulus. Right: (IIa) Spikes reflect a weighted sum of consciously perceived and suppressed stimuli and are generated through a Poisson process based on average firing rates. (IIb) Two different types of spikes, defined, for example through a temporal code, encode the consciously perceived and veridical physical stimulus, respectively. The time course in this schematic is from a single perceptual dominance period and divided into different epochs that represent either the conscious or physical stimulus.
Author response image 1
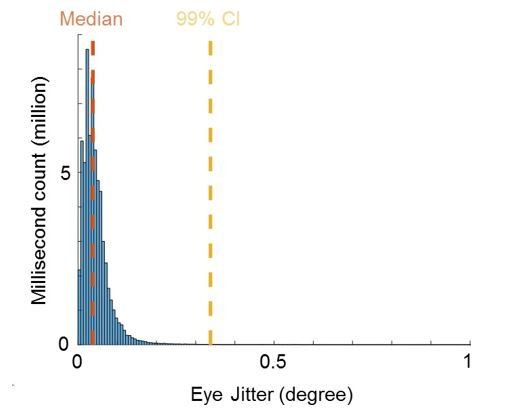
Quality of eye movement measurements.
Histogram shows counts of Euclidean distances between eye positions of adjacent milliseconds in the range from 0 to 1 degree visual angle across all recorded sessions. Median and 99% confidence interval (CI) is shown in orange and yellow, respectively.
Additional files
Download links
A two-part list of links to download the article, or parts of the article, in various formats.
Downloads (link to download the article as PDF)
Open citations (links to open the citations from this article in various online reference manager services)
Cite this article (links to download the citations from this article in formats compatible with various reference manager tools)
A new no-report paradigm reveals that face cells encode both consciously perceived and suppressed stimuli
eLife 9:e58360.
https://doi.org/10.7554/eLife.58360


