Structural basis of mitochondrial translation
- Science for Life Laboratory, Department of Biochemistry and Biophysics, Stockholm University, Sweden
- Department of Medical Biochemistry and Biophysics, Karolinska Institutet, Sweden
- Laboratory of Translational Genomics, Centre for Integrative Biology, University of Trento, Italy
Figures
Figure 1 with 5 supplements
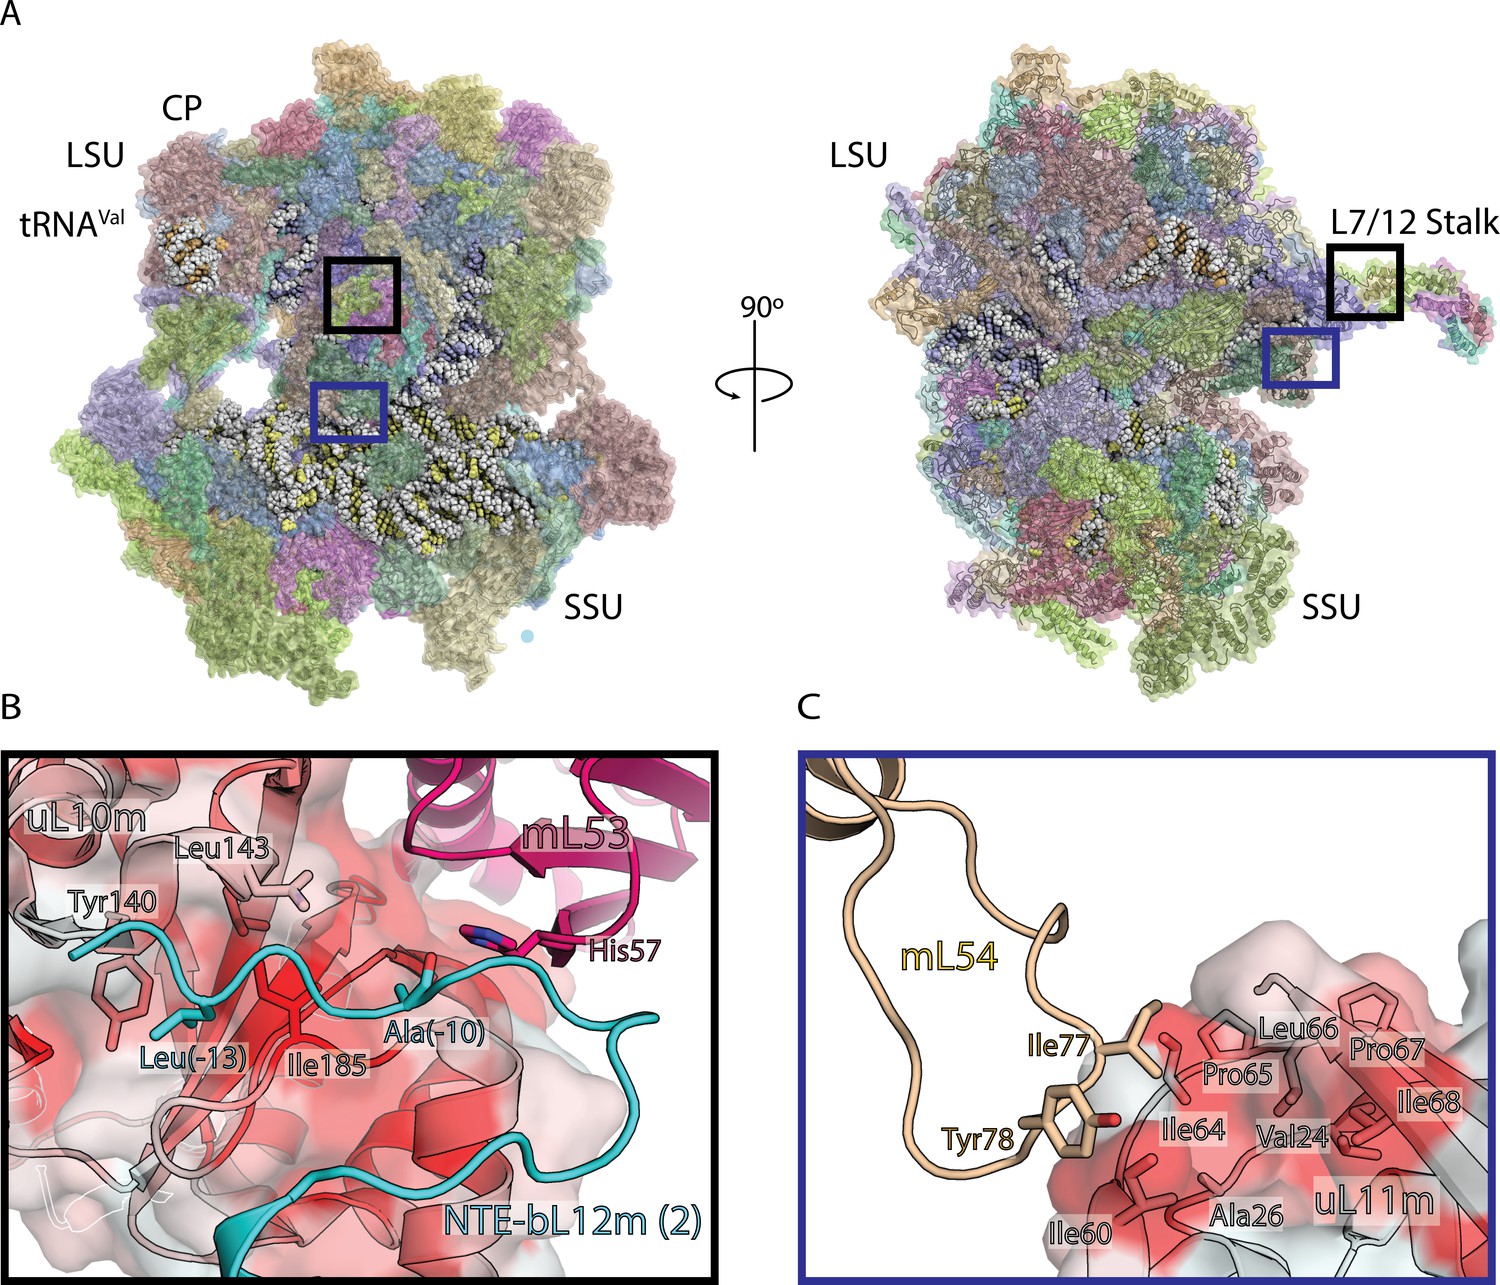
Structure of human mitoribosome and modeled L7/L12 stalk.
(A) Overview of the human mitoribosome model. The mitoribosomal proteins are shown in cartoon with transparent surface, rRNA is shown as spheres. Zoomed in regions are indicated. (B) View of the improved model of the N-terminal mitochondrial extension of bL12m (cyan) and its contacts with mL53 (magenta) and uL10m (grey). The protein uL10m is shown with transparent surface colored by hydrophobicity, with red indicating most hydrophobic, revealing a hydrophobic patch involved in bL12m binding. (C) The modeled loop of mL54 (wheat) forms hydrophobic interface with uL11m (grey with transparent surface colored by hydrophobicity). These interactions between mitochondria-specific elements contribute to the stability of the stalk.
Figure 1—figure supplement 1
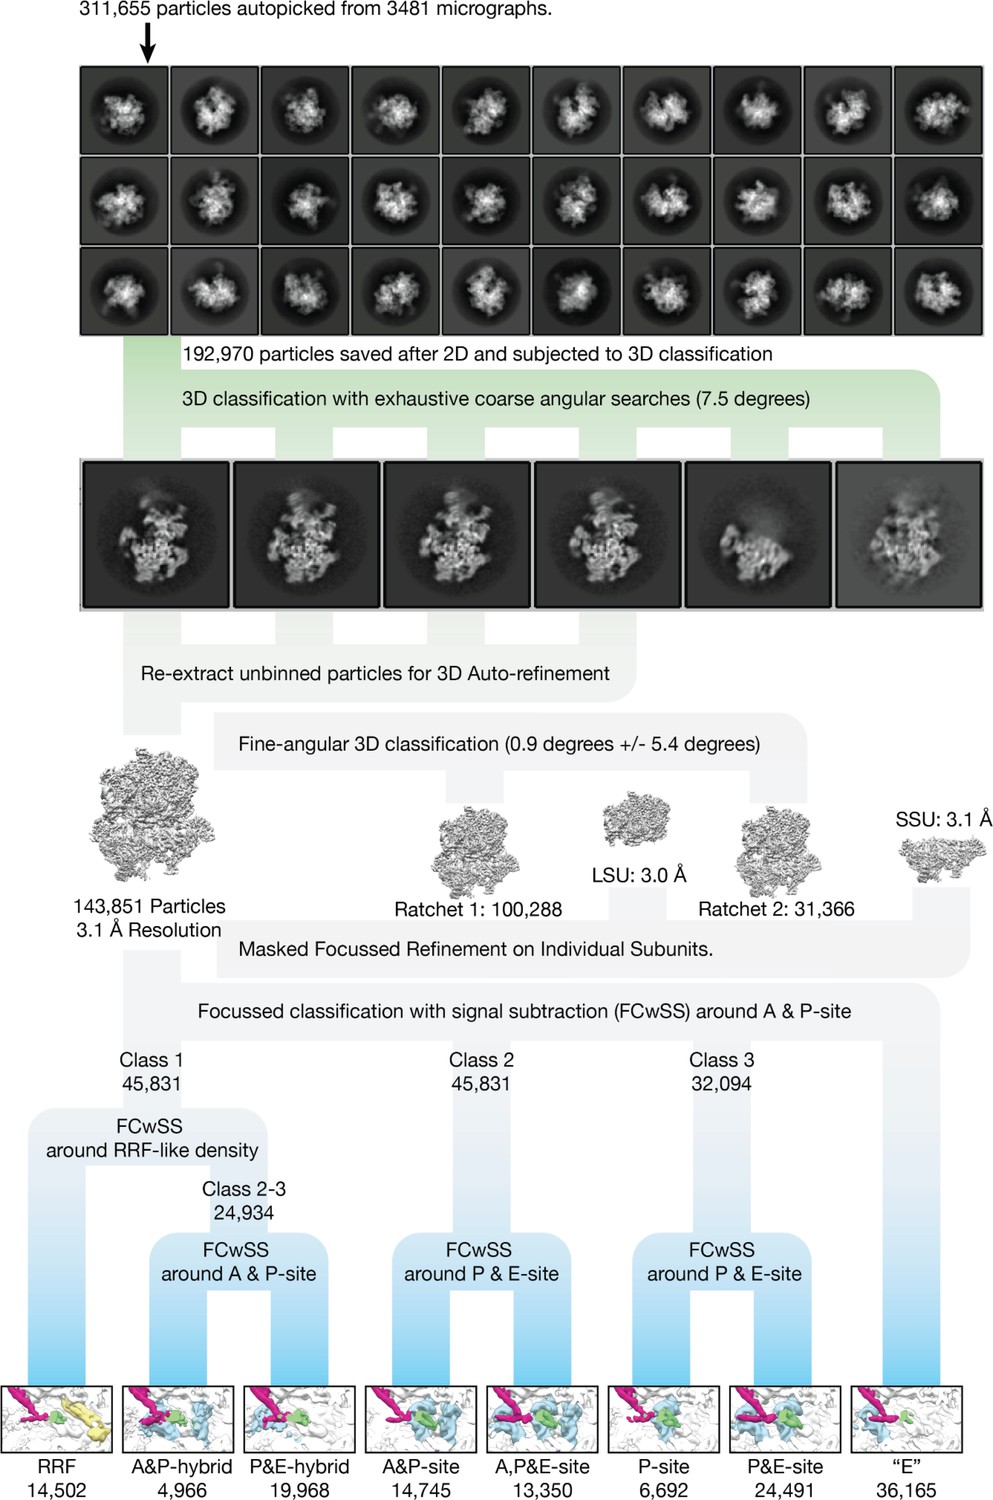
Cryo-EM data processing.
2D and 3D classes of the mitoribosome represent a variety of orientations. The classification strategy for separating different states is shown, which resulted in eight classes (tRNA blue, mtRRF yellow, involved mitoribosomal elements indicated). For the purposes of clarity, the inset showing the tRNAs have been filtered to 7 Å resolution.
Figure 1—figure supplement 2
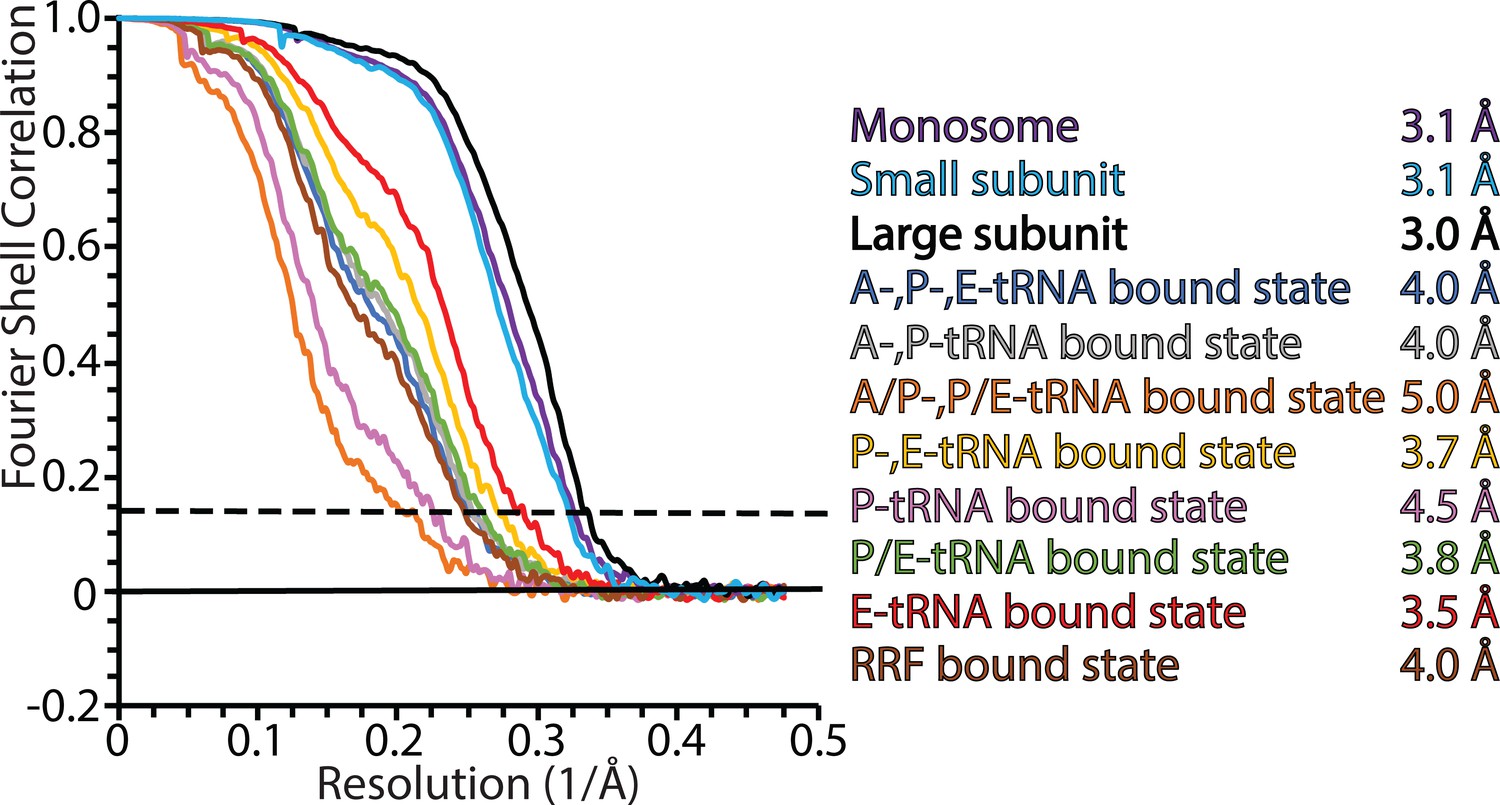
Fourier shell correlation (FSC) curves for mitoribosomal complexes.
FSC plots for the consensus map of the monosome; masked refined maps of the large and small subunits; 8 maps of different states. Resolution is estimated based on the 0.143 FSC cut-off criterion (dashed line).
Figure 1—figure supplement 3
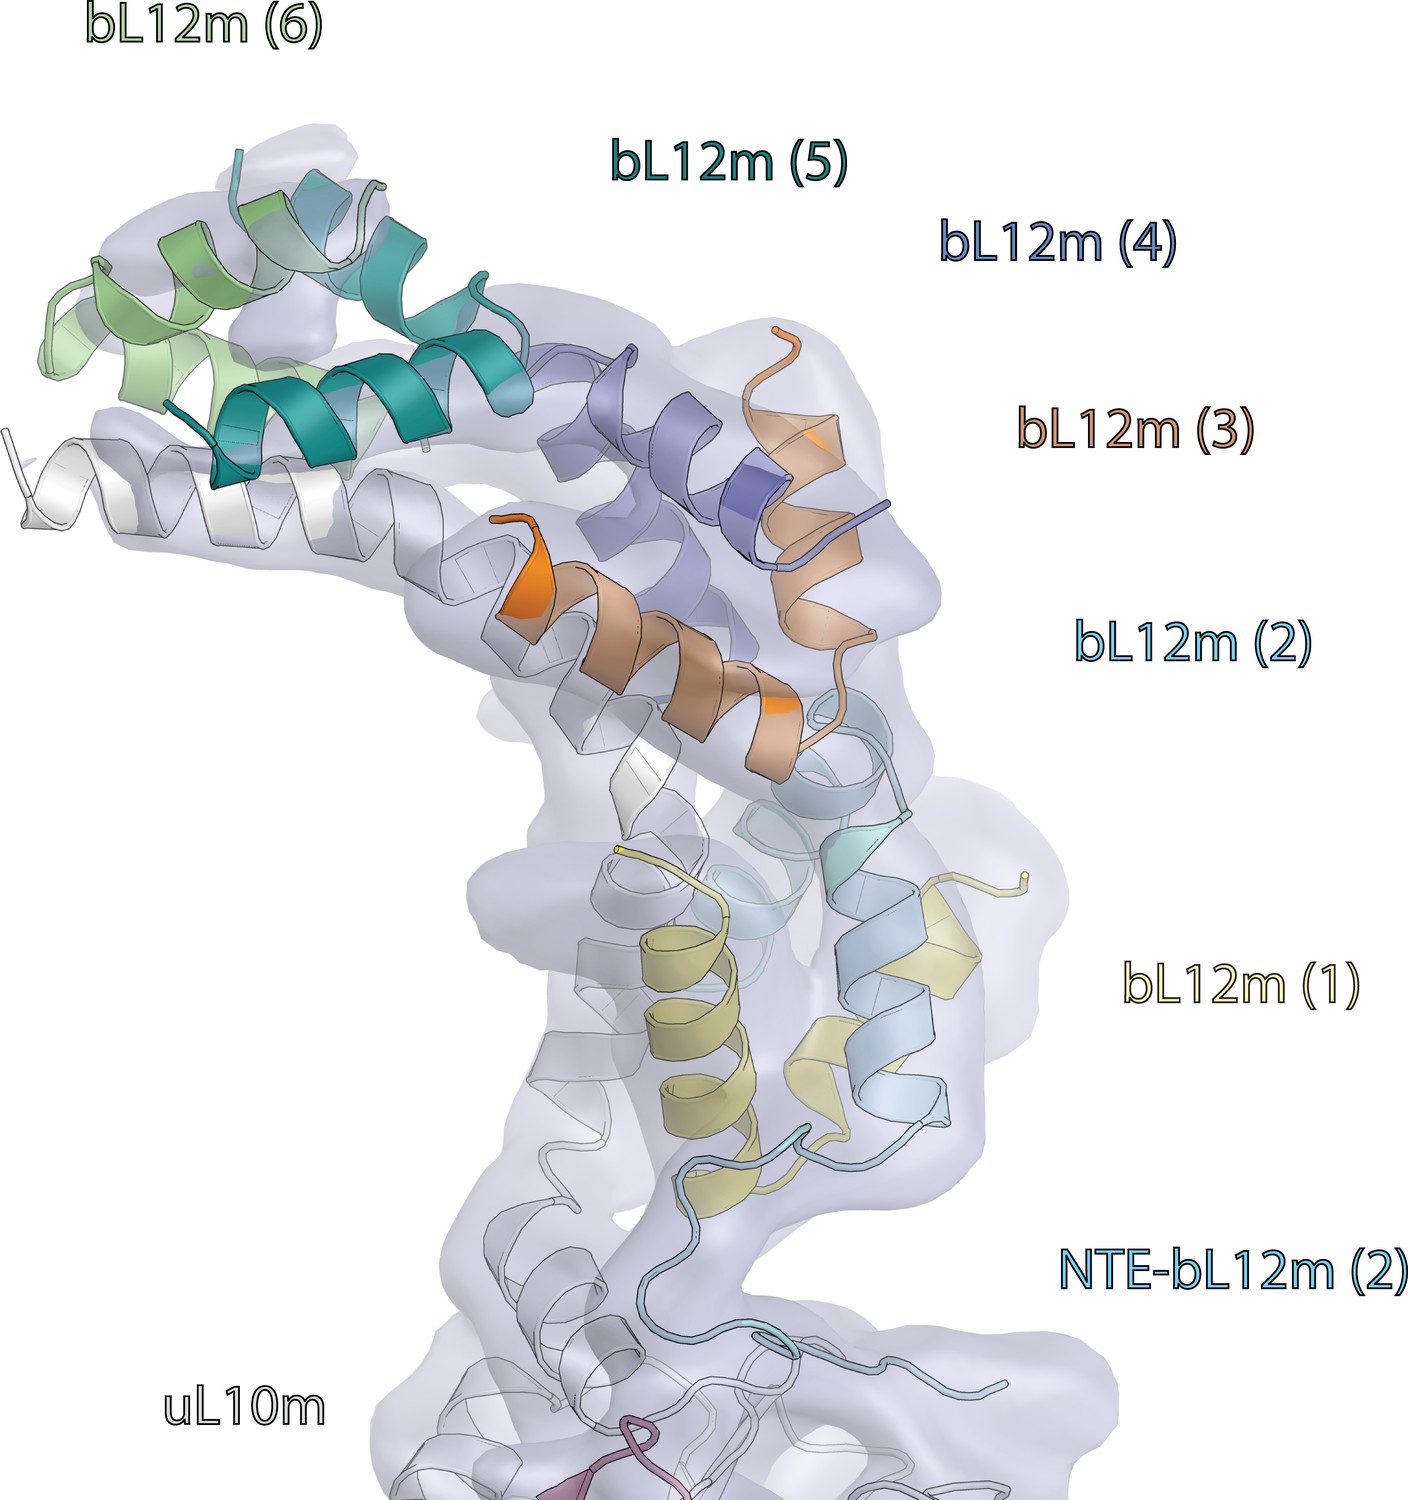
Map and model of human mitoribosome L7/L12 stalk.
Map and model of six copies of bL12m-N-terminal domains bound to uL10m C-terminal α-helix (light grey).
Figure 1—figure supplement 4
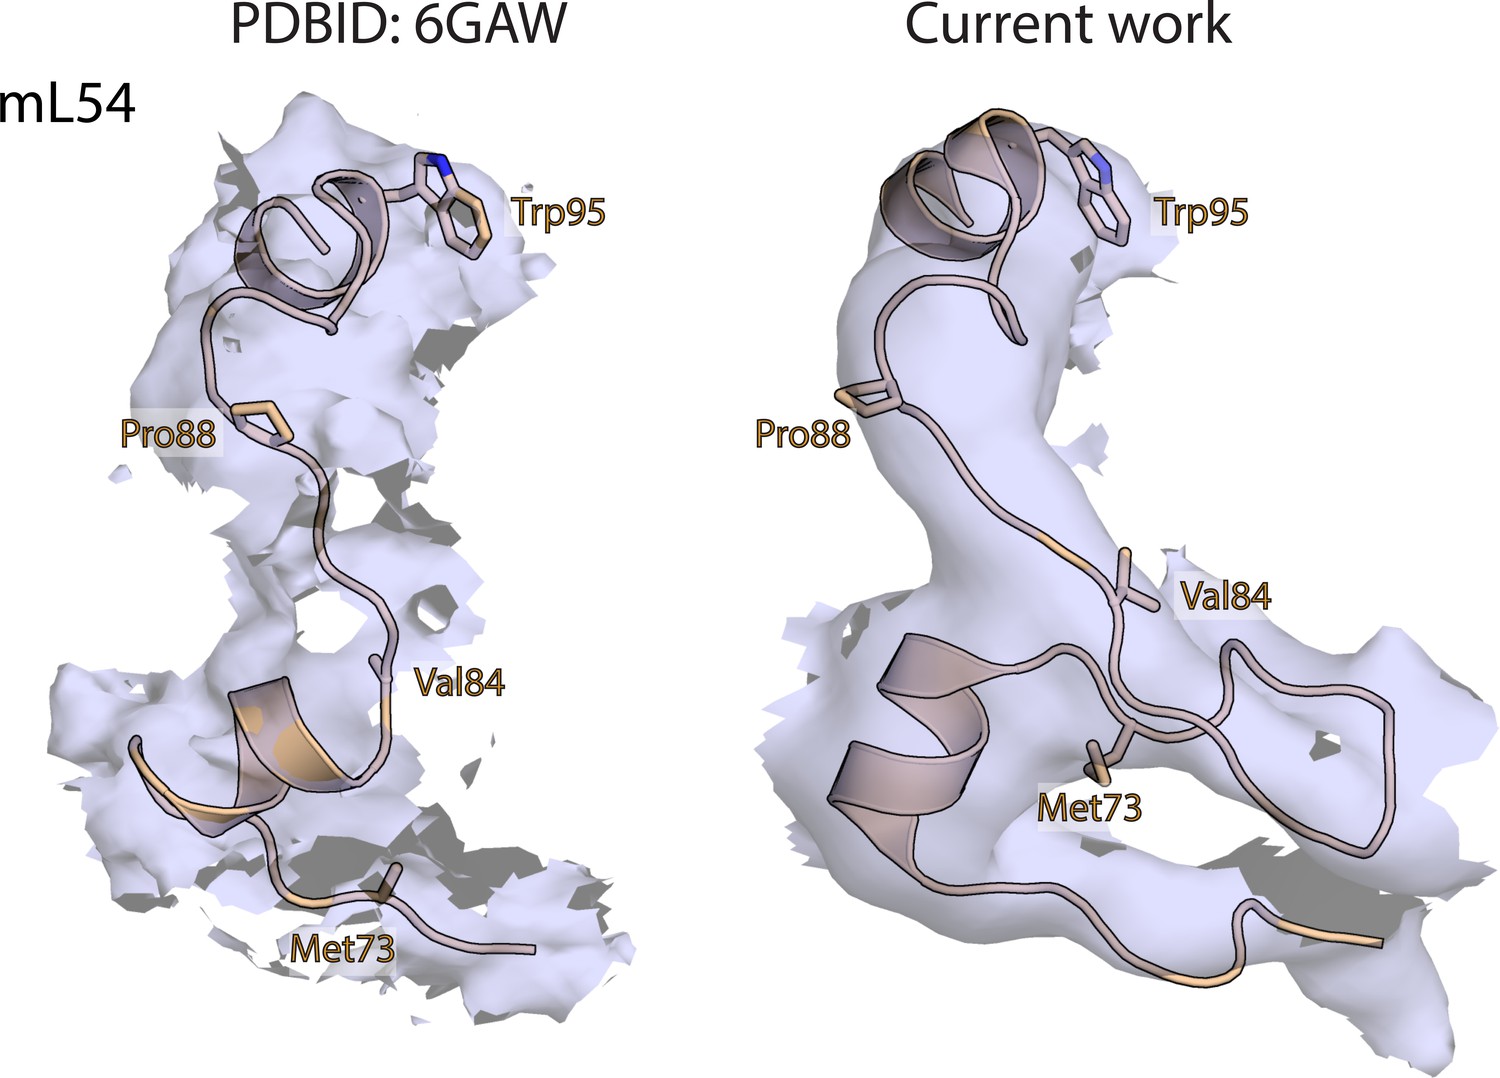
Map and model human mitoribosome mL54.
Comparison of maps and corresponding models of mL54 (wheat) in our human mitoribosome structure and porcine mitochondrial initiation complex (PDBID: 6GAW). Equivalent residues are shown in both structures for comparison.
Figure 1—figure supplement 5
Map and model human mt-RRF.
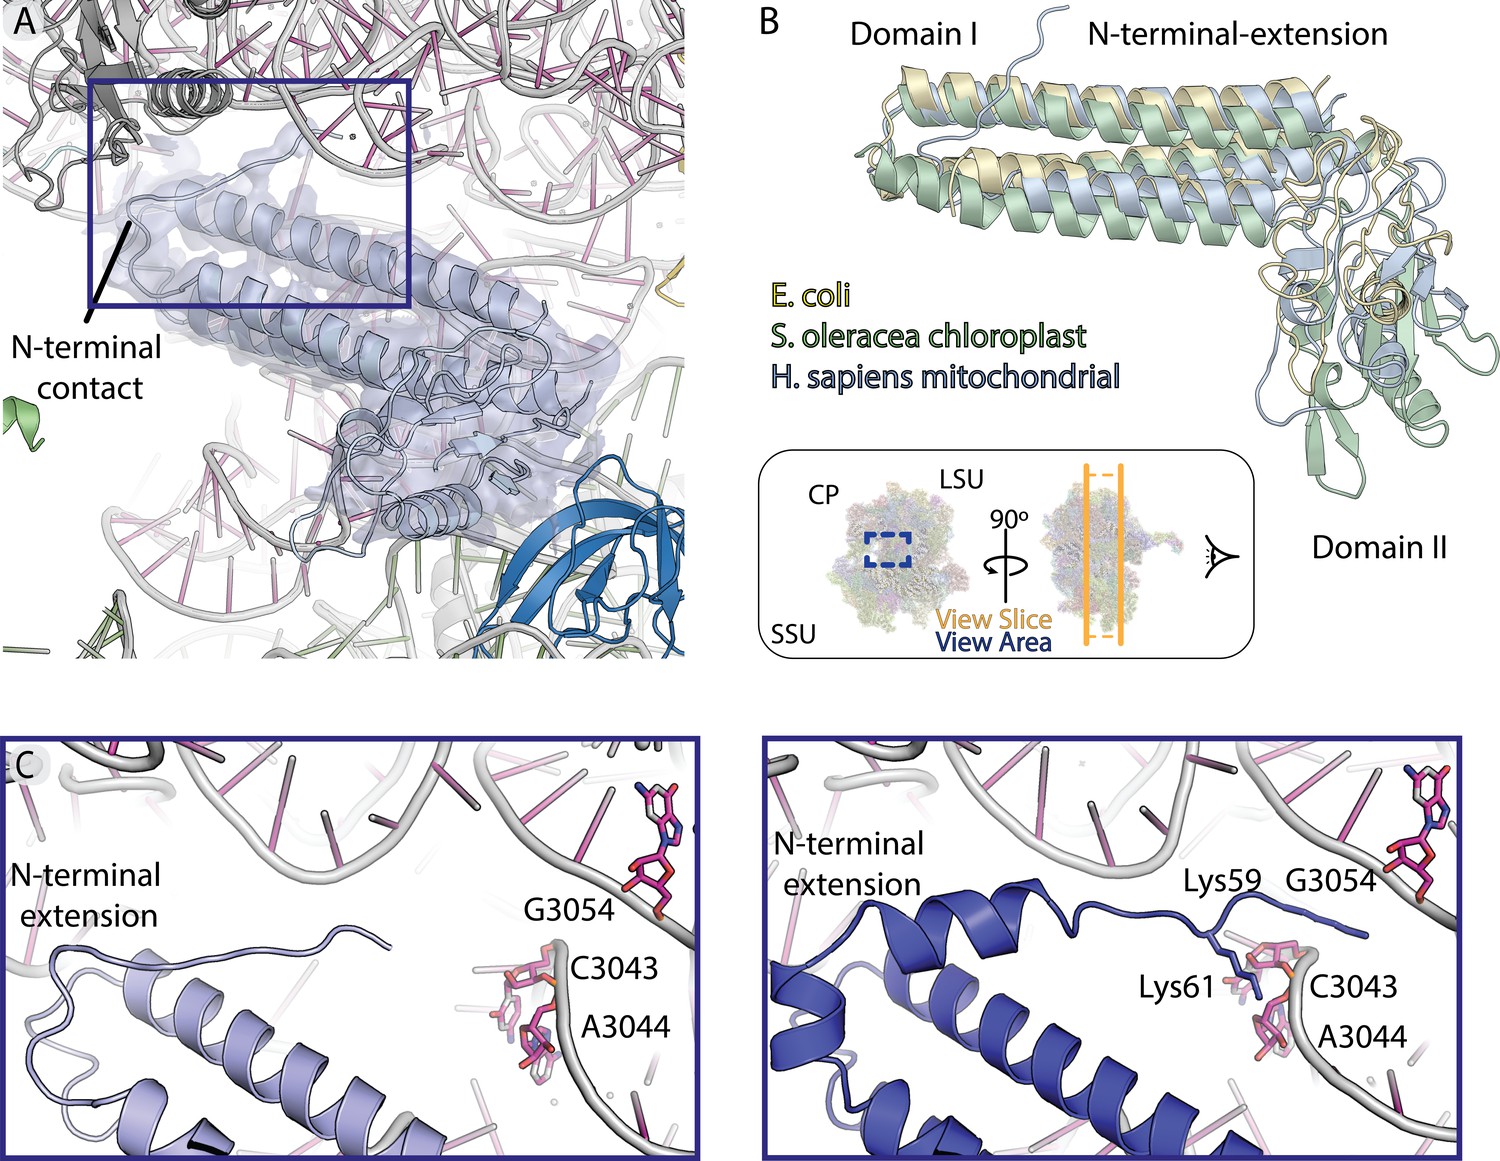
(A) Model and density of mt-RRF (purple) bound to the A- and P-sites on human mitoribosome. (B) mt-RRF modeled in this work is superposed with RRF from E. coli (PDBID: 1EK8) and S. oleracea (PDBID: 6ERI). (C) Comparison of mitochondria-specific N-terminal extension of mt-RRF modeled in our human mitoribosome-mt-RRF complex and the human mitoribosome-mt-RRF complex (blue) (PDBID: 6NU2) published previously.
Figure 2 with 2 supplements
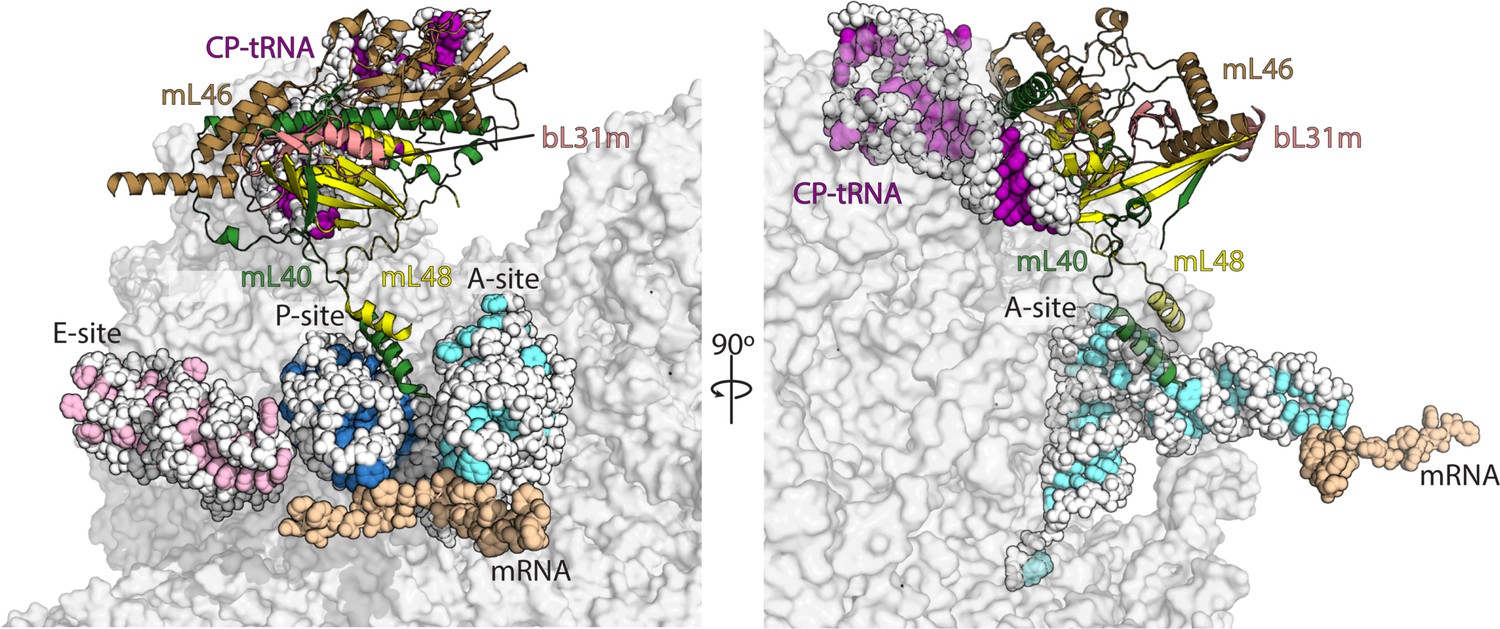
Interactions of mL40-mL48 in the tRNA binding sites and the central protuberance.
Views of the tRNA binding sites of human mitoribosome showing interactions of mL40 (green) and mL48 (yellow) with A-tRNA (white/aquamarine) and P-tRNA (white/blue). In the central protuberance, mL40 and mL48 interact with mL46 (brown), bL31m (salmon) and CP-tRNA (white/pink). In the right panel, P- and E-tRNA are removed for clarity.
Figure 2—figure supplement 1
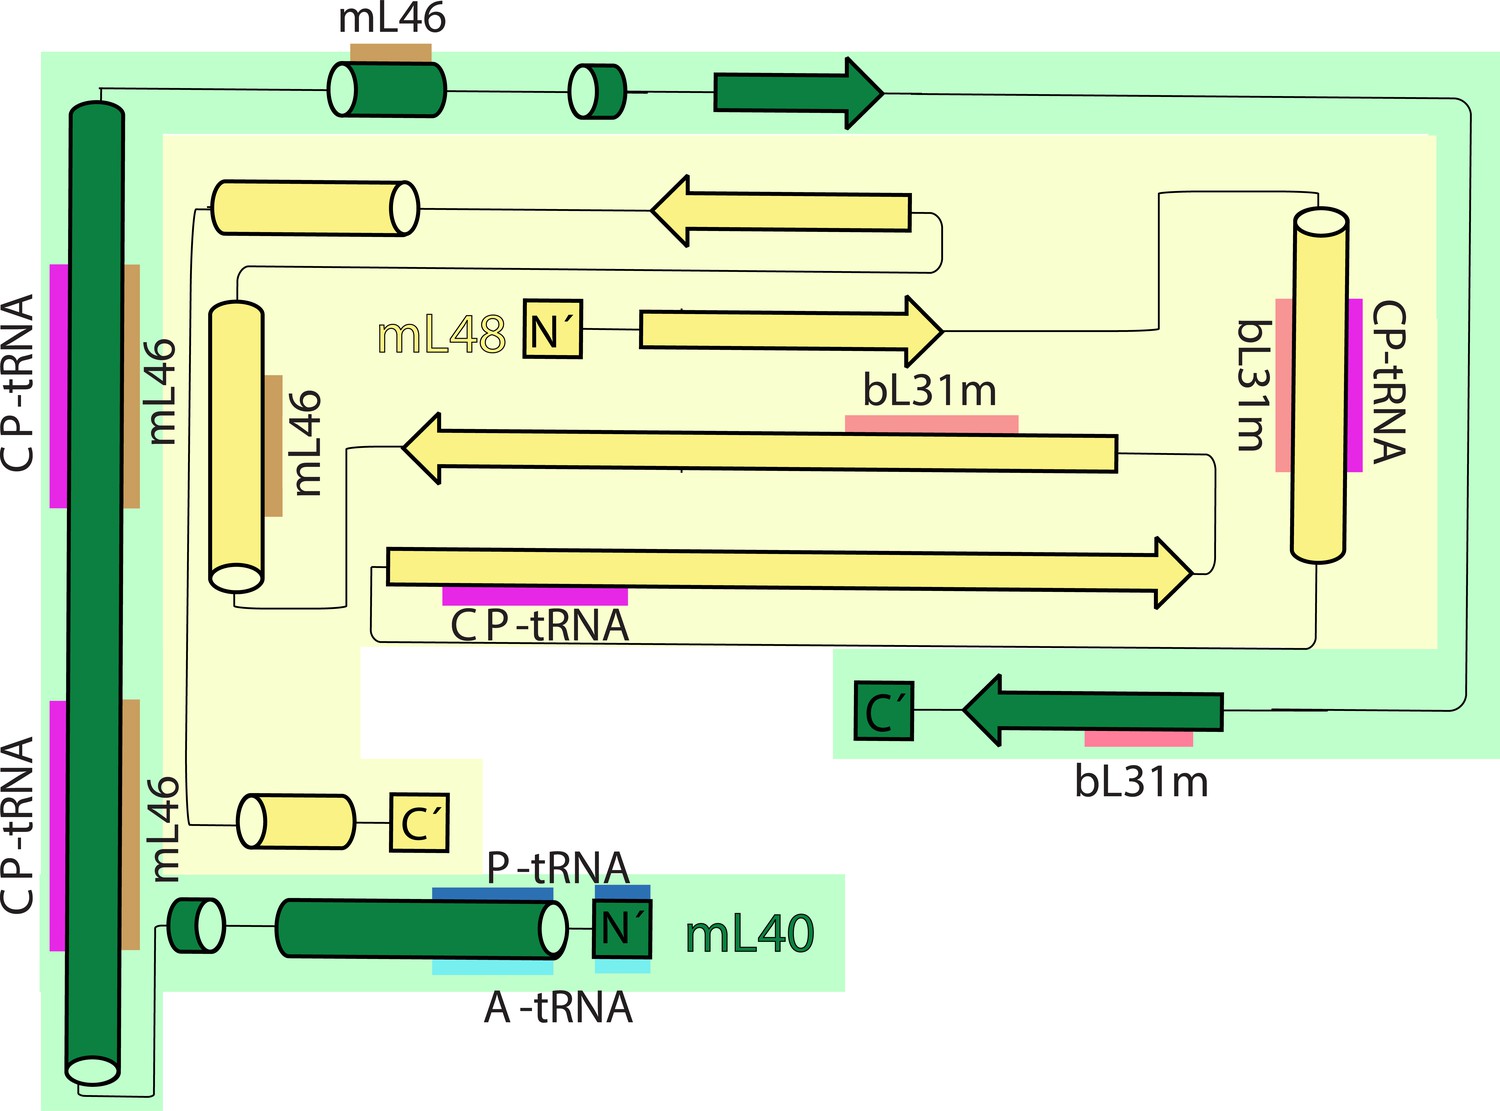
Topology and interactions of mL40 and mL48 in the central protuberance and with tRNAs.
Topology diagrams for the structural domains of mL40 (green) and mL48 (yellow). β strands from mL40, mL48 and bL31m form β-sheet in the central protuberance. CP-tRNA is involved in extensive interactions with mL40 and mL48. N-terminus of mL40 extends to the A- and P-tRNA binding site.
Figure 2—figure supplement 2
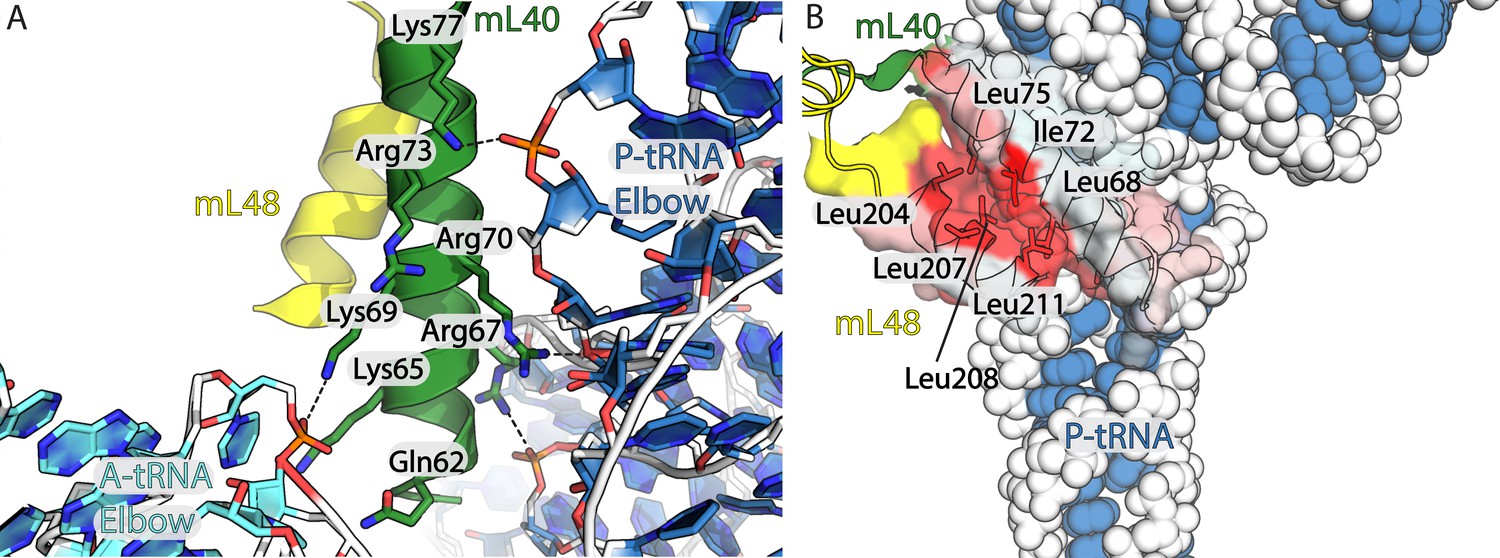
Hydrophobic interface between mL40 and mL48 involved in tRNA interactions.
(A) Interactions of mL40 N-terminal helix (green) with A-tRNA (cyan) and P- tRNA (blue). (B) Hydrophobic interface between mL40 N-terminal helix and mL48 C-terminal helix (yellow) displayed in transparent surface colored by hydrophobicity, red indicting most hydrophobic.
Figure 3 with 6 supplements
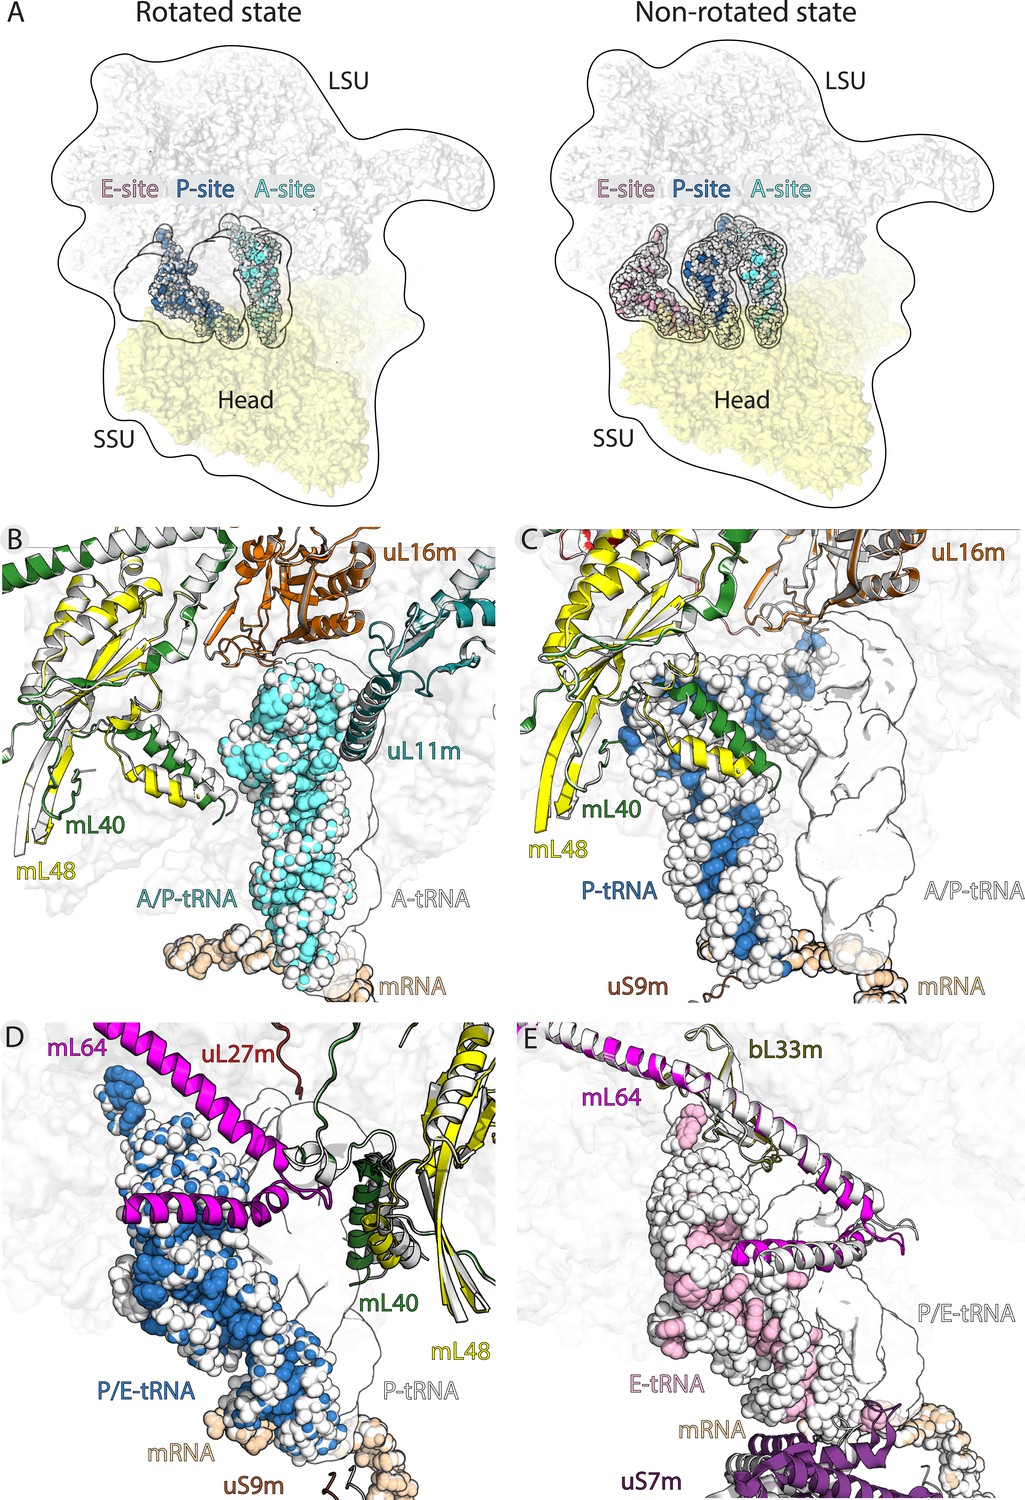
Translocation of mt-tRNA and involvement of mitoribosomal proteins.
(A) Overview of tRNAs bound to the A-, P- and E-site in the rotated and non-rotated mitoribosome. The models were superimposed using the mt-LSU as a reference The classical tRNA binding sites are outlined. (B) Comparison between mt-tRNA in the A-site (outlined) and A/P state (light blue/white). (C) Comparison between mt-tRNA in the A/P state (outlined) and P-site (blue/white). (D) Comparison between mt-tRNA in the P-site (outlined) and P/E state (blue/white). (E) Comparison between mt-tRNA in the P/E state (outlined) and E-site (pink/white).
Figure 3—figure supplement 1
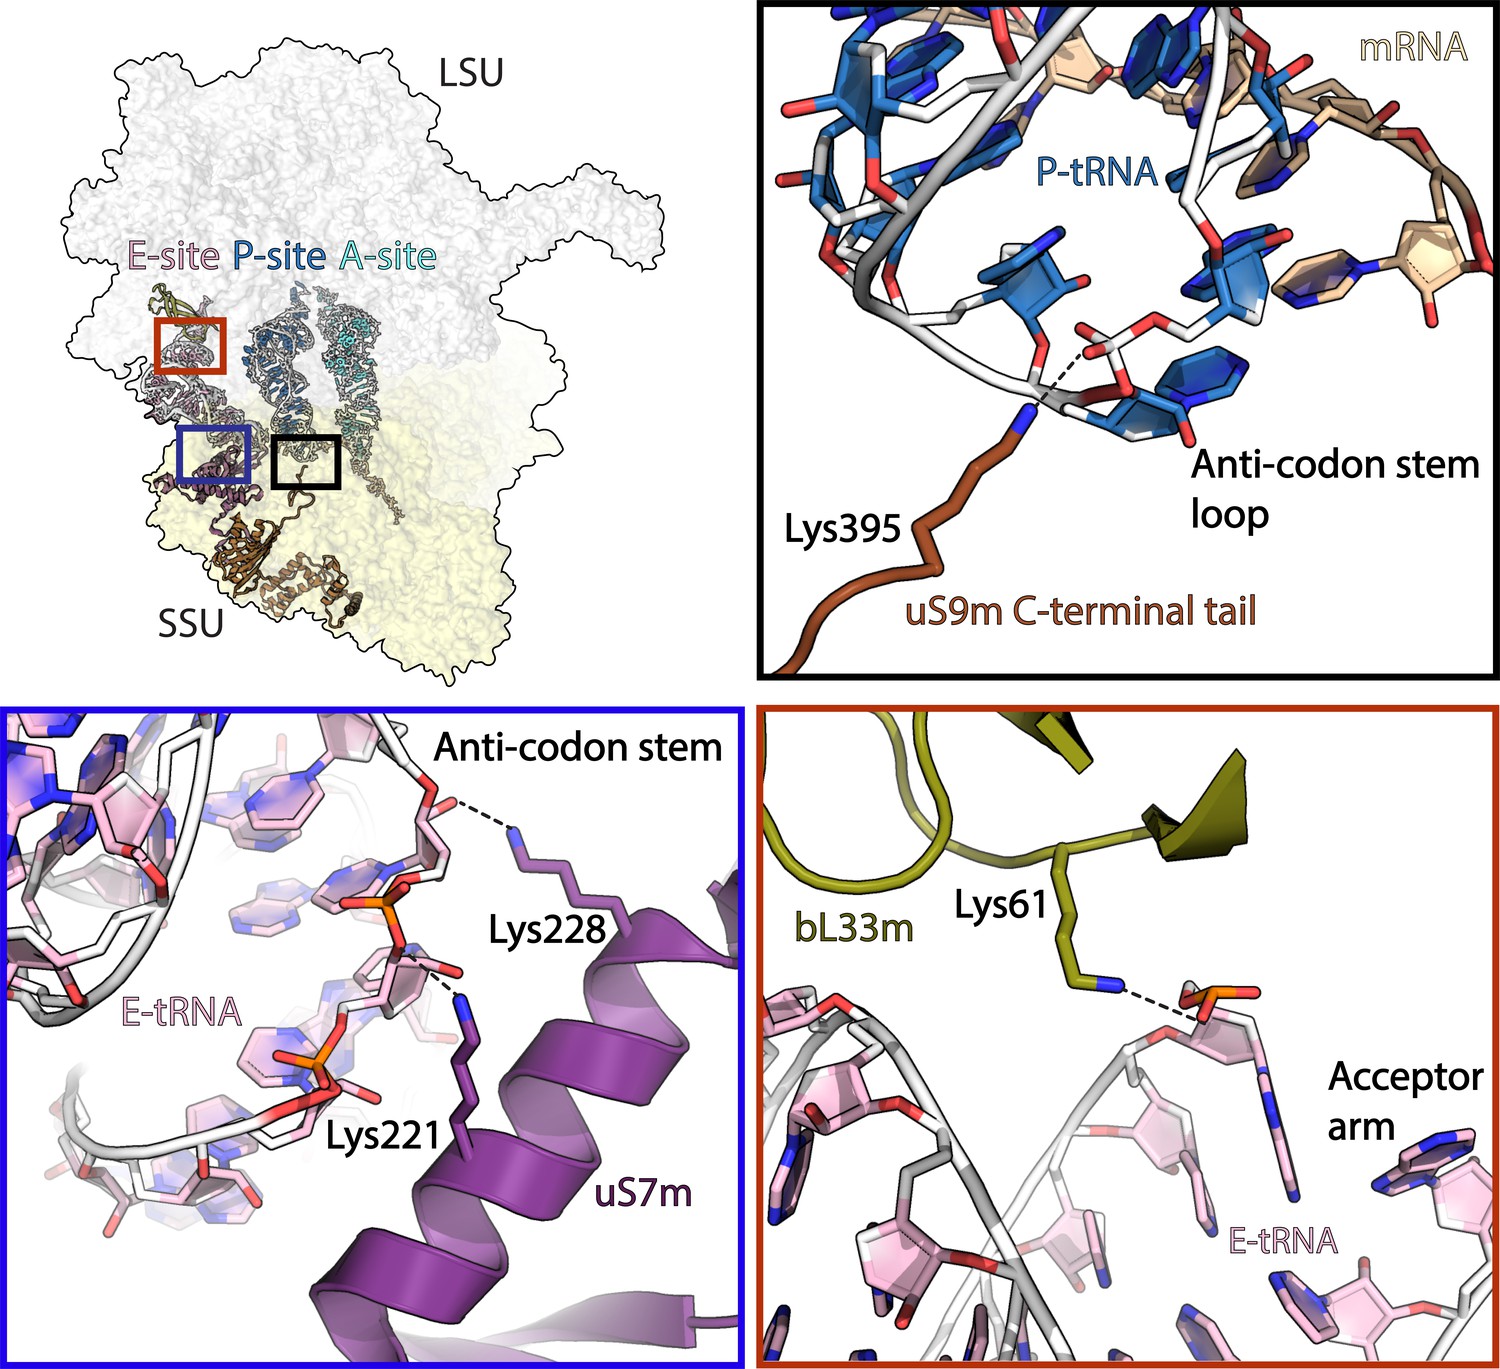
Interactions of mitoribosomal proteins with tRNAs.
uS9m C-terminal tail (brown) interacts with P-site tRNA (blue/white) anticodon stem loop. uS7m (violet) approaches the major groove of E-site tRNA (pink/white) anticodon stem. bL33m (olive) interacts with E-site tRNA acceptor arm. Dashed line represents distances below 4 Å.
Figure 3—figure supplement 2
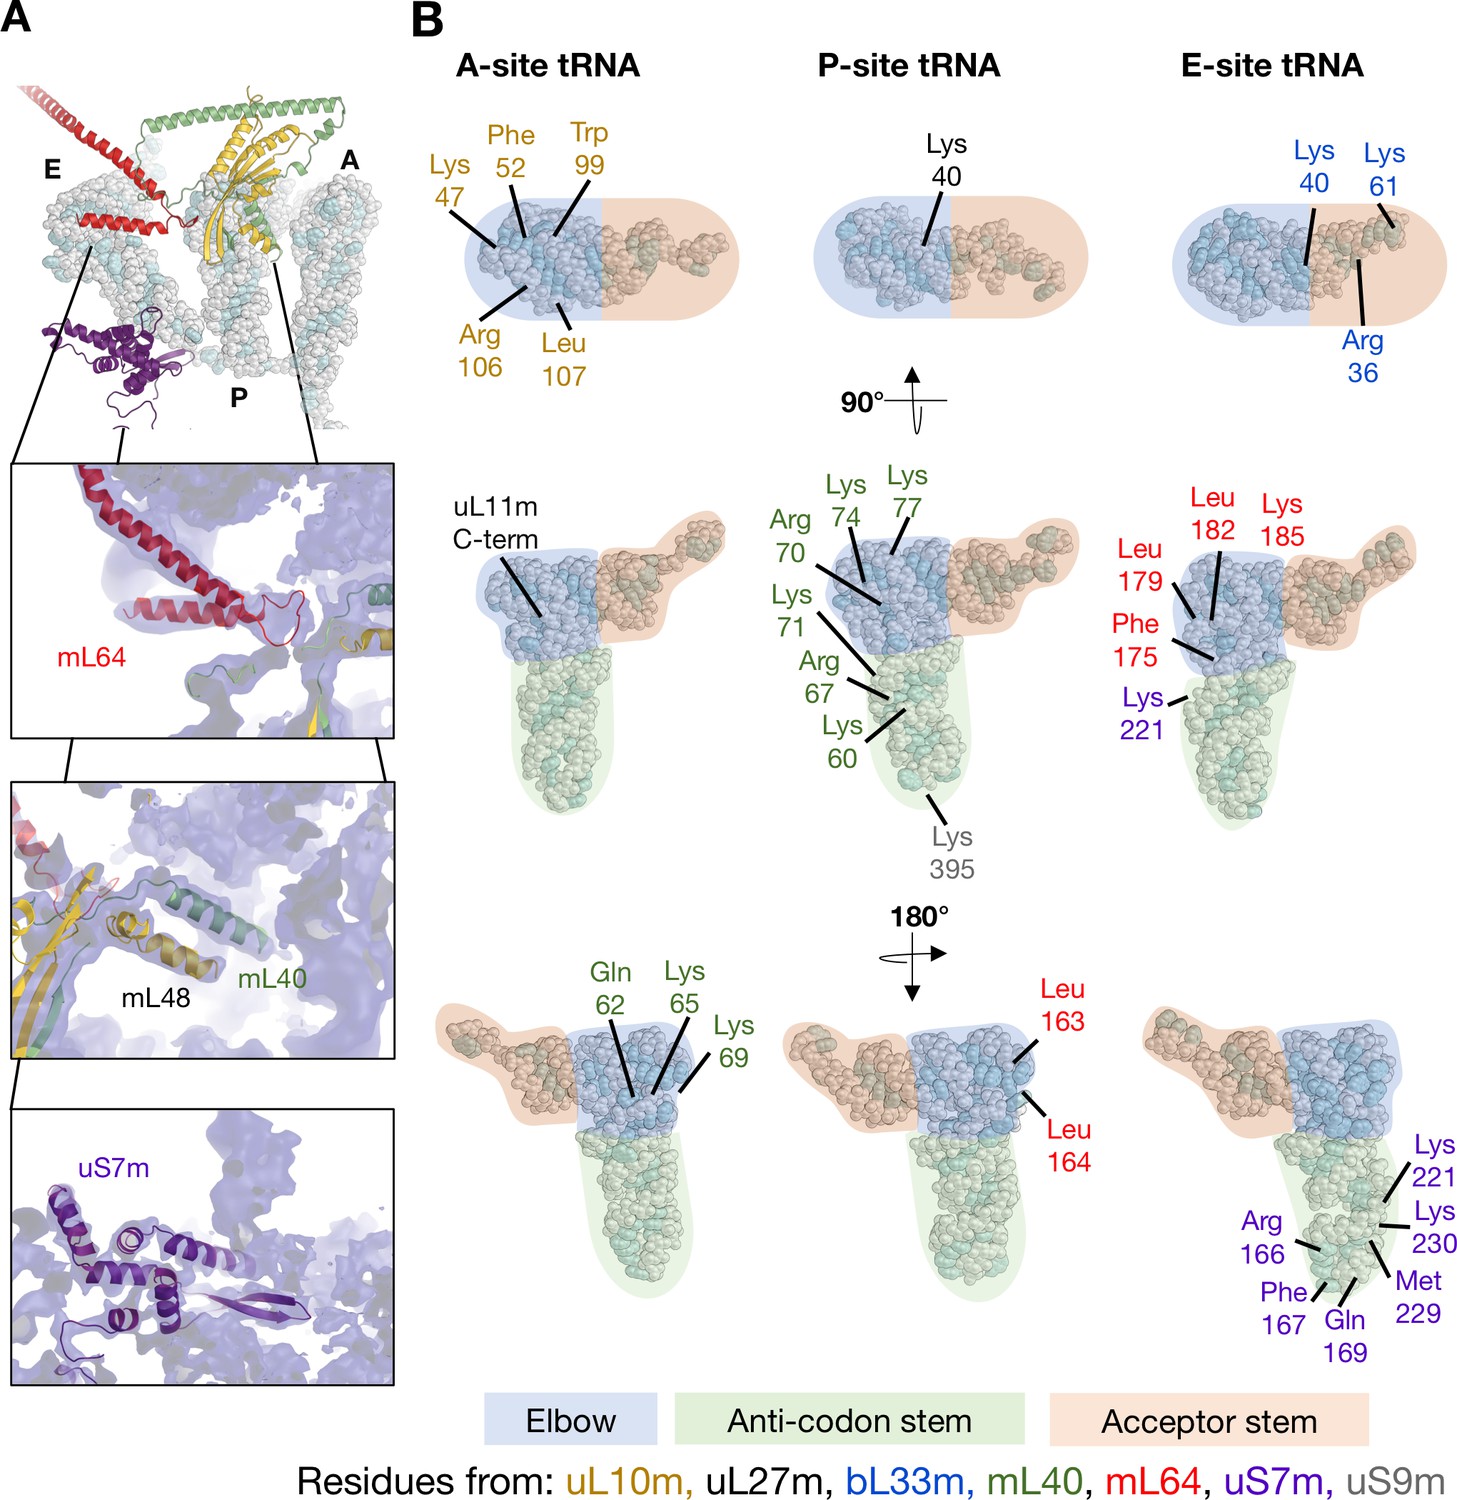
Interactions between mitoribosomal proteins and tRNA.
(A) Cryo-EM density for the APE occupied state, focusing on proteinacious elements involved tRNA interactions. Front top: mL64, P-site fingers (mL40 and mL48), and uS7m. (B) Schematic representation of proteins involved in tRNA interactions. As the structure obtained in this study represents an average of multiple tRNAs, the sections are represented as areas of elbow (blue), anti-codon stem (green), and acceptor stem (orange). Residues numbers and identities are given with their color representing their chain assignment.
Figure 3—figure supplement 3
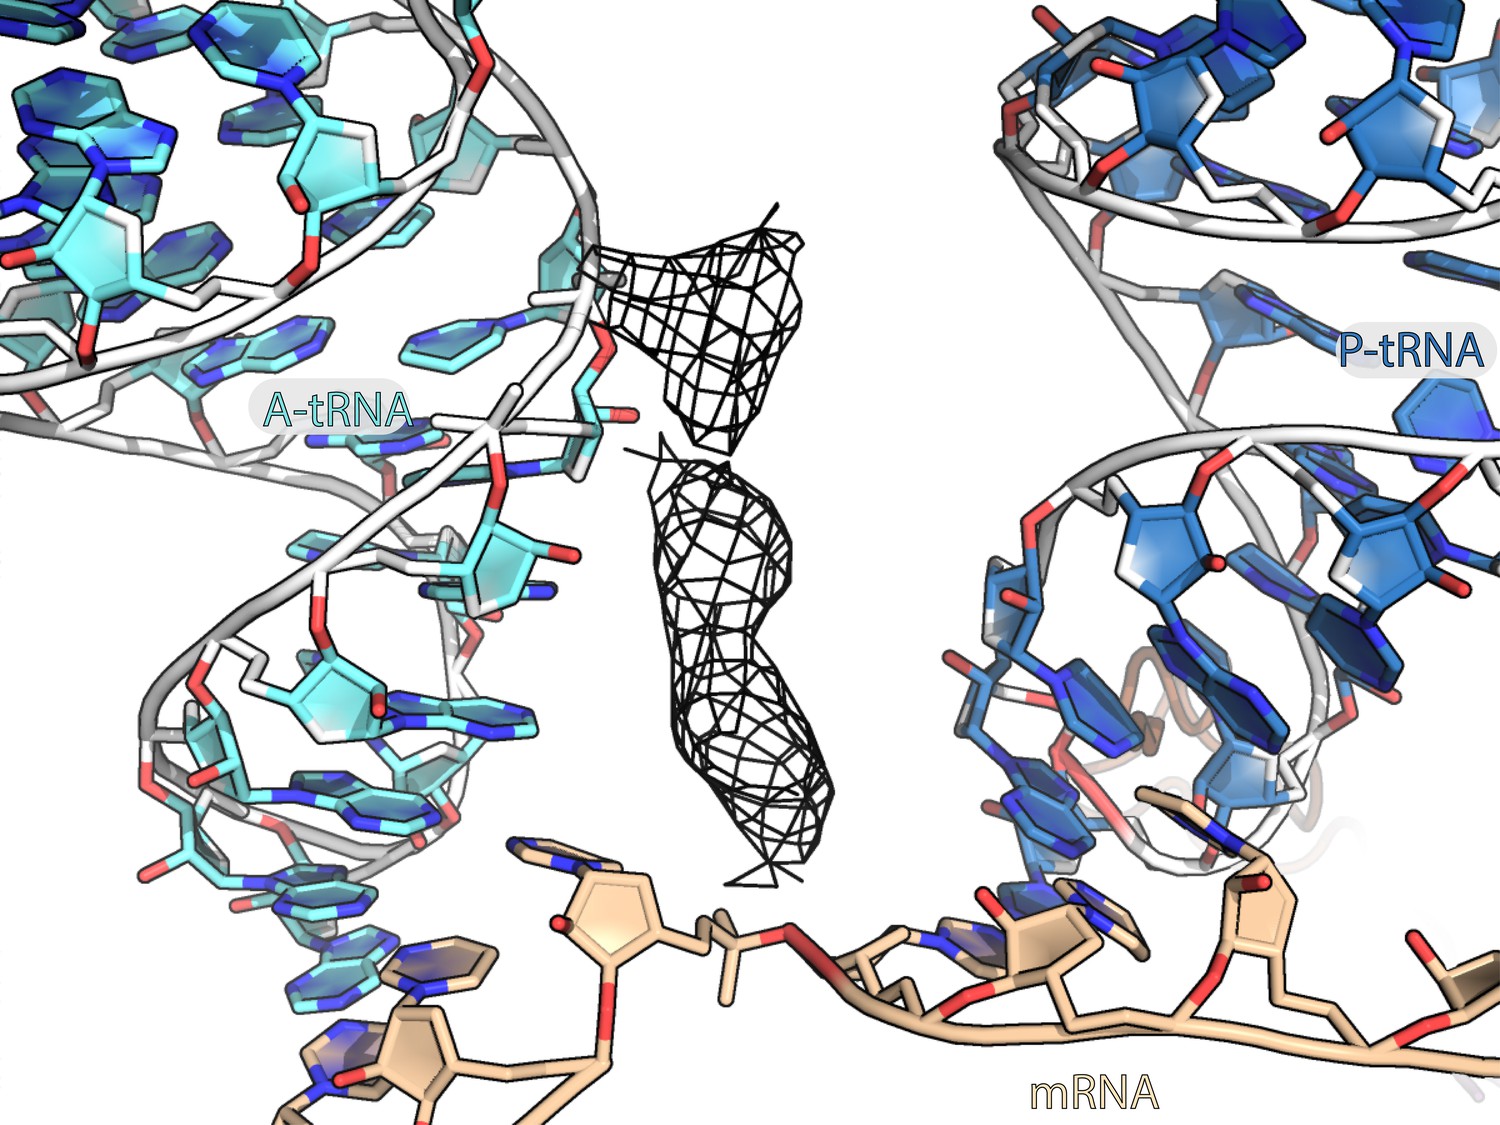
Unmodeled density between A-site and P-site tRNAs.
Unmodeled density bound between anticodon stem loops of A-tRNA and P-tRNA is represented as a black mesh.
Figure 3—figure supplement 4
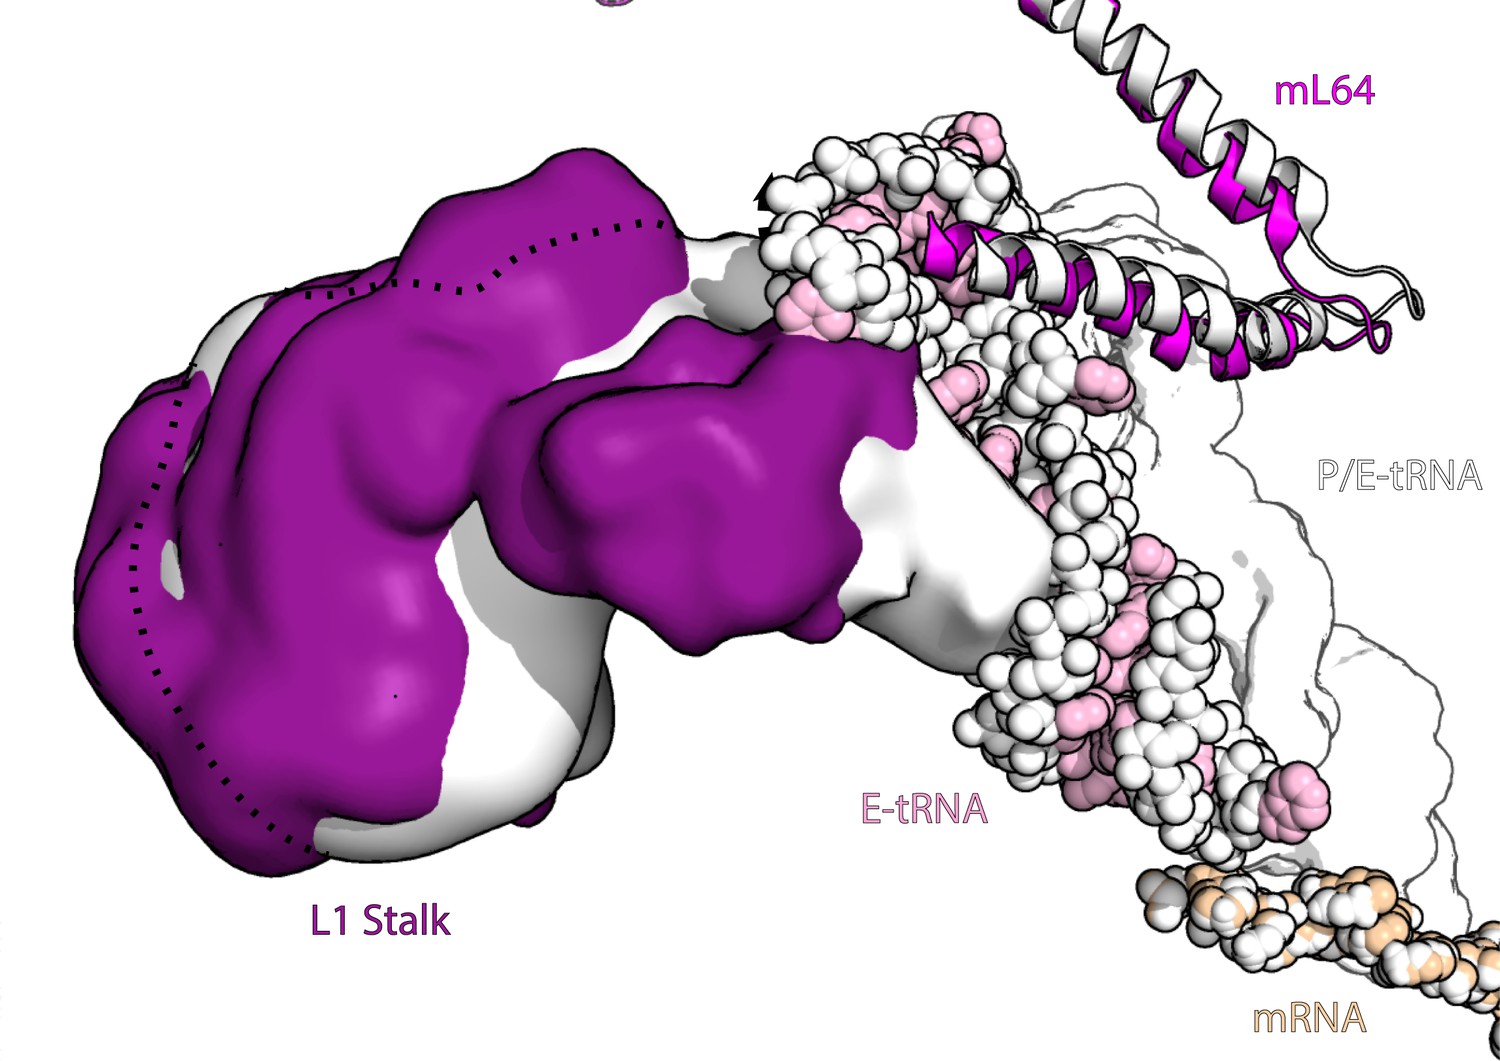
L1 stalk movement in ratcheted and non-ratcheted states.
The figure shows density of L1 stalk in rotated (white) and non-rotated state (purple) along with E-tRNA (pink) and P/E-tRNA (white) and mL64 (magenta), superposed on the large subunit for comparison. All components from the rotated state are shown in white.
Figure 3—figure supplement 5
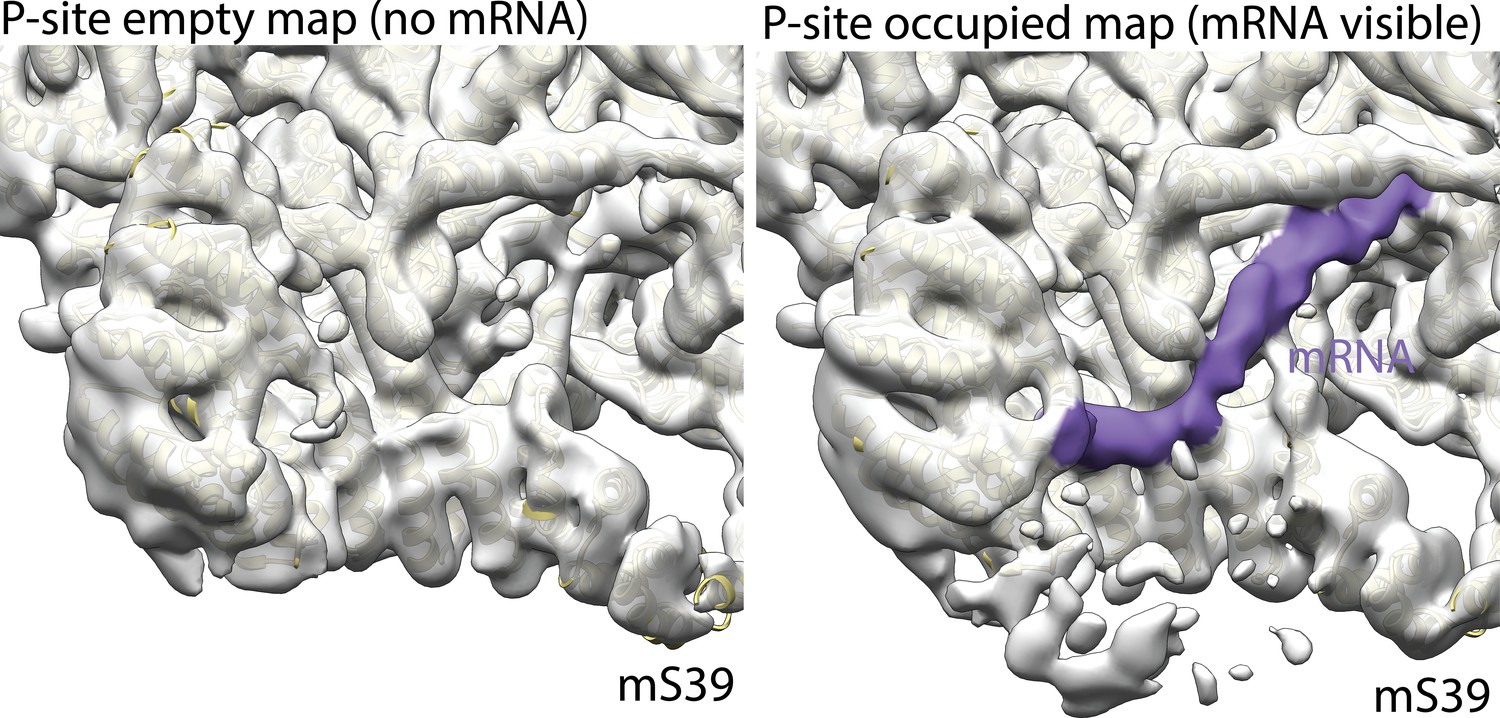
Density of mRNA in P-site tRNA bound mitoribosome.
A continuous density of mRNA (purple) is observed in P-site tRNA bound classes (right) but is absent in classes lacking P-site tRNA (left).
Figure 3—figure supplement 6
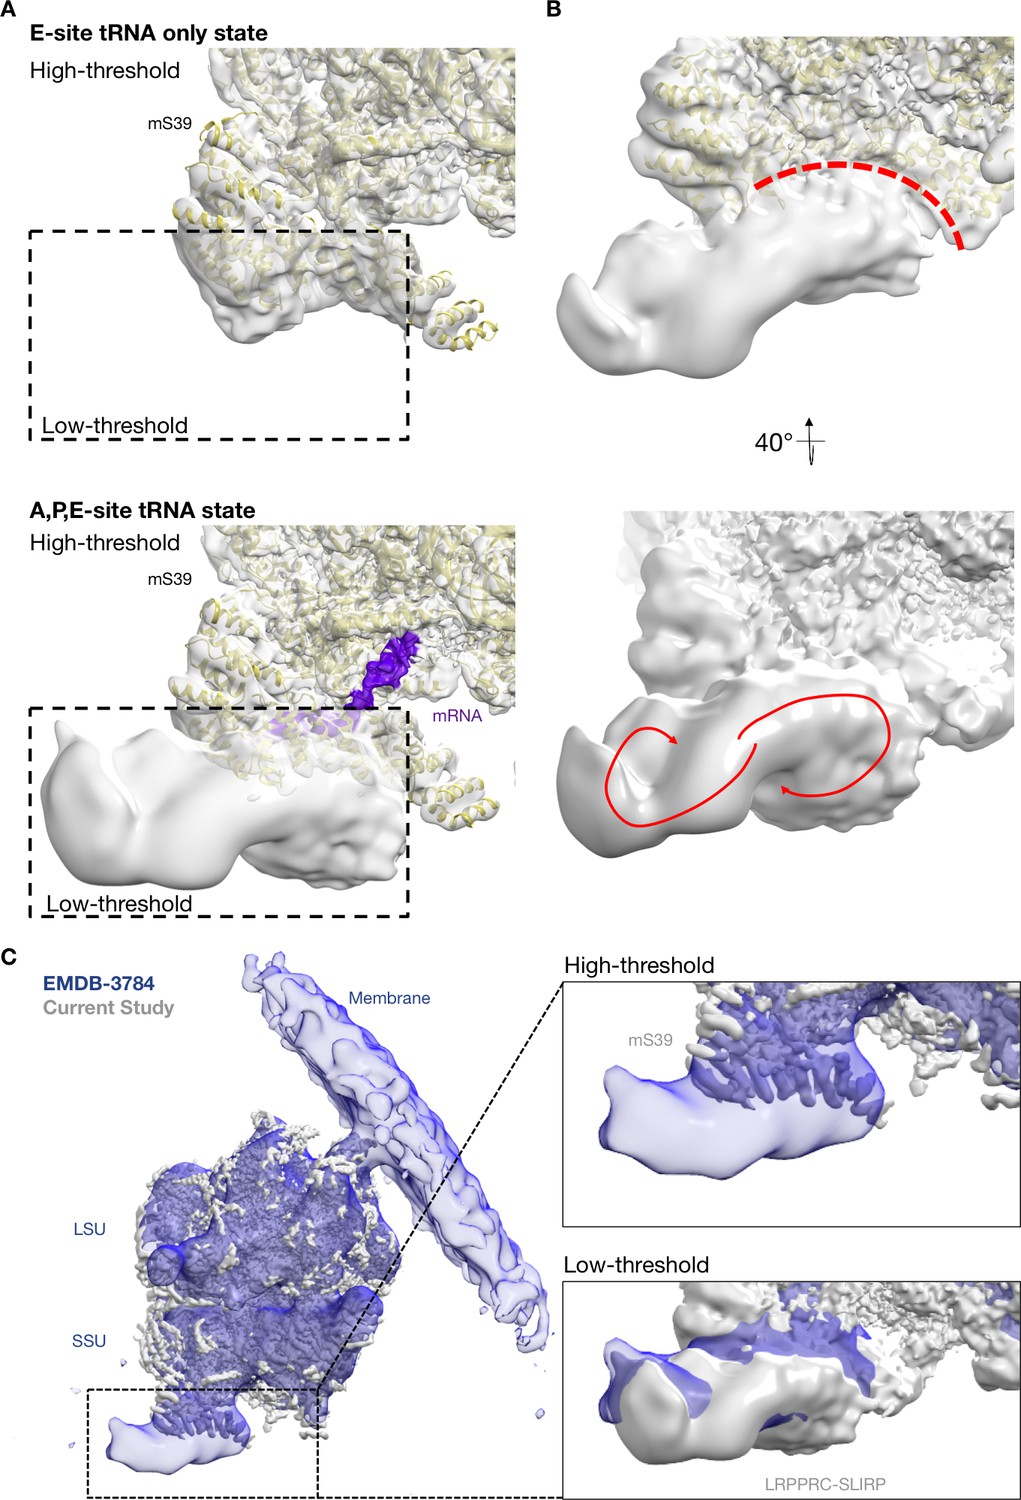
Density of LRPPRC-SLIRP complex in mRNA-bound mitoribosome.
(A) Large density adjacent to mS39 corresponding to LRPPRC-SLIRP complex is observed in P-site tRNA bound classes (shown state: APE-site tRNA bottom panel). No such density is observed in classes lacking P-site tRNA (shown state: E-site tRNA, top panel). (B) Top panel shows the superhelical spiral shell of mS39 that interacts with the density. Bottom panel the density displays a two-parted volute architecture that is characteristic of PPR proteins. (C) Comparisons of the density from our study and the previously published in situ cryo-tomography reconstructions (blue).
Figure 4
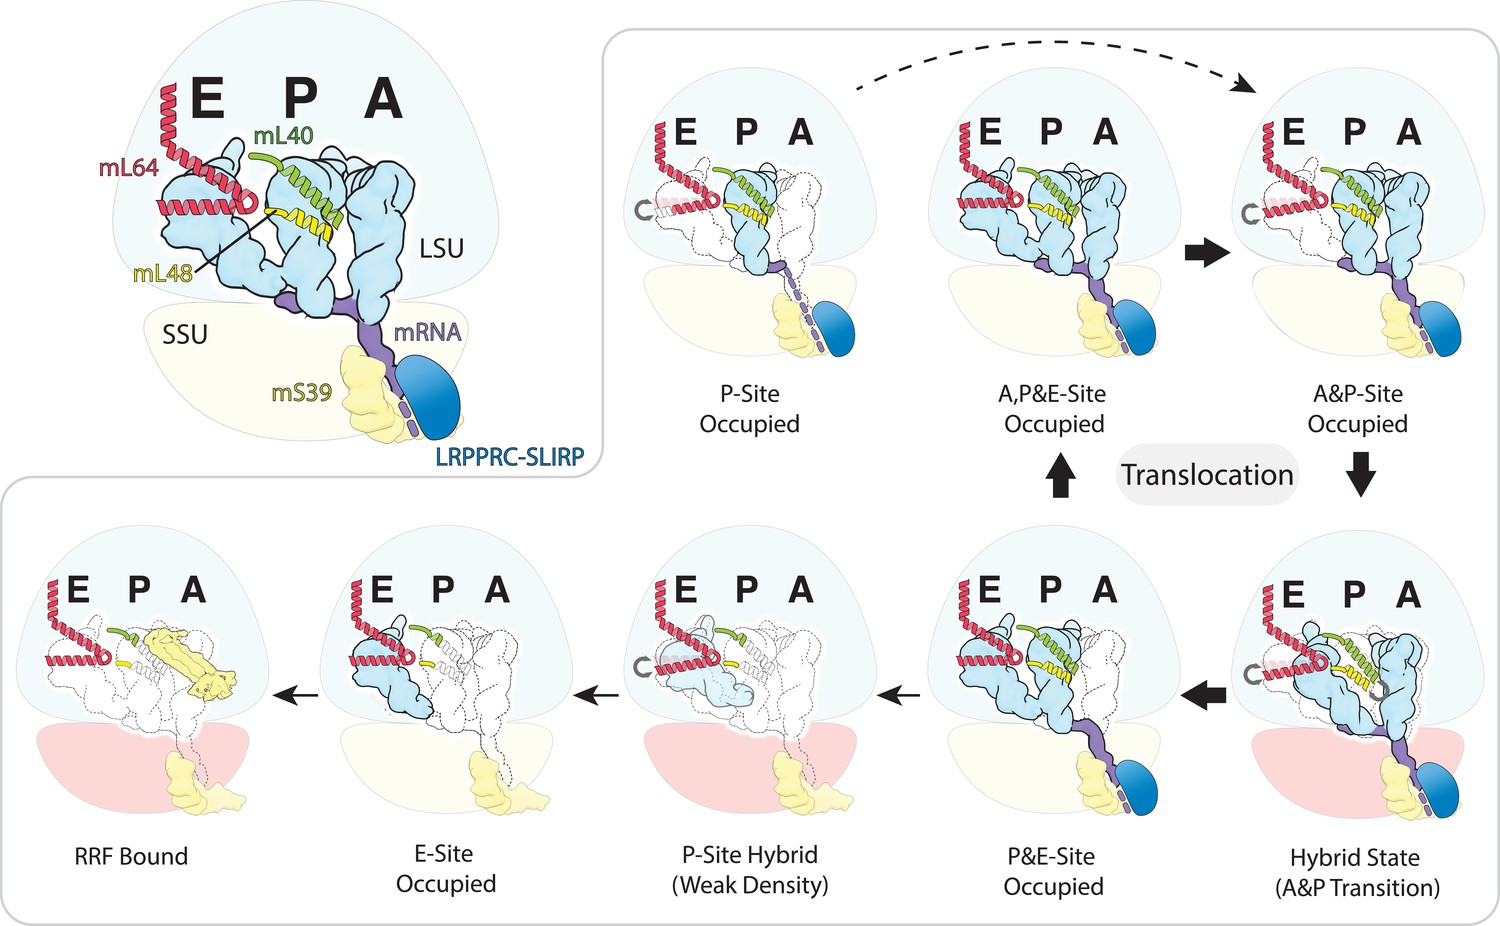
Schematic of the mt-tRNA moving through the mitoribosome based on the solved structures.
Top left, mt-tRNAs bound to A-, P- and E-site and coordinated by mL40 (green) and mL64 (red), mRNA (purple) and LRPPRC-SLIRP module (blue) bound to mS39 (yellow). Seven structures with bound tRNA are arranged in the order representing tRNA translocation through the translation cycle. The conformational changes of mL40 and mL64 are indicated.
Videos
Video 1
Movie highlighting the protein elements that differ across tRNA states observed in this data.
Additional files
-
Supplementary file 1
Cryo-EM data collection parameters.
- https://cdn.elifesciences.org/articles/58362/elife-58362-supp1-v1.docx
-
Supplementary file 2
The list of proteins identified by mass spectrometry with their accession numbers and molecular weight.
The proteins are listed according to the weighted spectra from high to low that was quantified using Scaffold_4.7.5. The pyruvate dehydrogenase complex components and non-mitoribosomal components are shown in italic; LRPPRC and SLIRP are highlighted in yellow.
- https://cdn.elifesciences.org/articles/58362/elife-58362-supp2-v1.docx
-
Supplementary file 3
Model refinement and validation statistics.
* FSC corrected for the effect of the mask according to 0.143-cutoff criterion ** FSC (masked) according to 0.5-cutoff criterion
- https://cdn.elifesciences.org/articles/58362/elife-58362-supp3-v1.docx
-
Supplementary file 4
The amino acid sequence for LRPPRC and SLIRP proteins is displayed.
The peptides identified by mass spectrometry that meet 40% minimum threshold are highlighted in yellow. Above the sequence, the protein accession number, molecular weight and protein name are shown together with the number of unique peptides, spectra and % coverage.
- https://cdn.elifesciences.org/articles/58362/elife-58362-supp4-v1.docx
-
Transparent reporting form
- https://cdn.elifesciences.org/articles/58362/elife-58362-transrepform-v1.pdf
Download links
A two-part list of links to download the article, or parts of the article, in various formats.
Downloads (link to download the article as PDF)
Open citations (links to open the citations from this article in various online reference manager services)
Cite this article (links to download the citations from this article in formats compatible with various reference manager tools)
Structural basis of mitochondrial translation
eLife 9:e58362.
https://doi.org/10.7554/eLife.58362


