Large domain movements through the lipid bilayer mediate substrate release and inhibition of glutamate transporters
- Department of Physiology and Biophysics, Weill Cornell Medicine, United States
- Howard Hughes Medical Institute, United States
Figures
Figure 1 with 4 supplements
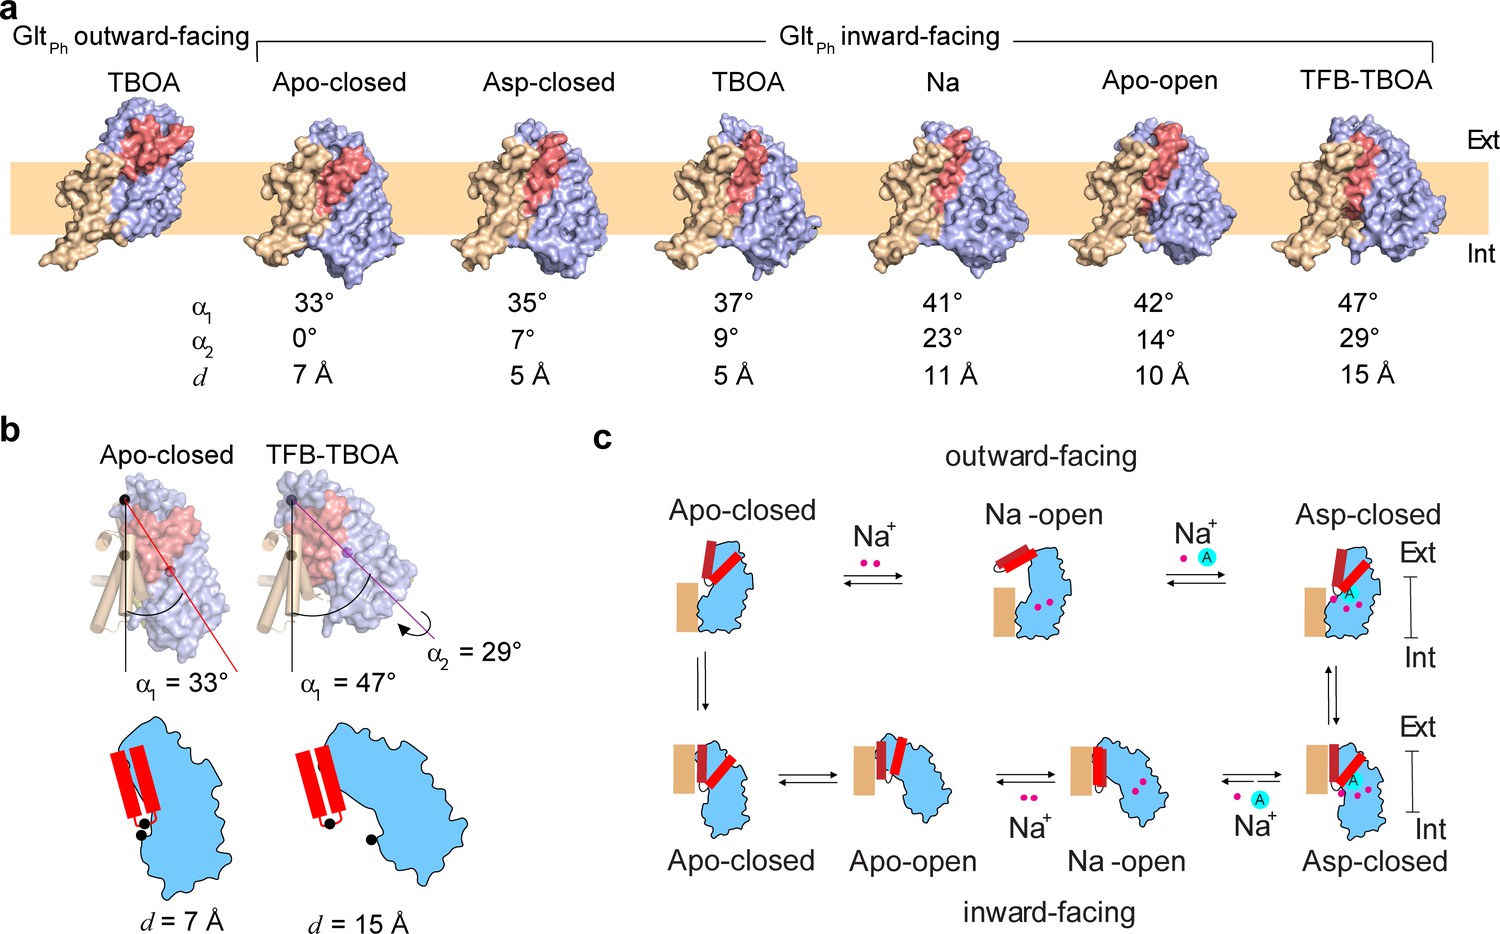
Gating mechanism in the IFS.
(a) Structures of GltPh protomers are shown in surface representation viewed in the membrane plane. The scaffold domain is colored wheat, the transport domain blue and HP2 red. The PDB accession code for GltPhIFS - Apo-closed is 4P19 (Verdon et al., 2014). An approximate position of the bilayer is shown as a pale orange rectangle. (b) Angles between the membrane normal drawn through the center of the scaffold domain and the central axis of the transport domains (α1) are shown for GltPhIFS -Apo-closed and GltPhIFS -TFB-TBOA. Also shown is the rotation angle, α2 of the transport domain in Glt PhIFS -TFB-TBOA relative to GltPh IFS - Apo-closed. Distances between the cα atoms (black circles) of residues R276 and P356 (d) are shown for the same structures under the schematic depiction of the transport domains. Corresponding angles and distances are listed under all structures in panel (a). (c) A schematic representation of the gating mechanism on the extracellular (top) and intracellular (bottom) sides of the membrane.
Figure 1—figure supplement 1
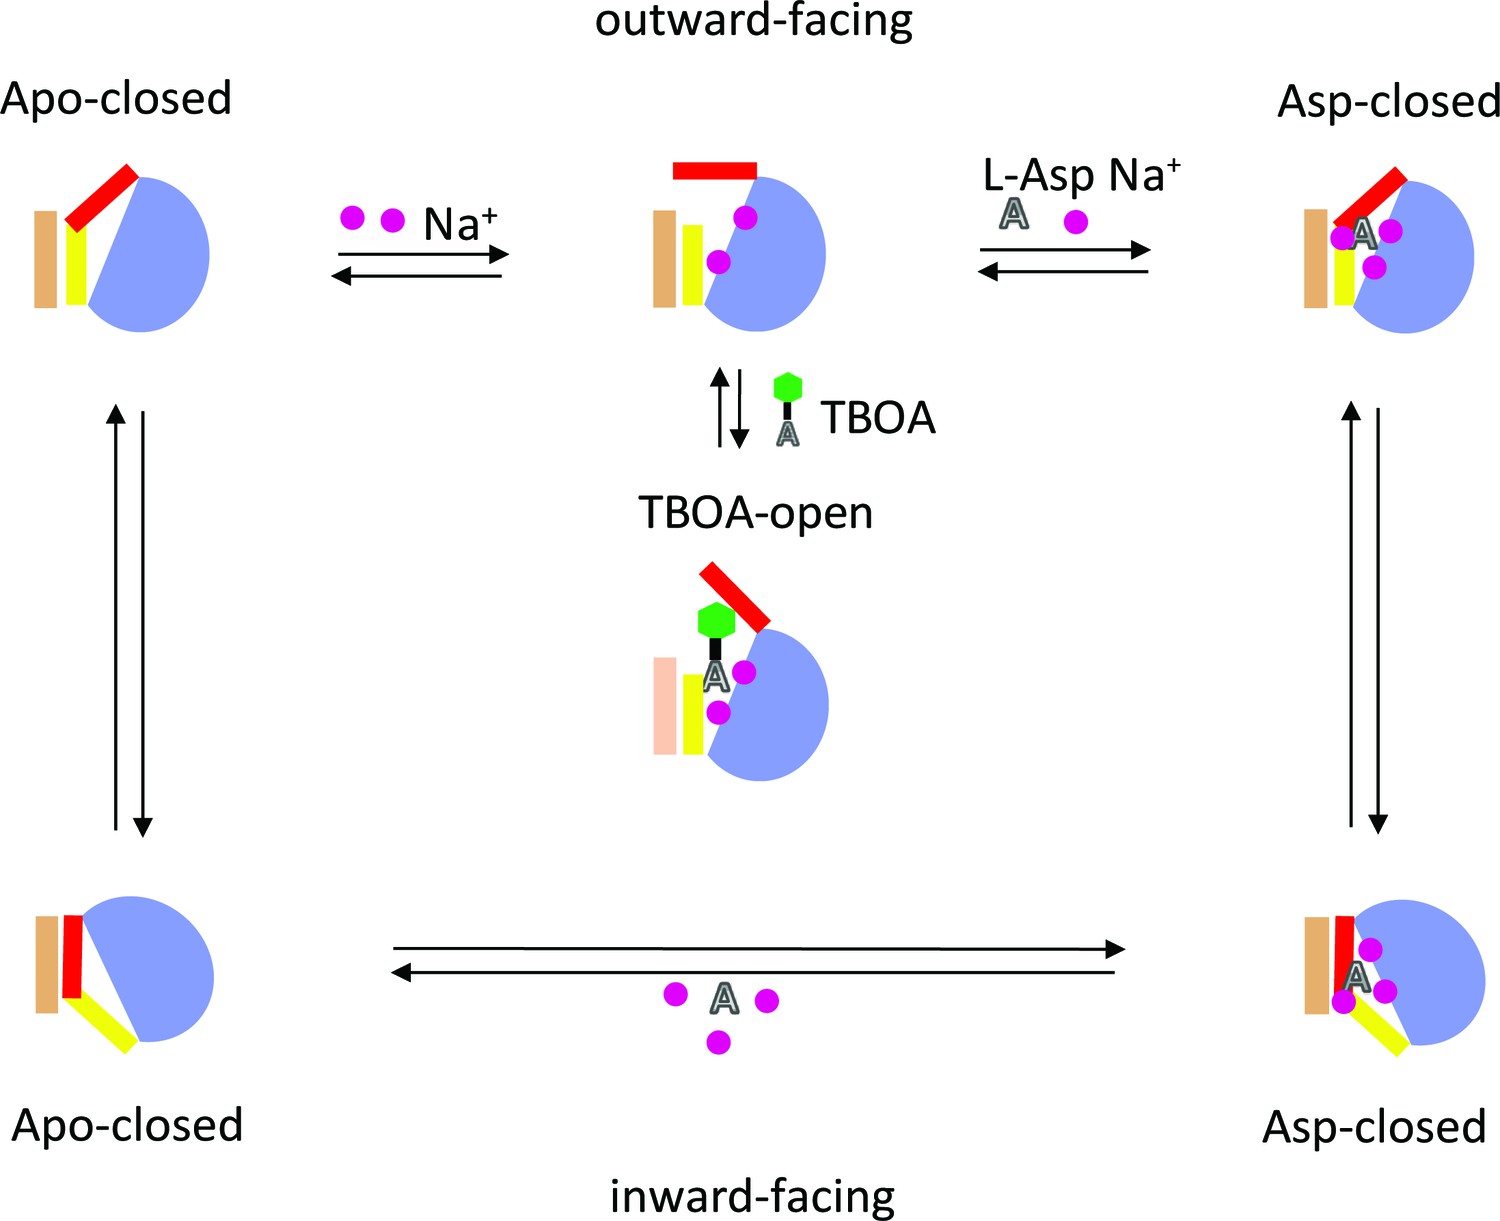
Schematic representation of the elevator mechanism of transport by GltPh.
The scaffold domain is in wheat, and the transport domain is in blue. HP1 and HP2 are yellow and red, respectively. Substrate L-asp is represented as a letter A and the benzyl group of the blocker TBOA is shown as a green hexagon. Three symported Na+ ions are shown as purple circles.
Figure 1—figure supplement 2
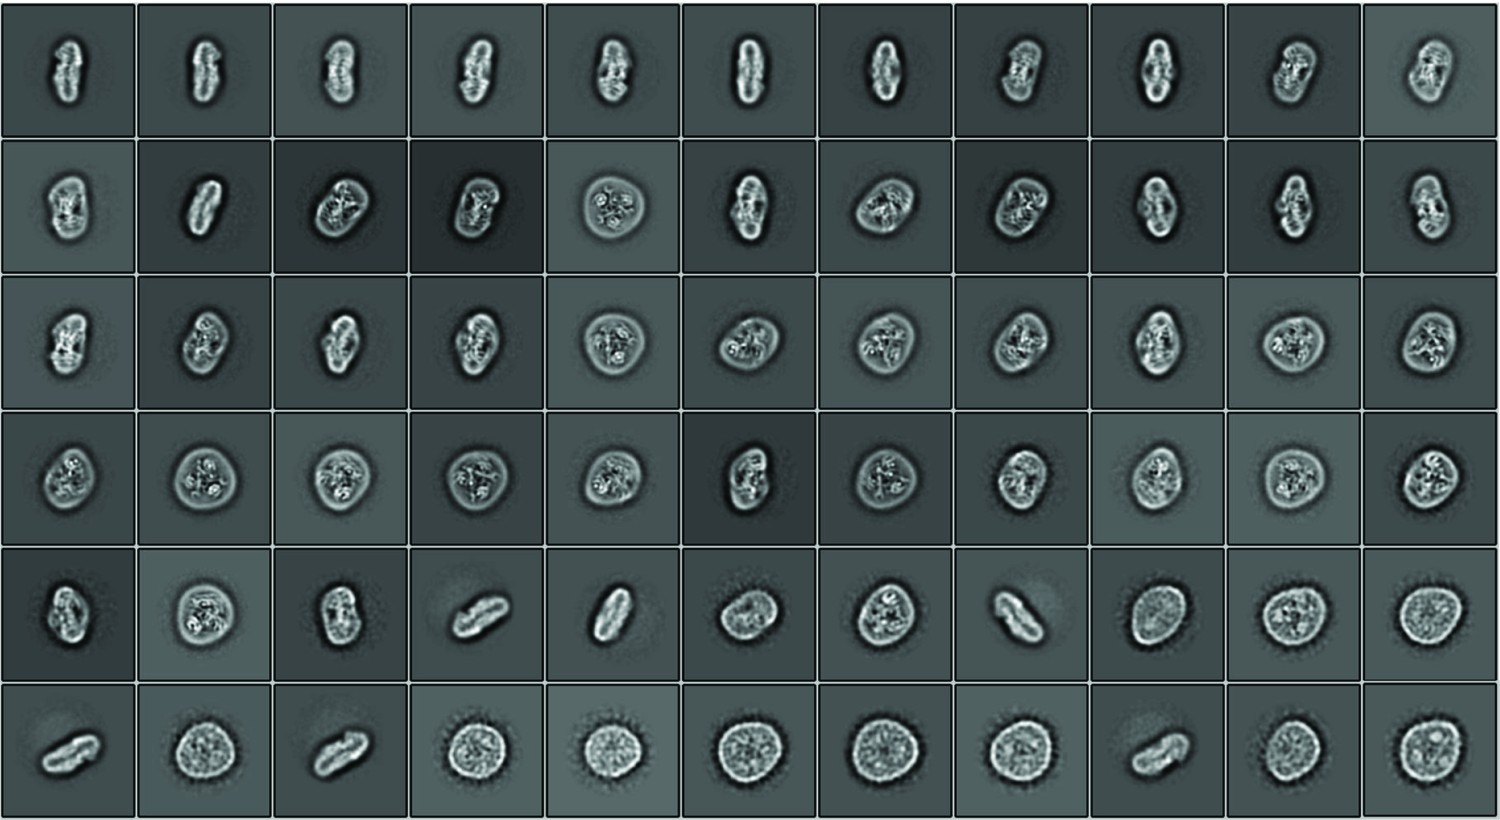
Cryo-EM data processing.
An example of selected 2D classes depicting the trimeric GltPhIFS-Asp transporter in lipid nanodiscs. Box size is 275 Å.
Figure 1—figure supplement 3
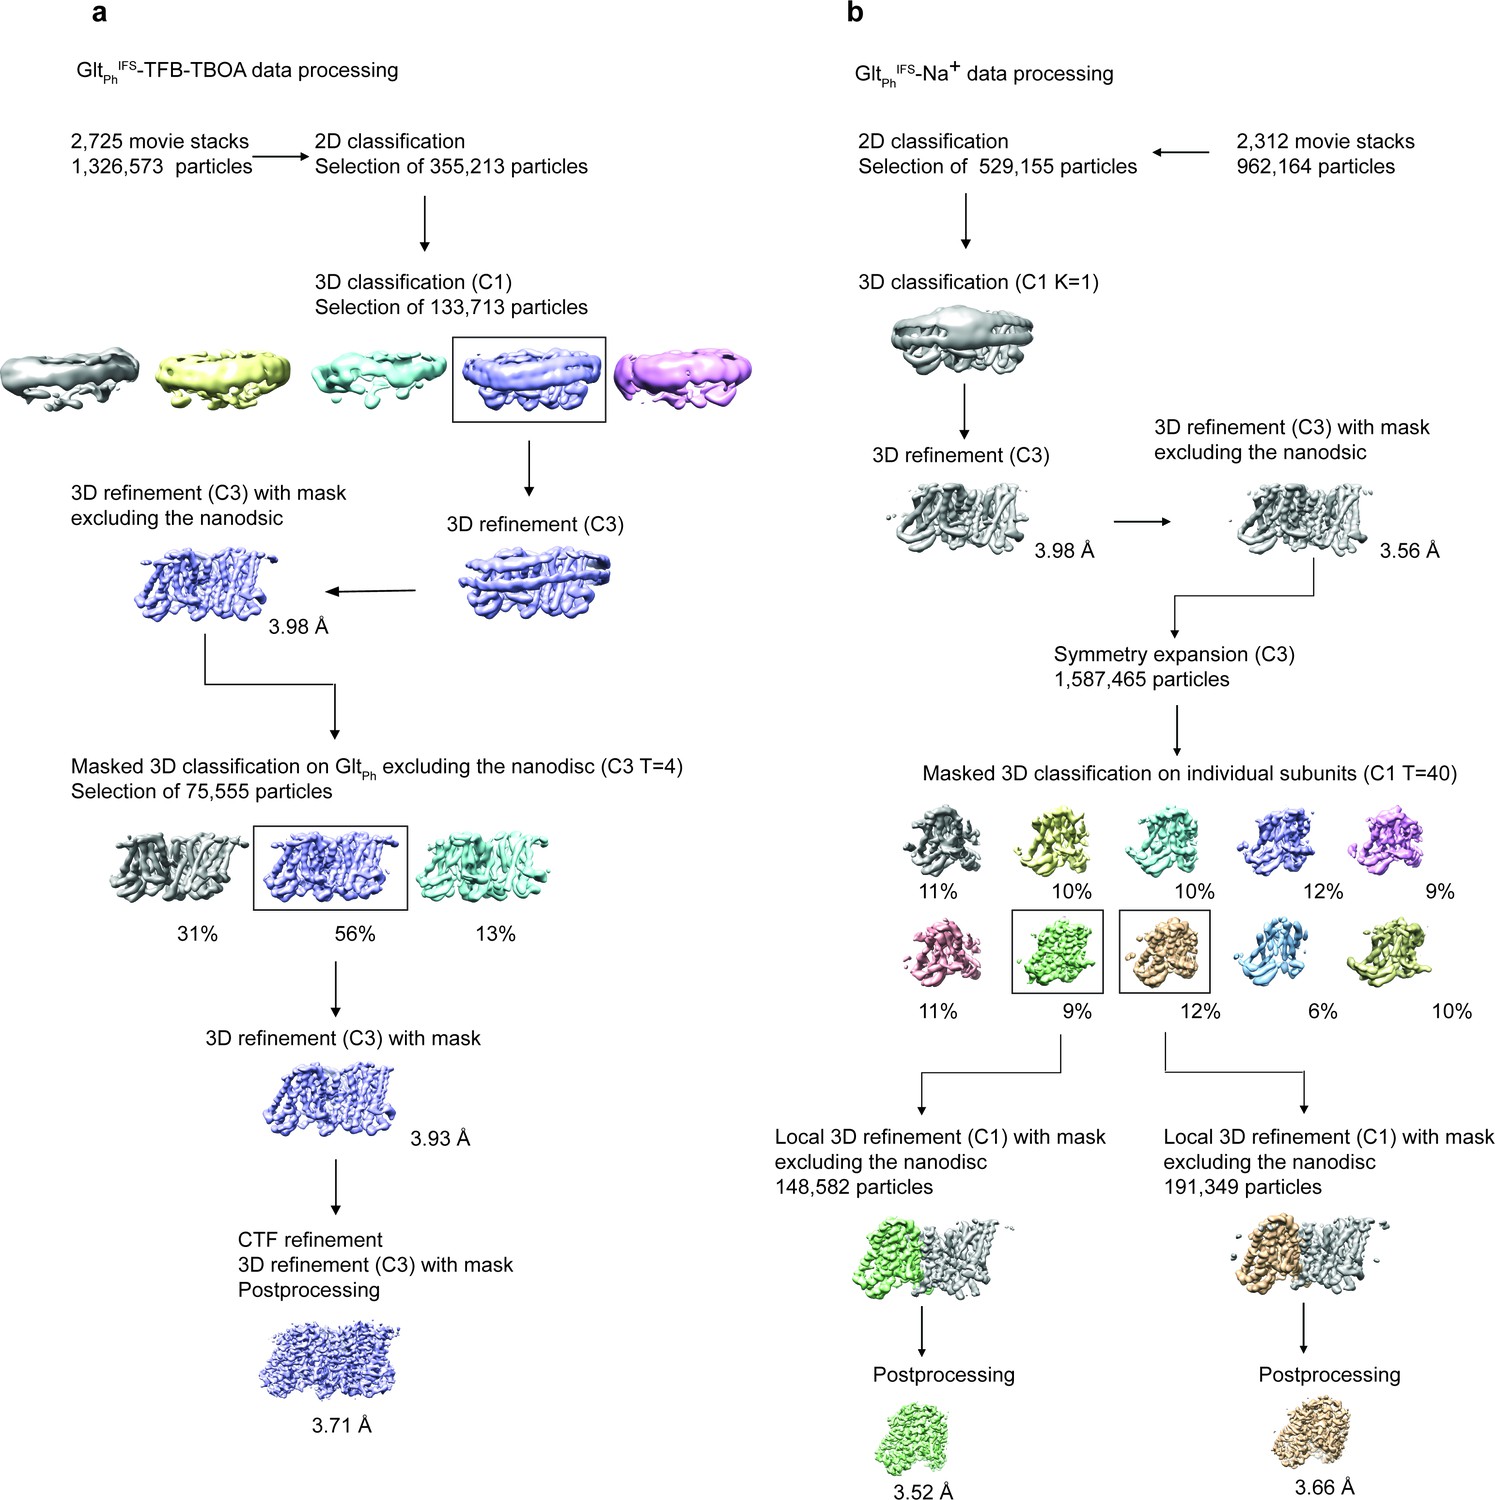
Data processing flowchart for GltPhIFS-TFB-TBOA (a) and GltPhIFS-Na, and GltPhIFS-Apo-open (b).
Data processing for GltPhIFS-Asp, GltPhIFS -TBOA, and GltPhOFS-TBOA followed the same scheme as GltPhIFS-TFB-TBOA.
Figure 1—figure supplement 4
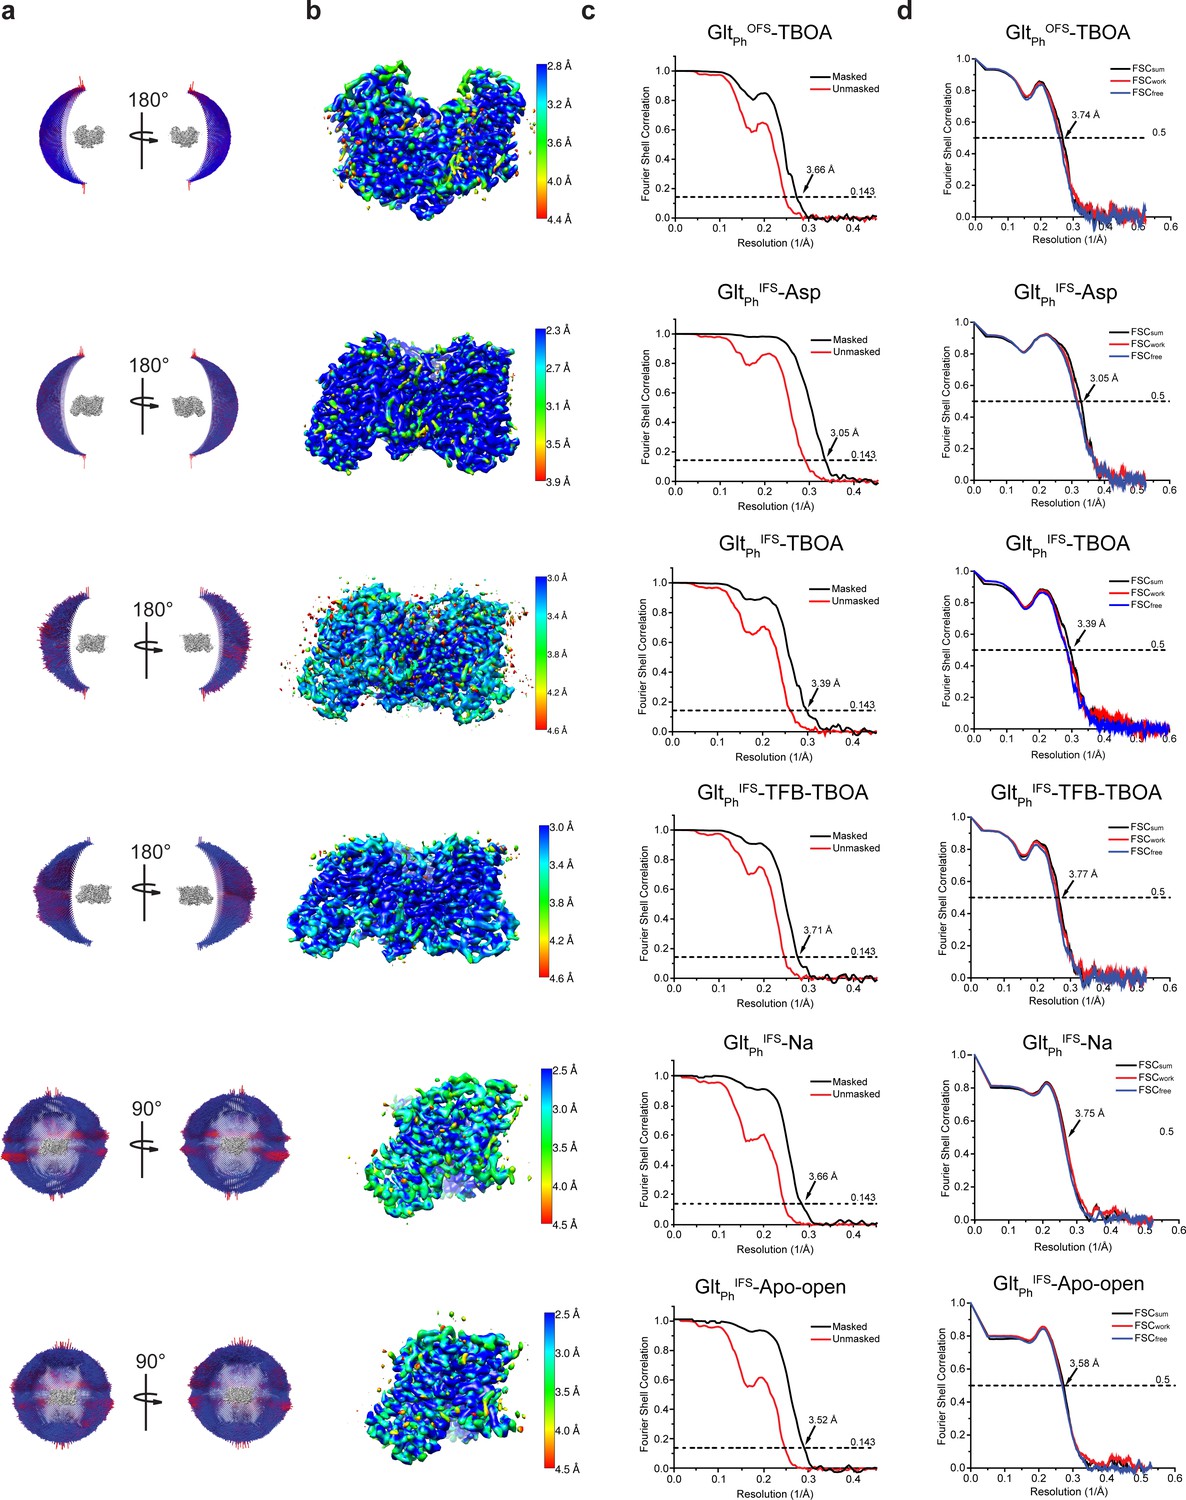
Cryo-EM imaging and data processing validation.
(a) Angular distribution of particles contributing to the final reconstitutions. The number of views at each angular orientation is represented by the length and color of cylinders, where red indicates more views. (b) Final maps after Relion post-processing colored according to the local resolution estimation using ResMap. (c) Fourier shell correlation (FSC ) curves indicating the resolution at the 0.143 thresholds of the final masked (black) and unmasked (orange) maps. (d) FSC curves from cross-validation of the refined models compared to the masked half-map 1 (orange traces: FSCwork, used during validation refinement), masked half map 2 (blue traces: FSCfree, not used during validation refinement), and the masked summed map (black traces: FSCsum).
Figure 2 with 2 supplements
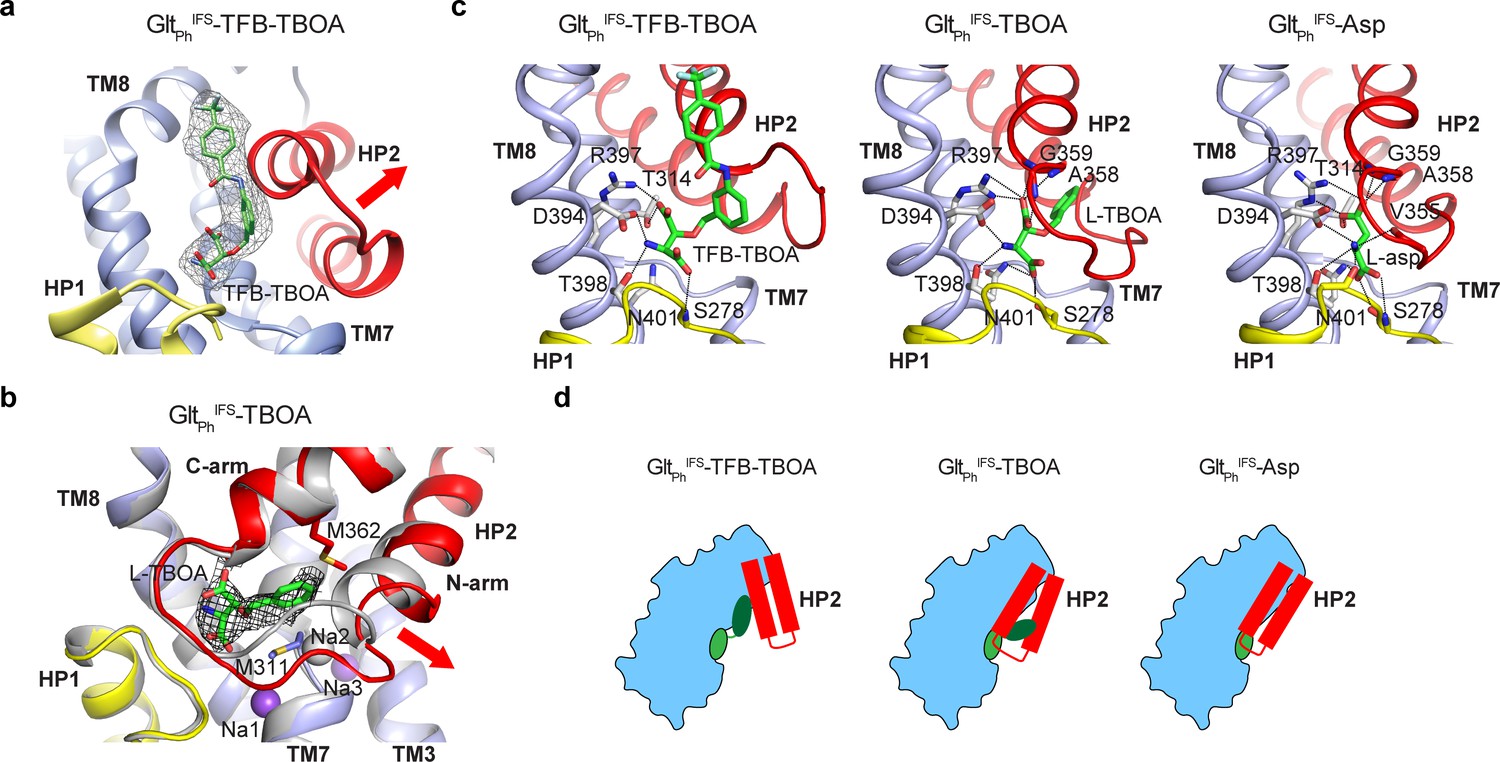
Two mechanisms of blocker binding.
(a) Close-up view of the substrate-binding pocket of GltPhIFS with bound TFB-TBOA shown in stick representation and colored by atom type. The corresponding density is shown as a black mesh object. The red arrow emphasizes the HP2 opening. (b) Superimposed GltPhIFS transport domains in complex with L-asp (gray) and TBOA (colored). The red arrow emphasizes the movement of the N-terminal arm of HP2. TBOA and Na+ ions are shown as sticks and spheres, respectively. The black mesh object is the density contoured at 3 σ. (c) Bound TFB-TBOA and TBOA assume similar rotamers, distinct from L-asp, and are coordinated differently. The ligands are shown in stick representations; dotted lines correspond to potential hydrogen bonds. (d) Two mechanisms of blockers binding to GltPhIFS through either opening of HP2 or parting of the two arms to accommodate the bulky moieties.
Figure 2—figure supplement 1

GltPhCryo-EM structures in the presence of L-Asp or inhibitors.
(a) Superimposition of WT GltPhOFS-TBOA Cryo-EM (colored) and crystal structures (gray, PDB code 2NWW) (Boudker et al., 2007). L-TBOA modeled in the crystal structure (orange), and a lipid molecule modeled in the Cryo-EM structure (green) are shown as sticks. The rest of the protein is colored as in Figure 1. (b) Close-up views of the substrate-binding site in GltPhIFS -Asp. Excess density is shown as a blue mesh. The modeled L-asp is shown in stick representation. (c) Superimposition of the transport domains of GltPhIFS-TFB-TBOA (colors) and WT GltPhOFS-TBOA (gray). Bound L-TBOA and TFB-TBOA are shown as sticks and colored orange and green, respectively. (d) GltPhIFS-TFB-TBOA protomer viewed in membrane plane with transport and scaffold domains shown in surface and cartoon representations, respectively. TFB-TBOA (green spheres) protrudes from the binding pocket toward the domain interface.
Figure 2—figure supplement 2
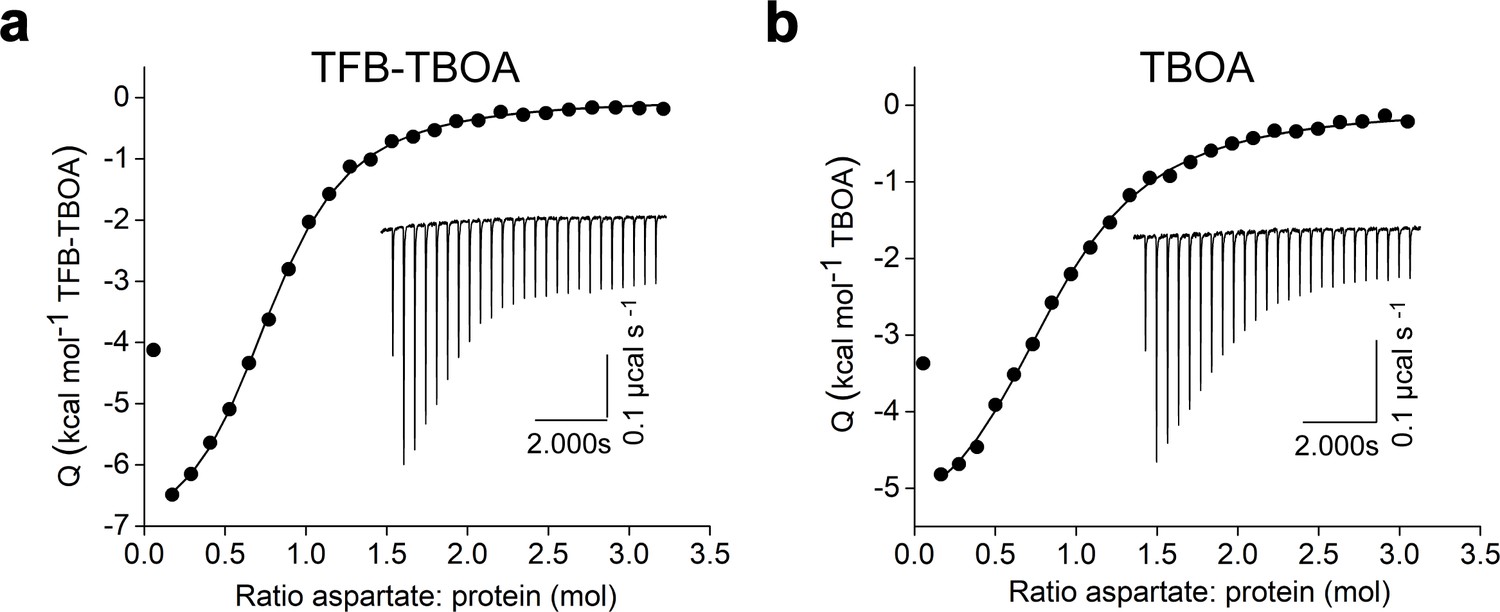
Crosslinked GltPh-K55C/A364C binds TFB-TBOA (a) and TBOA (b).
Shown are isotherms derived from ITS experiments conducted at 15 °C in 200 mM Na+. Solid black circles are integrated injection heats and the black lines are the fits to independent binding sites model with the following parameters for TFB-TBOA and TBOA, respectively: KD-s of 3.8 and 6.5 μM; ΔH-s of -7.6 and -6.1 kcal mol −1; and the apparent number of binding sites, n of 0.8 and 0.8. Insets show raw injection thermal powers with corresponding scales. Experiments were repeated at least twice on independently purified protein samples yielding similar results.
Figure 3 with 2 supplements
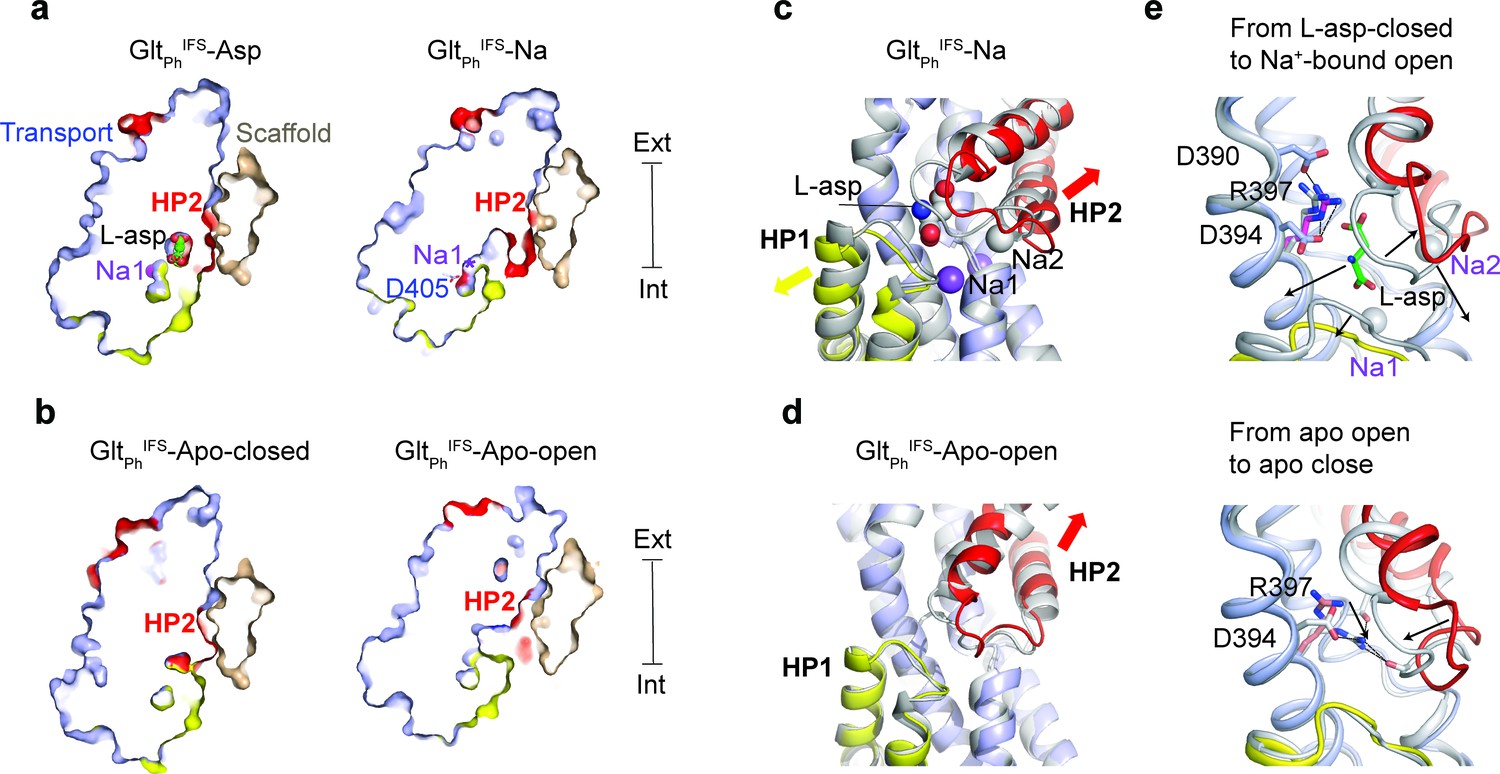
Solute-coupled gating.
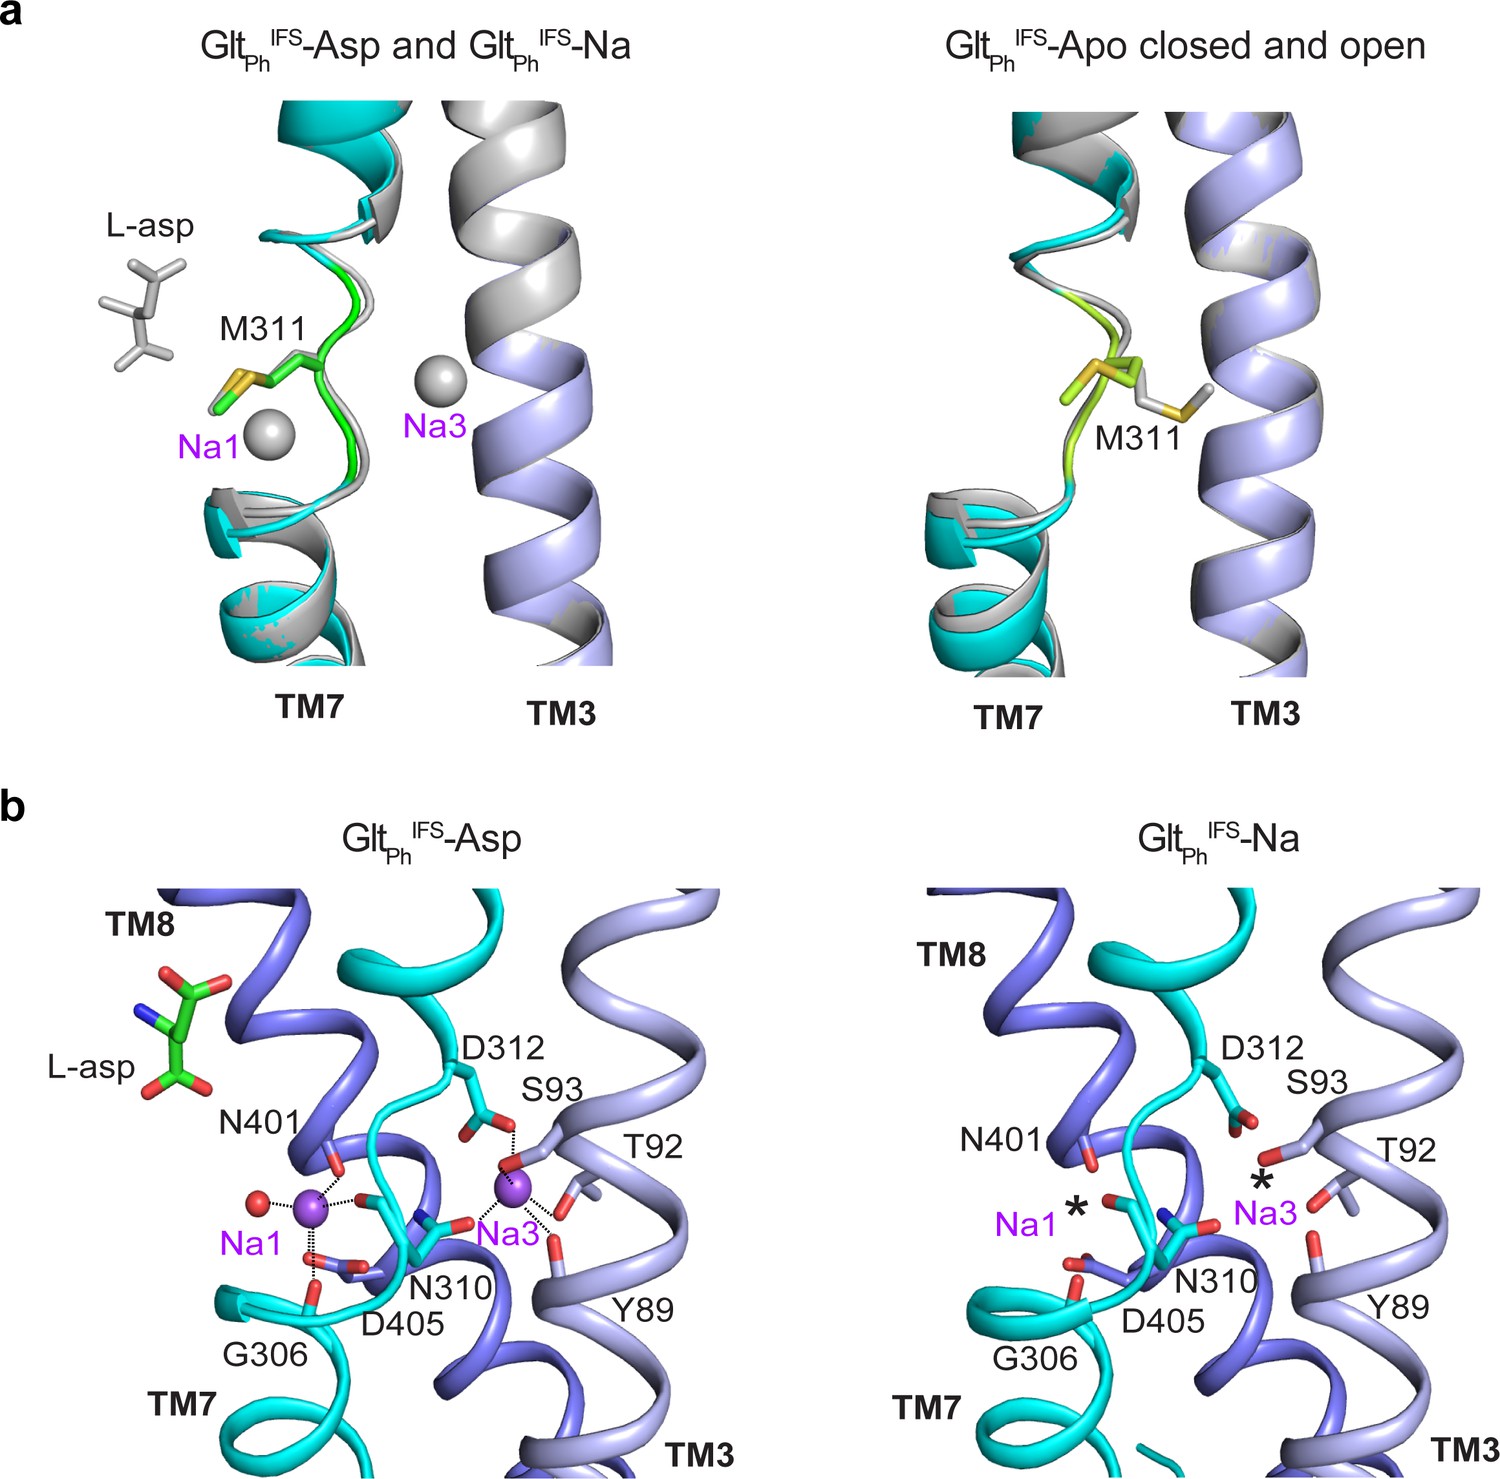
(a and b) Thin cross-sections of the protomers taken approximately through aspartate-binding sites normal to the membrane plane. The binding site is occluded in Na+/L-asp-bound, and closed apo (PDB 4P19) (Verdon et al., 2014) states and is exposed to the solvent in Na+-only, and apo open states. The bound L-asp and Na+ ions in GltPhIFS-Asp are shown as spheres. In GltPhIFS-Na, the side chain of D405 is shown as sticks, and a star indicates the Na1 site. (c) Superimposed transport domains of GltPhIFS-Na (colored) and GltPhIFS-Asp (gray). L-asp and Na+ ions are shown as spheres. Yellow and red arrows indicate movements of HP1 and HP2, respectively. (d) Superimposed transport domains of GltPhIFS-Apo-open (colored) and GltPhIFS-Apo-closed (gray). (e) Gating steps in the inward-facing state. Top: Local structural changes from GltPhIFS-Asp (gray) to an open GltPhIFS-Na state (colored). Black arrows indicate the dissociation of L-asp and Na2 and the open states of HP1 and HP2 in GltPhIFS-Na. Bottom: Binding site occlusion from GltPhIFS-Apo-open (colored) to GltPhIFS-Apo-closed (gray). Black arrows mark movements of R397 into the binding site and the closure of HP2.
Figure 3—figure supplement 1
Na+-binding sites in the GltPhIFS in Apo and Na+-bound states.
(a) The superimposition of GltPhIFS-Na and GltPhIFS-Asp (left) and GltPhIFS-Apo-open and Apo-closed (right) show similar conformations of the NMD motif, involved in coordinating Na+ ions at the Na1 and Na3 sites. (b) Structures of the Na1 and Na3 sites in GltPhIFS-Asp and GltPhIFS-Na. Coordinating moieties within 3 Å of the ions are emphasized by dotted lines in GltPhIFS-Asp. Stars in GltPhIFS-Na represent the potentially bound Na+ ions, placed as in GltPhIFS-Asp. Na+ ions and a resolved water molecule are shown as purple and red spheres, respectively.
Figure 3—figure supplement 2

Molecular mechanism of HP2 opening and closing.
(a) Surface representation of the two open structures, GltPhIFS-Na and GltPhIFS-Apo-open with HP1 and HP2 colored yellow and red, respectively. To emphasize solvent accessibility of the substrate-binding site, L-asp is shown in stick representation at the position found in the GltPhIFS-Asp structure. (b) Top view of superimposed transport domains of GltPhIFS-Asp (dark gray), GltPhIFS-Na (dark colors), GltPhIFS-Apo-open (light colors), and GltPhIFS-Apo closed (light gray). Only TM7 and TM3 are shown for clarity. Sidechains of M311 are depicted as sticks. An approximate location of the N-terminal arm of HP2 is shown as a transparent pink cylinder. (c) Superimposition of GltPhIFS-Na (colored) and GltTk Na+-bound (gray, PDB code 6XWR) (Arkhipova et al., 2020) structures.
Figure 4 with 1 supplement
Translocation-deficient states show more extensive inter-domain interfaces.
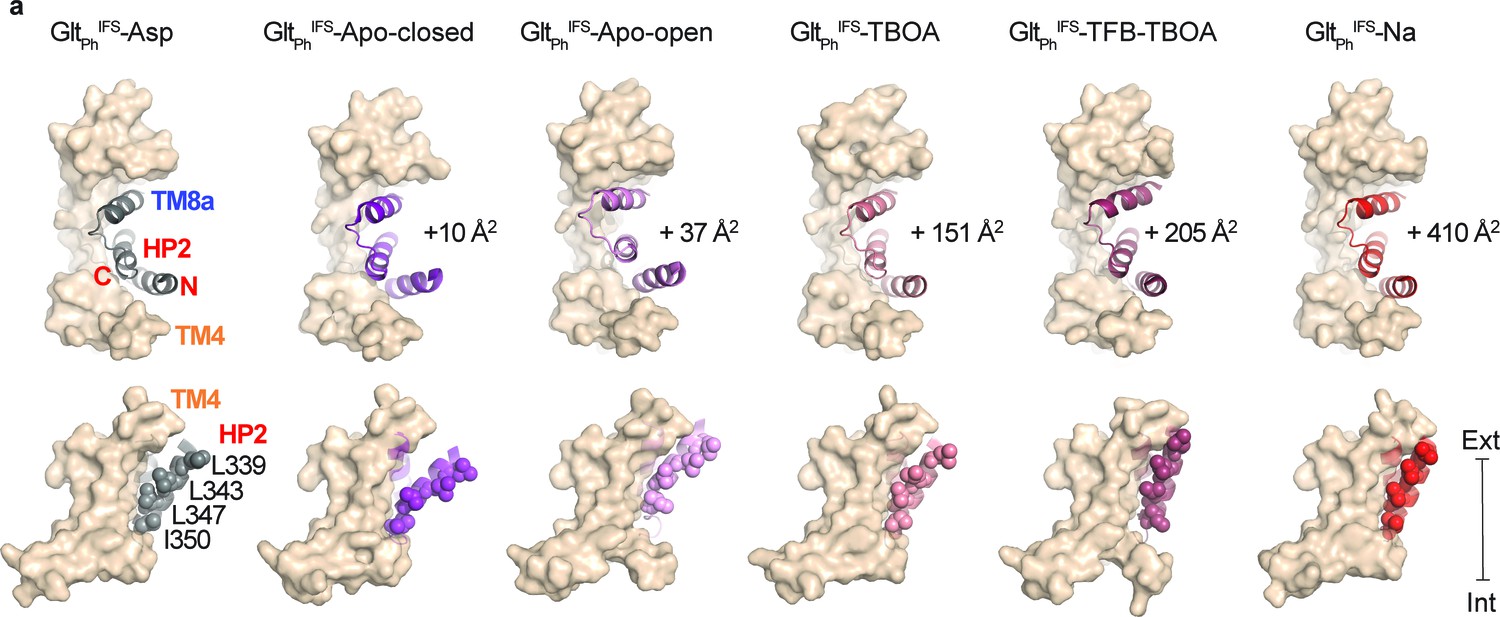
(a) Surface representations of the scaffold domain in light brown, and cartoon representation of HP2/TM8a motif with GltPhIFS-Asp colored gray, GltPhIFS-Apo-closed purple, GltPhIFS-Apo-open pink, GltPhIFS-TBOA salmon, GltPhIFS-TFB-TBOA berry, GltPhIFS-Na red. Sidechains of L339, L343, L347, and L350 are shown as spheres. Top: viewed from the extracellular space. The increases in the interdomain interaction surface area relative to GltPhIFS-Asp are shown next to the structures. Bottom: viewed in the membrane plane. Surface areas were determined as described (Krissinel and Henrick, 2007). $$BOX_TXT_END$$.
Figure 4—figure supplement 1
Structural plasticity of HP2 and the inter-domain interface.
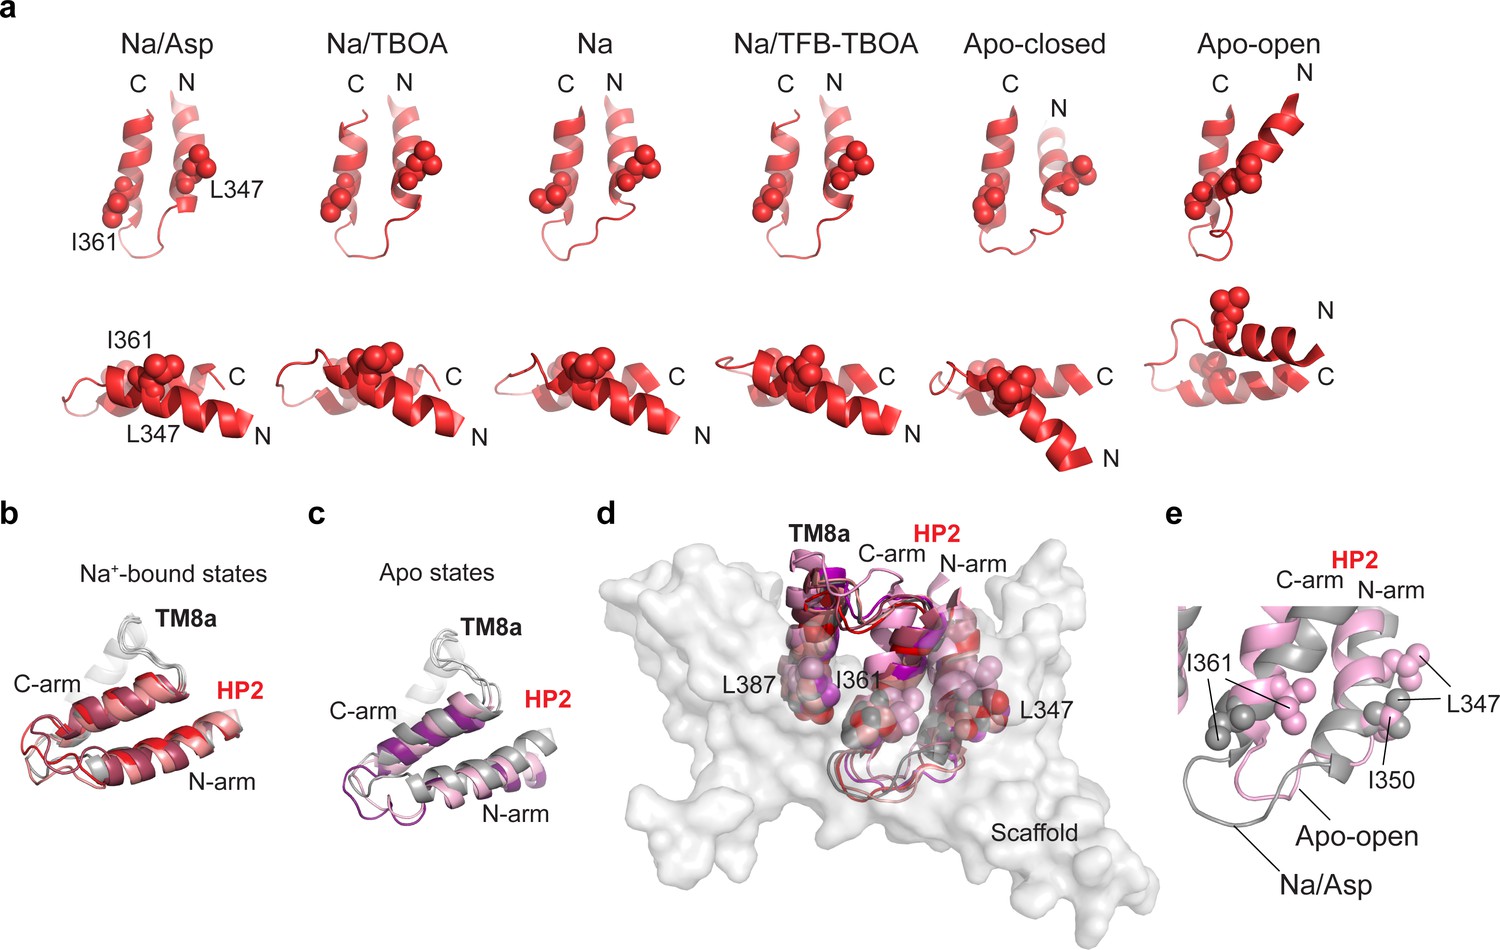
(a) Cartoon representations of HP2 in the IFS aligned on the HP2 C-terminal arm and viewed from two different directions (top and bottom). I361 and L347 side chains are shown as spheres. (b and c) Cartoon representation of HP2/TM8a helices aligned on TM8a for structures with (b) and without (c) bound Na1 and Na3. GltPhIFS-Asp (gray) is shown in both panels for reference. GltPhIFS-TBOA is colored salmon, GltPhIFS-Na red, GltPhIFS-TFB-TBOA berry, GltPhIFS-Apo-closed (purple), GltPhIFS-Apo-open (pink). (d) All structures are aligned on the scaffold domain. HP2/TM8a helices are shown in cartoon representation with the same color scheme as in (b and c). L347, I361, and L387 side chains are shown as spheres. The scaffold domain of GltPhIFS-Asp is shown in transparent surface representation and colored gray. (e) GltPhIFS-Apo-open (pink) and GltPhIFS-Asp (gray) are aligned on the scaffold domain, with HP2 shown in cartoon representation and L347, I350, I361 shown as spheres.
Figure 5 with 1 supplement

Coupling of the lipid bilayer to protein motions.
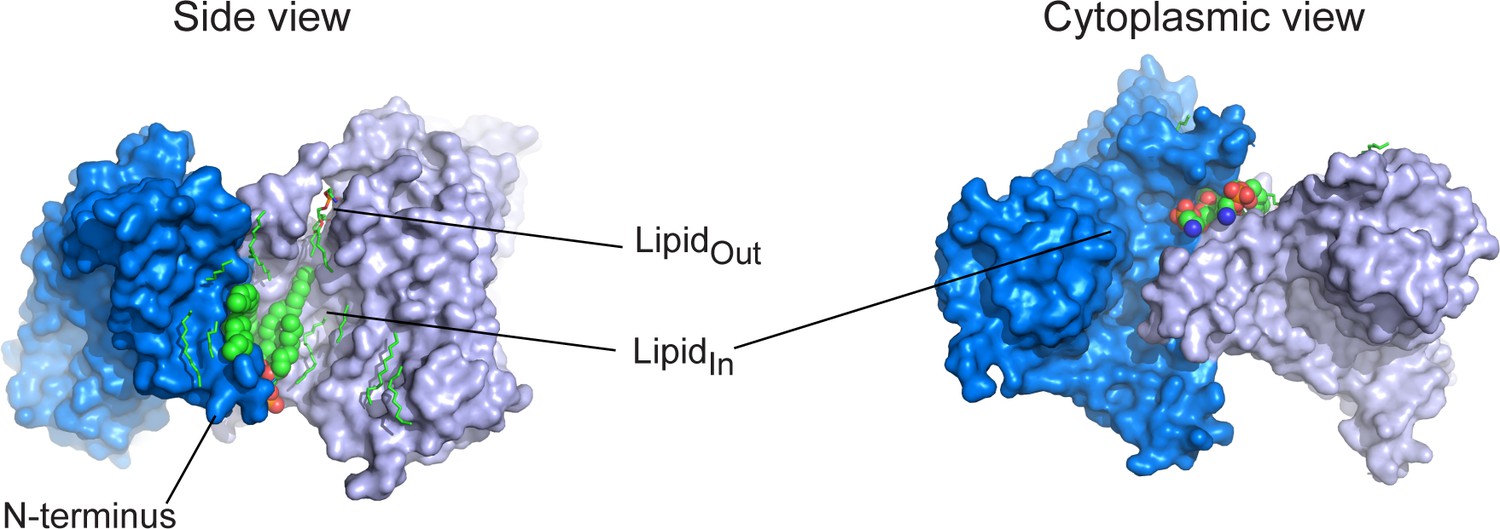
(a) Lipid densities (red) observed in protein cervices of GltPhIFS-Asp. Lipid molecules tucked between the N-terminus and the rest of the scaffold (Lipidin) are present in all OFS and IFS structures. (b) lipid densities (red mesh objects, Lipidout) observed on the extracellular side of a crevice between the scaffold TM4a and HP2 in both outward- (PDB code 6UWF) (Huang et al., 2020) and inward-facing GltPh bound to L-asp. (c) Density map of a GltPhIFS-TFB-TBOA protomer, with the lipid density in the window between the transport domain and scaffold colored red (Lipidwindow). (d) Density maps of GltPhOFS-TBOA, GltPhIFS-Asp, and GltPhIFS-TFB-TBOA in nanodiscs viewed in the membrane plane. Densities corresponding to the transport and scaffold domains are colored blue and wheat, respectively. Density corresponding to the nanodisc is colored yellow. Black arrows mark deviations of the nanodiscs from the planar structures. (e) Extracellular (top) and cytoplasmic (bottom) views of the density maps. Sections of the maps corresponding to the lipidic nanodisc are colored by their displacement along the membrane normal (scalebar is to the right). The zero-level is set at the surface of nanodisc density around residue H37 (magenta) for the extracellular views. Negative values represent inward bending. The zero-level is set at the surface of nanodisc density around the N-terminus of the protein for the cytoplasmic views. Here, negative values represent outward bending. Densities corresponding to the transport and scaffold domains are shown as dark and light gray, respectively. Black arrows point to the regions with the largest deformations of the nanodiscs observed around the transport domains.
Figure 5—figure supplement 1
Structured lipids.
Two GltPhIFS-Asp protomers are shown in surface representation, colored marine and light blue, and viewed in membrane plane(left) or from the cytoplasmic side (right). Structured lipids are colored by atom type and shown as sticks, except the two structured lipid molecules at the N-terminus (LipidIn), shown as spheres.
Author response image 1
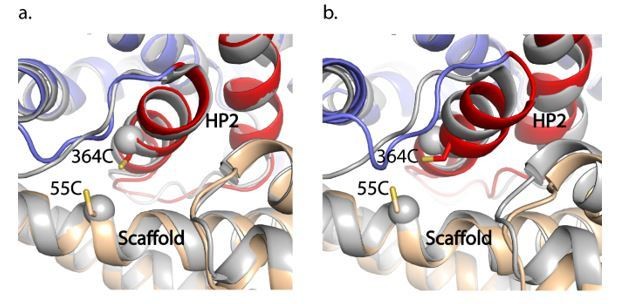
GltPhIFS-Na (a) and GltPhIFS-Asp (b) (in colors) aligned to GltTk Na+-bound structure (grey, PDB accession code 6XWR) on the trimerization domain.
55C and 364C side chains of GltPhIFS-Na are shown as sticks and CA atoms of the corresponding K57 and A364 of GltTk are shown as spheres.
Videos
Video 1
Transport cycle of glutamate transporter GltPh.
Video 2
M311 and R397 couple HP2 gating to ion and substrate binding in the inward-facing state.
Video 3
Transport domain movements coupled to nanodisc distortions.
Tables
Table 1
Cryo-EM data collection, refinement and validation statistics.
| GltPh OFS -TBOA (EMD- 21991) (PDB- 6 × 17) | GltPh IFS-Asp (EMD- 21989) (PDB- 6 × 15) | GltPh IFS-TBOA (EMD- 21990) (PDB- 6 × 16) | GltPh IFS-TFB-TBOA (EMD- 21988) (PDB- 6 × 14) | GltPhIFS- Na (EMD- 21987) (PDB- 6 × 13) | GltPhIFS-Apo-open (EMD- 21986) (PDB- 6 × 12) | |
|---|---|---|---|---|---|---|
| Data collection and processing | ||||||
| Magnification | 22500x | 130000x | 22500x | 22500x | 22500x | 22500x |
| Voltage (kV) | 300 | 300 | 300 | 300 | 300 | 300 |
| Electron exposure (e–/Å2) | 68.55 | 69.30 | 69.70 | 68.70 | 68.55 | 68.55 |
| Defocus range (μm) | −1.5 to −2.5 | −1.5 to −2.5 | −1.5 to −2.5 | −1.5 to −2.5 | −1.5 to −2.5 | −1.5 to −2.5 |
| Pixel size (Å) | 1.07325 | 1.0605 | 1.07325 | 1.07325 | 1.07325 | 1.07325 |
| Symmetry imposed | C3 | C3 | C3 | C3 | C1 | C1 |
| Initial particle images (no.) | 426089 | 445791 | 1378438 | 1326573 | 962164 | 962164 |
| Final particle images (no.) | 88961 | 74233 | 47950 | 75555 | 191349 | 148582 |
| Map resolution (Å) FSC threshold | 3.66 0.143 | 3.05 0.143 | 3.39 0.143 | 3.71 0.143 | 3.66 0.143 | 3.52 0.143 |
| Map resolution range (Å) | 2.6–7.0 | 2.3–4.0 | 2.4–4.5 | 2.4–4.5 | 2.4–7.0 | 2.4–7.0 |
| Refinement | ||||||
| Initial model used (PDB code) | 2NWW | 3KBC | 3KBC | 3KBC | 3KBC | 3KBC |
| Map sharpening B factor (Å2) | −182.8 | −94.1 | −97.6 | −174.8 | −157.9 | −131.2 |
| Model composition Non-hydrogen atoms Protein residues Ligands | 9393 1245 3 | 10026 1257 54 | 9438 1248 6 | 9486 1239 9 | 3136 417 1 | 3059 407 1 |
| B factors (Å2) Protein Ligand | 40.69 35.78 | 40.94 49.70 | 85.87 84.33 | 46.95 49.95 | 47.52 41.36 | 75.40 73.63 |
| R.m.s. deviations Bond lengths (Å) Bond angles (°) | 0.006 0.918 | 0.005 0.811 | 0.006 0.945 | 0.005 0.848 | 0.005 0.910 | 0.007 0.951 |
| Validation MolProbity score Clashscore Poor rotamers (%) | 1.42 4.19 0 | 1.34 3.62 0 | 1.52 3.97 0 | 1.56 6.63 0 | 1.68 4.80 0 | 1.23 3.01 0 |
| Ramachandran plot Favored (%) Allowed (%) Disallowed (%) | 96.61 3.39 0 | 96.88 3.12 0 | 95.17 4.83 0.31 | 96.84 3.16 0 | 93.49 6.51 0.31 | 97.27 2.73 0 |
Key resources table
| Reagent type (species) or resource | Designation | Source or reference | Identifiers | Additional information |
|---|---|---|---|---|
| Biological sample (Escherichia coli) | DH10B | Invitrogen | Cells for GltPhexpression | |
| Biological sample (Escherichia coli) | BL21(DE3) | Stratagene | Cells for MSP1E3 expression | |
| Recombinant DNA reagent | GltPh | DOI: 10.1038/nature03018 | ||
| Recombinant DNA reagent | MSP1E3 | Addgenehttps://www.addgene.org/20064/ | PRID:Addgene_20064 | |
| Software, algorithm | Origin | OriginLab | ||
| Software, algorithm | Leginon | doi:10.1016/j.jsb.2005.03.010 | ||
| Software, algorithm | Relion | doi:10.7554/eLife.42166 | RRID:SCR_016274 | |
| Software, algorithm | MotionCorr2 | doi:10.1038/nmeth.4193 | ||
| Software, algorithm | CTFFIND4 | doi:10.1016/j.jsb.2015.08.008 | RRID:SCR_016732 | |
| Software, algorithm | UCSF chimera | doi:10.1002/jcc.20084 | RRID:SCR_004097 | |
| Software, algorithm | ResMap | doi:10.1038/nmeth.2727 | ||
| Software, algorithm | Pymol | Schrödinger | RRID:SCR_000305 | |
| Software, algorithm | NanoAnalyze | TAinstruments | ||
| Software, algorithm | Nano ITCRun | TAinstruments | ||
| Software, algorithm | Appion | doi: 10.1016/j.jsb.2009.01.002 | RRID:SCR_016734 | |
| Software, algorithm | PDBePISA | doi:10.1016/j.jmb.2007.05.022 | RRID:SCR_015749 | |
| Software, algorithm | DoGpicker | doi:10.1016/j.jsb.2009.01.004 |
Additional files
Download links
A two-part list of links to download the article, or parts of the article, in various formats.
Downloads (link to download the article as PDF)
Open citations (links to open the citations from this article in various online reference manager services)
Cite this article (links to download the citations from this article in formats compatible with various reference manager tools)
Large domain movements through the lipid bilayer mediate substrate release and inhibition of glutamate transporters
eLife 9:e58417.
https://doi.org/10.7554/eLife.58417


