Transmission of West Nile and five other temperate mosquito-borne viruses peaks at temperatures between 23°C and 26°C
- Department of Biology, Stanford University, United States
- Department of Ecology and Evolutionary Biology, University of California Los Angeles, United States
- Department of Statistics, Virginia Polytechnic Institute and State University (Virginia Tech), United States
- Department of Integrative Biology, University of South Florida, United States
- Department of Forest and Wildlife Ecology, University of Wisconsin, United States
- Department of Biological Sciences, Virginia Polytechnic Institute and State University (Virginia Tech), United States
- Department of Biological Sciences, Eck Institute of Global Health, Environmental Change Initiative, University of Notre Dame, United States
Figures
Figure 1
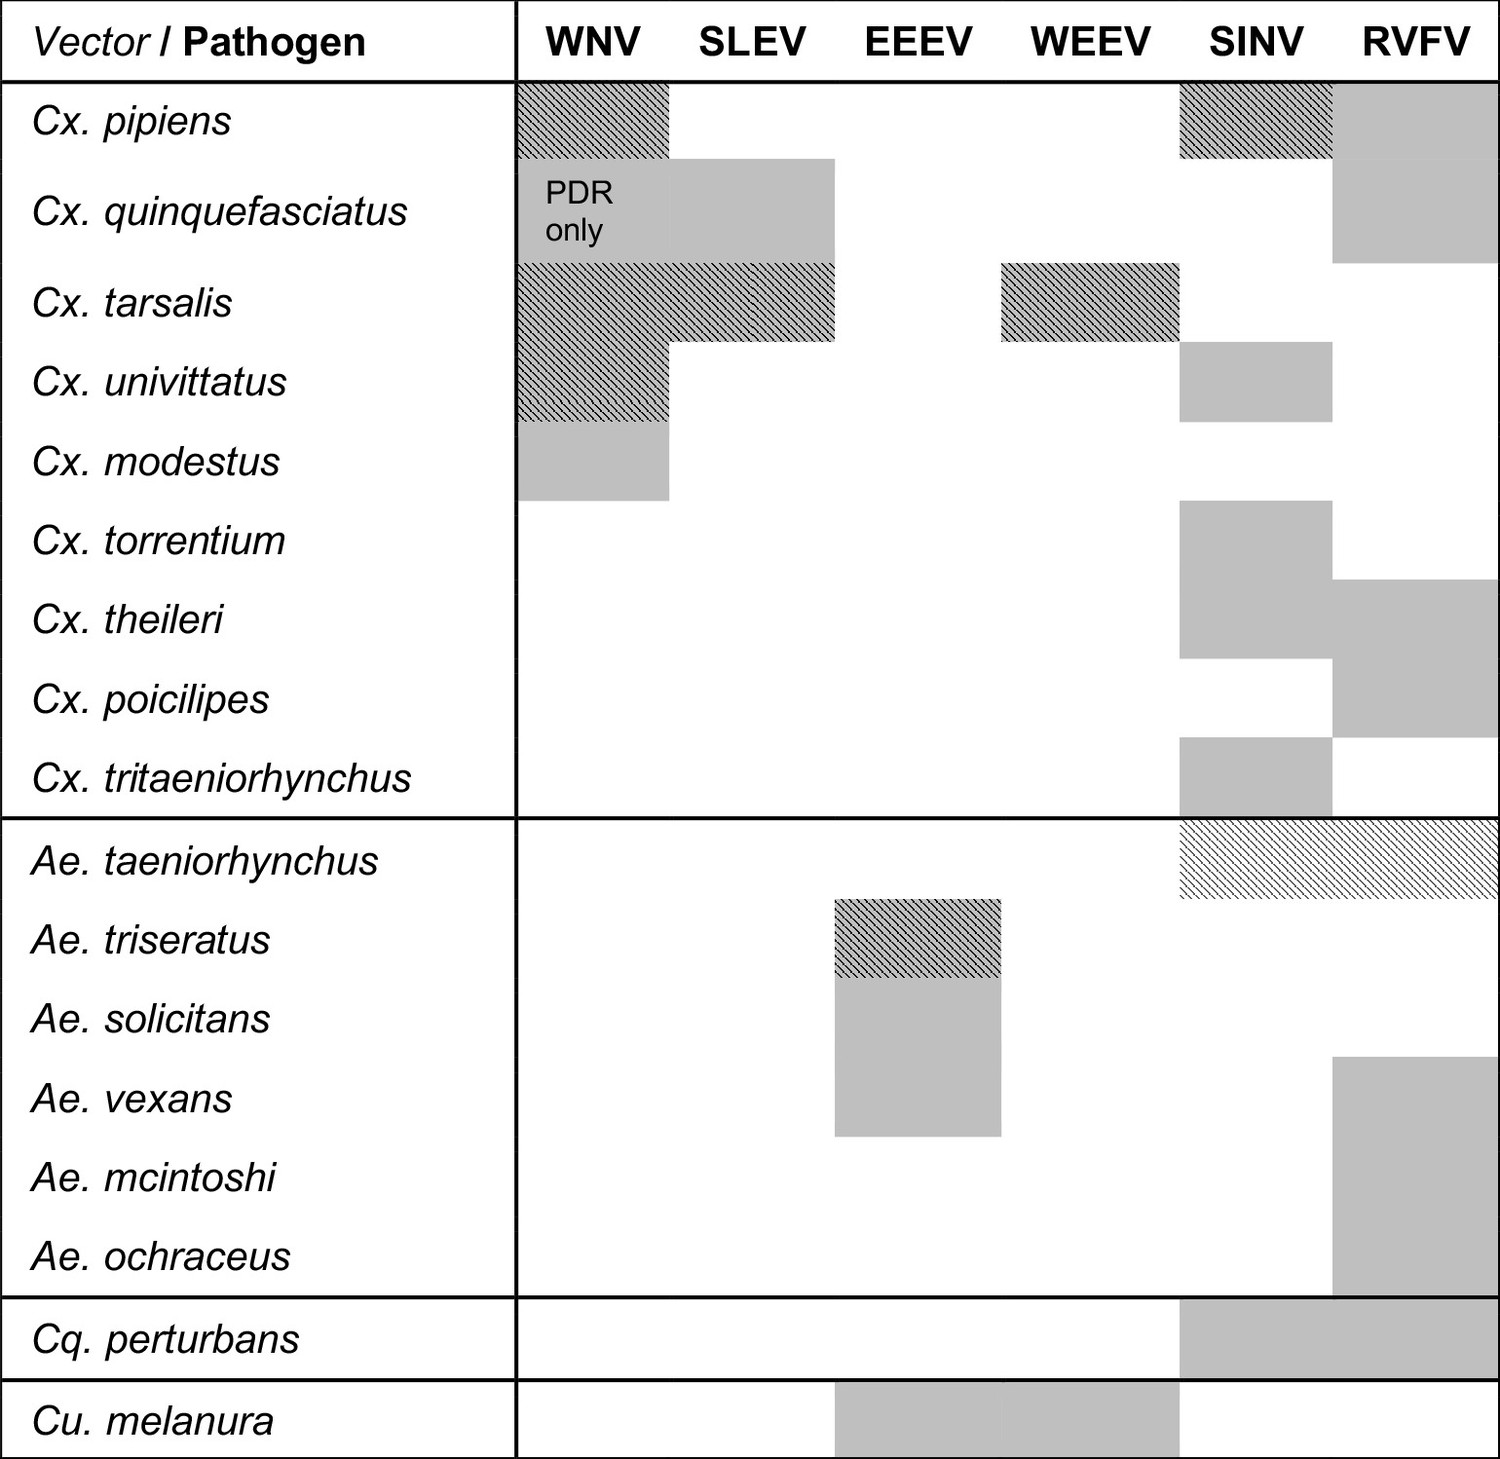
Viruses are transmitted by multiple vectors and vectors transmit multiple viruses; infection data are only available for a subset of important vector species.
The six viruses in this study (WNV = West Nile virus, SLEV = St. Louis Encephalitis virus, EEEV = Eastern Equine Encephalitis virus, WEEV = Western Equine Encephalitis virus, SINV = Sindbis virus, RVFV = Rift Valley Fever virus) and the Culex (Cx.), Aedes (Ae.), Coquillettidia (Cq.), and Culiseta (Cs.) vectors that are most important for sustaining transmission to humans according to the following sources: (Adouchief et al., 2016; Braack et al., 2018; Golding et al., 2012; Linthicum et al., 2016; Sang et al., 2017; Weaver and Barrett, 2004). The importance of each vector for transmission varies over the geographic range of the virus, and this list of vectors is not exhaustive for any virus (see sources for more complete lists of confirmed and potential vectors). Grey shading indicates an important vector-virus pair; hatching indicates available temperature-dependent data for infection traits (pathogen development rate [PDR] and vector competence [bc], which is comprised of infection efficiency [c] and transmission efficiency [b]). Infection data were available for SINV and RVFV in Ae. taeniorhynchus, although this North American mosquito does not occur in the endemic range of these pathogens.
Figure 2

Culex spp. vectors of West Nile and other viruses have distinct but overlapping geographic distributions.
The geographic distribution of the primary vectors of West Nile virus: (A) Culex pipiens (dark grey) and Cx. quinquefasciatus (red), adapted from Farajollahi et al., 2011; Smith and Fonseca, 2004; (B) Cx. tarsalis (blue), northern boundary from Darsie and Ward, 2016, southern boundary based on data from the Global Biodiversity Information Facility. Figure created by Michelle Evans for this paper.
Figure 3

Culex spp. mosquito traits respond strongly and consistently to temperature.
The thermal responses of mosquito traits for the North American vectors of West Nile virus: Culex pipiens (dark grey), Cx. quinquefasciatus (red), and Cx. tarsalis (blue). (A) Mosquito development rate (MDR), (B) larval-to-adult survival (pLA), (C) biting rate (a), and (D) adult lifespan (lf). Points without error bars are reported means from single studies; points with error bars are averages of means from multiple studies (+ / - standard error, for visual clarity only; thermal responses were fit to reported means, see Appendix 1—figures 2, 3, 4, 5). Solid lines are posterior means; shaded areas are 95% credible intervals of the trait mean. See Appendix 1—figure 1 for thermal responses for Aedes taeniorhynchus, Ae. triseriatus, Ae. vexans, and Culiseta melanura. The mean thermal responses for these traits were printed in Mordecai et al., 2019 (as part of Figure 3 in that paper) without the trait data and 95% CIs, and along with thermal responses for six other vectors. See Appendix 1—tables 2, 3, 6 for data sources and Appendix 1—tables 7, 8, 9 for priors.
Figure 4
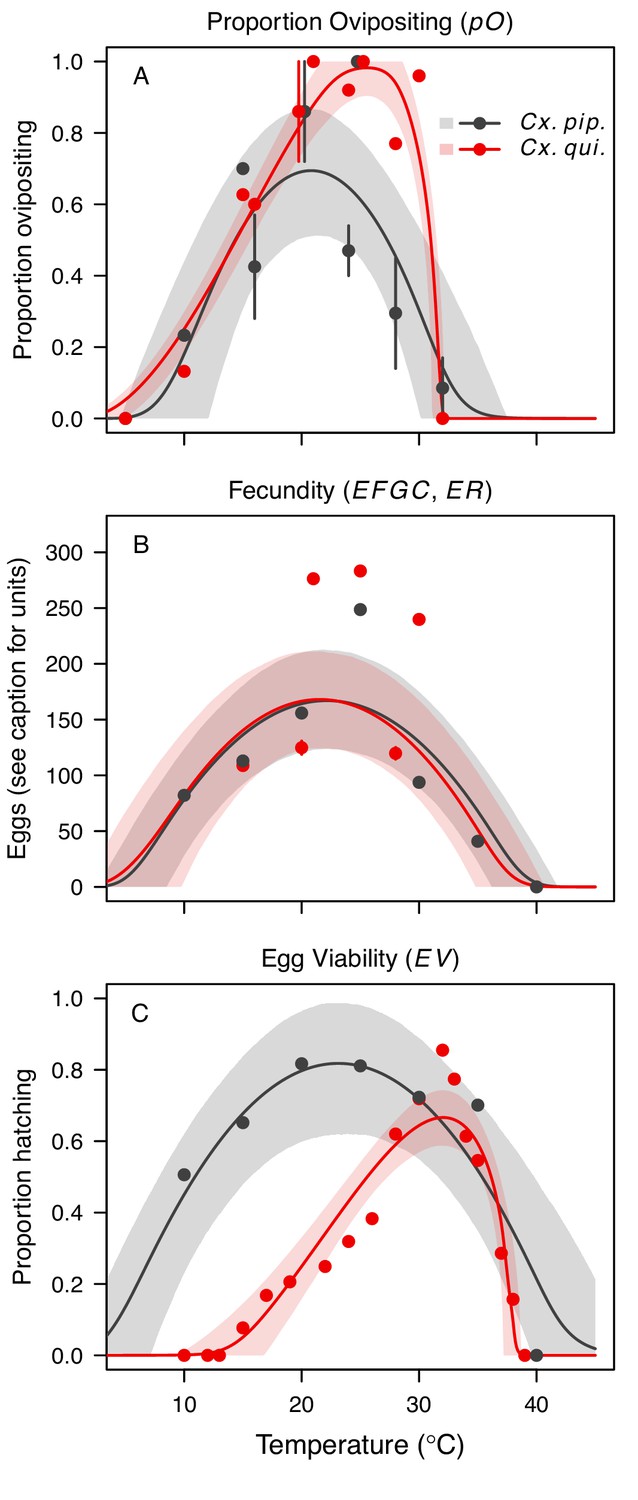
Culex pipiens and Cx. quinquefasciatus reproductive traits respond strongly to temperature but with different functional forms.
The thermal responses of mosquito traits for the primary vectors of West Nile virus: Culex pipiens (dark grey) and Cx. quinquefasciatus (red). (A) Proportion ovipositing (pO), (B) fecundity (as eggs per female per gonotrophic cycle [EFGC] in Cx. pipiens, and eggs per raft, [ER] in Cx. quinequefasciatus), and (C) egg viability (EV). Points without error bars are reported means from single studies; points with error bars are averages of means from multiple studies (+ / - standard error, for visual clarity only; thermal responses were fit to reported means, see Appendix 1—figure 6). Solid lines are posterior distribution means; shaded areas are 95% credible intervals of the trait mean. See Appendix 1—figure 1 for thermal responses for Ae. vexans, Cx. theileri, and Culiseta melanura. The mean thermal responses for these traits were printed in Mordecai et al., 2019 (as part of Figure 3 in that paper) without the trait data and 95% CIs, and along with thermal responses for six other vectors. See Appendix 1—table 2 for data sources and Appendix 1—table 7 for priors.
Figure 5

Pathogen development rates (PDR) have high thermal optima.
Thermal responses of pathogen development rate (PDR). (A) West Nile virus in Culex pipiens (dark grey), Cx. quinquefasciatus (red), Cx. tarsalis (blue), and Cx. univitattus (orange). (B) Three viruses in Cx. tarsalis: West Nile virus (same as in A, blue), Western Equine Encephalitis virus (light blue), and St. Louis Encephalitis virus (dark blue). (C) Eastern Equine Encephalitis virus in Aedes triseriatus (violet), Rift Valley Fever virus in Ae. taeniorhynchus (light green), Sindbis virus in Ae. taeniorhynchus (dark green). We did not fit a thermal response for Sindbis virus in Ae. taeniorhynchus because the limited data responded weakly to temperature and did not match our priors. Points without error bars are reported means from single studies; points with error bars are averages of means from multiple studies (+ / - standard error, for visual clarity only; thermal responses were fit to reported means, see Appendix 1—figure 7). Solid lines are posterior distribution means; shaded areas are 95% credible intervals of the trait mean. The mean thermal responses for this trait were printed in Mordecai et al., 2019 (as part of Figure 4 in that paper) without the trait data and 95% CIs, combined into a single panel, and along with thermal responses for six other vector-pathogen pairs. See Appendix 1—table 5 for data sources and Appendix 1—table 8 for priors.
Figure 6
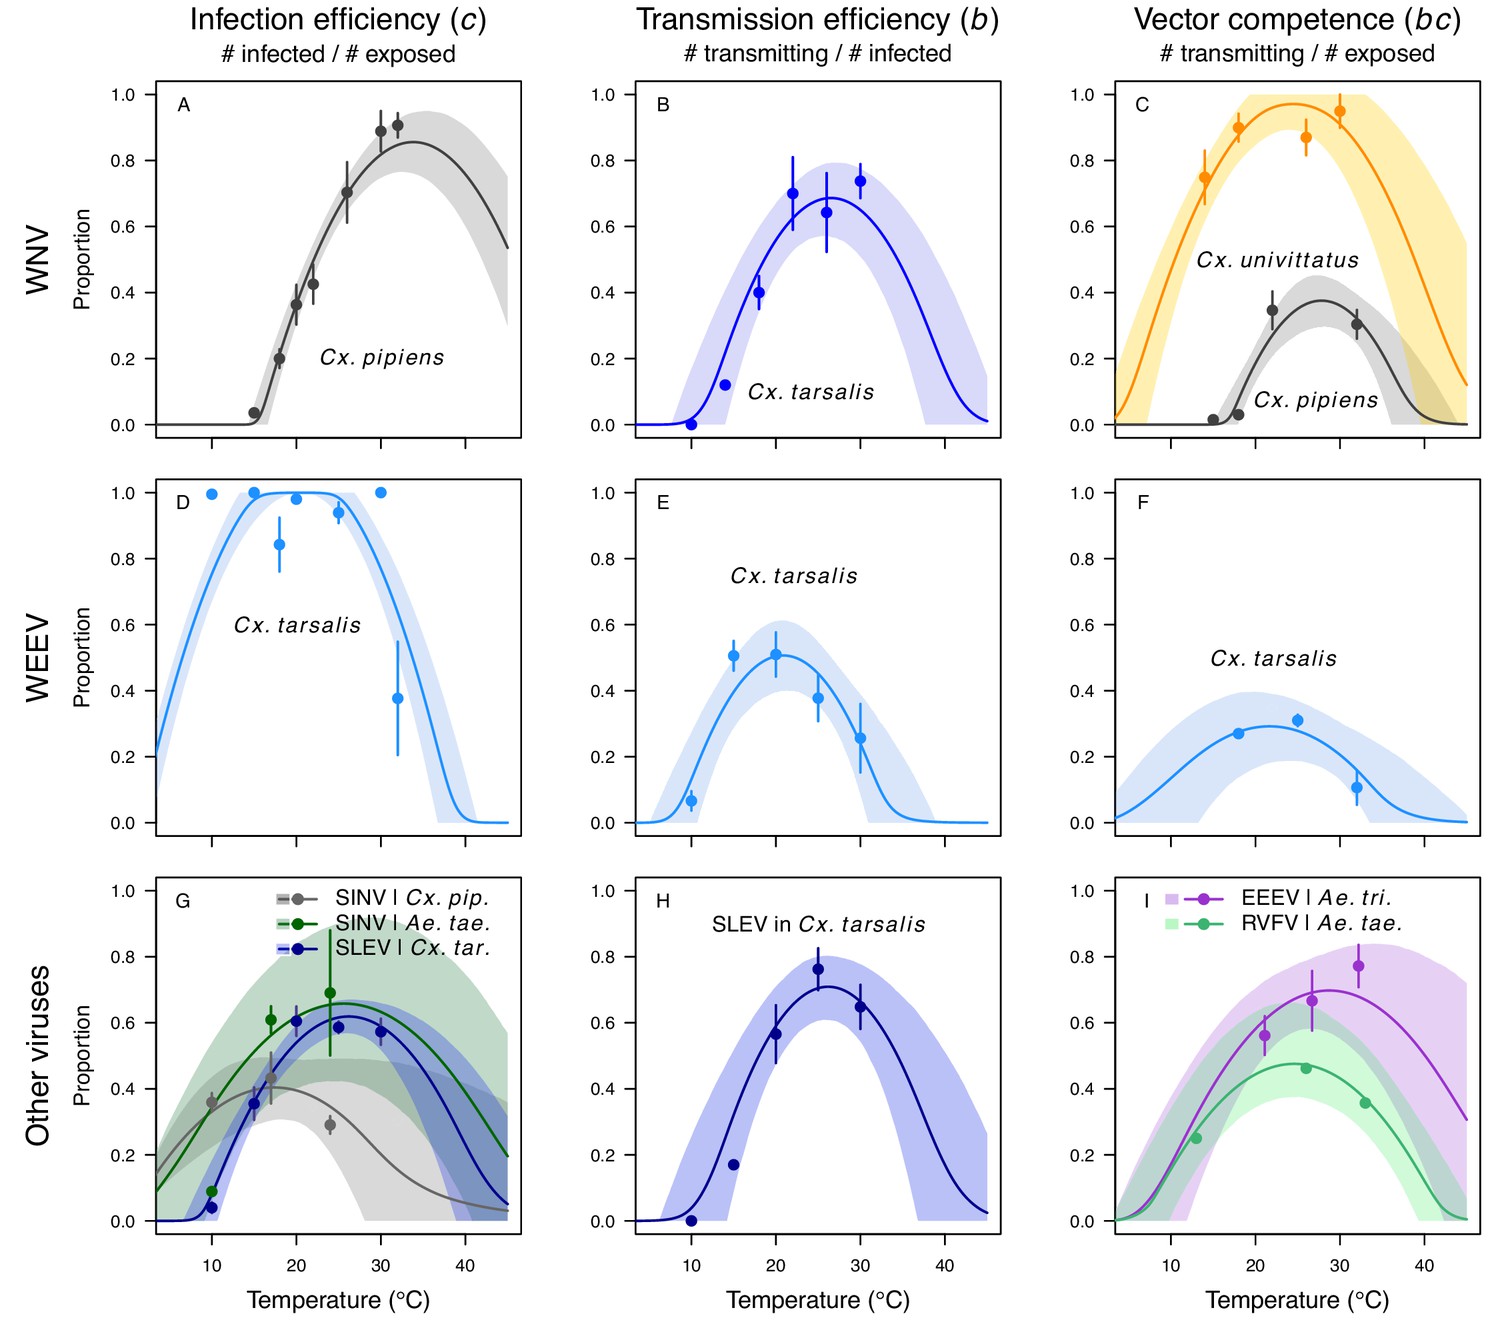
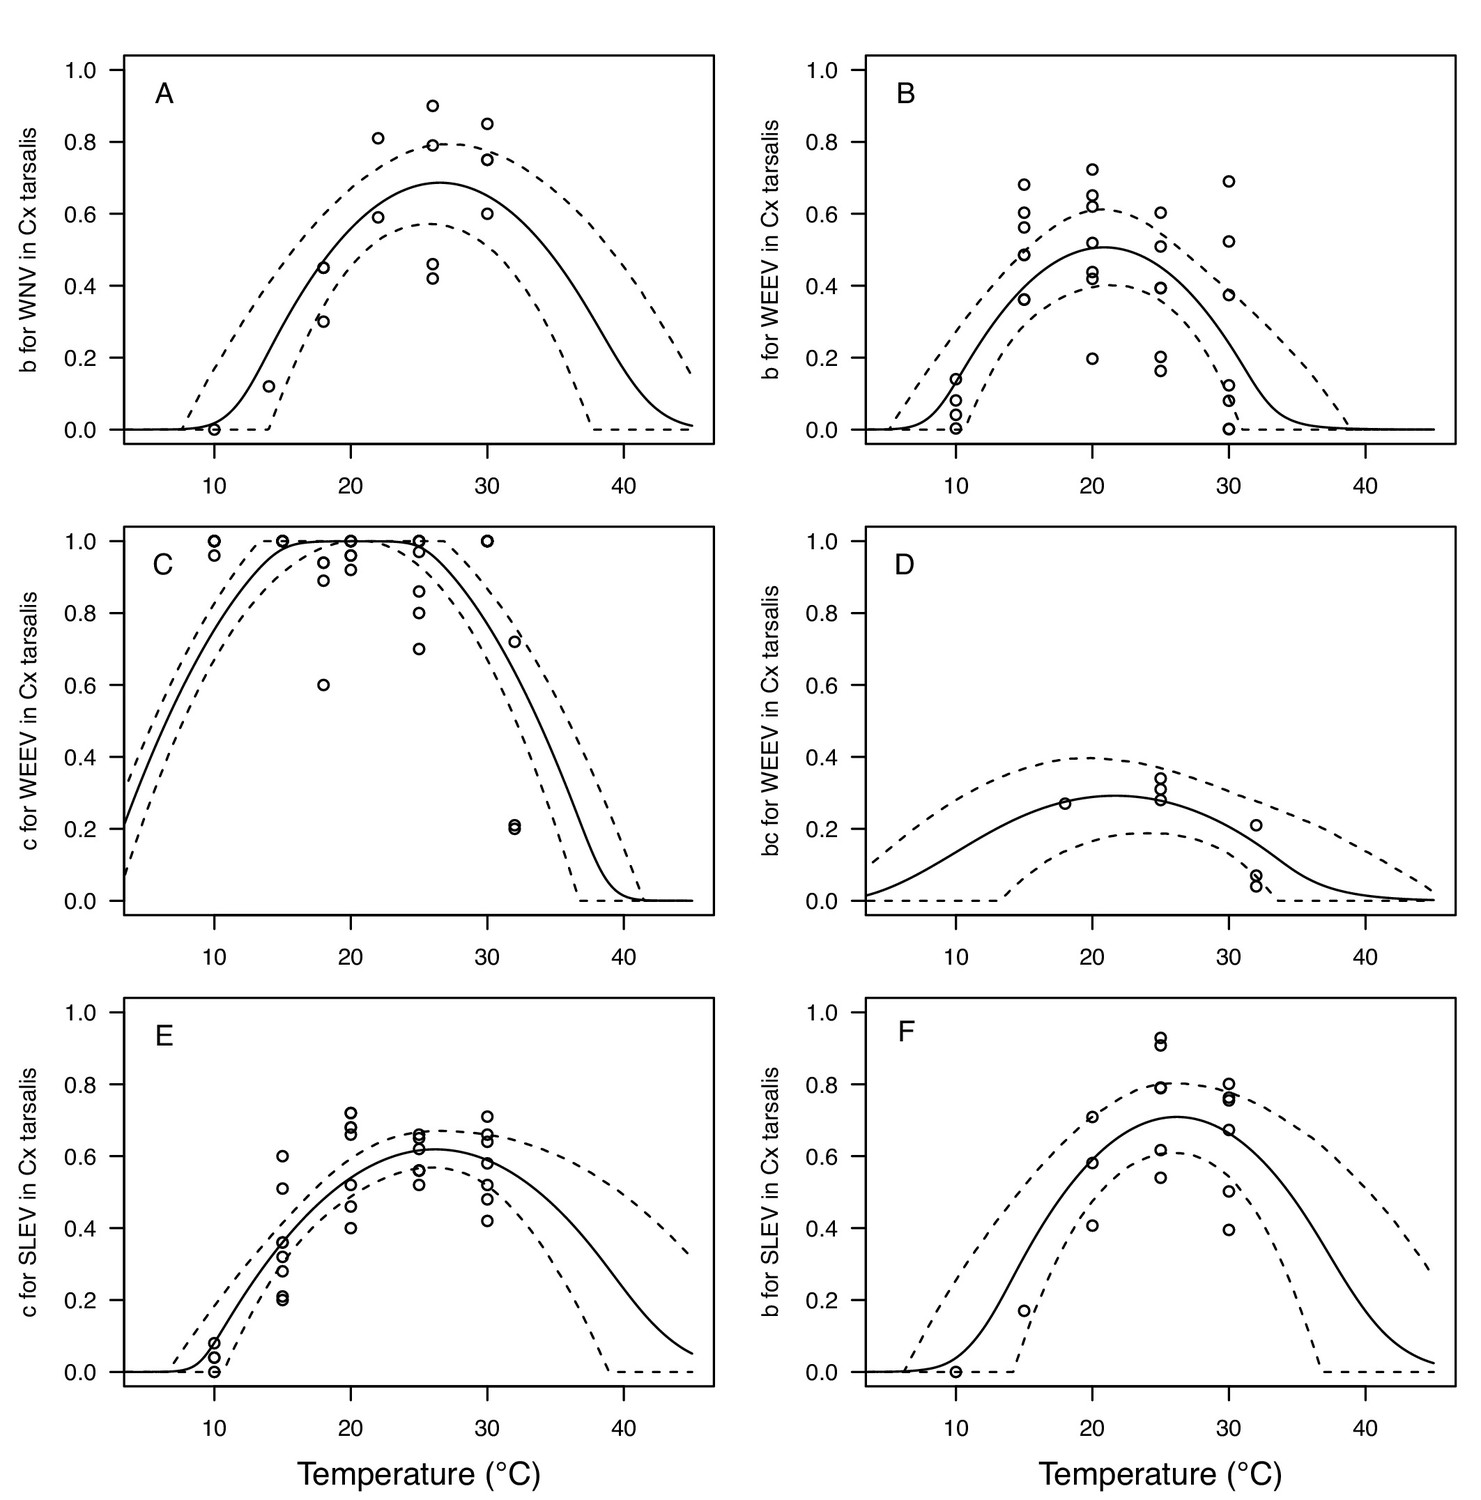
Vector competence (bc) and its component traits—infection efficiency (c) and transmission efficiency (b) respond strongly to temperature and vary across vector and virus species.
Thermal responses of infection efficiency (c, # infected / # exposed; first column), transmission efficiency (b, # transmitting / # infected; second column) or vector competence (bc, # infected / # exposed; third column) for vector–virus pairs. First row (A,B,C): West Nile virus in Culex pipiens (dark grey), Cx. tarsalis (blue), and Cx. univitattus (yellow/orange). Second row: (D,E,F) Western Equine Encephalitis virus in Cx. tarsalis (light blue). Third row (G,H,I): Sindbis virus in Aedes taeniorhynchus (dark green), Sindbis virus in Cx. pipiens (light gray), St. Louis Encephalitis virus in Cx. tarsalis (dark blue), Eastern Equine Encephalitis virus in Ae. triseriatus (violet), and Rift Valley Fever virus in Ae. taeniorhynchus (light green). Points are means of replicates from single or multiple studies (+ / - standard error, for visual clarity only; thermal responses were fit to replicate-level data, see Appendix 1—figures 8 and 9). Solid lines are posterior distribution means; shaded areas are 95% credible intervals of the trait mean. The mean thermal responses for these traits were printed in Mordecai et al., 2019 (as part of Figure 4 in that paper) without the trait data and 95% CIs, combined into fewer panels, and along with thermal responses for six other vector-pathogen pairs. See Appendix 1—table 4 for data sources and Appendix 1—table 8 for priors.
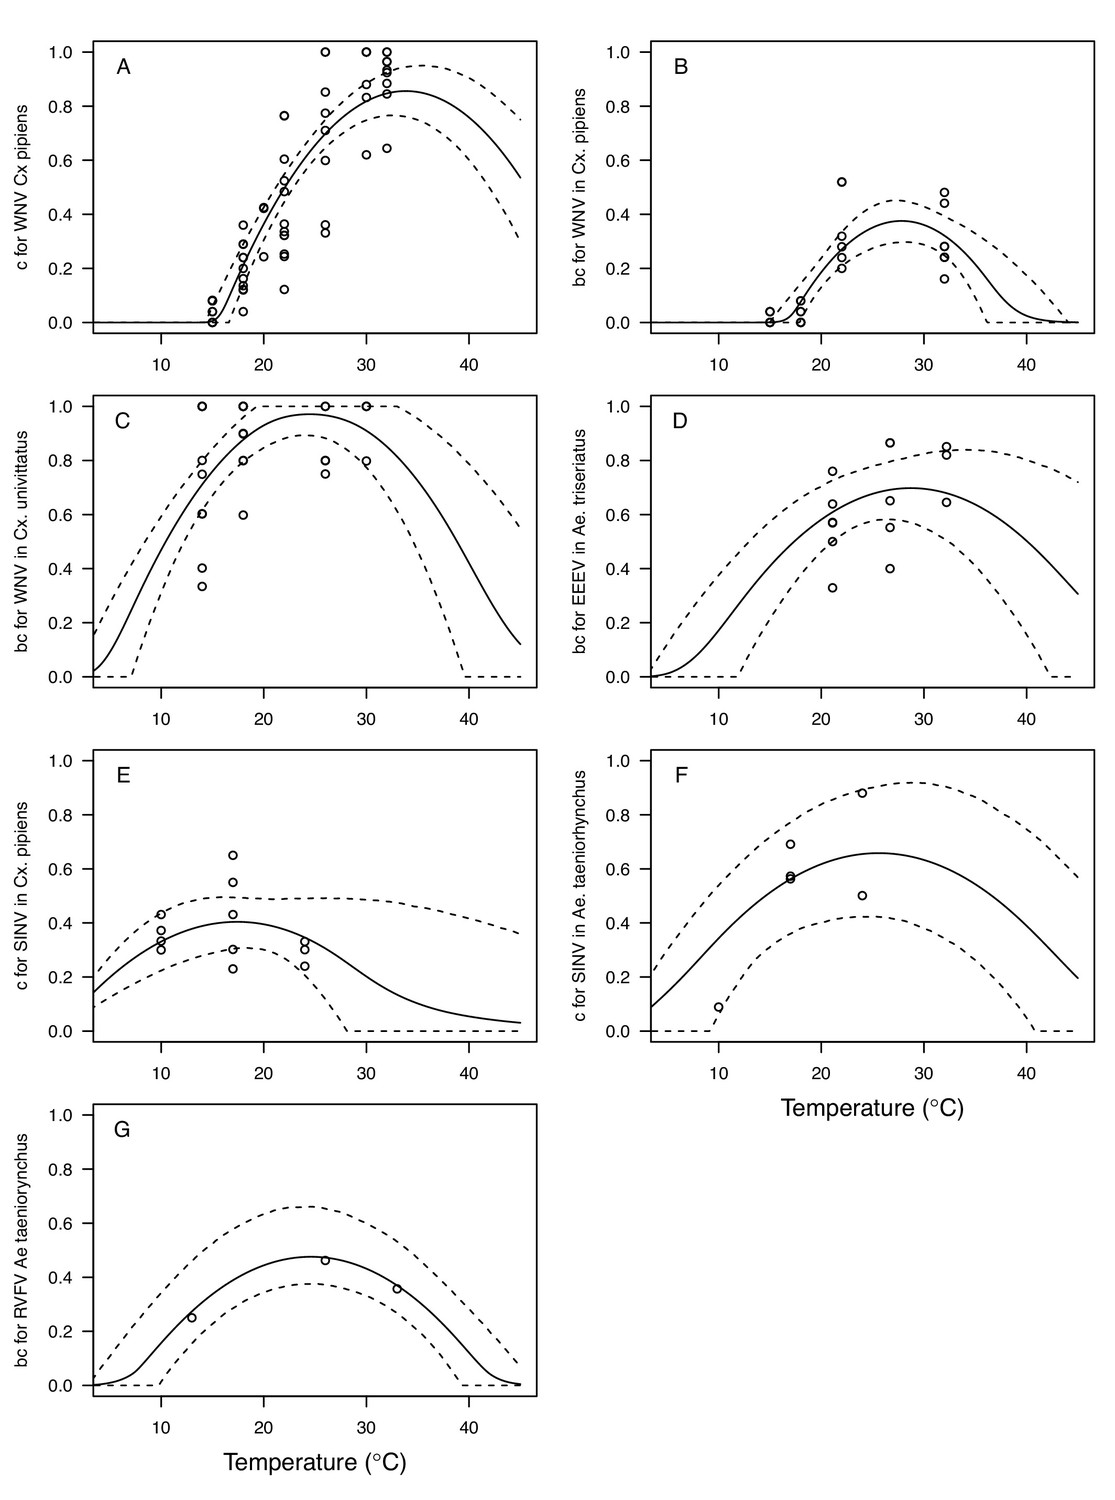
Figure 7
Unimodal thermal responses of transmission (relative R0) for ten vector-virus pairs.
Posterior mean relative R0 for (A) West Nile virus (WNV) in Culex pipiens (dark grey), Cx. tarsalis (blue), Cx. quinquefasciatus (red), and Cx. univitattus (orange); (B) three viruses in Cx. tarsalis: WNV (same as in A, blue), Western Equine Encephalitis virus (WEEV, light blue), and St. Louis Encephalitis virus (SLEV, dark blue); (C) Sindbis virus (SINV) in Aedes taeniorhynchus (dark green) and Cx. pipiens (light grey), Rift Valley Fever virus (RVFV) in Ae. taeniorhynchus (light green), and Eastern Equine Encephalitis virus (EEEV) in Ae. triseriatus (violet). (D) Posterior median and uncertainty estimates for the lower thermal limit, optimum, and upper thermal limit. Points show medians, thick lines show middle 50% density, thin lines show 95% credible intervals. Models are ordered by increasing median optimal temperature. The thermal responses for R0 were printed in Mordecai et al., 2019 (as Figure 2 in that paper, reproduced here as Appendix 1—table 10), combined into two total panels and along with six other vector-pathogen pairs. See Appendix 1—figure 21 for histograms of lower thermal limit, optimum, and upper thermal limit for each model.
Figure 8
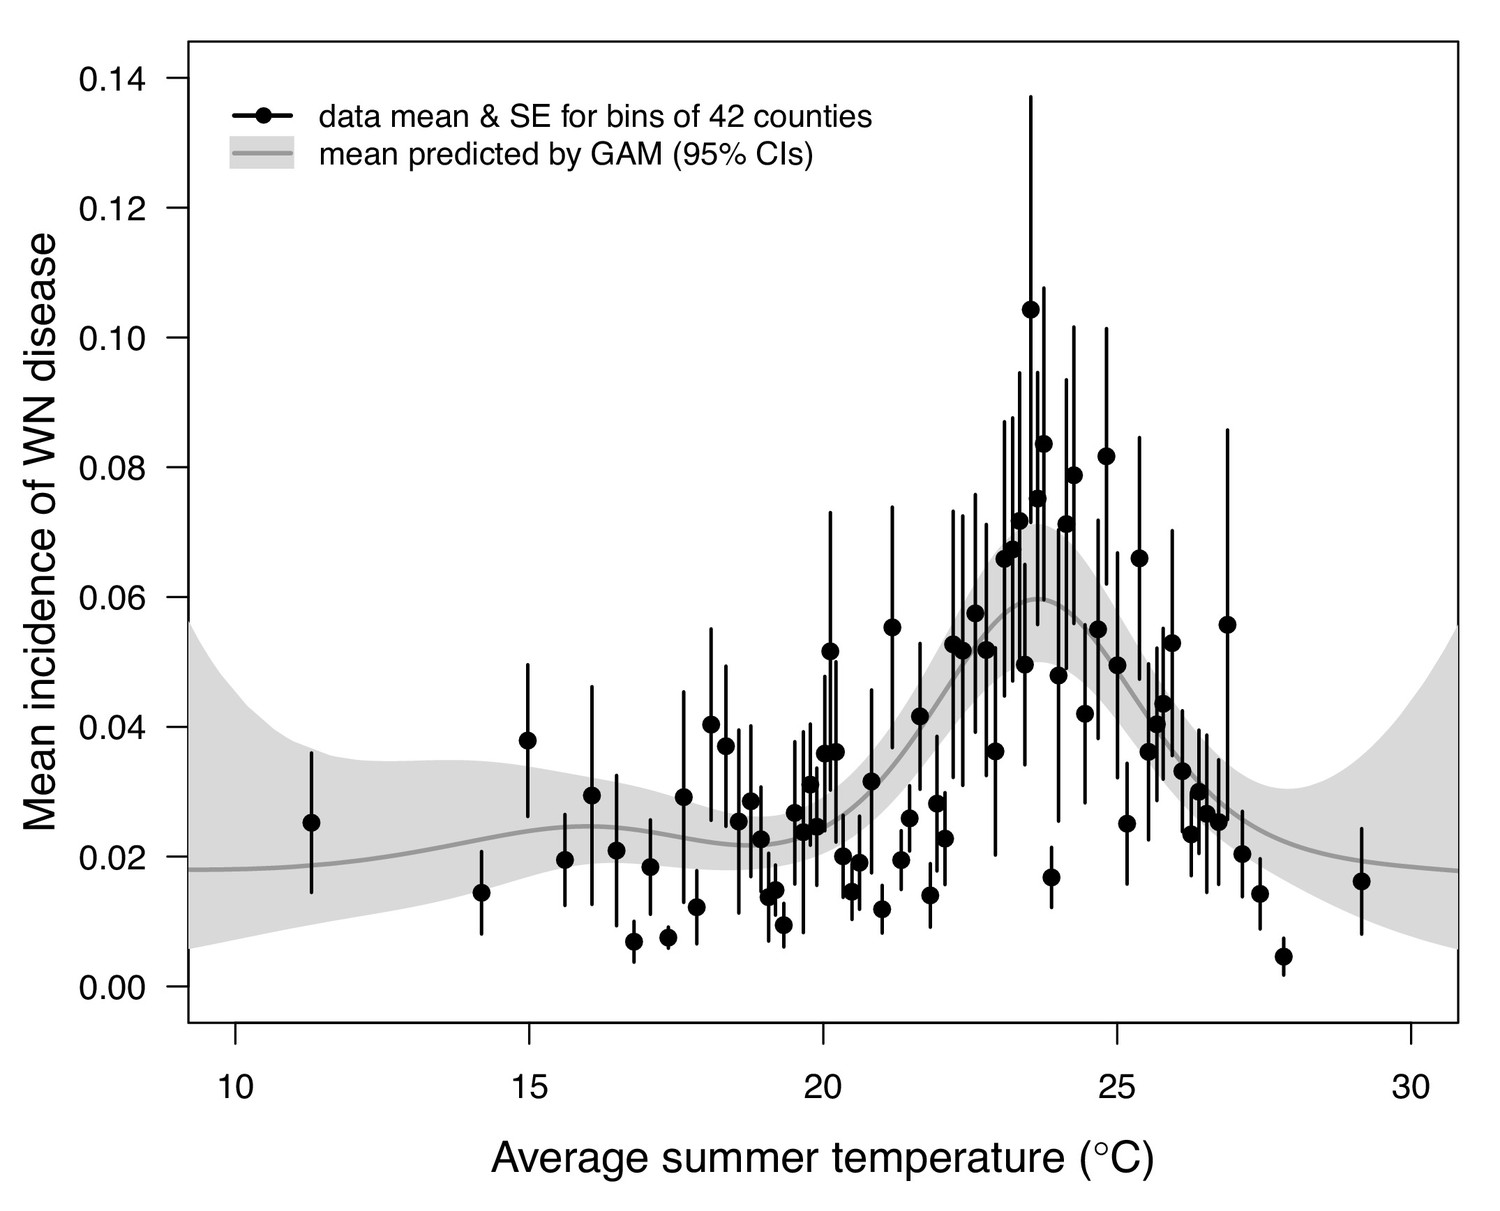
Incidence of human neuroinvasive West Nile disease across US counties responds unimodally to temperature, peaking at 24°C.
Grey line: predicted mean incidence from a generalized additive model (GAM) fit to county-level data (n = 3109) of mean temperature from May-September and incidence of neuroinvasive West Nile disease per 1000 people, both averaged from 2001 to 2016. Black points: mean incidence (with standard error bars) for bins of 42 counties (for visual clarity). See Appendix 1—figure 24 for fits across a range of smoothing parameters. See Appendix 1—figure 25 for LOESS (moving average) fits of the data. A version of the LOESS analysis was published as Figure S3 in Mordecai et al., 2019.
Figure 9
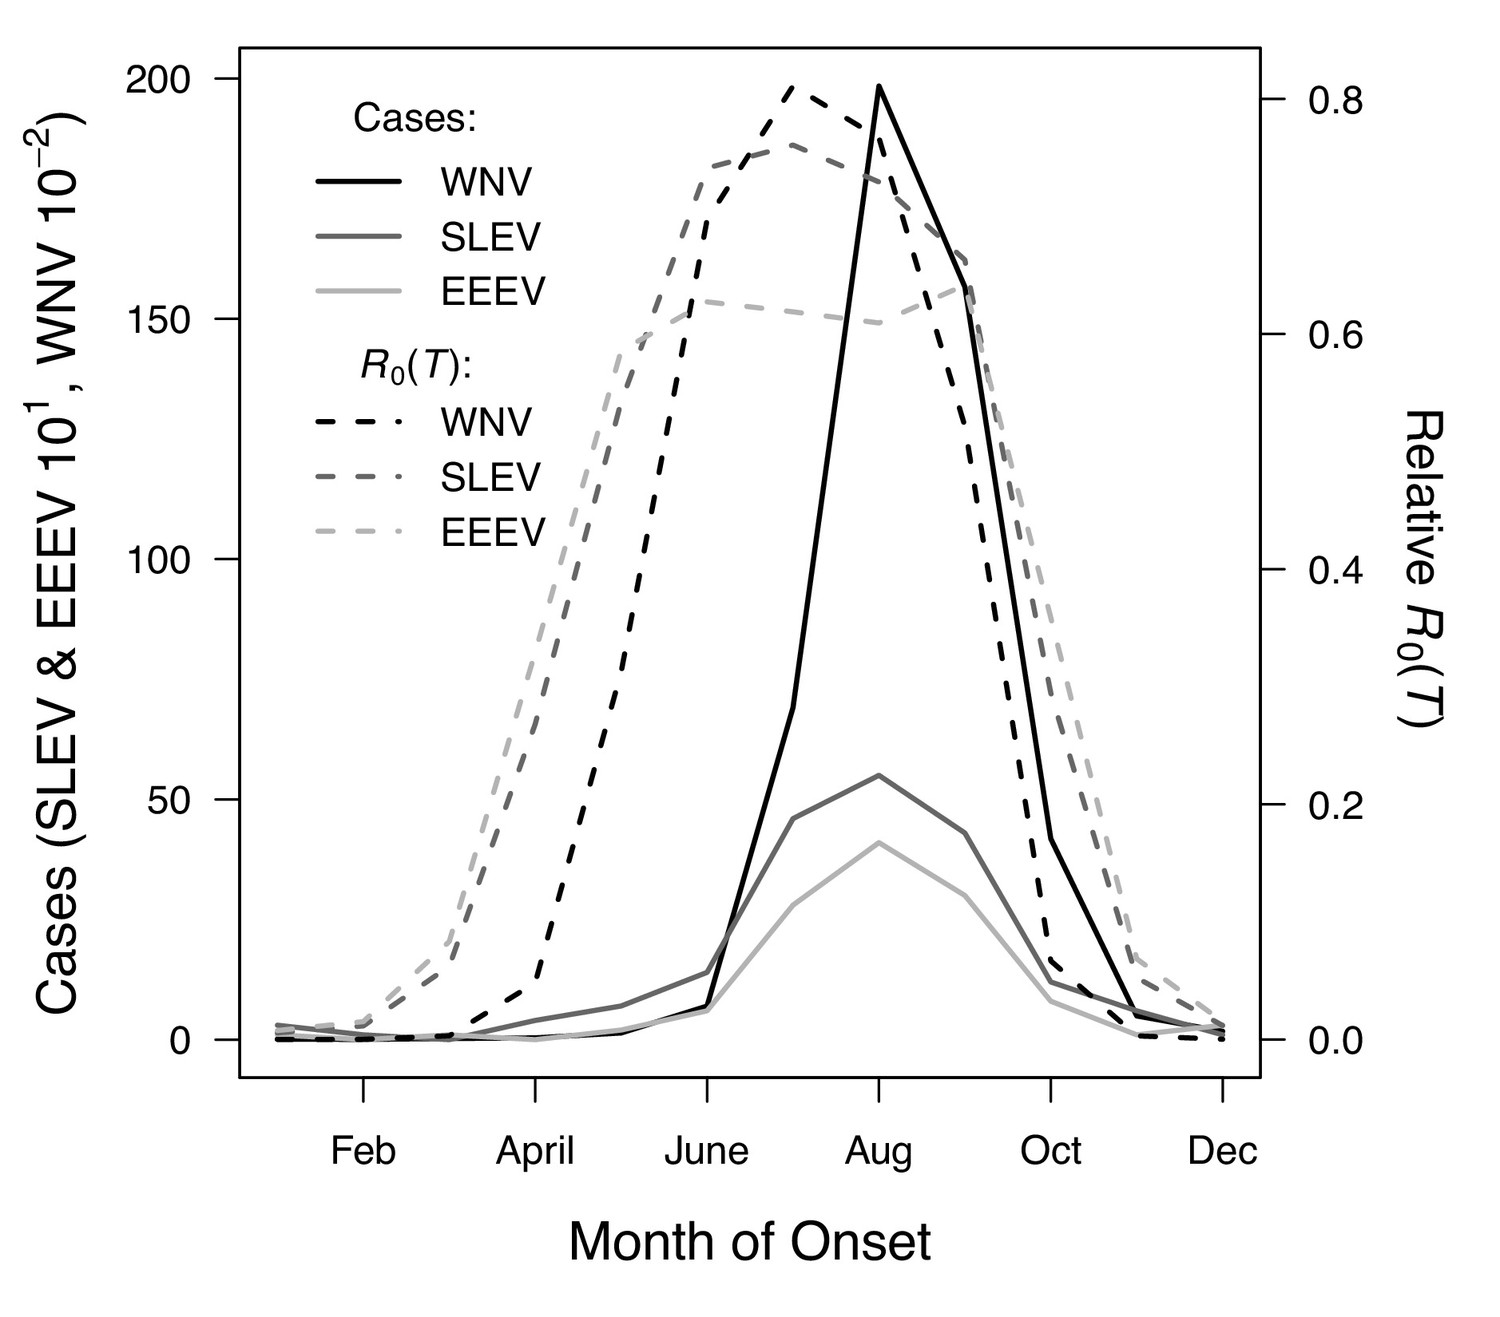
R0(T) predicts the seasonal pattern of human cases of mosquito-borne viral diseases.
Incidence (solid lines) lags behind predicted temperature-dependent R0 (dashed lines) for human cases of neuroinvasive disease caused by West Nile virus (WNV, black), St. Louis encephalitis virus (SLEV, dark gray), and Eastern Equine Encephalitis virus (EEEV, light gray) by 2 months. This lag matches patterns in other mosquito-borne diseases and is caused by the time required for mosquito populations to increase, become infectious, and bite humans, and for humans to present symptoms and seek medical care. However, the predicted lag is not present at the end of the transmission season in October, when R0(T) and incidence decline in tandem.
Appendix 1—figure 1
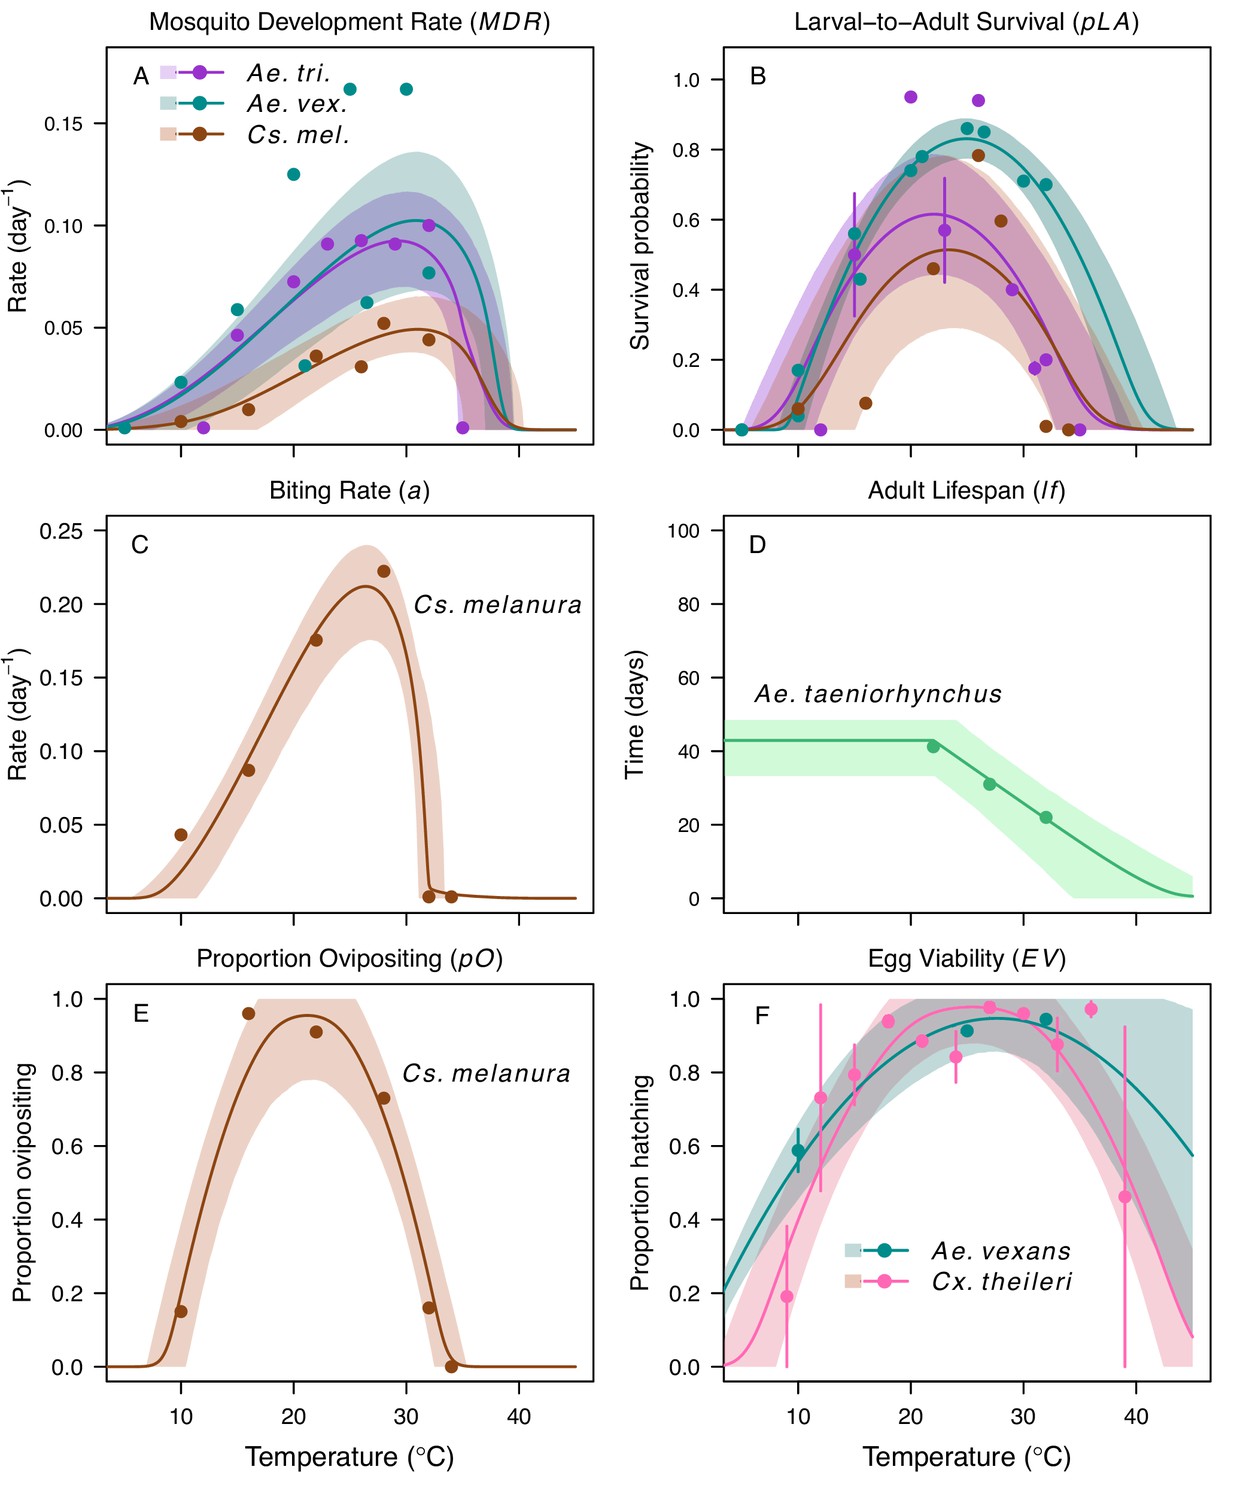
Thermal responses for mosquito traits in additional vector species.
Ae. taeniorhynchus (green), Ae. triseriatus (violet), Aedes vexans (teal), Cx. theileri (pink), and Culiseta melanura (brown). (A) Mosquito development rate (MDR), (B) larval-to-adult survival (pLA), and (C) biting rate (a), (D) lifespan (lf), (E) proportion ovipositing (pO) and (F) egg viability (EV). Points without error bars are reported means from single studies; points with error bars are averages of means from multiple studies (+ / - standard error, for visual clarity only; thermal responses were fit to reported means). Solid lines are posterior distribution means; shaded areas are 95% credible intervals. The median thermal responses for these traits were printed in Mordecai et al., 2019 (as part of Figure 3) without the trait data and 95% CIs and along with thermal responses for six other vectors.
Appendix 1—figure 2
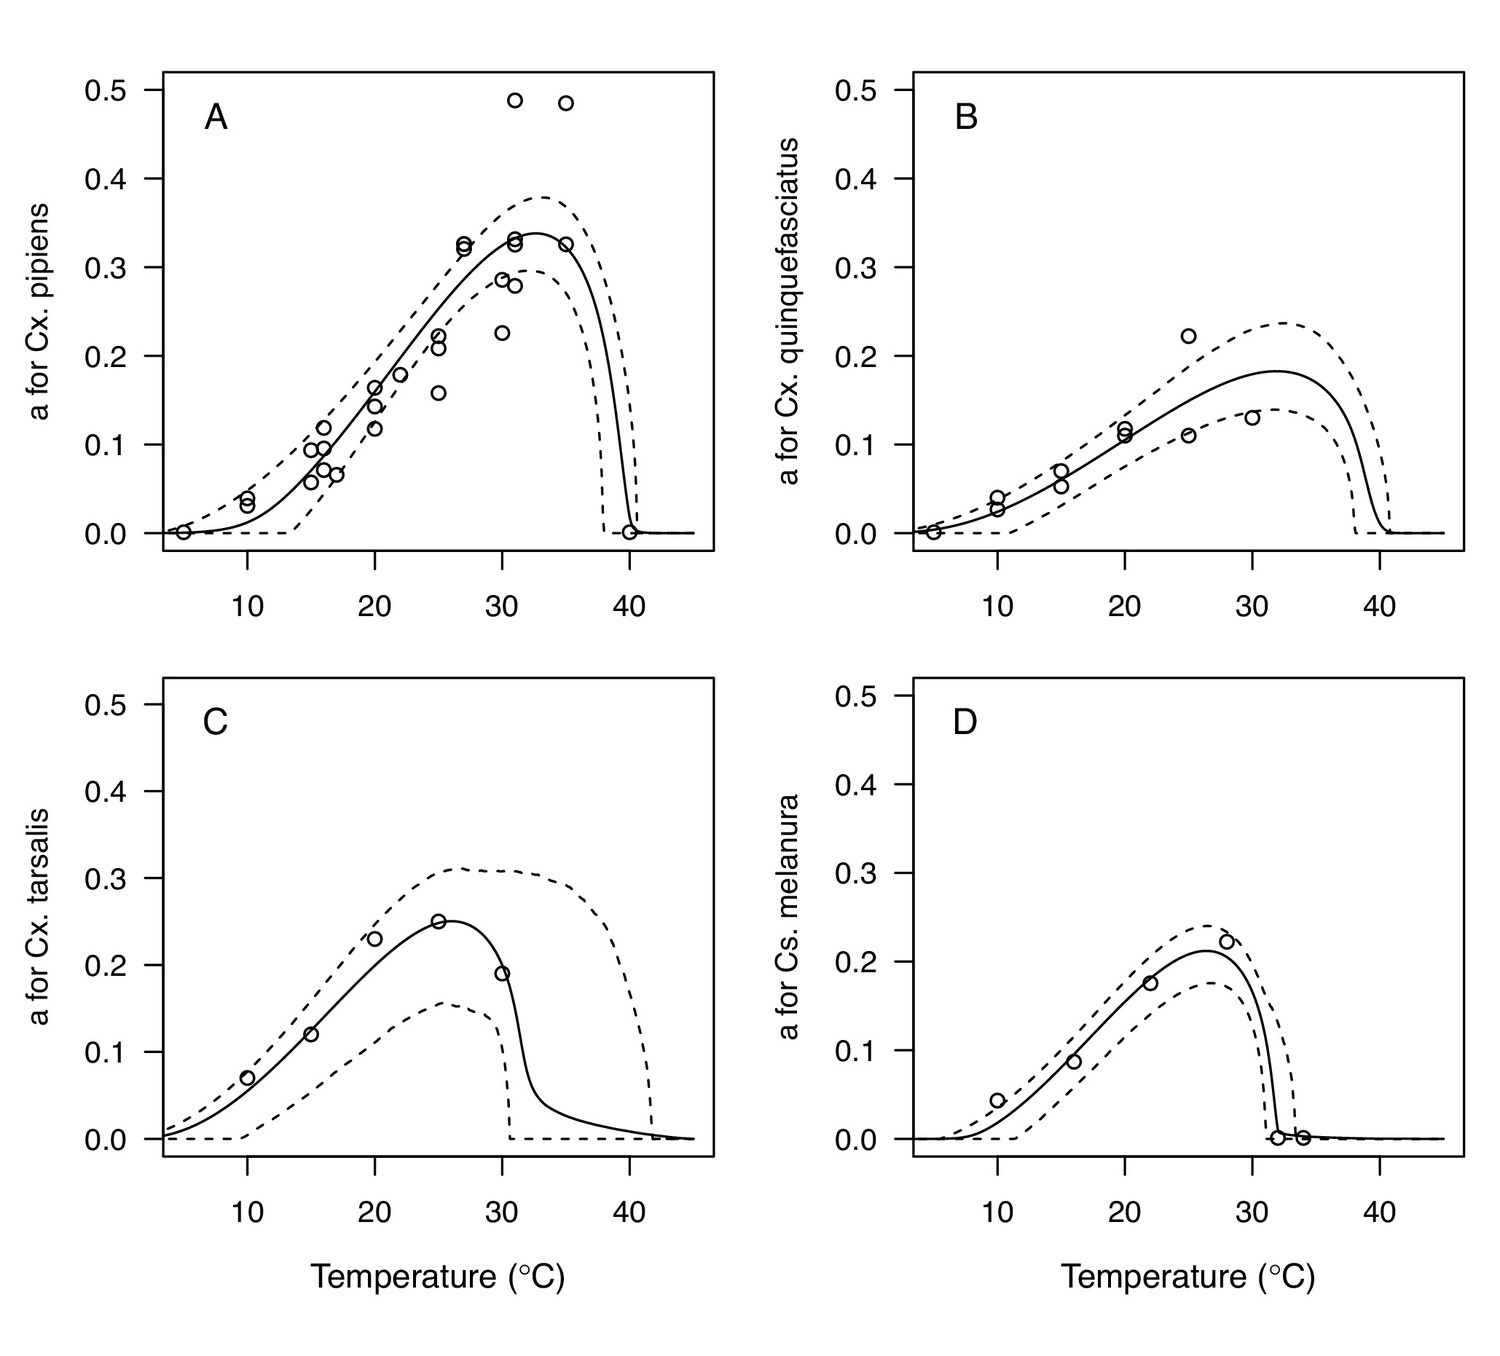
Thermal responses for biting rate (a) showing individual data points.
(A) Culex pipiens, (B), Cx. quinquefasciatus, (C) Cx. tarsalis, and (D) Culiseta melanura. Solid lines are posterior distribution means for the mean thermal response; black dashed lines are 95% credible intervals for the mean thermal response; red dashed lines are 95% prediction intervals for observed data (incorporating the fitted variance).
Appendix 1—figure 3
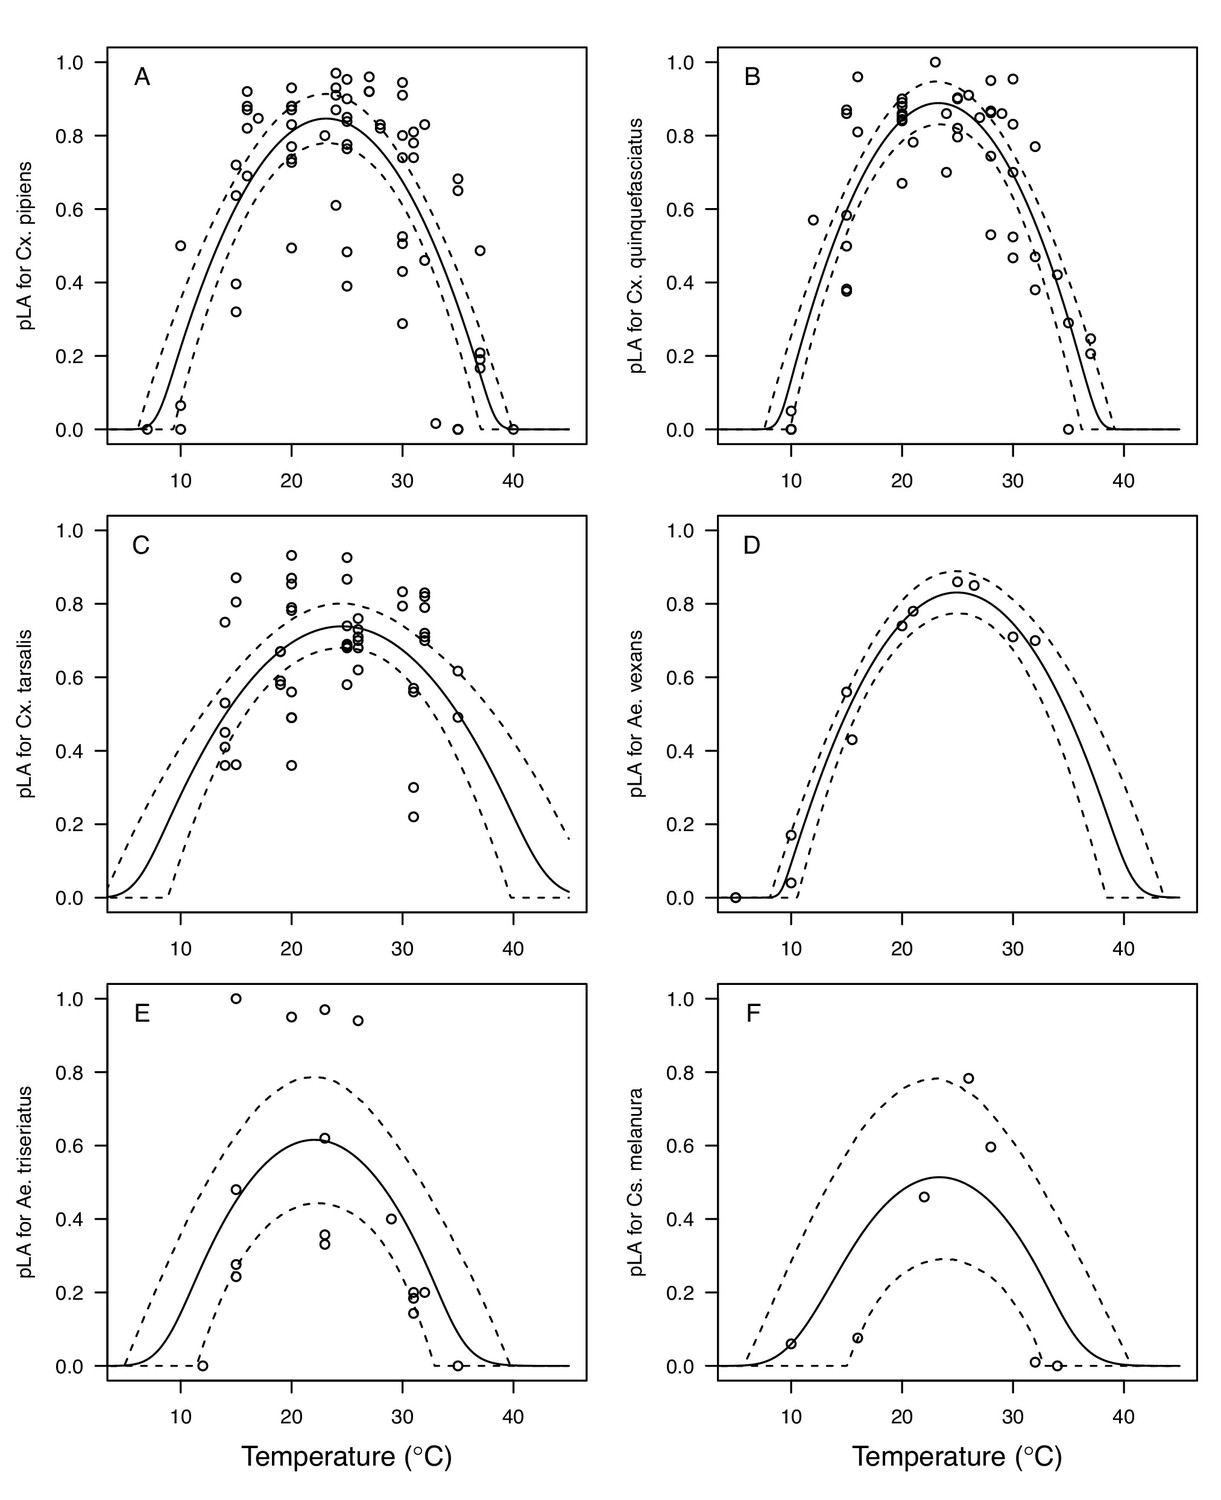
Thermal responses for larval-to-adult survival (pLA) showing individual data points.
(A) Culex pipiens, (B), Cx. quinquefasciatus, (C) Cx. tarsalis, (D) Aedes vexans, (E) Ae. triseriatus, and (F) Culiseta melanura. Solid lines are posterior distribution means for the mean thermal response; black dashed lines are 95% credible intervals for the mean thermal response; red dashed lines are 95% prediction intervals for observed data (incorporating the fitted variance).
Appendix 1—figure 4
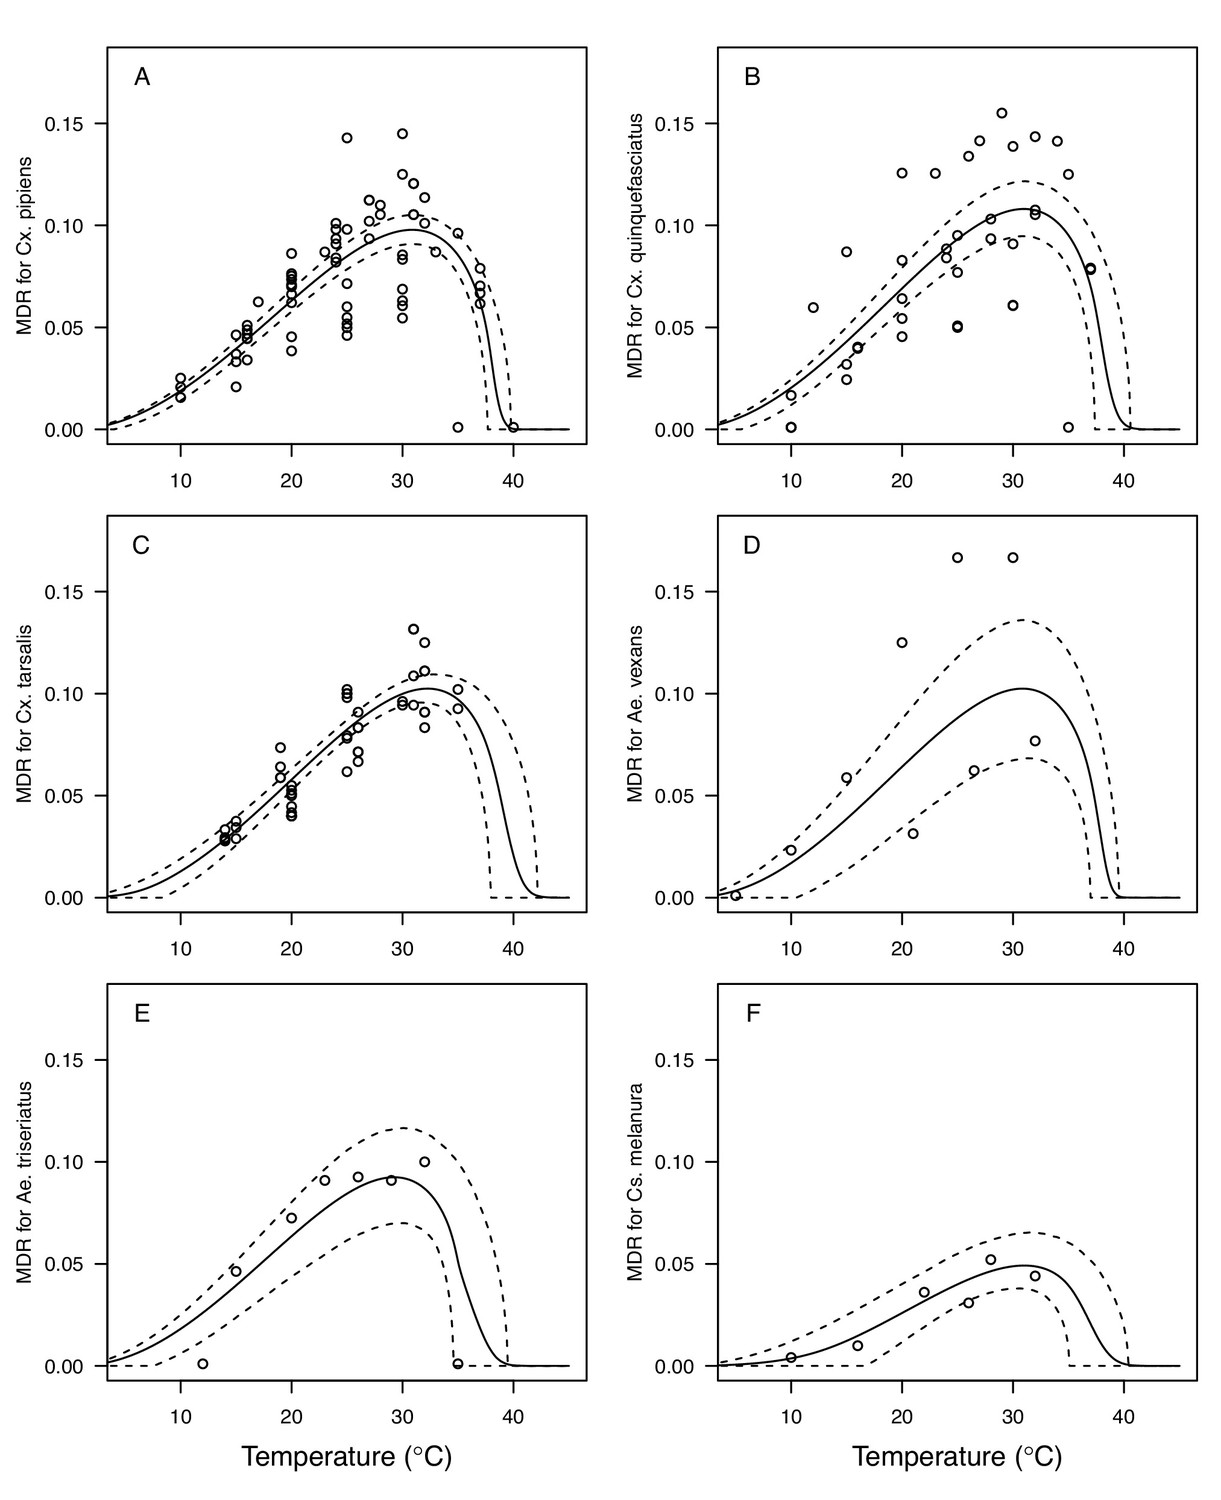
Thermal responses for mosquito development rate (MDR) showing individual data points.
(A) Culex pipiens, (B), Cx. quinquefasciatus, (C) Cx. tarsalis, (D) Aedes vexans, (E) Ae. triseriatus, and (F) Culiseta melanura. Solid lines are posterior distribution means for the mean thermal response; black dashed lines are 95% credible intervals for the mean thermal response; red dashed lines are 95% prediction intervals for observed data (incorporating the fitted variance).
Appendix 1—figure 5
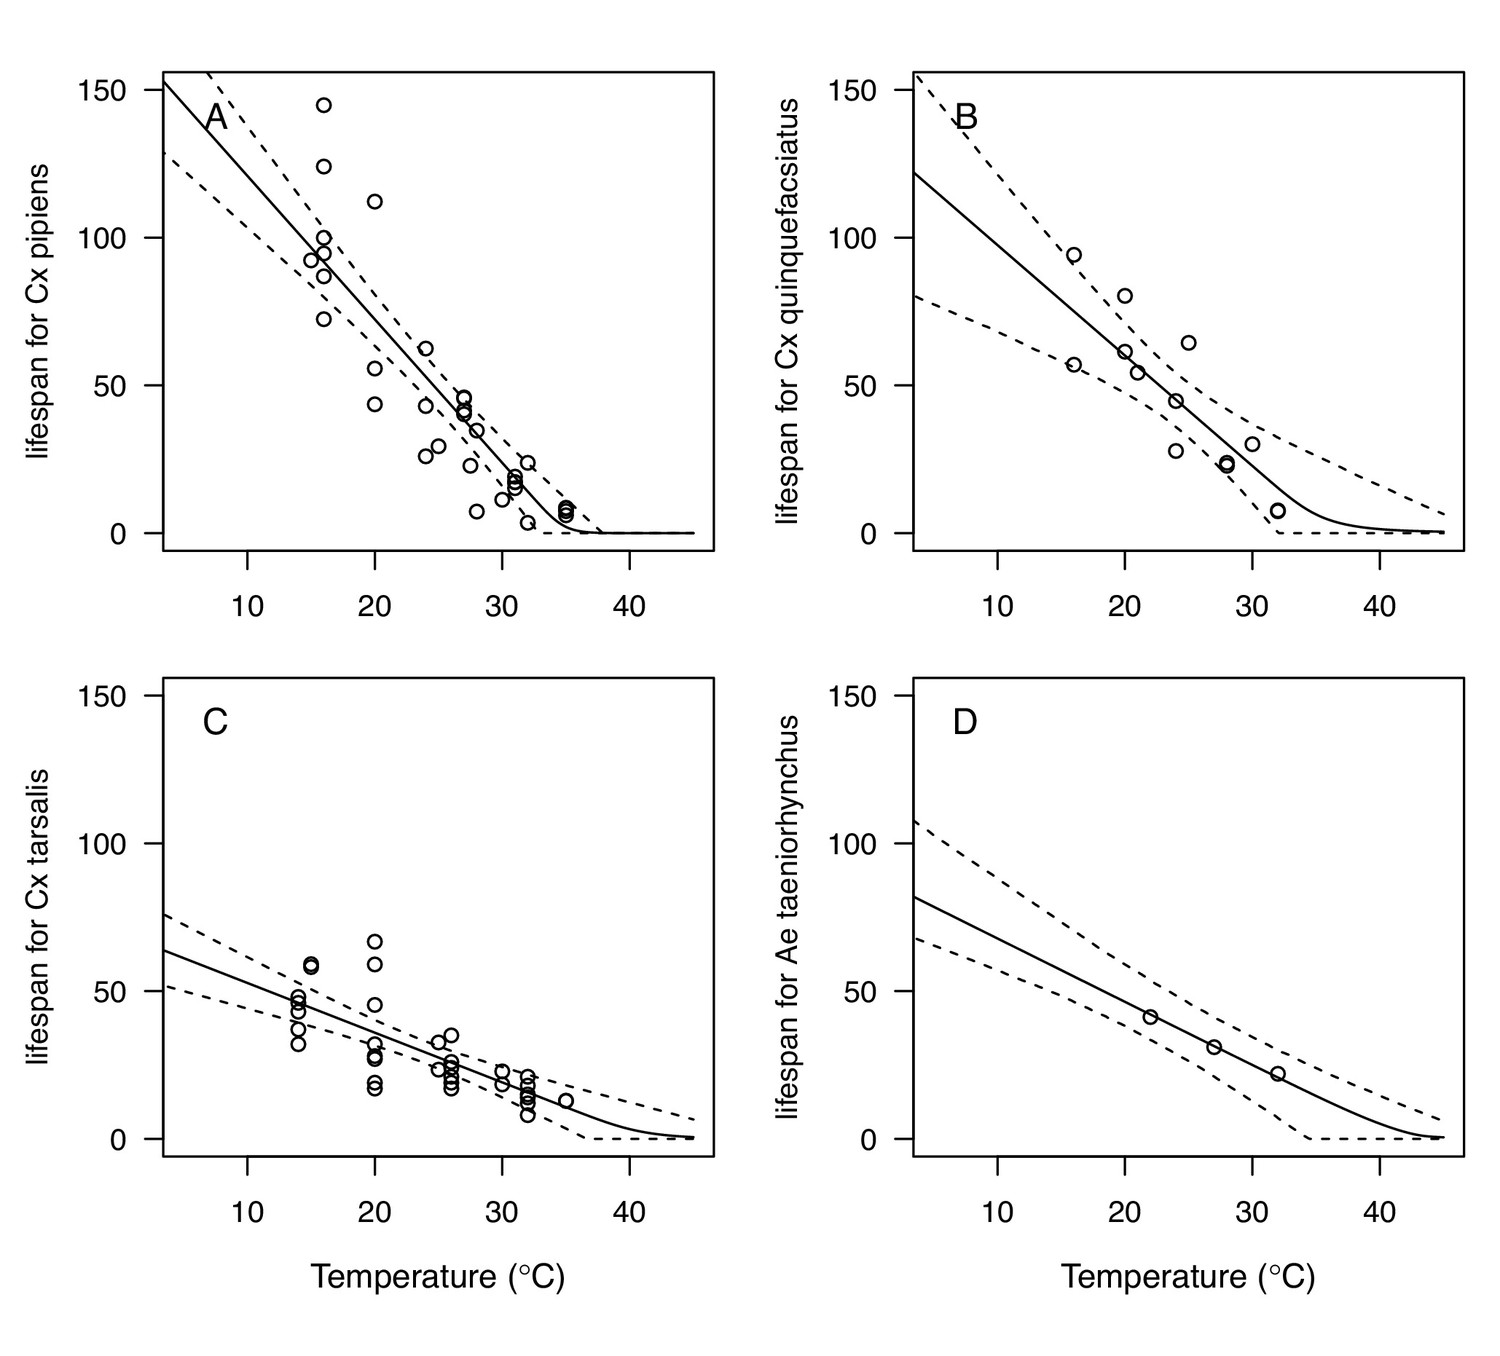
Thermal responses for adult mosquito lifespan (lf) showing individual data points.
(A) Culex pipiens, (B), Cx. quinquefasciatus, (C) Cx. tarsalis, and (D) Aedes taeniorhynchus. When data were reported by sex, only female data were used. Solid lines are posterior distribution means for the mean thermal response; black dashed lines are 95% credible intervals for the mean thermal response; red dashed lines are 95% prediction intervals for observed data (incorporating the fitted variance).
Appendix 1—figure 6
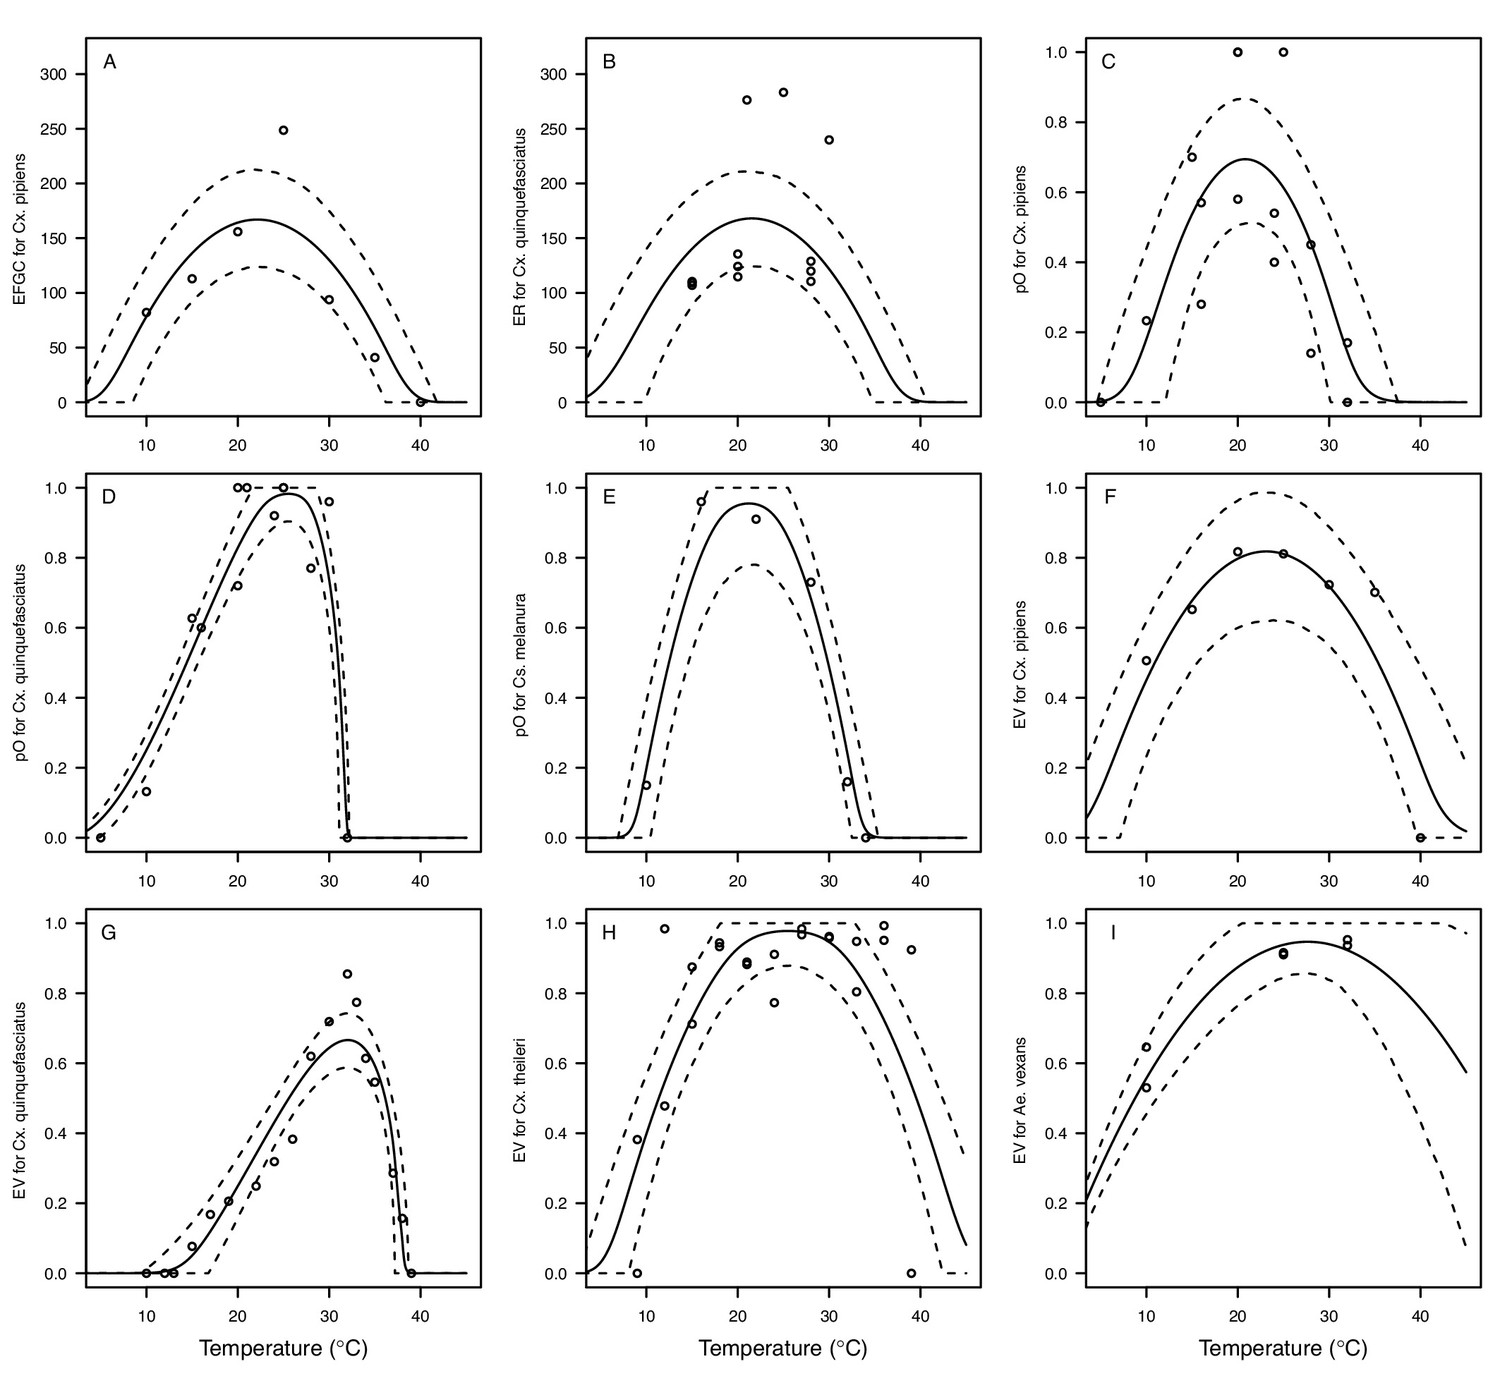
Thermal responses for fecundity traits showing individual data points.
Traits: (A) Reproduction measured as eggs per female per gonotrophic cycle (EFGC), (B) reproduction measured as eggs per raft (ER) (C–E) proportion ovipositing (pO), and (F–I) egg viability (EV). Vector species: (A,C,F) Culex pipiens, (B,D,G), Cx. quinquefasciatus, (E) Culiseta melanura, (H) Cx. theileri, and (I) Aedes vexans. Solid lines are posterior distribution means for the mean thermal response; black dashed lines are 95% credible intervals for the mean thermal response; red dashed lines are 95% prediction intervals for observed data (incorporating the fitted variance).
Appendix 1—figure 7

Thermal responses for pathogen development rate (PDR) showing individual data points.
(A) West Nile virus (WNV) in Culex pipiens, (B), WNV in Cx. quinquefasciatus, (C) WNV in Cx. tarsalis, (D) WNV in Cx. univittatus, (E) St. Louis Encephalitis virus (SLEV) in Cx. tarsalis, (F) Western Equine Encephalitis virus (WEEV) in Cx. tarsalis, and (G) Eastern Equine Encephalitis virus (EEEV) in Aedes triseriatus. Solid lines are posterior distribution means for the mean thermal response; black dashed lines are 95% credible intervals for the mean thermal response; red dashed lines are 95% prediction intervals for observed data (incorporating the fitted variance).
Appendix 1—figure 8
Thermal responses for vector competence traits in Culex tarsalis, showing individual data points.
Traits: (A,B,F) transmission efficiency (b, # transmitting / # infected), (C,E) infection efficiency (c, # infected / # exposed), and (D) vector competence (bc, # infected / # exposed). Viruses: (A) West Nile virus (WNV), (B–D) Western Equine Encephalitis virus (WEEV), (E,F) St. Louis Encephalitis virus (SLEV). Solid lines are posterior distribution means for the mean thermal response; black dashed lines are 95% credible intervals for the mean thermal response; red dashed lines are 95% prediction intervals for observed data (incorporating the fitted variance).
Appendix 1—figure 9
Thermal responses for vector competence traits showing individual data points.
Traits: (A,E,F) infection efficiency (c, # infected / # exposed) and (B,C,D,G) vector competence (bc, # infected / # exposed). Viruses and vectors: (A,B) West Nile virus (WNV) in Culex pipiens, (C) WNV in Cx. univittatus, (D) Eastern Equine Encephalitis virus (EEEV) in Ae. triseriatus, (E) Sindbis virus (SINV) in Culex pipiens, (F) SINV in Aedes taeniorhynchus, and (G) Rift Valley Fever virus (RVFV) in Ae. taeniorhynchus. Solid lines are posterior distribution means for the mean thermal response; black dashed lines are 95% credible intervals for the mean thermal response; red dashed lines are 95% prediction intervals for observed data (incorporating the fitted variance).
Appendix 1—figure 10
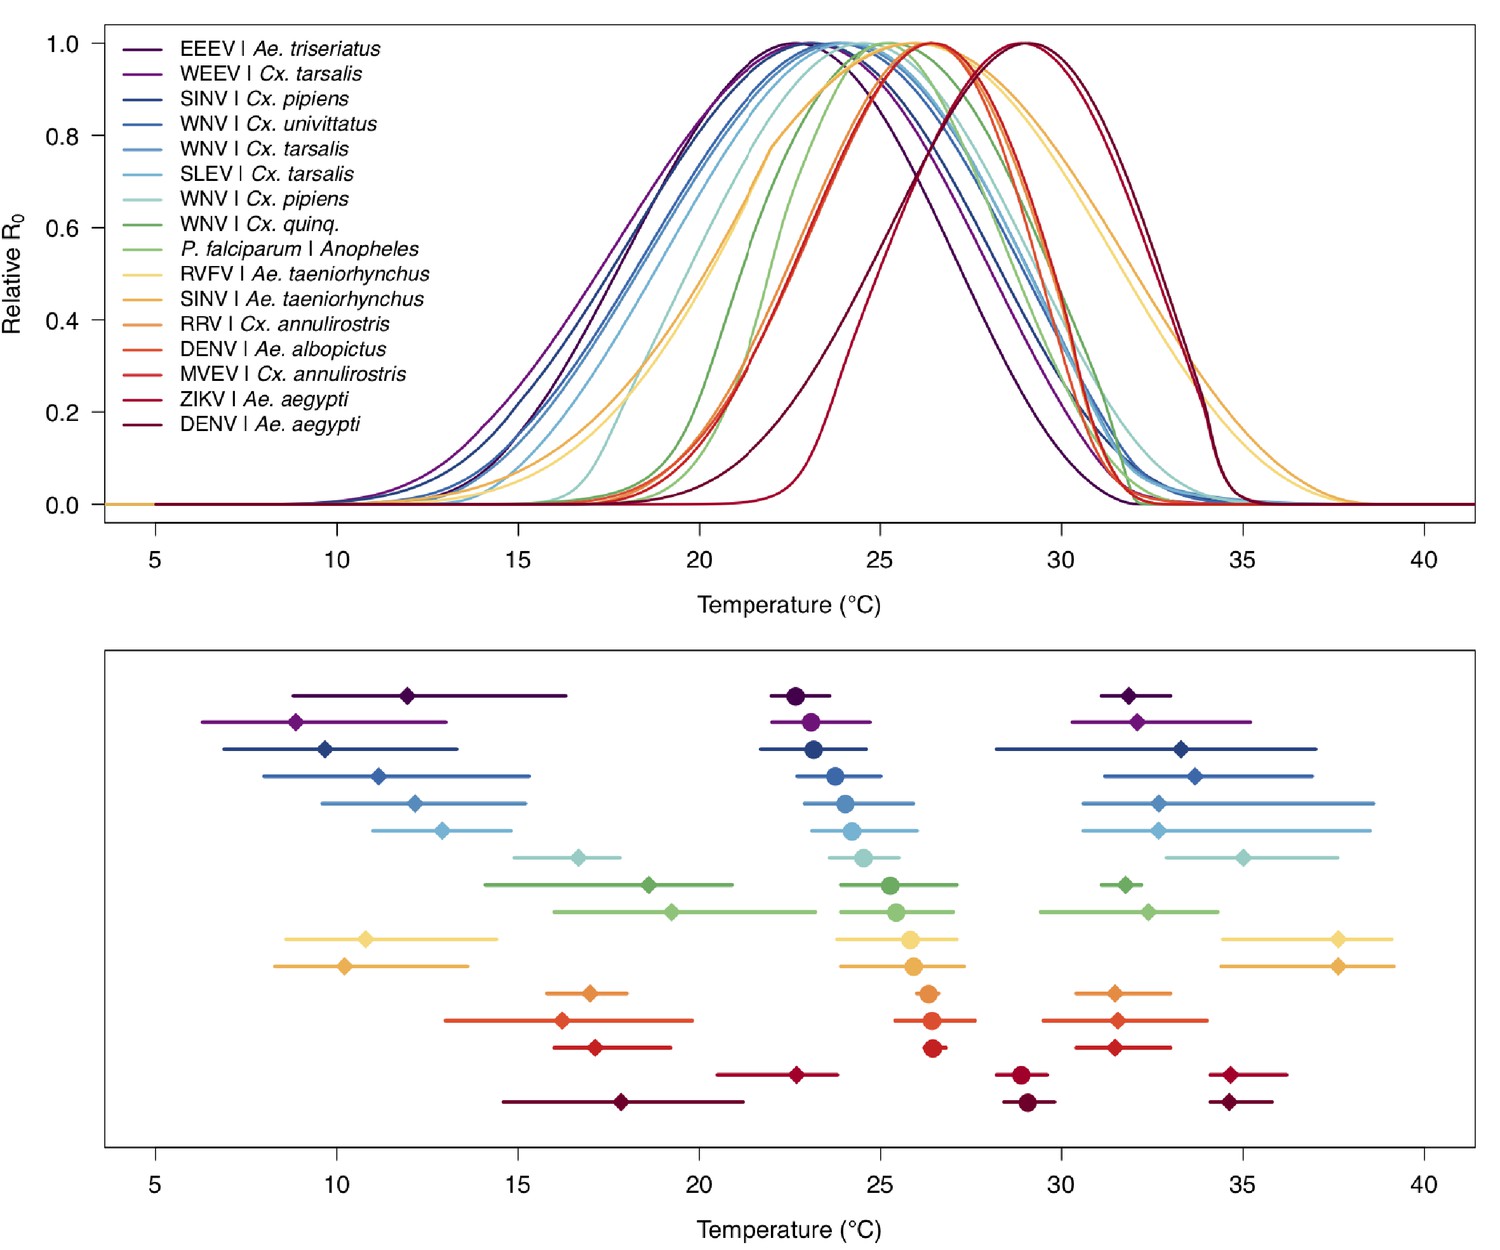
Medians and 95% credible intervals for thermal limits and optima of R0 models across temperate and tropical mosquito-borne disease systems.
Models in order from top to bottom: Eastern Equine Encephalitis virus (EEEV) in Aedes triseriatus (dark purple; this paper), Western Equine Encephalitis virus (WEEV) in Culex. tarsalis (light purple; this paper), Sindbis virus (SINV) in Cx. pipiens (dark blue; this paper), West Nile virus (WNV) in Cx. univittatus (medium blue; this paper), WNV in Cx. tarsalis (light blue, this paper), St. Louis Encephalitis virus (SLEV) in Cx. tarsalis (dark teal; this paper), WNV in Cx. pipiens (light teal; this paper), WNV in Cx. quinquefasciatus (dark green; this paper), Plasmodium falciparum malaria in Anopheles spp. (light green; Johnson et al., 2015), Rift Valley Fever virus (RVFV) in Ae. taeniorhynchus (yellow; this paper), SINV in Ae. taeniorhynchus (light orange; this paper), Ross River virus (RRV) in Cx. annulirostris (medium orange; Shocket et al., 2018), dengue virus (DENV) in Ae. albopictus (dark orange; Mordecai et al., 2017), Murray Valley Encephalitis virus (MVEV) in Cx. annulirostris (light red; Shocket et al., 2018), Zika virus (ZIKV) in Ae. aegypti (medium red; Tesla et al., 2018), DENV in Ae. aegypti (dark red; Mordecai et al., 2017). Figure is identical to Figure 2 in Mordecai et al., 2019.
Appendix 1—figure 11
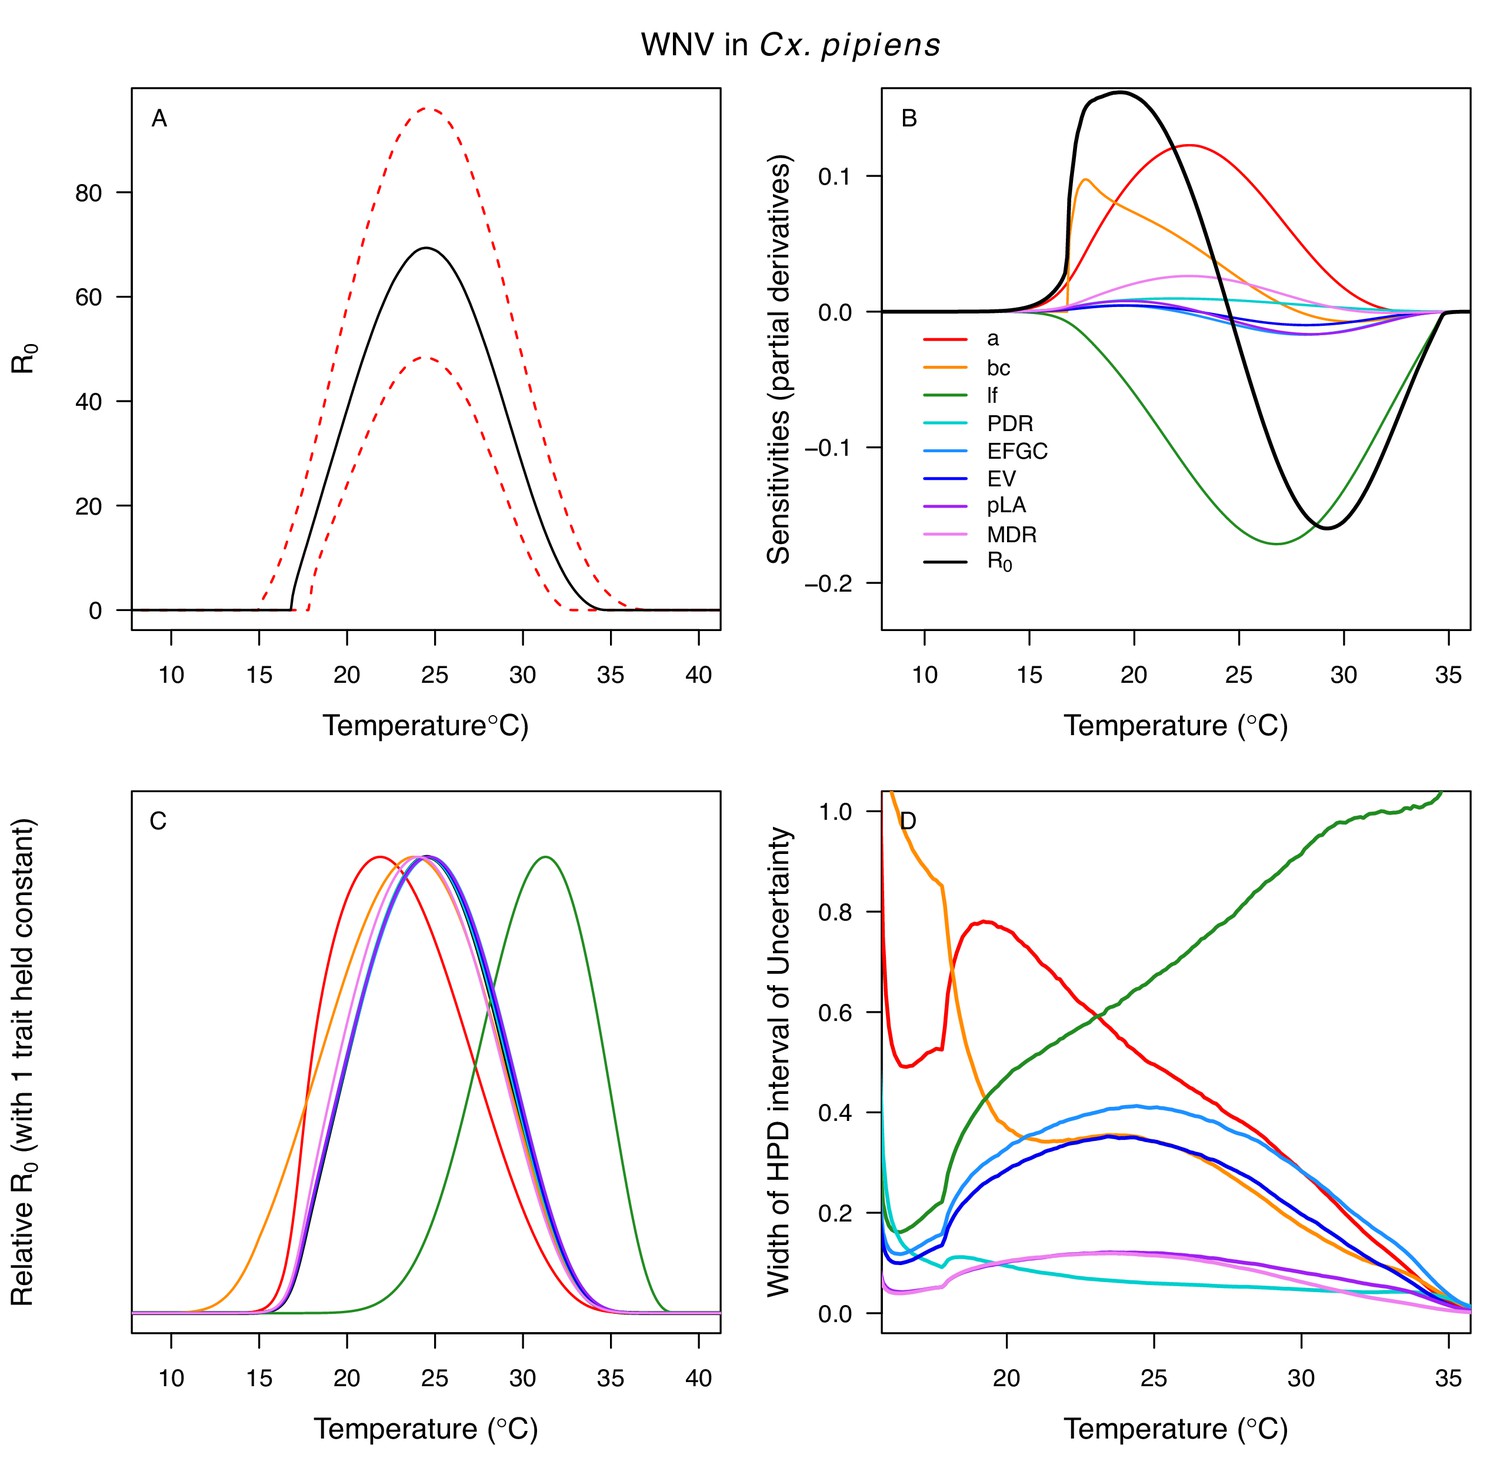
Temperature-dependent R0, sensitivity analyses, and uncertainty analysis for model of West Nile Virus (WNV) in Culex pipiens.
(A) Median temperature-dependent R0 (black line) with 95% credible intervals (dashed red lines). (B) Sensitivity analysis #1: derivative with respect to temperature for R0 (black) and partial derivatives with respect to temperature for each trait. (C) Sensitivity analysis #2: relative R0 calculated with single traits held constant. (D) Uncertainty analysis using highest posterior density (HPD) interval widths: the proportion of total uncertainty due to each trait. (B–D) Trait colors: biting rate (a, red), vector competence (bc, orange), adult lifespan (lf, green), parasite development rate (PDR, cyan), fecundity (EFGC, light blue), egg viability (EV, dark blue), larval survival (pLA, purple), and mosquito development rate (MDR, pink). All traits from Cx. pipiens.
Appendix 1—figure 12

Temperature-dependent R0, sensitivity analyses, and uncertainty analysis for model of West Nile Virus (WNV) in Culex quinquefasciatus.
(A) Median temperature-dependent R0 (black line) with 95% credible intervals (dashed red lines). (B) Sensitivity analysis #1: derivative with respect to temperature for R0 (black) and partial derivatives with respect to temperature for each trait. (C) Sensitivity analysis #2: relative R0 calculated with single traits held constant. (D) Uncertainty analysis using highest posterior density (HPD) interval widths: the proportion of total uncertainty due to each trait. (B–D) Trait colors: biting rate (a, red), vector competence (bc, orange), adult lifespan (lf, green), parasite development rate (PDR, cyan), fecundity (EFGC, light blue), egg viability (EV, dark blue), larval survival (pLA, purple), mosquito development rate (MDR, pink), and proportion ovipositing (pO, grey). Vector competence (bc) from Cx. univitattus; all other traits from Cx. quinquefasciatus.
Appendix 1—figure 13

Temperature-dependent R0, sensitivity analyses, and uncertainty analysis for model of West Nile Virus (WNV) in Culex tarsalis.
(A) Median temperature-dependent R0 (black line) with 95% credible intervals (dashed red lines). (B) Sensitivity analysis #1: derivative with respect to temperature for R0 (black) and partial derivatives with respect to temperature for each trait. (C) Sensitivity analysis #2: relative R0 calculated with single traits held constant. (D) Uncertainty analysis using highest posterior density (HPD) interval widths: the proportion of total uncertainty due to each trait. (B–D) Trait colors: biting rate (a, red), transmission efficiency (b, orange), adult lifespan (lf, green), parasite development rate (PDR, cyan), fecundity (EFGC, light blue), egg viability (EV, dark blue), larval survival (pLA, purple), and mosquito development rate (MDR, pink). Fecundity (EFGC) and egg viability (EV) from Cx. pipiens; all other traits from Cx. tarsalis.
Appendix 1—figure 14
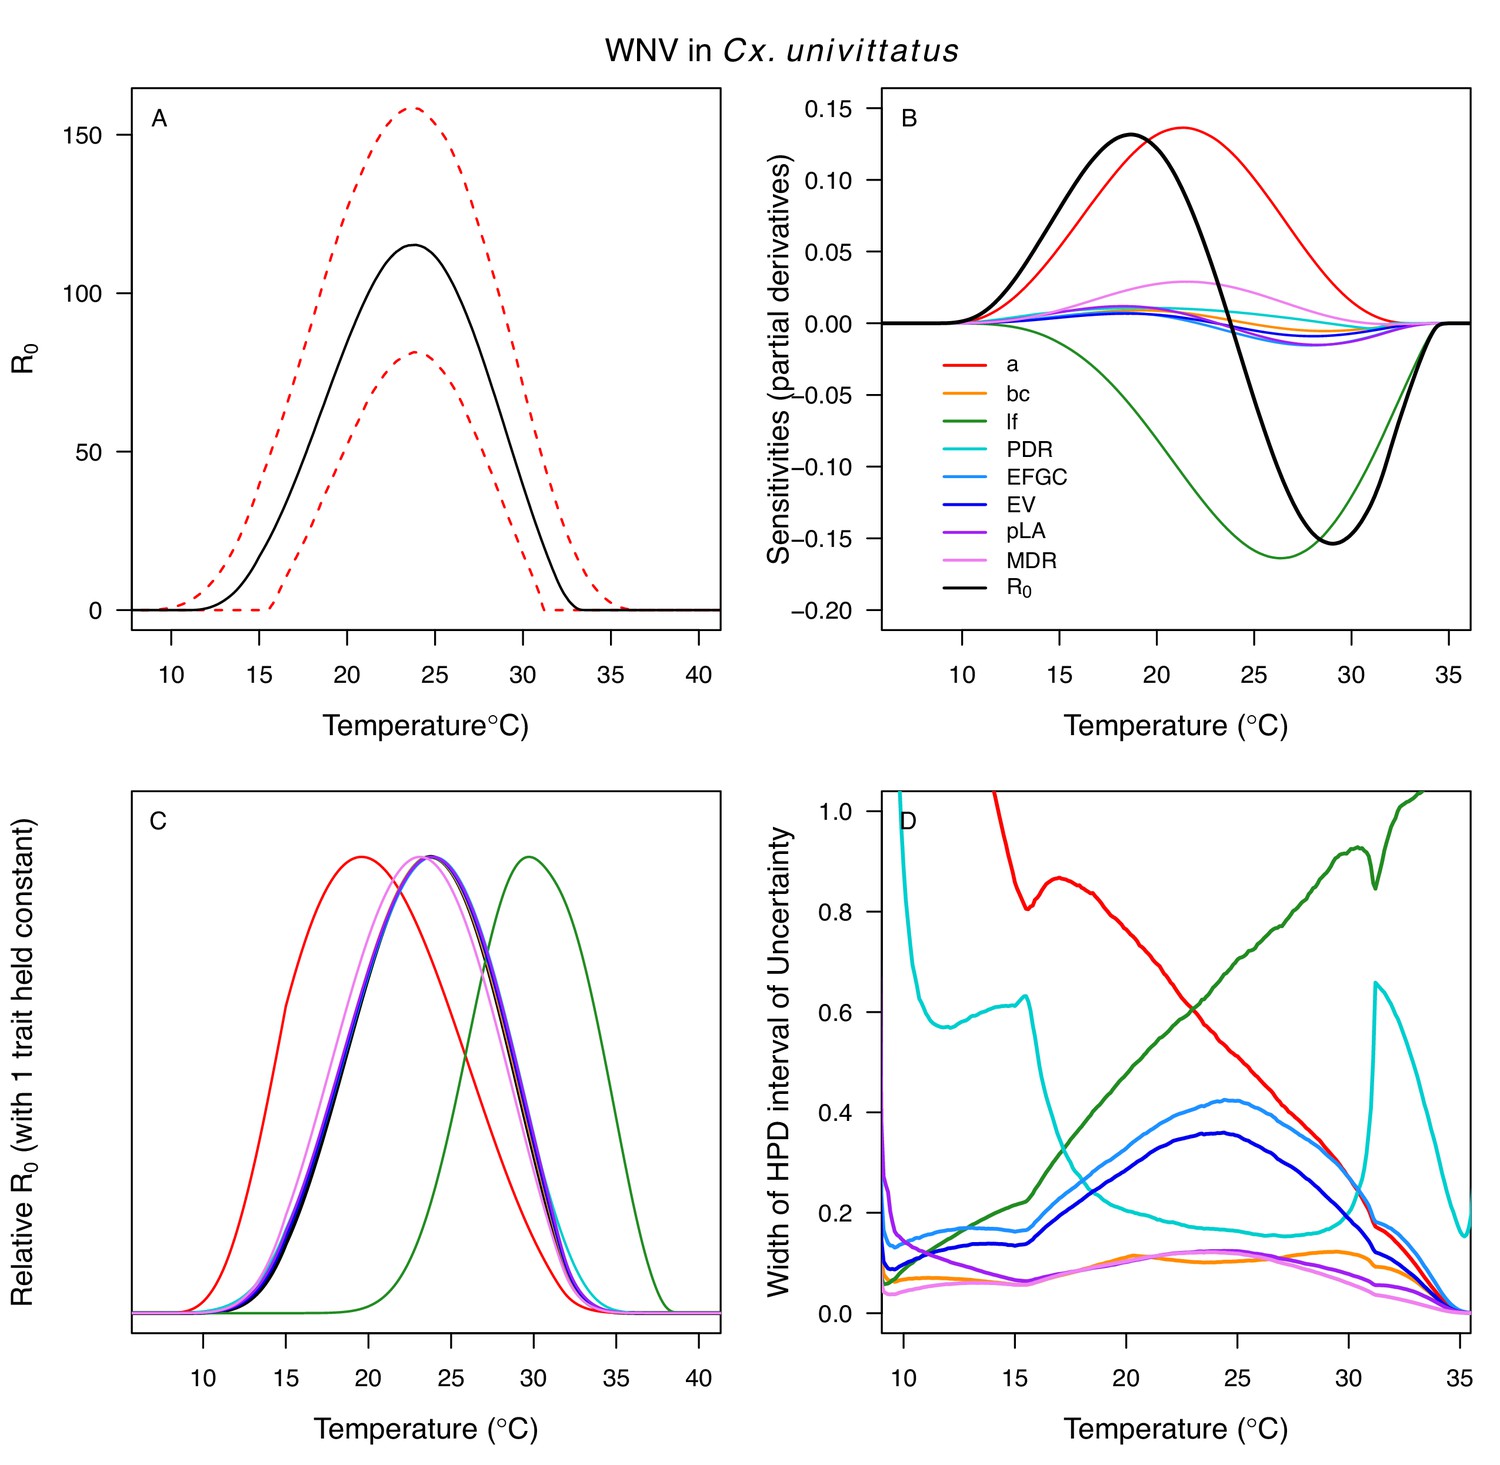
Temperature-dependent R0, sensitivity analyses, and uncertainty analysis for model of West Nile Virus (WNV) in Culex univittatus.
(A) Median temperature-dependent R0 (black line) with 95% credible intervals (dashed red lines). (B) Sensitivity analysis #1: derivative with respect to temperature for R0 (black) and partial derivatives with respect to temperature for each trait. (C) Sensitivity analysis #2: relative R0 calculated with single traits held constant. (D) Uncertainty analysis using highest posterior density (HPD) interval widths: the proportion of total uncertainty due to each trait. (B–D) Trait colors: biting rate (a, red), vector competence (bc, orange), adult lifespan (lf, green), parasite development rate (PDR, cyan), fecundity (EFGC, light blue), egg viability (EV, dark blue), larval survival (pLA, purple), and mosquito development rate (MDR, pink). Infection traits (bc and PDR) from Cx. univittatus; all other traits from Cx. pipiens.
Appendix 1—figure 15
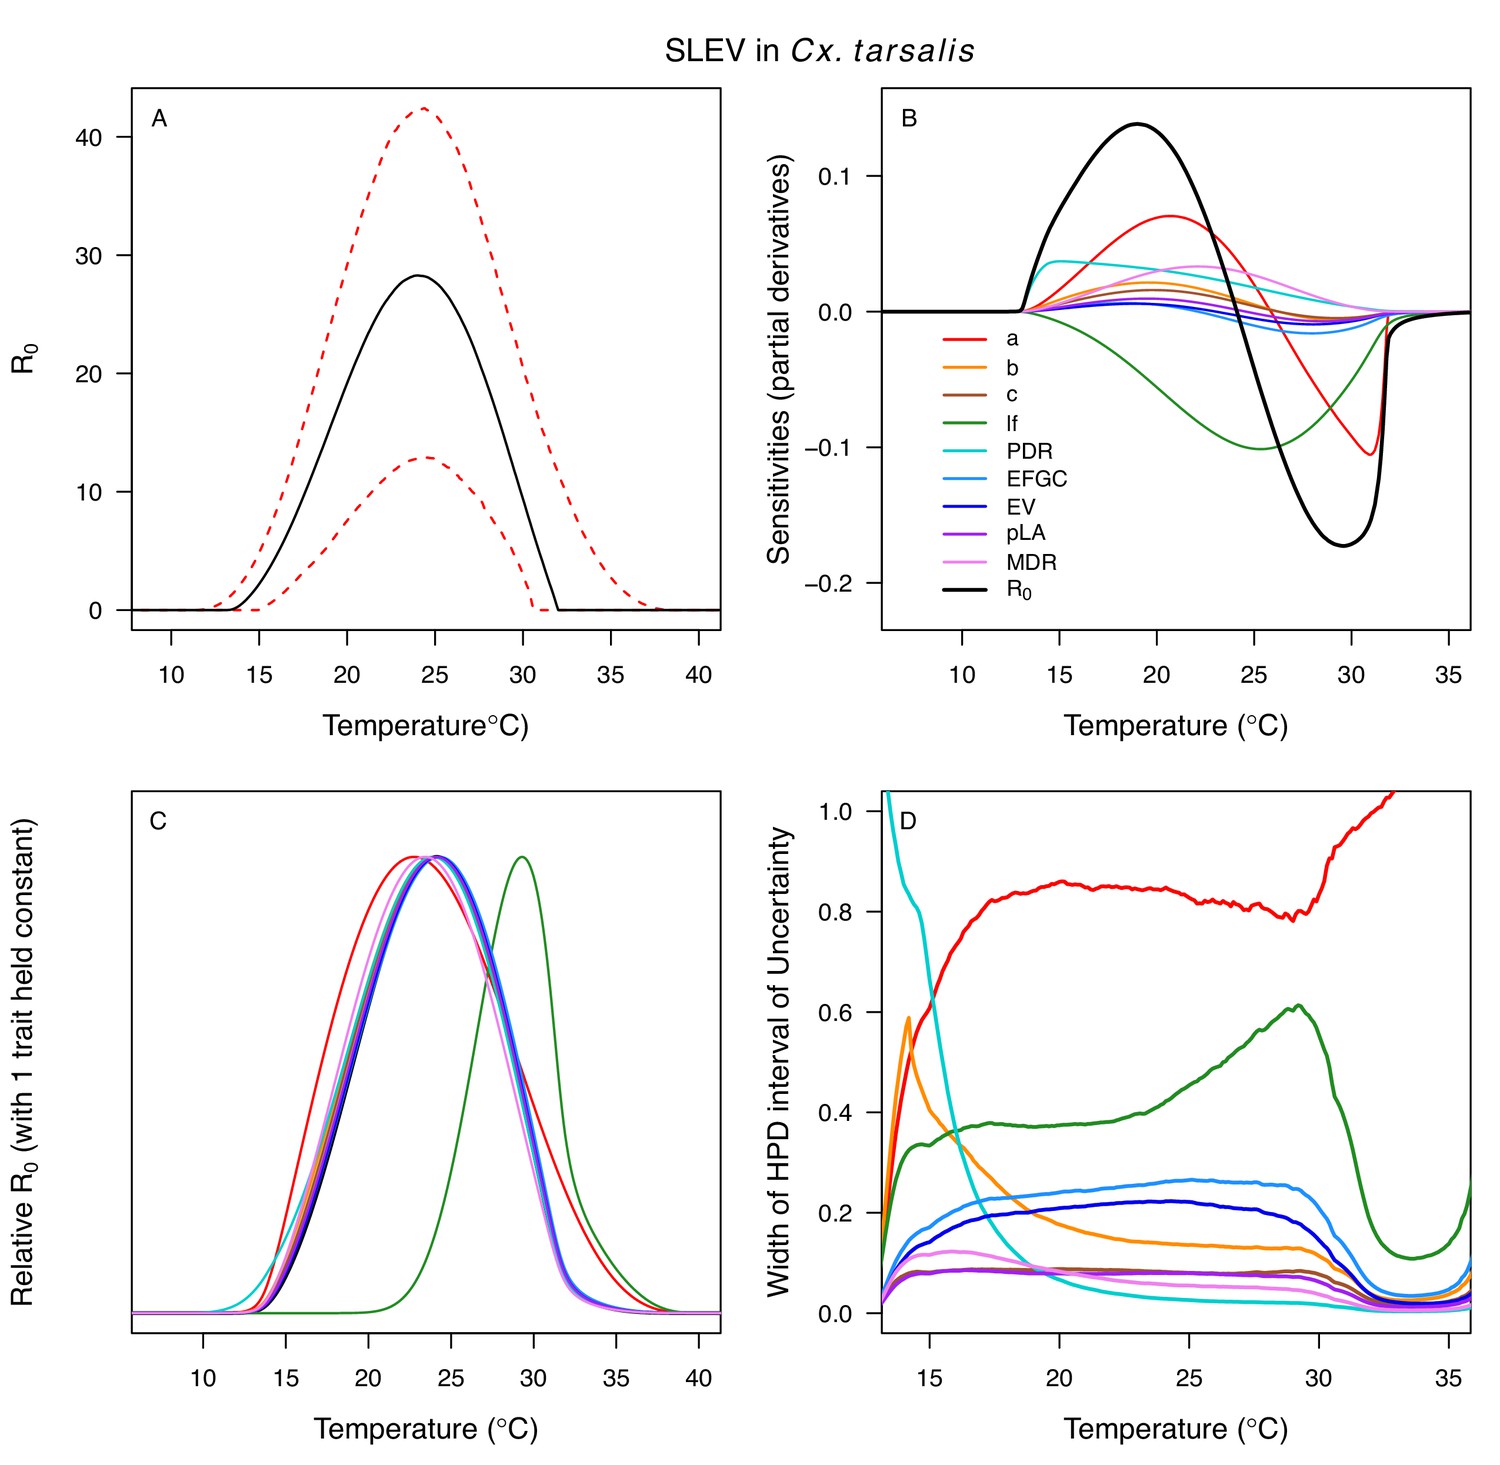
Temperature-dependent R0, sensitivity analyses, and uncertainty analysis for St. model of St. Louis Encephalitis Virus (SLEV) in Culex tarsalis.
(A) Median temperature-dependent R0 (black line) with 95% credible intervals (dashed red lines). (B) Sensitivity analysis #1: derivative with respect to temperature for R0 (black) and partial derivatives with respect to temperature for each trait. (C) Sensitivity analysis #2: relative R0 calculated with single traits held constant. (D) Uncertainty analysis using highest posterior density (HPD) interval widths: the proportion of total uncertainty due to each trait. (B–D) Trait colors: biting rate (a, red), transmission efficiency (b, orange), infection efficiency (c, brown), adult lifespan (lf, green), parasite development rate (PDR, cyan), fecundity (EFGC, light blue), egg viability (EV, dark blue), larval survival (pLA, purple), and mosquito development rate (MDR, pink). Fecundity (EFGC) and egg viability (EV) from Cx. pipiens; all other traits from Cx. tarsalis.
Appendix 1—figure 16
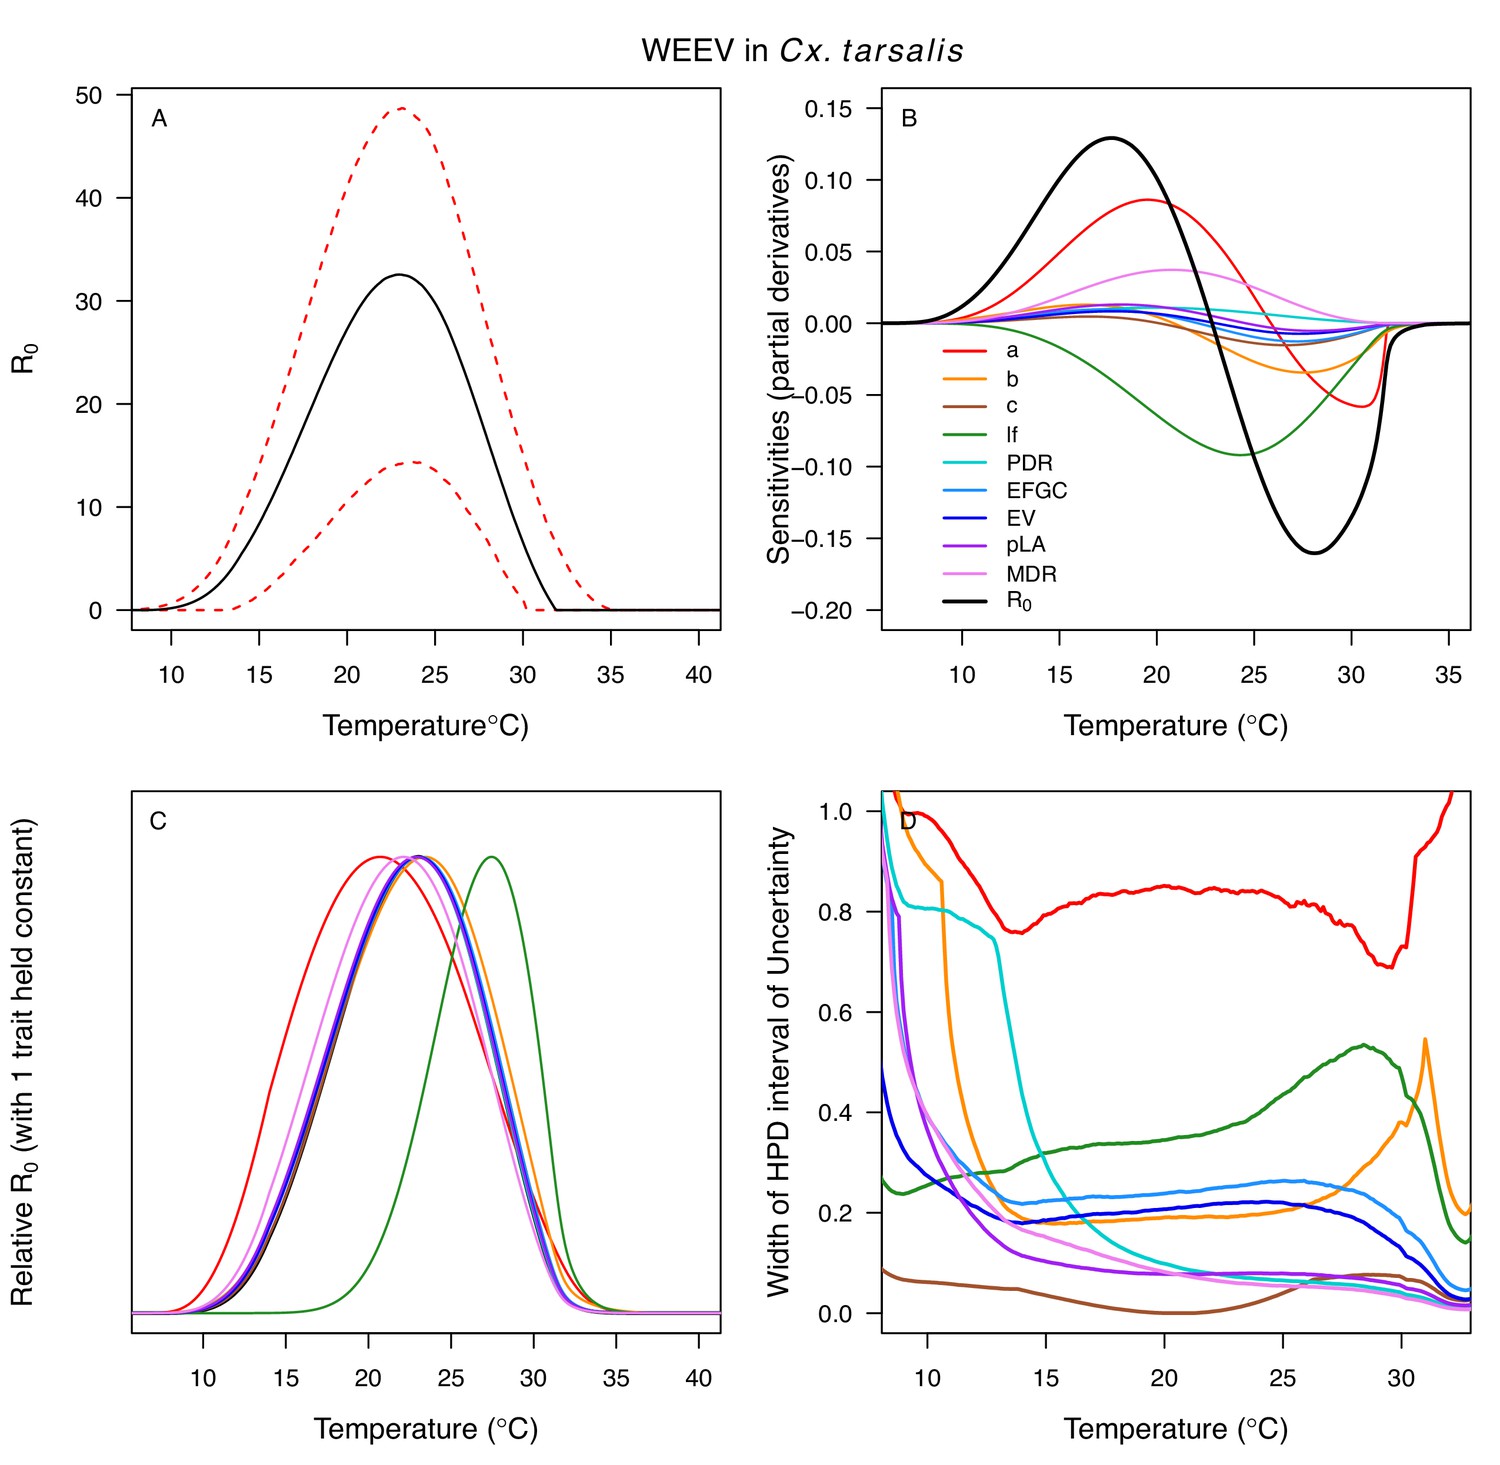
Temperature-dependent R0, sensitivity analyses, and uncertainty analysis for model of Western Equine Encephalitis Virus (WEEV) in Culex tarsalis.
(A) Median temperature-dependent R0 (black line) with 95% credible intervals (dashed red lines). (B) Sensitivity analysis #1: derivative with respect to temperature for R0 (black) and partial derivatives with respect to temperature for each trait. (C) Sensitivity analysis #2: relative R0 calculated with single traits held constant. (D) Uncertainty analysis using highest posterior density (HPD) interval widths: the proportion of total uncertainty due to each trait. (B–D) Trait colors: biting rate (a, red), transmission efficiency (b, orange), infection efficiency (c, brown), adult lifespan (lf, green), parasite development rate (PDR, cyan), fecundity (EFGC, light blue), egg viability (EV, dark blue), larval survival (pLA, purple), and mosquito development rate (MDR, pink). Fecundity (EFGC) and egg viability (EV) from Cx. pipiens; all other traits from Cx. tarsalis.
Appendix 1—figure 17
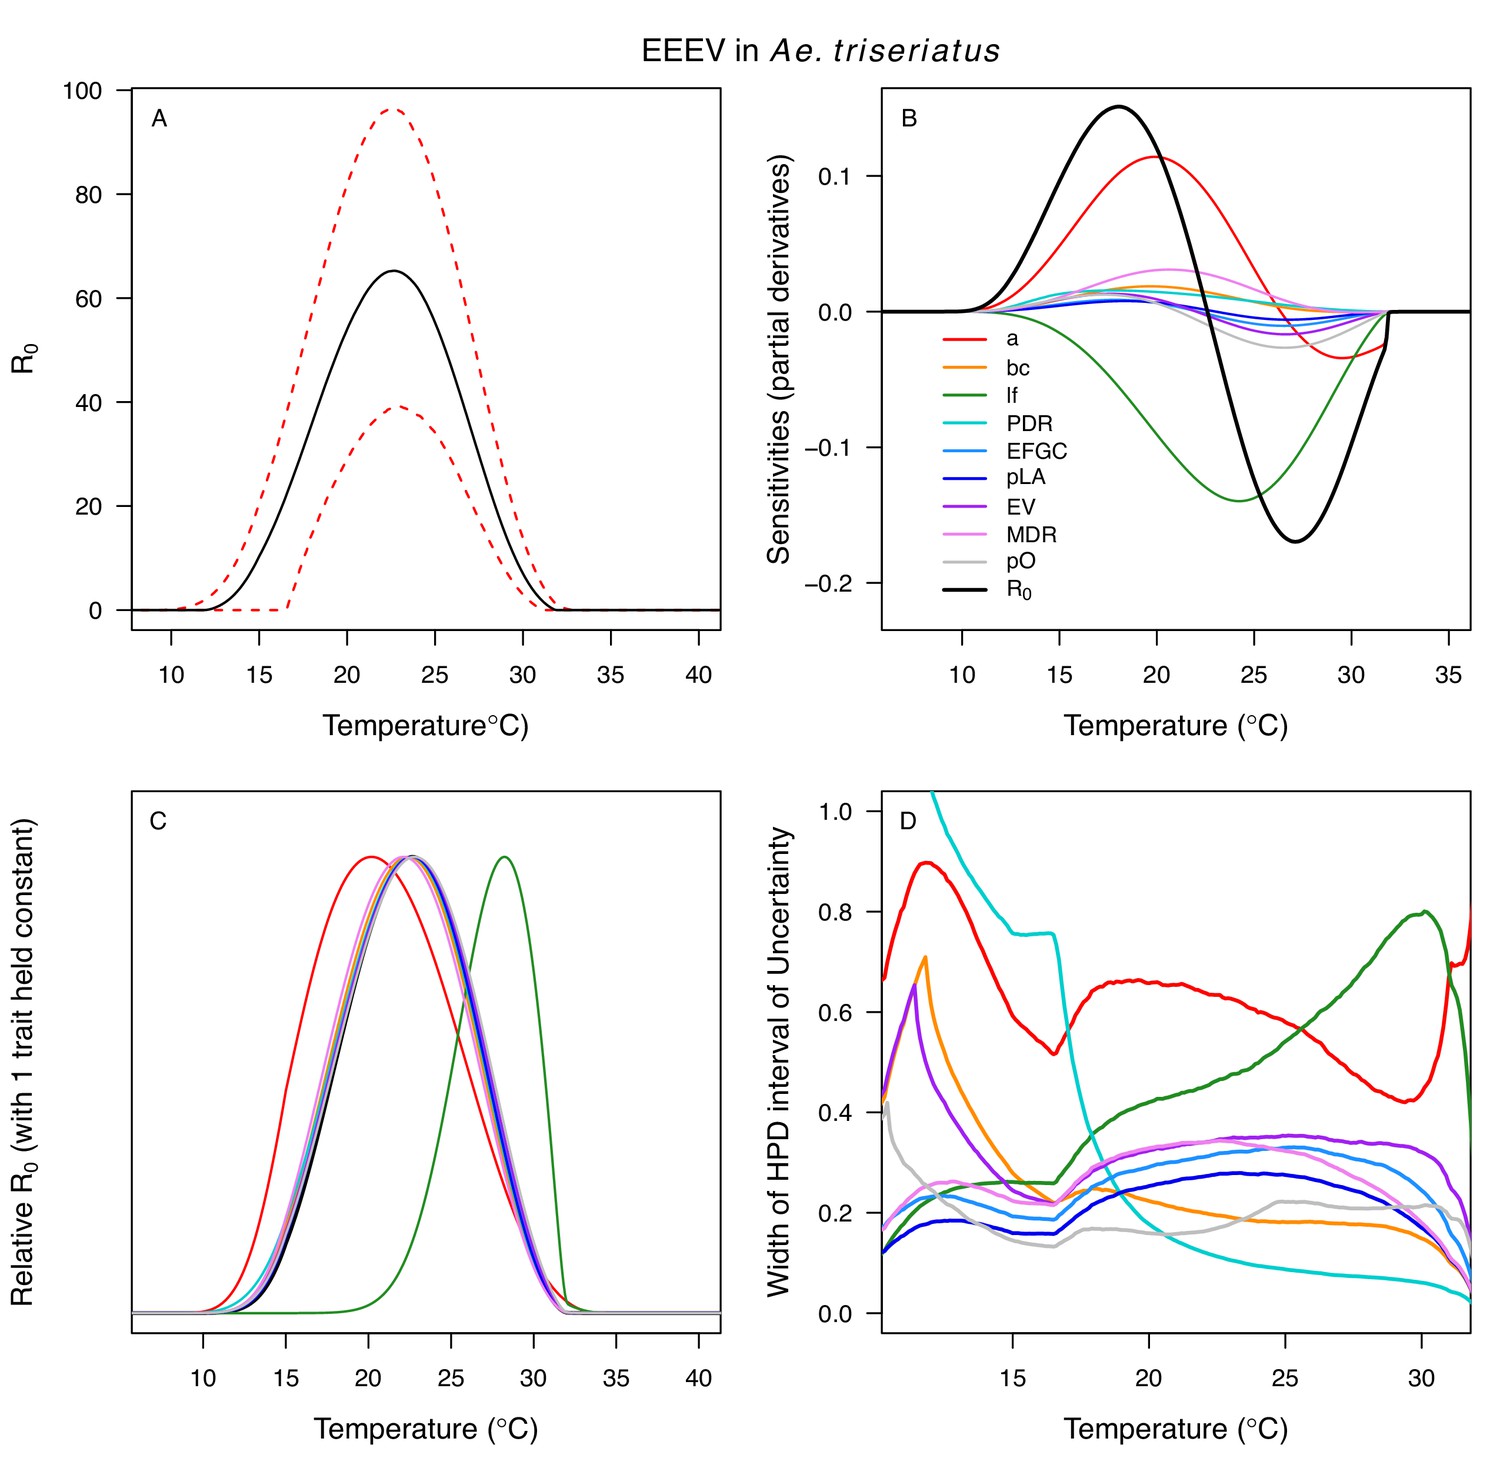
Temperature-dependent R0, sensitivity analyses, and uncertainty analysis for model of Eastern Equine Encephalitis Virus in Aedes triseriatus.
(A) Median temperature-dependent R0 (black line) with 95% credible intervals (dashed red lines). (B) Sensitivity analysis #1: derivative with respect to temperature for R0 (black) and partial derivatives with respect to temperature for each trait. (C) Sensitivity analysis #2: relative R0 calculated with single traits held constant. (D) Uncertainty analysis using highest posterior density (HPD) interval widths: the proportion of total uncertainty due to each trait. (B–D) Trait colors: biting rate (a, red), vector competence (bc, orange), adult lifespan (lf, green), parasite development rate (PDR, cyan), fecundity (EFGC, light blue), egg viability (EV, dark blue), larval survival (pLA, purple), mosquito development rate (MDR, pink), and proportion ovipositing (pO, grey). Fecundity (EFGC), egg viability (EV), and lifespan (lf) from Cx. pipiens; biting rate (a) and proportion ovipositing (pO) from Culiseta melanura; all other traits from Ae. triseriatus. Note: technically fecundity as eggs per female per gonotrophic cycle (EFGC) has already accounted for the proportion ovipositing (pO). However, we selected this trait fit because it was very similar to the ER thermal response from Cx. quinquefasciatus, but slightly wider (more conservative).
Appendix 1—figure 18
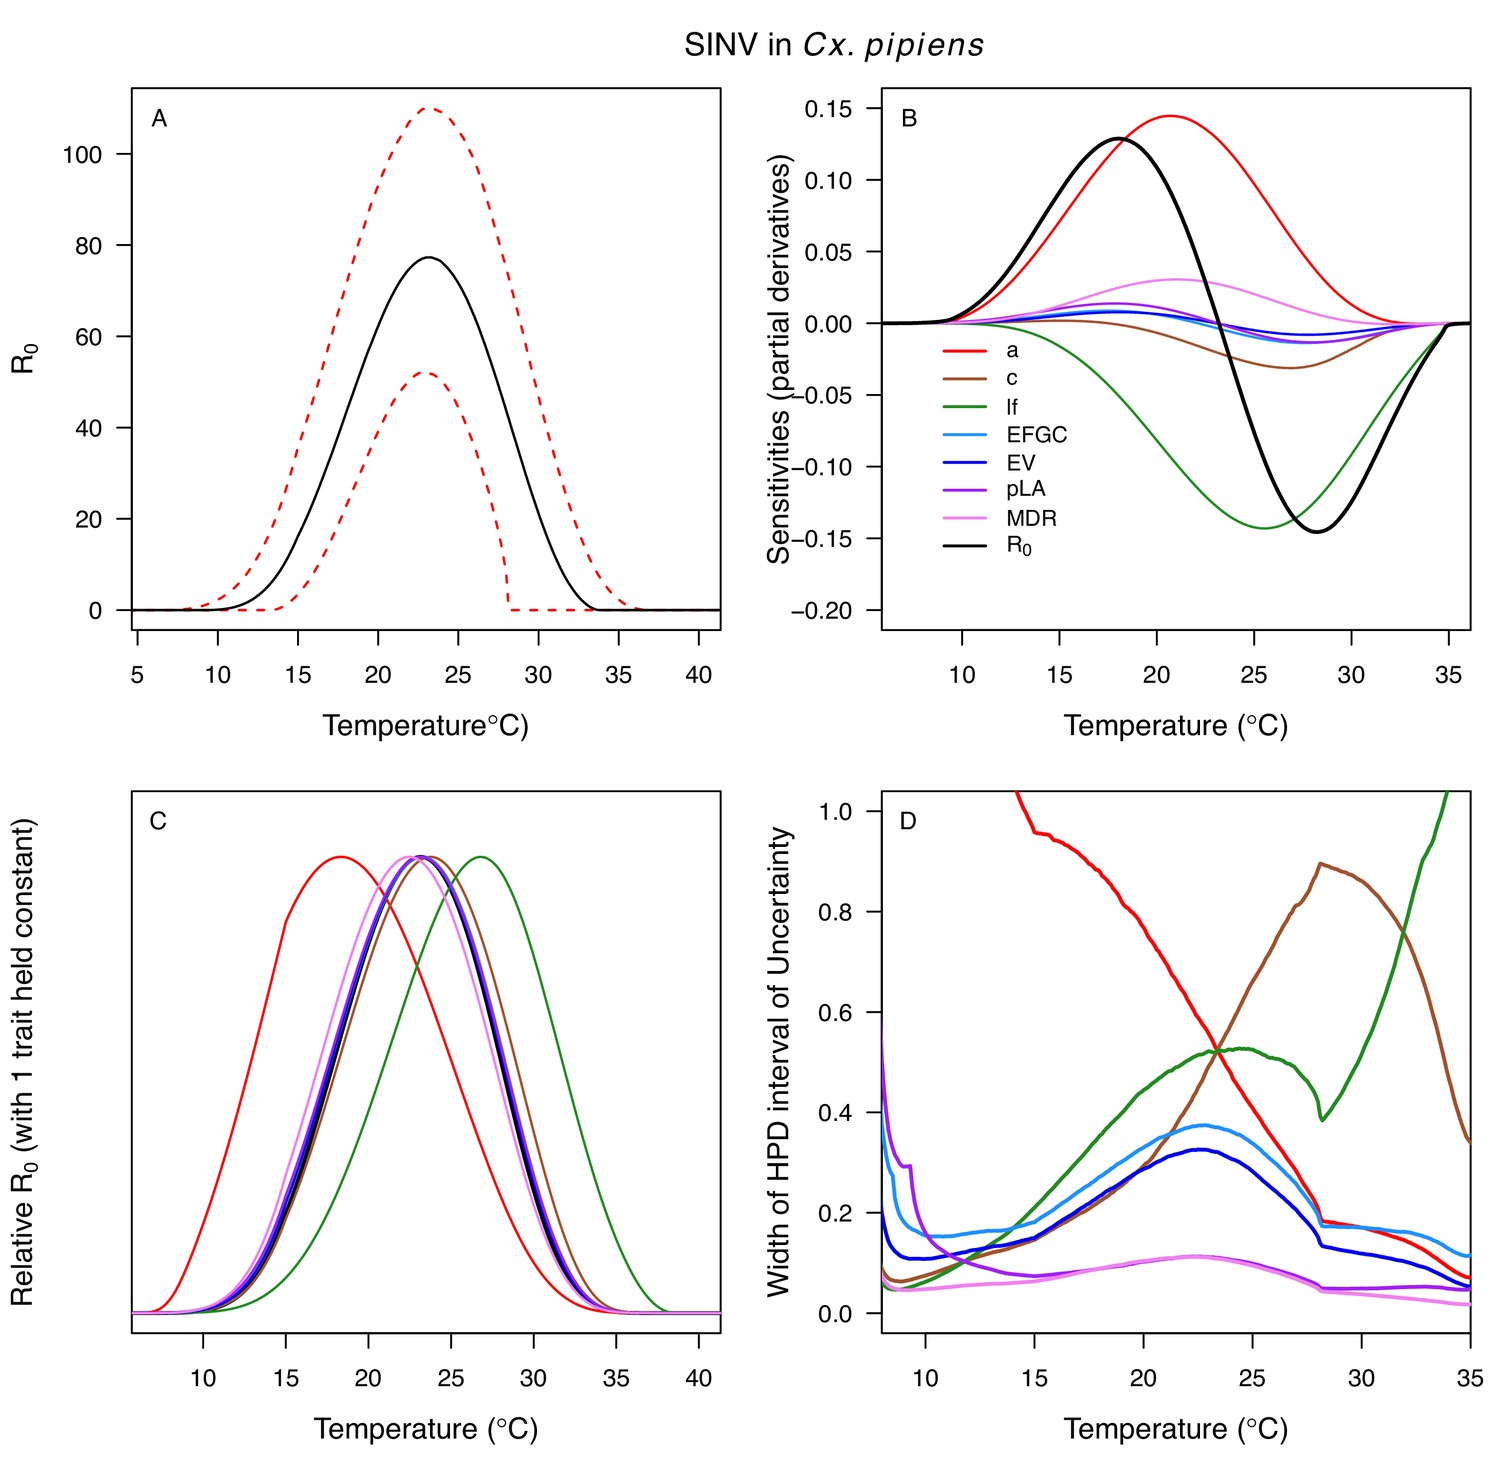
Temperature-dependent R0, sensitivity analyses, and uncertainty analysis for model of Sindbis Virus in Culex pipiens.
(A) Median temperature-dependent R0 (black line) with 95% credible intervals (dashed red lines). (B) Sensitivity analysis #1: derivative with respect to temperature for R0 (black) and partial derivatives with respect to temperature for each trait. (C) Sensitivity analysis #2: relative R0 calculated with single traits held constant. (D) Uncertainty analysis using highest posterior density (HPD) interval widths: the proportion of total uncertainty due to each trait. (B–D) Trait colors: biting rate (a, red), infection efficiency (c, brown), adult lifespan (lf, green), fecundity (EFGC, light blue), egg viability (EV, dark blue), larval survival (pLA, purple), and mosquito development rate (MDR, pink). All traits from Cx. pipiens. NOTE: The raw R0 calculation used PDR = 1, which is not biologically reasonable trait value.
Appendix 1—figure 19
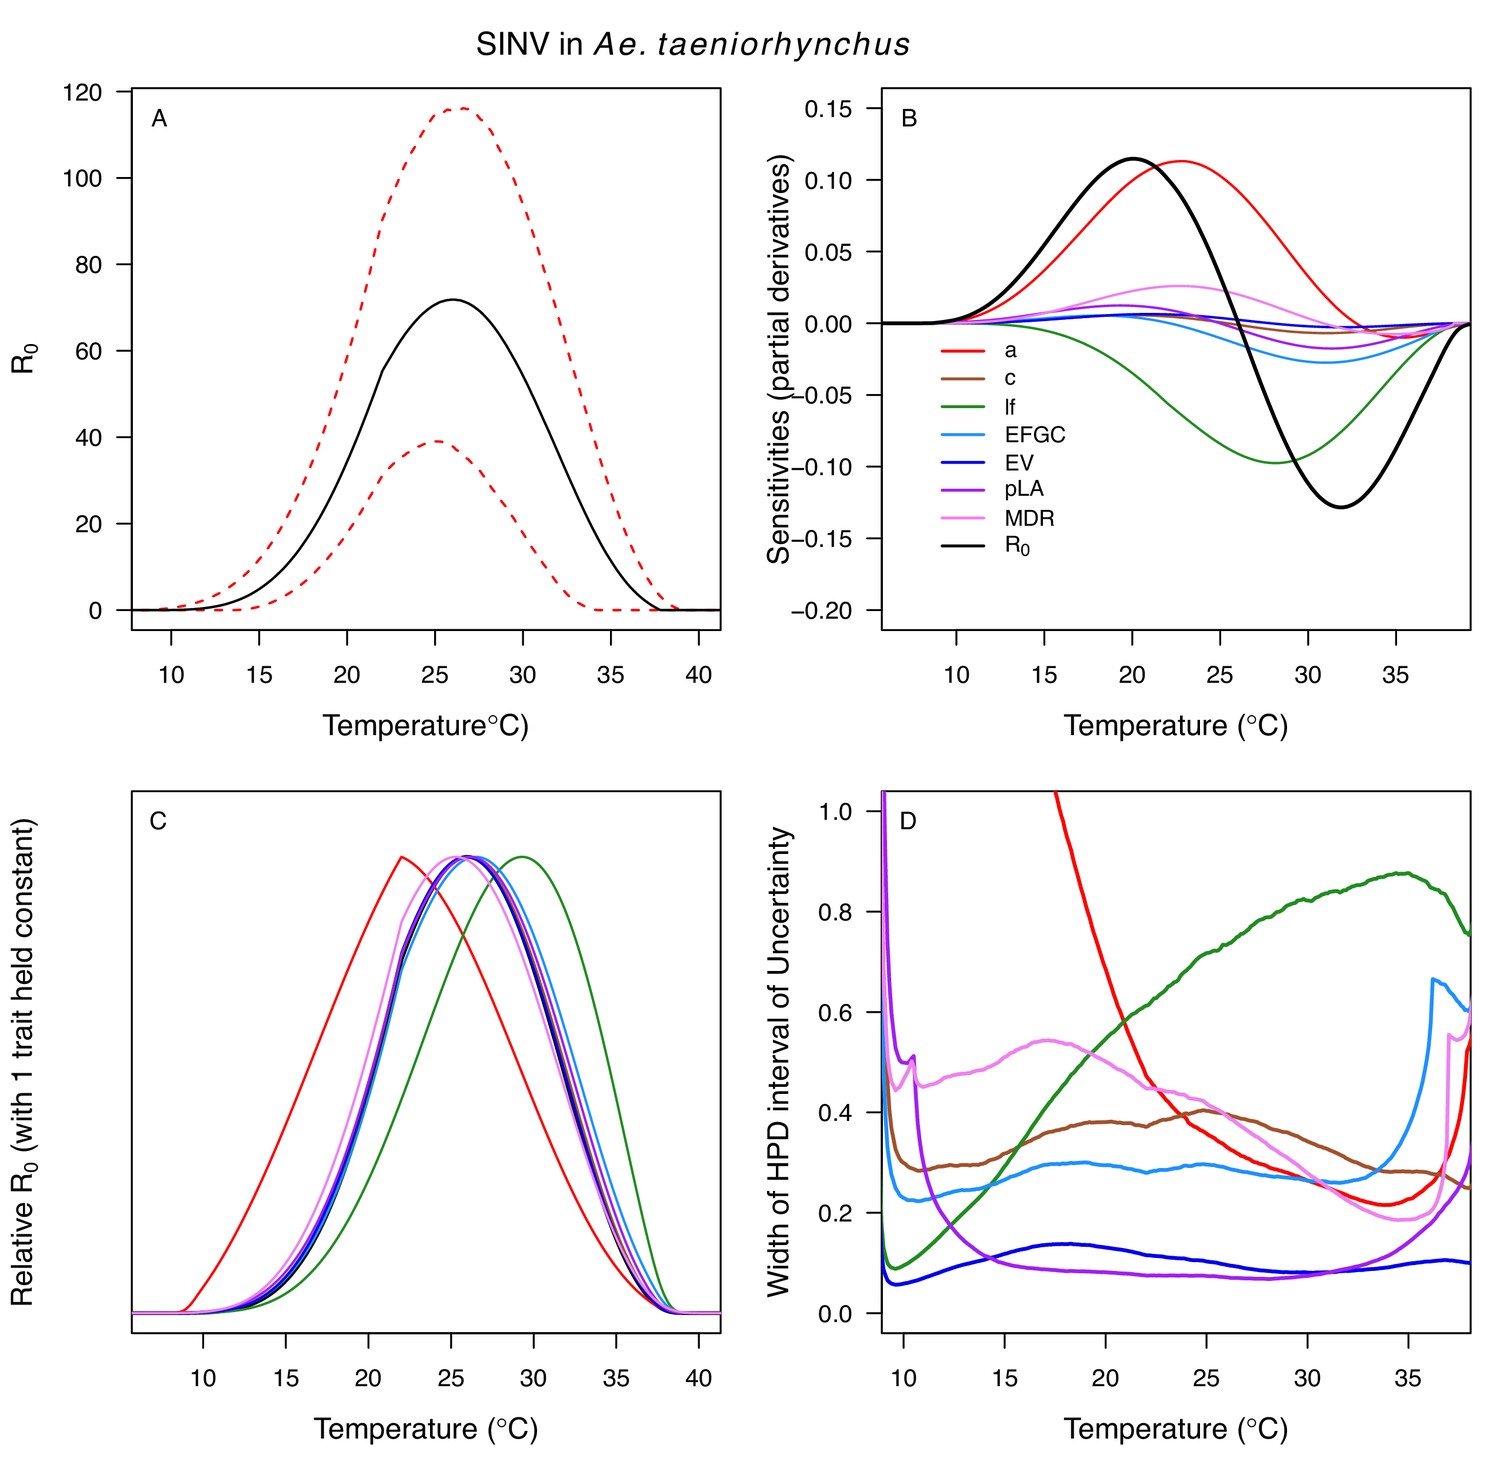
Temperature-dependent R0, sensitivity analyses, and uncertainty analysis for model of Sindbis Virus in Aedes taeniorhynchus.
(A) Median temperature-dependent R0 (black line) with 95% credible intervals (dashed red lines). (B) Sensitivity analysis #1: derivative with respect to temperature for R0 (black) and partial derivatives with respect to temperature for each trait. (C) Sensitivity analysis #2: relative R0 calculated with single traits held constant. (D) Uncertainty analysis using highest posterior density (HPD) interval widths: the proportion of total uncertainty due to each trait. (B–D) Trait colors: biting rate (a, red), infection efficiency (c, brown), adult lifespan (lf, green), fecundity (EFGC, light blue), egg viability (EV, dark blue), larval survival (pLA, purple), and mosquito development rate (MDR, pink). Fecundity (EFGC) and biting rate (a) from Culex pipiens; egg viability (EV) and larval traits (pLA and MDR) from Ae. vexans; all other traits from Ae. taeniorhynchus. NOTE: The raw R0 calculation used PDR = 1, which is not biologically reasonable trait value.
Appendix 1—figure 20

Temperature-dependent R0, sensitivity analyses, and uncertainty analysis for model of Rift Valley Fever Virus in Aedes taeniorhynchus.
(A) Median temperature-dependent R0 (black line) with 95% credible intervals (dashed red lines). (B) Sensitivity analysis #1: derivative with respect to temperature for R0 (black) and partial derivatives with respect to temperature for each trait. (C) Sensitivity analysis #2: relative R0 calculated with single traits held constant. (D) Uncertainty analysis using highest posterior density (HPD) interval widths: the proportion of total uncertainty due to each trait. (B–D) Trait colors: biting rate (a, red), vector competence (bc, orange), adult lifespan (lf, green), parasite development rate (PDR, cyan), fecundity (EFGC, light blue), egg viability (EV, dark blue), larval survival (pLA, purple), and mosquito development rate (MDR, pink). Fecundity (EFGC) and biting rate (a) from Culex pipiens; egg viability (EV) from Cx. theileri; larval traits (pLA and MDR) from Ae. vexans; all other traits from Ae. taeniorhynchus.
Appendix 1—figure 21

Histograms of Tmin, optimum, and Tmax for transmission (R0) models.
Tmin (left column), optimum (center column), and Tmax (right column). Top row (A–C): West Nile virus (WNV) in four vectors: Culex pipiens (grey), Cx. quinquefasciatus (red), Cx. tarsalis (blue), and Cx. univitattus (orange). Middle row (D–F): three viruses in Cx. tarsalis: WNV (same as in top row, bright blue), Western Equine Encephalitis virus (WEEV, light blue), and St. Louis Encephalitis virus (SLEV, dark blue). Bottom row (H–J): Sindbis virus (SINV) in Aedes taeniorhynchus (grey), SINV in Cx. pipiens (dark green), Rift Valley Fever virus (RVFV) in Ae. taeniorhynchus (light green), and Eastern Equine Encephalitis virus (EEEV) in Ae. triseriatus (purple).
Appendix 1—figure 22
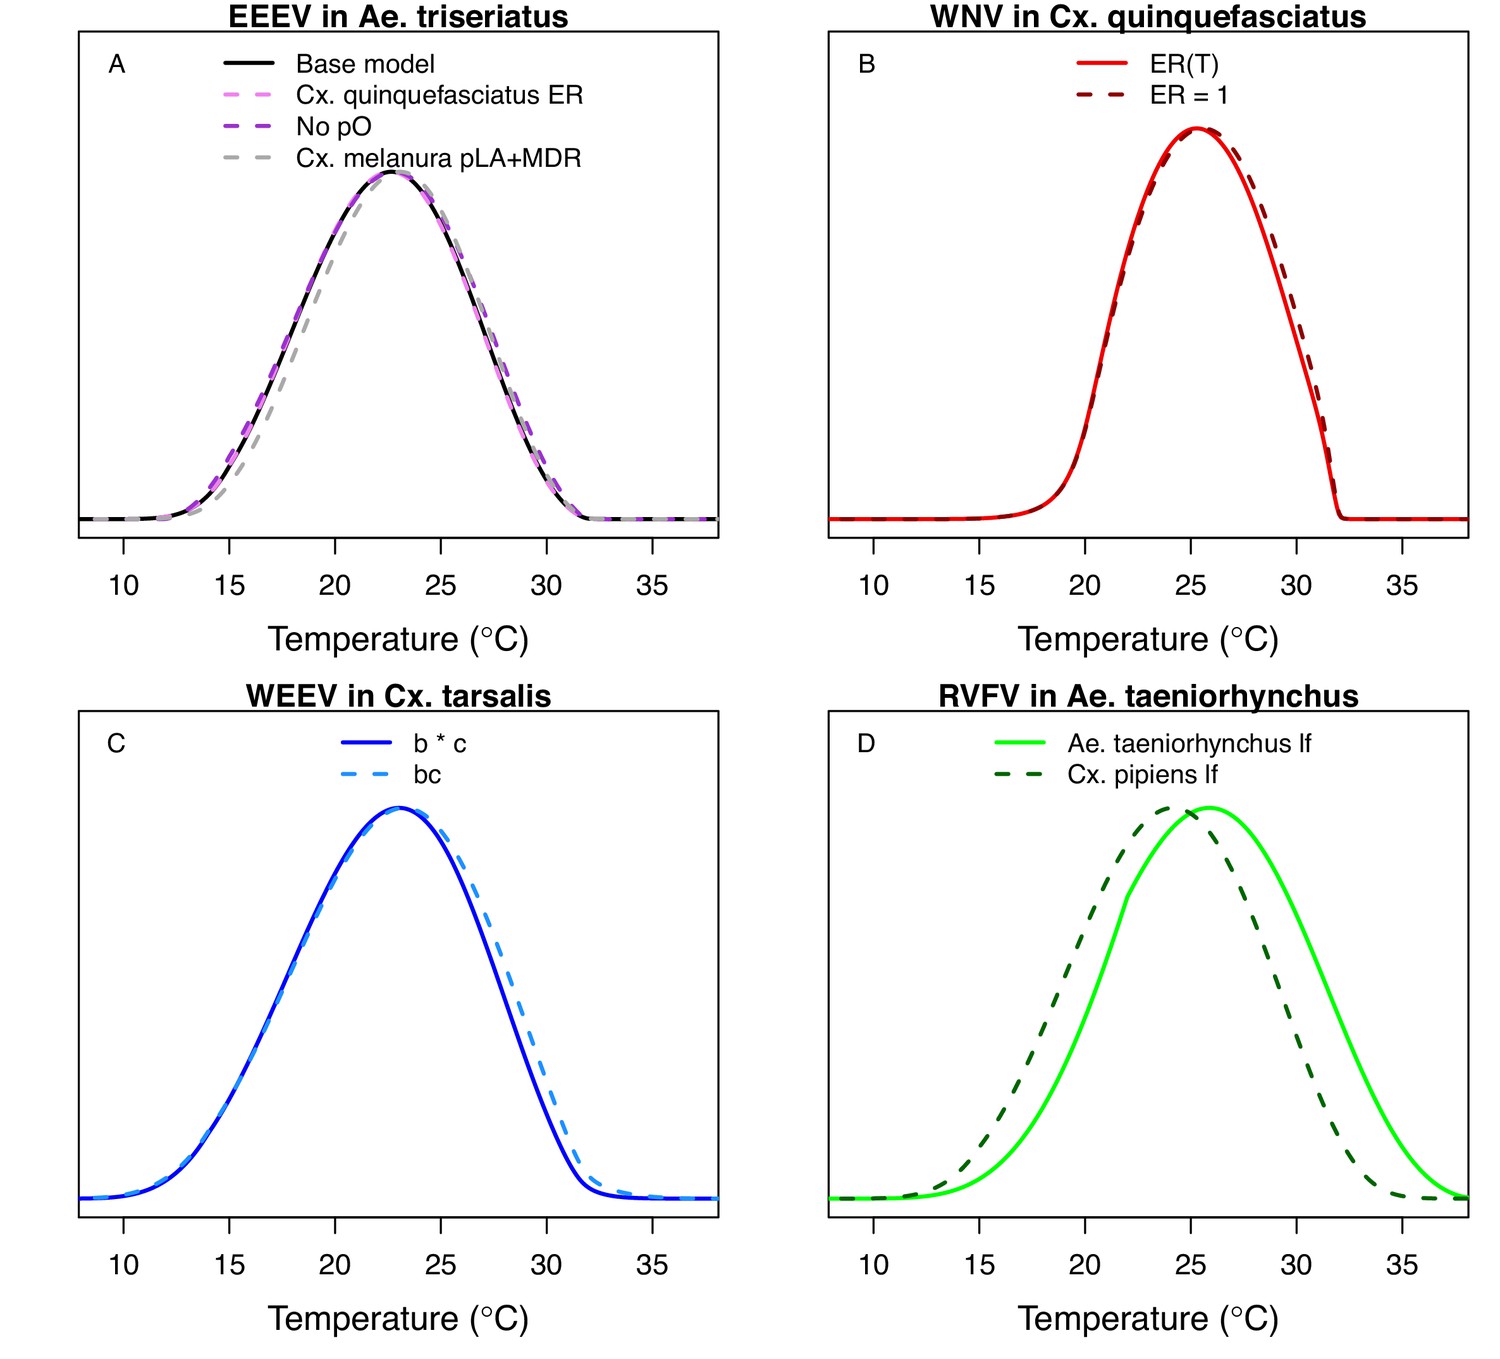
Comparing alternative model parameterizations.
Several models had multiple potentially valid choices for traits; we show these alternative models here (dashed lines; base models from main text in solid lines) to show that they make very little difference, except in D. (A) Models for EEEV in Ae. triseriatus with larval traits (larval-to-adult survival [pLA] and mosquito development rate [MDR]) from Ae. triseriatus (violet, from the main text) and larval traits from Cs. melanura (black). We also show larval traits from Cs. melanura without proportion ovipositing (pO) in the model (grey), since the thermal responses for EFCG (eggs per female per gonotrophic cycle, in Cx. pipiens) and ER (eggs per raft, in Cx. quinquefasciatus) were nearly identical even though the units were different, probably because the ER data were not very informative and the priors strongly shaped the thermal response. (B) Models for WNV in Cx. quinquefasciatus, with (light red, from the main text) and without (dark red) the thermal response for fecundity (as eggs per raft, ER), for the same reason as in A. (C) Models for WEEV in Cx. tarsalis with vector competence estimated by infection efficiency (c, Figure 6D) and transmission efficiency (b, Figure 6E) measured separately (blue, from the main text) or by vector competence measured as a single trait (bc, Figure 6F; light blue). (D) Models for RVFV in Ae. taeniorhynchus with lifespan from Ae. taeniorhynchus (light green, from the main text) or from Cx. pipiens (dark green). We chose the Ae. taeniorhynchus version for the main text because it is the same species the infection traits (PDR, bc) were measured in, and that choice strongly impacted the results.
Appendix 1—figure 23
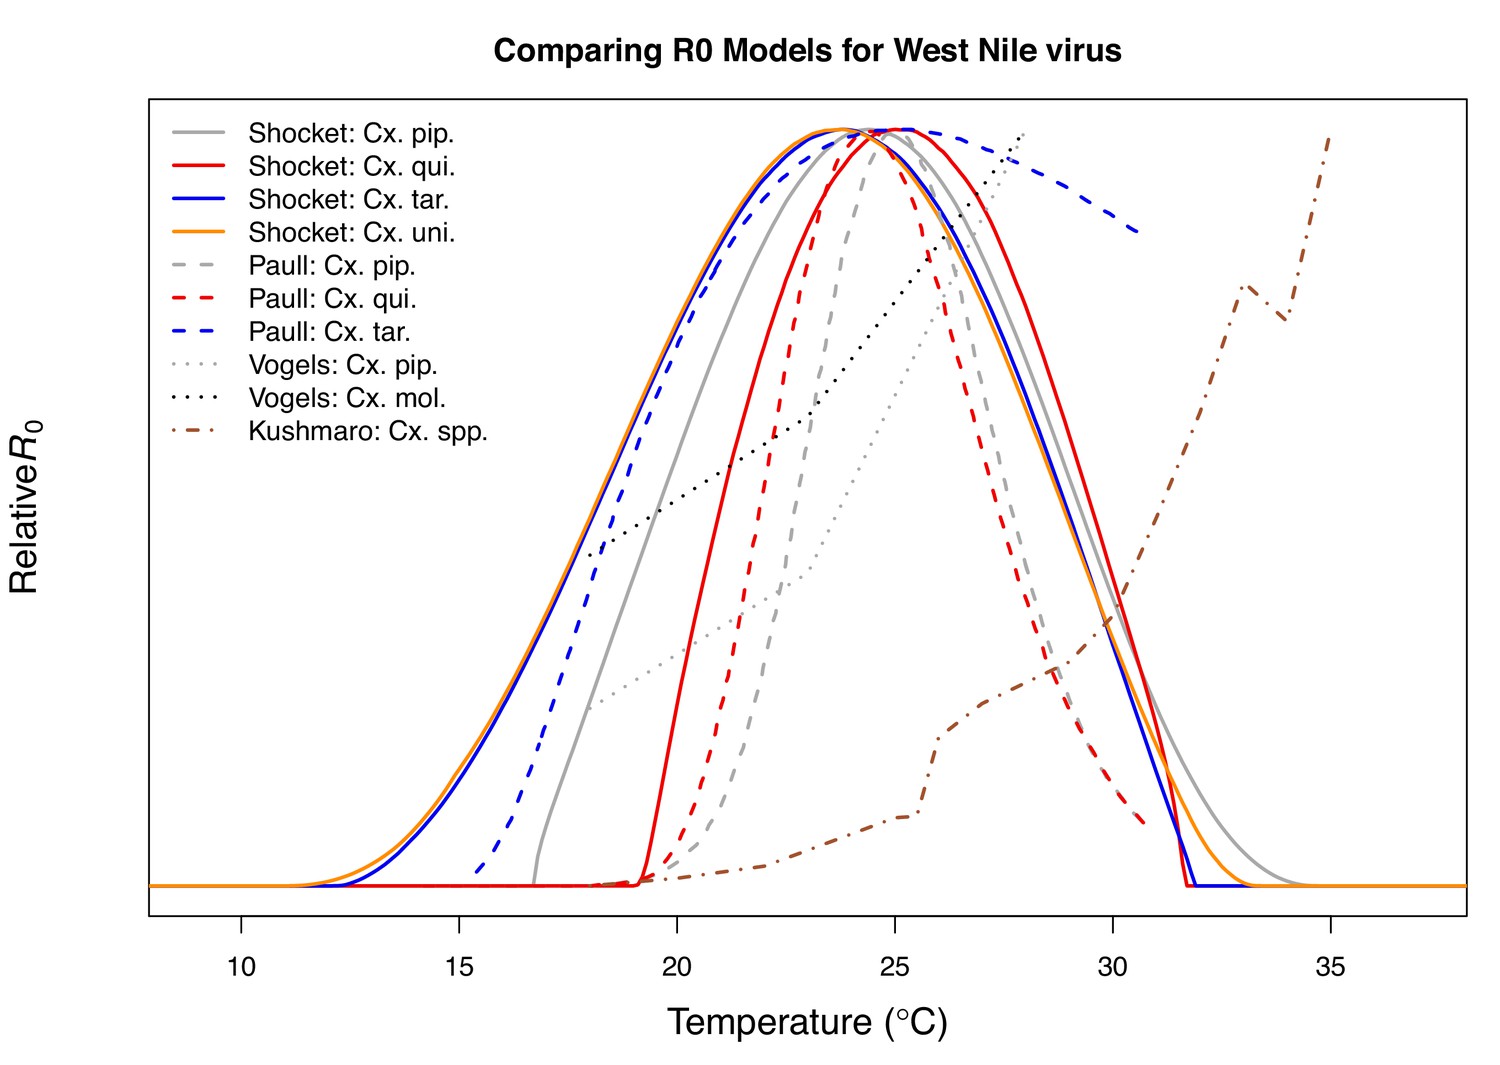
Comparison with previous R0 models for transmission of West Nile virus.
Models taken from this paper (solid lines: Cx. pipiens [grey], Cx. quinquefasciatus [red], Cx. tarsalis [blue], and Cx. univittatus [orange]), from Paull et al., 2017 (dashed lines: Cx. pipiens [grey], Cx. quinquefasciatus [red], and Cx. tarsalis [blue]), from Vogels et al., 2017 (Cx. pipiens [grey] and Cx. pipiens molestus [black]), and from Kushmaro et al., 2015 (not species specific, dot-dashed line [brown]).
Appendix 1—figure 24

Temperature splines from GAMs of mean incidence (per 1000 people) of West Nile neuroinvasive disease as a function of average summer temperature.
(A–F) Models are fit with differing numbers of knots (4–9). In all models, incidence peaks around 24°C (Topt = 23.5–24.2°C).
Appendix 1—figure 25
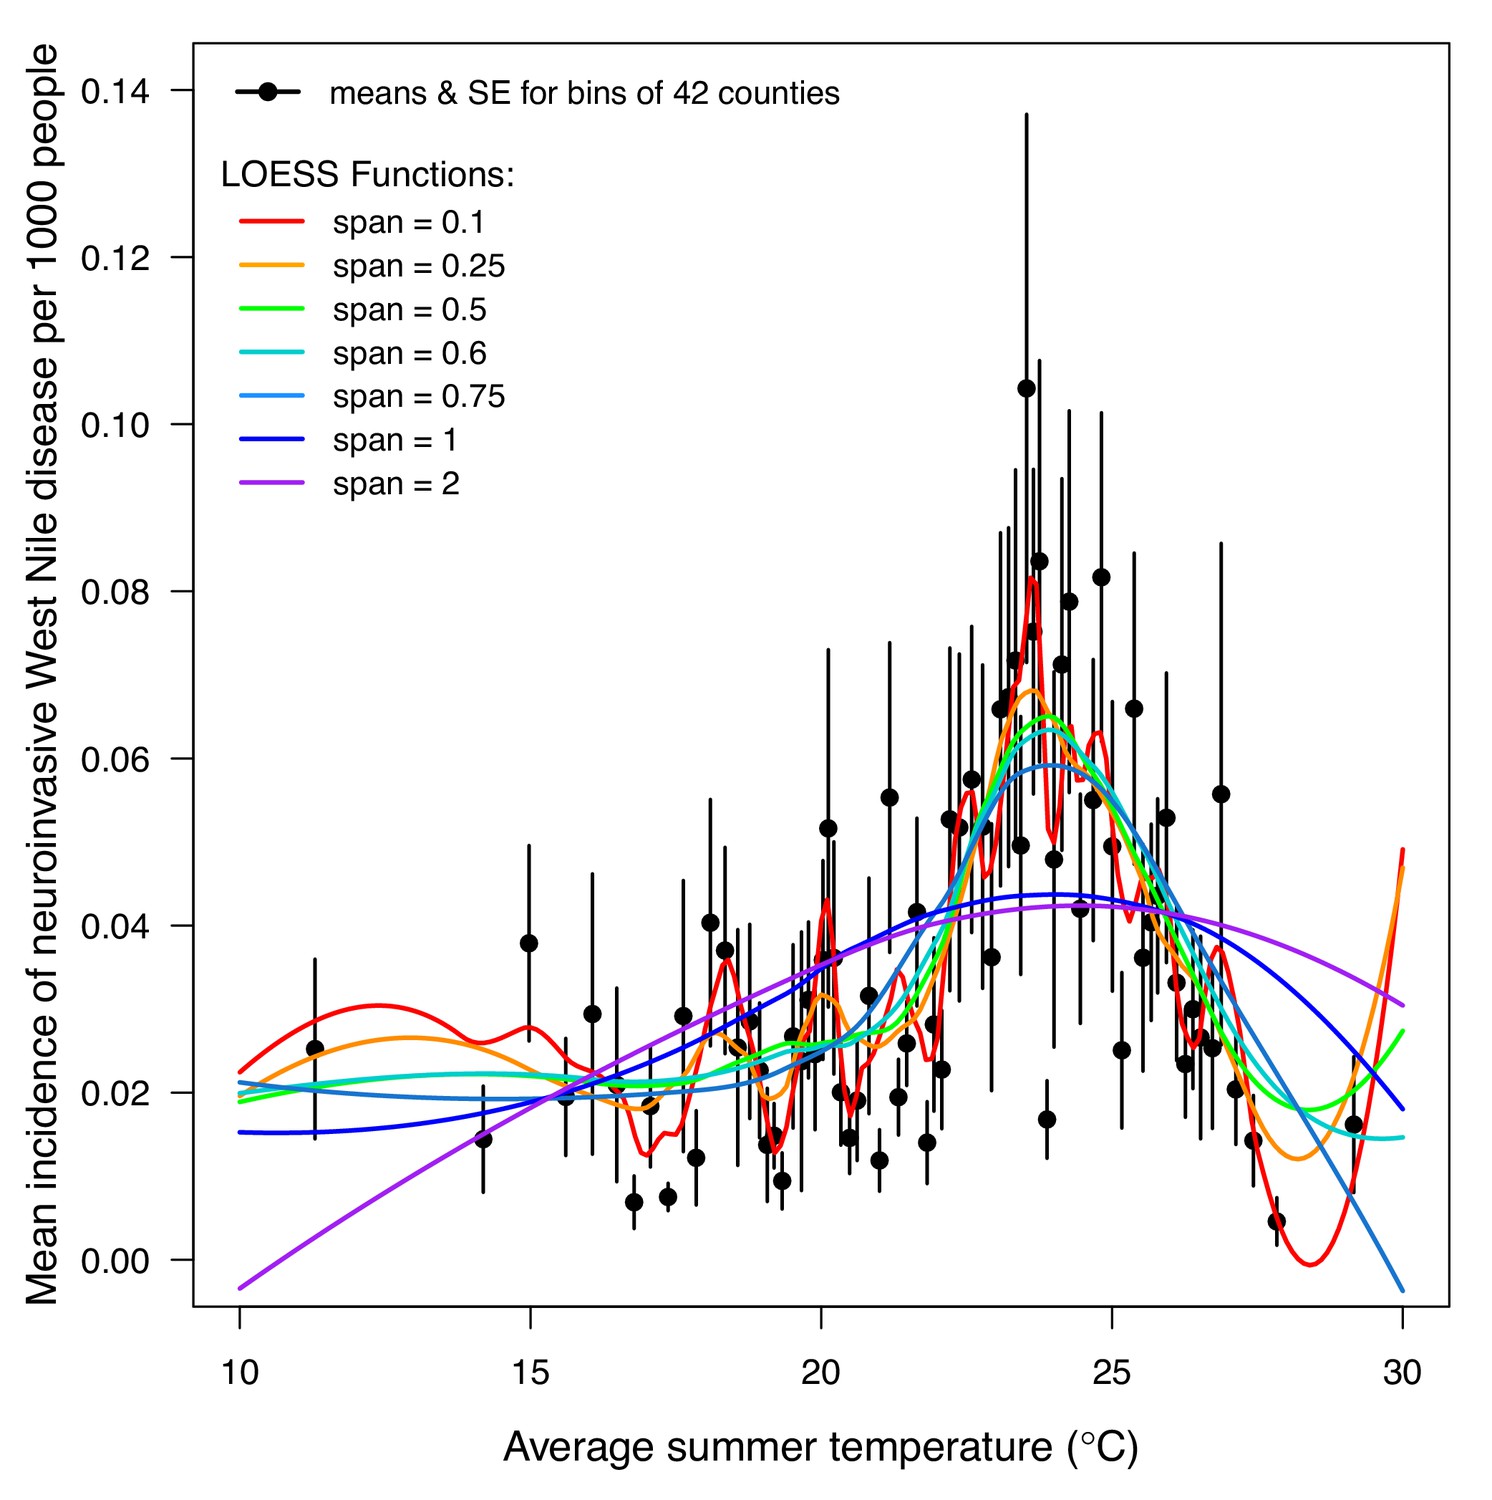
LOESS models of mean incidence (per 1000 people) of West Nile neuroinvasive disease (2000–2016) as a function of average summer temperature.
Points are means for bins of 42 counties (+ / - SE). Lines are locally estimated scatterplot smoothing (LOESS) regression models with different smoothing (span) parameters: 0.1 (red), 0.25 (orange), 0.5 (green), 0.6 (cyan), 0.75 (light blue), 1 (dark blue), and 2 (violet). Models were fit to raw county-level data (n = 3109, binned for visual clarity). The best model (span = 0.6, which appropriately balances overfitting and underfitting the data) estimates that incidence peaks at 23.9°C.
Appendix 1—figure 26
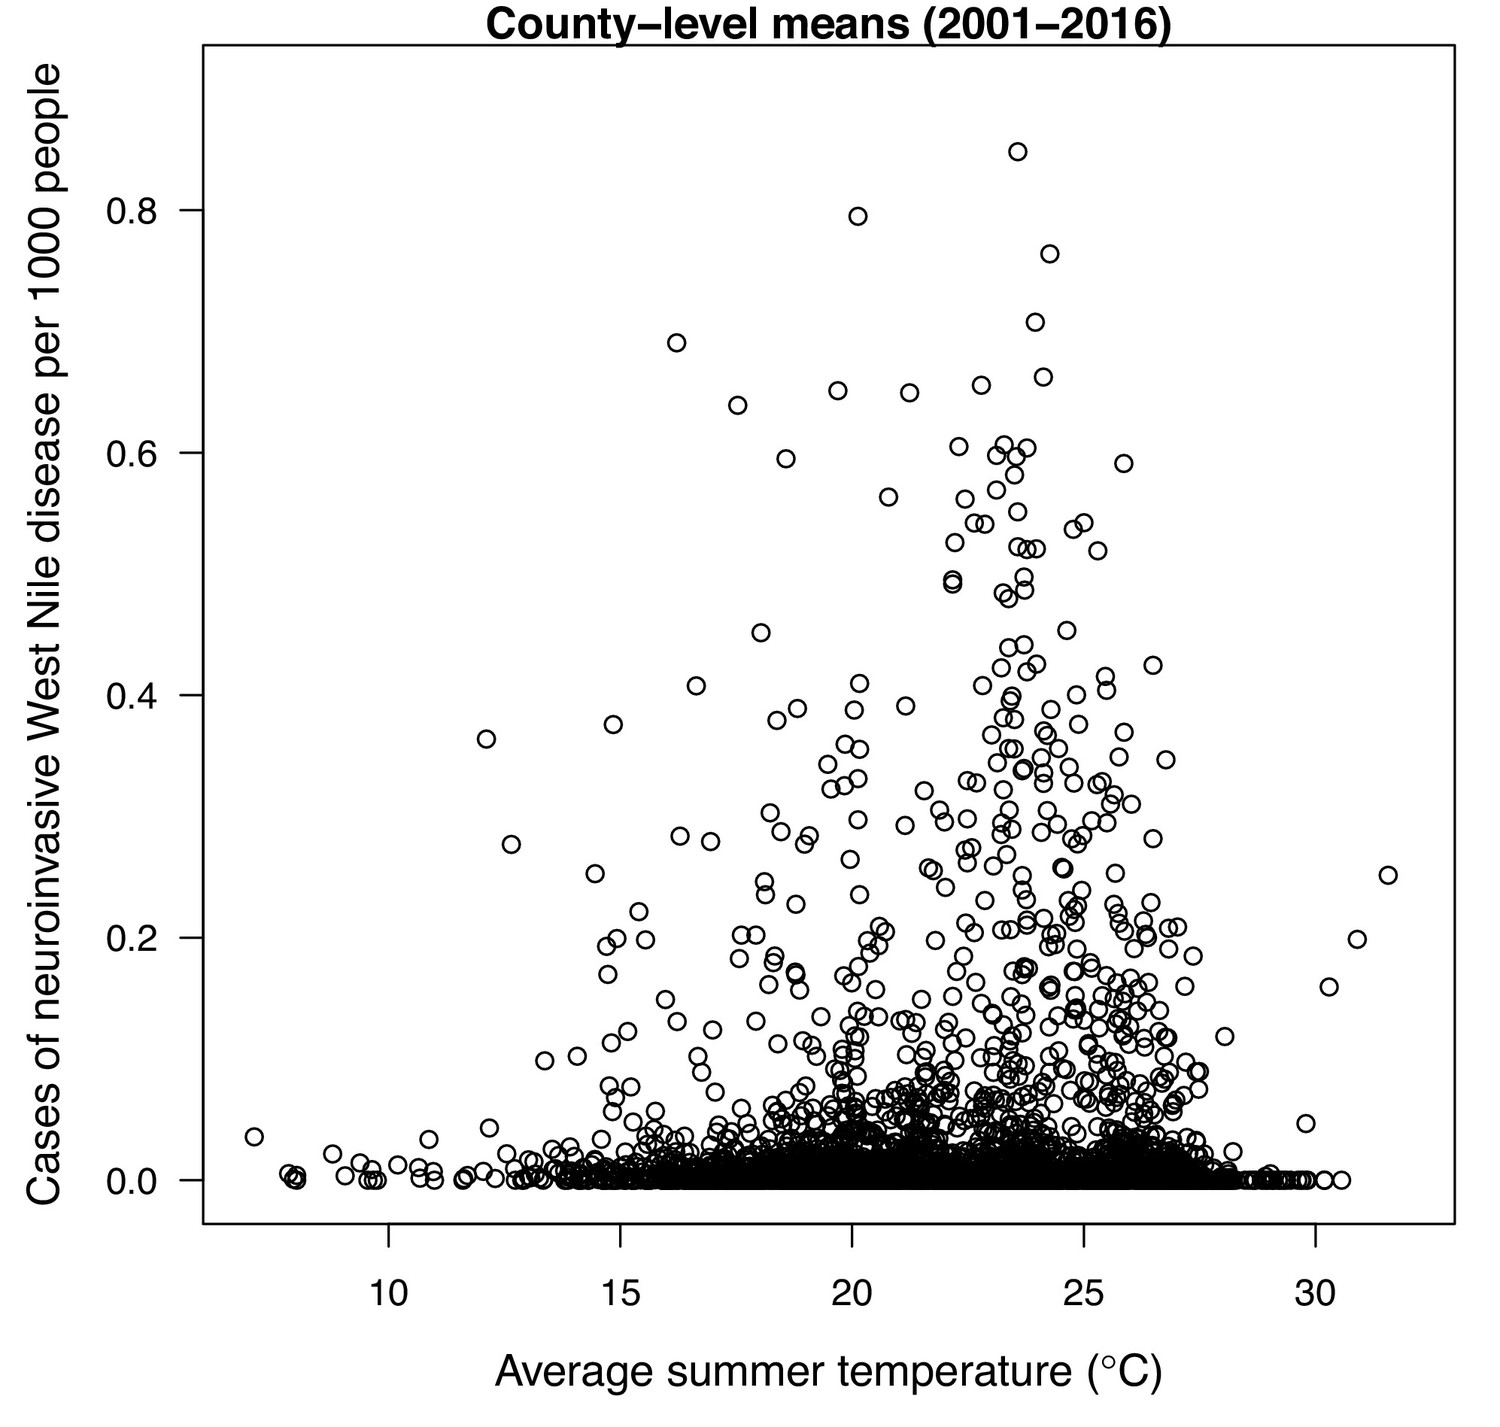
Raw county-level data (n = 3109) for mean incidence (per 1000 people) of neuroinvasive West Nile disease (2000–2016) as a function of average summer temperature.
Tables
Table 1
Properties of six viruses transmitted by an overlapping network of mosquito vectors.
| Virus (genus) | Primary vector spp. | Geographic range | Presentation and mortality | Epidemiology and Ecology |
|---|---|---|---|---|
| West Nile virus (WNV, Flavivirus) | Cx. modestus, Cx. pipiens, Cx. quinquefasciatus, Cx. tarsalis | Globally distributed | Febrile illness and encephalitis. 10% mortality in neuro-invasive cases. Long-term physical and cognitive disabilities. | The most common mosquito-borne disease in North America. Since invading in 1999, 7 million estimated infections, 22,999 neuroinvasive cases, and 2163 deaths in US; 5614 reported cases in Canada. Typically 100–300 cases annually in Europe, but over 1500 in 2018. Poor surveillance in Africa, but seroprevalence ~ 80% in some areas. Birds are main reservoir/amplification hosts. |
| St. Louis Encephalitis virus (SLEV, Flavivirus) | Cx. quinquefasciatus, Cx. tarsalis | Western hemisphere; western, midwestern, and southern US | Encephalitis. 5–15% mortality in diagnosed cases. | 92 cases and six deaths recorded in US from 2009 to 2018. Birds are main reservoir/amplification hosts. |
| Eastern Equine Encephalitis virus (EEEV, Alphavirus) | Ae. triseriatus, Cs. melanura | Western hemisphere; eastern and midwestern US | Febrile illness and encephalitis. 33% mortality in diagnosed cases. Long-term cognitive disabilities. | 73 cases and 30 deaths recorded in US from 2009 to 2018. Birds are main reservoir/amplification hosts. |
| Western Equine Encephalitis virus (WEEV, Alphavirus) | Cx. tarsalis | Western hemisphere; western and midwestern US | Febrile illness and encephalitis. Low mortality, except in infants. | 640 cases recorded in US from 1964 to 2010. Birds are main reservoir/amplification hosts. WEEV is derived from a recombinant event between the ancestors of EEEV and SINV. |
| Sindbis virus (SINV, Alphavirus), also called Pogosta, Ockelbo, and Karelian Fever | Cx. torrentium, Cx. pipiens, Cx. univittatus | Europe, Africa, Asia and Australia, primarily northern Europe and southern Africa | Febrile illness, rash, and joint pain. No mortality, but long-term disability. | Poor surveillance except in Finland, where annual incidence is 2–26 per 100,000 people and seroprevalence can reach ~40%. Birds are main reservoir/amplification hosts. Long-distance migratory birds may spread the virus between temperate zones in Northern and Southern hemispheres. |
| Rift Valley Fever virus (RVFV, Phlebovirus) | Ae. mcintoshi, Ae. ochraceus, Ae. vexans, Cx. pipiens, Cx. poicilipes, Cx. theileri and many more | Africa and the Middle East | Febrile illness and encephalitis. < 1% mortality in total cases. 50% mortality in hemorrhagic cases, permanent blindness in 50% of ocular cases (<2% of cases). | Livestock are main reservoir/amplification hosts, and suffer mortality and abortion after being infected by mosquitoes. Most transmission to humans occurs via direct contact with infected livestock. Vertical transmission in vectors (via dormant eggs) can initiate epidemics. In eastern and southern Africa, there are large epidemics every 5–15 years driven by rainfall and blooms of Ae. spp. from low-lying flooded areas known as dambos. |
-
Sources: WNV (Centers for Disease Control and Prevention, 2018c; European Centre for Disease Prevention and Control, 2018; Golding et al., 2012; Government of Canada, 2018; Kilpatrick, 2011; Petersen et al., 2013; Ronca et al., 2019; Weaver and Barrett, 2004); SLEV (Centers for Disease Control and Prevention, 2018a; Weaver and Barrett, 2004); EEEV (Centers for Disease Control and Prevention, 2018b; Weaver and Barrett, 2004); WEEV (Ronca et al., 2016; Weaver and Barrett, 2004); SINV (Adouchief et al., 2016); RVFV (Braack et al., 2018; Linthicum et al., 2016; Sang et al., 2017; World Health Organization, 2018).
Table 2
Thermal optima and limits for transmission of mosquito-borne pathogens.
Median temperature of the lower thermal limit (Tmin), optimum, and upper thermal limit (Tmax), with 95% credible intervals in parentheses. A version of this table (without thermal breadth, different order of R0 models) was published in Mordecai et al., 2019 (Table 2 in that paper).
| R0 Model | Tmin (°C) | Optimum (°C) | Tmax (°C) | Thermal breadth (°C) |
|---|---|---|---|---|
| From this study: | ||||
| EEEV in Ae. triseriatus | 11.7 (8.8–16.3) | 22.7 (22.0–23.6) | 31.9 (31.1–33.0) | 20.0 (15.4–23.0) |
| WEEV in Cx. tarsalis | 8.6 (6.3–13.0) | 23.0 (22.0–24.7) | 31.9 (30.3–35.2) | 23.3 (18.2–27.0) |
| SINV in Cx. pipiens | 9.4 (6.9–13.3) | 23.2 (21.7–24.6) | 33.8 (28.2–37.0) | 23.8 (17.3–28.6) |
| WNV in Cx. univittatus | 11.0 (8.0–15.3) | 23.8 (22.7–25.0) | 33.6 (31.2–36.9) | 22.5 (18.2–26.3) |
| WNV in Cx. tarsalis | 12.1 (9.6–15.2) | 23.9 (22.9–25.9) | 32.0 (30.6–38.6) | 20.1 (16.3–26.7) |
| SLEV in Cx. tarsalis | 12.9 (11.0–14.8) | 24.1 (23.1–26.0) | 32.0 (30.6–38.5) | 19.2 (16.5–25.6) |
| WNV in Cx. pipiens | 16.8 (14.9–17.8) | 24.5 (23.6–25.5) | 34.9 (32.9–37.6) | 18.2 (15.8–21.2) |
| WNV in Cx. quinquefasciatus | 19.0 (14.1–20.9) | 25.2 (23.9–27.1) | 31.8 (31.1–32.2) | 12.7 (10.6–17.6) |
| RVFV in Ae. taeniorhynchus | 10.6 (8.6–14.4) | 25.9 (23.8–27.1) | 37.8 (34.4–39.1) | 27.0 (21.8–29.7) |
| SINV in Ae. taeniorhynchus | 9.7 (8.3–13.6) | 26.0 (23.9–27.3) | 37.8 (34.4–39.2) | 27.7 (22.6–30.0) |
| From previous studies: | ||||
| Falciparum malaria (Johnson et al., 2015) | 19.1 (16.0–23.2) | 25.4 (23.9–27.0) | 32.6 (29.4–34.3) | 13.2 (8.3–17.1) |
| DENV in Ae. albopictus (Mordecai et al., 2017) | 16.2 (13.0–19.8) | 26.4 (25.4–27.6) | 31.4 (29.5–34.0) | 15.2 (11.2–19.3) |
| Ross River virus (Shocket et al., 2018) | 17.0 (15.8–18.0) | 26.4 (26.0–26.6) | 31.4 (30.4–33.0) | 14.2 (12.8–16.2) |
| ZIKV in Ae. aegypti (Tesla et al., 2018) | 22.8 (20.5–23.8) | 28.9 (28.2–29.6) | 34.5 (34.1–36.2) | 11.7 (10.4–14.5) |
| DENV in Ae. aegypti (Mordecai et al., 2017) | 17.8 (14.6–21.2) | 29.1 (28.4–29.8) | 34.5 (34.1–35.8) | 16.7 (13.2–20.2) |
Table 3
Predicted optima for transmission of West Nile virus.
Predicted optima for transmission from this study and previous models. A version of this table (with R0 models for additional viruses and including thermal limits) was published in Mordecai et al., 2019 (as Table 3 in that paper).
| R0 Model | Optimum (°C) |
|---|---|
| From this study: | |
| WNV in Cx. pipiens | 24.5 |
| WNV in Cx. quinquefasciatus | 25.2 |
| WNV in Cx. tarsalis | 23.9 |
| WNV in Cx. univittatus | 23.8 |
| From previous studies: | |
| WNV in Cx. pipiens (Paull et al., 2017) | 24.9 |
| WNV in Cx. quinquefasciatus (Paull et al., 2017) | 24.3 |
| WNV in Cx. tarsalis (Paull et al., 2017) | 24.9 |
| WNV in Cx. pipiens (Vogels et al., 2017) | 28 |
| WNV in Cx. pipiens molestus (Vogels et al., 2017) | 28 |
| WNV in Cx. and Ae. spp. (Kushmaro et al., 2015) | 35 |
Appendix 1—table 1
Trait thermal responses used in transmission (R0) models.
Viruses: West Nile (WNV), Eastern and Western Equine Encephalitis (EEEV and WEEV), St. Louis Encephalitis (SLEV), Sindbis (SINV), and Rift Valley Fever (RVFV). Ae. vex. = Ae. vexans, Cs. mel. = Culiseta melanura; all other vectors (Cx. = Culex) listed under model names. Traits are: fecundity (as eggs/female/gonotrophic cycle [EFGC] or eggs per raft*proportion ovipositing [ER*pO]), egg viability (EV), larval-to-adult survival (pLA), mosquito development rate (MDR), lifespan (lf), biting rate (a), vector competence (bc, b [transmission efficiency], c [infection efficiency], or b*c, as available), and parasite development rate (PDR). The WNV–Cx. quinquefasciatus model uses Equation A2 (ER*pO); the EEEV–Ae. triseriatus model uses EFGC from Cx. pipiens and pO from Cs. melanura; all other models use Equation A1 (EFGC). When data were missing for a vector–virus pair, we substituted the most conservative (i.e. least restrictive of transmission) trait thermal response from a vector that occurs within the geographic range of disease transmission. Several models had multiple potentially valid choices for traits; we explain and show compare these alternative models with the main text versions in Appendix 1—figure 22. Checkmarks indicate a thermal response from the vector in the model name. The parasite development rate data for SINV was insensitive to temperature (Figure 4), so the trait thermal response was omitted from the SINV models (‘NA’).
| Model: virus–vector | EFGC or ER*pO | EV | pLA | MDR | lf | a | bc, c*b c, or b | PDR |
|---|---|---|---|---|---|---|---|---|
| WNV–Cx. pipiens | ✓ | ✓ | ✓ | ✓ | ✓ | ✓ | ✓ (bc) | ✓ |
| WNV–Cx. quinquefasciatus | ✓ | ✓ | ✓ | ✓ | ✓ | ✓ | Cx. uni. (bc) | ✓ |
| WNV–Cx. tarsalis | Cx. pip. | Cx. pip | ✓ | ✓ | ✓ | ✓ | ✓ (b) | ✓ |
| WNV–Cx. univittatus | Cx. pip. | Cx. pip. | Cx. pip. | Cx. pip. | Cx. pip. | Cx. pip. | ✓ (bc) | ✓ |
| WEEV–Cx. tarsalis | Cx. pip. | Cx. pip. | ✓ | ✓ | ✓ | ✓ | ✓ (c*b) | ✓ |
| SLEV–Cx. tarsalis | Cx. pip. | Cx. pip. | ✓ | ✓ | ✓ | ✓ | ✓ (c*b) | ✓ |
| EEEV–Ae. triseriatus | Cx. pip., Cs. mel. | Cx. pip. | ✓ | ✓ | Cx. pip. | Cs. mel. | ✓ (bc) | ✓ |
| SINV–Cx. pipiens | ✓ | ✓ | ✓ | ✓ | ✓ | ✓ | ✓ (c) | NA |
| SINV–Ae. taeniorhynchus | Cx. pip. | Ae. vex. | Ae. vex. | Ae. vex. | ✓ | Cx. pip. | ✓ (c) | NA |
| RVFV–Ae. taeniorhynchus | Cx. pip. | Cx. the. | Ae. vex. | Ae. vex. | ✓ | Cx. pip. | ✓ (bc) | ✓ |
Appendix 1—table 2
Trait thermal response functions, data sources, and posterior estimates: biting rate and fecundity traits.
Asymmetrical responses fit with Brière function (B): B(T)=qT(T – Tmin)(Tmax – T)1/2; symmetrical responses fit with quadratic function (Q): Q(T) = -q(T – Tmin)(T – Tmax). Median function coefficients and optima (with 95% credible intervals).
| Trait/Species data source] | F(x) | q (CIs) | Tmin (CIs) | Tmax (CIs) | Topt (CIs) |
|---|---|---|---|---|---|
| Biting rate (a) | |||||
| Cx. pipiens (Li et al., 2017; Madder et al., 1983; Ruybal et al., 2016; Tekle, 1960) | B | 1.70·10−4 (1.18–2.29·10−4) | 9.4 (2.8–13.4) | 39.6 (37.9–40.6) | 32.7 (31.3–33.6) |
| Cx. quinquefasciatus (Reisen et al., 1992; Tekle, 1960) | B | 7.28·10−5 (5.31–11.8·10−5) | 3.1 (0.1–10.9) | 39.3 (38.0–40.8) | 31.9 (30.6–33.3) |
| Cx. tarsalis (Reisen et al., 1992) | B | 1.67·10−4 (0.87–2.56·10−4) | 2.3 (0.1–9.4) | 32.0 (30.6–41.7) | 25.9 (24.8–33.9) |
| Cs. melanura (Mahmood and Crans, 1997) | B | 1.87·10−4 (1.49–2.31·10−4) | 7.8 (5.5–11.4) | 31.8 (31.0–33.4) | 26.4 (25.7–27.9) |
| Fecundity | |||||
| Cx. pipiens (EFGC) (Li et al., 2017) | Q | 5.98·10−1 (4.31–7.91·10−1) | 5.3 (2.6–8.5) | 38.9 (36.2–41.8) | 22.1 (20.1–24.4) |
| Cx. quinquefasciatus (ER) (Mogi, 1992; Oda et al., 1980) | Q | 6.36·10−1 (4.50–9.05·10−1) | 5.0 (1.3–9.8) | 37.7 (34.8–40.7) | 21.4 (18.9–24.4) |
| Proportion ovipositing (pO) | |||||
| Cx. pipiens (Ciota et al., 2014; Tekle, 1960) | Q | 4.45·10−3 (2.54–7.77·10−3) | 8.2 (4.6–12.1) | 33.2 (30.1–37.5) | 20.8 (18.6–23.4) |
| Cx. quinquefasciatus (Ciota et al., 2014; Oda et al., 1980; Tekle, 1960) | B | 6.67·10−4 (5.80–7.91·10−4) | 1.7 (0.2–4.8) | 31.8 (31.1–32.2) | 24.9 (21.8–26.0) |
| Cs. melanura (Mahmood and Crans, 1997) | Q | 6.31·10−3 (4.52–7.89·10−3) | 8.7 (6.9–10.4) | 33.6 (32.5–35.4) | 20.7 (16.9–22.3) |
| Egg viability (EV) | |||||
| Ae. vexans (McHaffey, 1972a) | 1.24·10−3 (0.73–1.95·10−3) | 0 (0–1.6) | 55.5 (45.9–74.1) | 27.6 (20.4–34.0) | |
| Cx. pipiens (Li et al., 2017) | Q | 2.11·10−3 (1.36–3.05·10−3) | 3.2 (0.5–7.1) | 42.6 (39.7–48.3) | 23.0 (20.7–26.3) |
| Cx. quinquefasciatus (Oda et al., 1980; Rayah and Groun, 1983) | B | 0.47·10−3 (0.34–0.62·10−3) | 13.6 (9.3–16.8) | 38.0 (37.2–38.7) | 32.1 (31.3–32.7) |
| Cx. theileri (van der Linde TC de et al., 1990) | Q | 2.54·10−3 (1.86–3.41·10−3) | 5.5 (2.6–8) | 45.4 (42.4–49.0) | 23.6 (18.2–27.0) |
-
Additional data sources for other species used for fitting priors only (priors were fit using all data except that of the focal species). Fecundity (ER): Cx. pipiens molestus (Oda et al., 1980), Cx. pipiens pallens (Mogi, 1992), and Ae. dorsalis (Parker, 1982). Proportion ovipositing (pO): Cx. pipiens molestus (Oda et al., 1980) and Ae. dorsalis (Parker, 1982). Egg viability (EV): Cx. pipiens molestus (Oda et al., 1980), Aedes dorsalis (McHaffey and Harwood, 1970), and Ae. nigromaculis ( McHaffey, 1972b). See Appendix 1 section: Priors for trait thermal responses.
Appendix 1—table 3
Trait thermal response functions, data sources, and posterior estimates: larval traits.
Asymmetrical responses fit with Brière function (B): B(T)=qT(T – Tmin)(Tmax – T)1/2; symmetrical responses fit with quadratic function (Q): Q(T) = -q(T – Tmin)(T – Tmax). Median function coefficients and optima (with 95% credible intervals).
| Trait/Species (data source) | F(x) | q (CIs) | Tmin (CIs) | Tmax (CIs) | Topt (CIs) |
|---|---|---|---|---|---|
| Mosquito Dev. Rate (MDR) | |||||
| Ae. triseriatus (Shelton, 1973) | B | 4.30·10−5 (3.01–5.83·10−5) | 0.8 (0–7.5) | 36.5 (34.6–39.5) | 29.3 (27.8–31.9) |
| Ae. vexans (Brust, 1967; Trpiš and Shemanchuk, 1970) | B | 4.33·10−5 (3.34–5.50·10−5) | 1.9 (0.1–10.5) | 38.2 (37.0–39.5) | 30.9 (29.8–32.2) |
| Cx. pipiens (Ciota et al., 2014; Loetti et al., 2011; Madder et al., 1983; Mpho et al., 2002a; Mpho et al., 2002b Ruybal et al., 2016; Tekle, 1960) | B | 3.76·10−5 (3.36–4.47·10−5) | 0.1 (0–4.0) | 38.5 (37.6–39.8) | 30.9 (30.2–31.9) |
| Cx. quinquefasciatus (Ciota et al., 2014; Mpho et al., 2001; Rueda et al., 1990; Shelton, 1973; Tekle, 1960) | B | 4.14·10−5 (3.46–5.26·10−5) | 0.1 (0–5.5) | 38.6 (37.4–40.6) | 31.0 (30.0–32.6) |
| Cx. tarsalis (Buth et al., 1990; Dodson et al., 2012; Reisen, 1995) | B | 4.12·10−5 (3.15–5.47·10−5) | 4.3 (0–8.4) | 39.9 (37.9–42.2) | 32.3 (31.0–34.0) |
| Cs. melanura (Mahmood and Crans, 1998) | B | 2.74·10−5 (1.64–4.72·10−5) | 8.6 (0–16.8) | 37.6 (35.1–40.4) | 31.1 (28.7–33.7) |
| Larval survival (pLA) | |||||
| Ae. triseriatus (Shelton, 1973; Teng and Apperson, 2000) | Q | 3.26·10−3 (1.95–5.18·10−3) | 8.3 (4.9–11.4) | 35.7 (32.9–39.7) | 22.0 (19.9–24.6) |
| Ae. vexans (Brust, 1967; Trpiš and Shemanchuk, 1970) | Q | 3.29·10−3 (2.65–4.24·10−3) | 9.1 (8.1–10.6) | 40.8 (38.4–43.6) | 25.0 (23.9–26.2) |
| Cx. pipiens (Ciota et al., 2014; Loetti et al., 2011; Madder et al., 1983; Mpho et al., 2002a; Mpho et al., 2002b; Ruybal et al., 2016; Tekle, 1960) | Q | 3.60·10−3 (2.96–4.42·10−3) | 7.8 (6.1–9.3) | 38.4 (37.1–39.9) | 23.1 (22.2–24.0) |
| Cx. quinquefasciatus (Ciota et al., 2014; Mogi, 1992; Mpho et al., 2001; Oda et al., 1999; Rueda et al., 1990; Shelton, 1973; Tekle, 1960) | Q | 4.26·10−3 (3.51–5.17·10−3) | 8.9 (7.6–9.9) | 37.7 (36.2–39.2) | 23.3 (22.5–24.0) |
| Cx. tarsalis (Buth et al., 1990; Dodson et al., 2012; Reisen, 1995) | Q | 2.12·10−3 (1.52–3.08·10−3) | 5.9 (3.0–8.8) | 43.1 (39.8–47.5) | 24.6 (22.9–26.4) |
| Cs. melanura (Mahmood and Crans, 1998) | Q | 3.03·10−3 (1.55–5.68·10−3) | 10.1 (5.7–15.1) | 36.2 (32.8–40.7) | 23.2 (20.4–26.5) |
-
Additional data sources for other species used for fitting priors only (priors were fit using all data except that of the focal species). Mosquito Development Rate (MDR): Cx. pipiens molestus (Kiarie-Makara et al., 2015; Olejnícek and Gelbic, 2000), Cx. pipiens pallens (Kiarie-Makara et al., 2015), Cx. restuans (Buth et al., 1990; Madder et al., 1983; Muturi et al., 2011; Shelton, 1973), Cx. salinarius (Shelton, 1973), Ae. solicitans (Shelton, 1973), and Ae. nigromaculis (Brust, 1967). Larval survival (pLA): Cx. pipiens molestus (Oda et al., 1999; Olejnícek and Gelbic, 2000), Cx. pipiens pallens (Mogi, 1992), Cx. restuans (Buth et al., 1990; Ciota et al., 2014; Madder et al., 1983; Muturi et al., 2011; Shelton, 1973), Cx. salinarius (Shelton, 1973), Ae. sollicitans (Shelton, 1973), Ae. nigromaculis (Brust, 1967). See Appendix 1 section: Priors for trait thermal responses.
Appendix 1—table 4
Trait thermal response functions, data sources, and posterior estimates: vector competence traits.
Asymmetrical responses fit with Brière function (B): B(T)=qT(T – Tmin)(Tmax – T)1/2; symmetrical responses fit with quadratic function (Q): Q(T) = -q(T – Tmin)(T – Tmax). Median function coefficients and optima (with 95% credible intervals).
| Trait/Species (data source) | F(x) | q (CIs) | Tmin (CIs) | Tmax (CIs) | Topt (CIs) |
|---|---|---|---|---|---|
| Transmission efficiency (b) | |||||
| SLEV | Cx. tarsalis (Reisen et al., 1993) | Q | 2.98·10−3 (1.63–5.31·10−3) | 10.8 (6.2–14.2) | 41.6 (36.8–49.1) | 26.2 (23.5–29.7) |
| WEEV | Cx. tarsalis (Reisen et al., 1993) | Q | 3.17·10−3 (1.65–5.06·10−3) | 8.2 (5.1–10.7) | 33.5 (31.0–38.9) | 20.9 (19.2–23.2) |
| WNV | Cx. tarsalis (Reisen et al., 2006) | Q | 2.94·10−3 (1.91–4.48·10−3) | 11.3 (7.6–14.0) | 41.9 (37.7–47.0) | 26.6 (23.9–29.3) |
| Infection efficiency (c) | |||||
| SINV | Ae. taeniorhynchus (Turell and Lundström, 1990) | Q | 1.24·10−3 (0.75–2.17·10−3) | 1.4 (0–9.1) | 48.4 (40.8–57.1) | 25.4 (21.0–31.1) |
| SINV | Cx. pipiens (Lundström et al., 1990) | Q | 1.33·10−3 (0.47–2.30·10−3) | 0 (0–0) | 35.0 (28.1–61.1) | 17.5 (14.1–30.5) |
| WNV | Cx. pipiens (Dohm et al., 2002; Kilpatrick et al., 2008) | Q | 2.56·10−3 (2.05–3.19·10−3) | 15.6 (14.3–16.6) | 52.2 (48.4–56.6) | 33.9 (31.9–36.1) |
| SLEV | Cx. tarsalis (Reisen et al., 1993) | Q | 2.03·10−3 (1.28–3.07·10−3) | 8.8 (6.6–10.6) | 43.7 (38.9–51.4) | 26.2 (24.2–29.7) |
| WEEV | Cx. tarsalis (Kramer et al., 1983; Reisen et al., 1993) | Q | 3.04·10−3 (2.52–3.68·10−3) | 1.3 (0.4–2.9) | 38.8 (36.7–41.5) | 15.5 (13.4–19.7) |
| Vector competence (bc) | |||||
| RVFV | Ae. taeniorhynchus (Turell et al., 1985) | Q | 1.51·10−3 (1.03–2.05·10−3) | 7.1 (2.8–9.8) | 42.3 (39.3–46.5) | 24.7 (22.0–27.0) |
| EEEV | Ae. triseriatus (Chamberlain and Sudia, 1955) | Q | 1.51·10−3 (0.96–2.24·10−3) | 7.0 (2.9–11.9) | 50.3 (42.3–63.1) | 28.8 (23.6–35.8) |
| WNV | Cx. pipiens (Kilpatrick et al., 2008) | Q | 3.05·10−3 (1.68–4.87·10−3) | 16.8 (15–17.9) | 38.9 (36.1–44.1) | 27.8 (26.6–30.1) |
| WEEV | Cx. tarsalis (Kramer et al., 1983) | Q | 1.17·10−3 (0.55–2.36·10−3) | 5.1 (0.6–13.3) | 37.0 (33.5–46.0) | 21.4 (18.1–27.3) |
| WNV | Cx. univittatus (Cornel et al., 1993) | Q | 2.32·10−3 (1.58–3.68·10−3) | 4.2 (1.5–7.1) | 45.2 (39.6–53.0) | 23.7 (19.4–27.3) |
Appendix 1—table 5
Trait thermal response functions, data sources, and posterior estimates: parasite development rate.
Asymmetrical responses fit with Brière function (B): B(T)=qT(T – Tmin)(Tmax – T)1/2; symmetrical responses fit with quadratic function (Q): Q(T) = -q(T – Tmin)(T – Tmax). Median function coefficients and optima (with 95% credible intervals).
| Trait/Species (data source) | F(x) | q (CIs) | Tmin (CIs) | Tmax (CIs) | Topt (CIs) |
|---|---|---|---|---|---|
| Parasite Dev. Rate (PDR) | |||||
| RVFV | Ae. taeniorhynchus (Turell et al., 1985) | B | 8.84·10−5 (2.51–15.5·10−5) | 9.0 (5.4–13.8) | 45.9 (41.9–50.3) | 37.8 (34.5–41.3) |
| EEEV | Ae. triseriatus (Chamberlain and Sudia, 1955) | B | 7.05·10−5 (5.21–9.68·10−5) | 11.6 (7.0–16.4) | 44.8 (40.6–49.4) | 37.2 (33.8–41.1) |
| WNV | Cx. pipiens (Dohm et al., 2002; Kilpatrick et al., 2008) | B | 7.38·10−5 (5.38–9.94·10−5) | 11.4 (7.3–15.0) | 45.2 (40.7–50.3) | 37.5 (33.8–41.6) |
| WNV | Cx. quinquefasciatus (Paull et al., 2017) | B | 7.12·10−5 (4.58–10.2·10−5) | 19.0 (12.9–21.0) | 44.1 (38.8–50.4) | 37.7 (33.6–42.7) |
| SLEV | Cx. tarsalis (Reisen et al., 1993) | B | 7.11·10−5 (5.60–8.95·10−5) | 12.8 (10.3–14.3) | 45.2 (40.2–51.5) | 37.7 (33.8–42.6) |
| WEEV | Cx. tarsalis (Kramer et al., 1983; Reisen et al., 1993) | B | 6.43·10−5 (4.44–10.4·10−5) | 4.0 (0–12.6) | 44. 0 (38.3–50.9) | 35.7 (31.0–41.4) |
| WNV | Cx. tarsalis (Reisen et al., 2006) | B | 6.57·10−5 (5.11–8.85·10−5) | 11.2 (7.9–14.9) | 44.7 (40.4–49.4) | 37.0 (33.6–40.9) |
| WNV | Cx. univittatus (Cornel et al., 1993) | B | 7.54·10−5 (4.13–11.1·10−5) | 10.2 (7.1–15.3) | 34.4 (31.2–51.1) | 28.8 (26.1–42.5) |
| SINV | Ae. taeniorhynchus (Turell and Lundström, 1990) | NA | Not fitted because lack of temperature sensitivity | |||
Appendix 1—table 6
Trait thermal response functions, data sources, and posterior estimates: lifespan.
Responses fit with a linear function (L): L(T) = -mT + z. Median function coefficients and Tmax (with 95% credible intervals).
| Trait/Species (data source) | F(x) | m | z | Tmax = z/m |
|---|---|---|---|---|
| Lifespan (lf) | ||||
| Ae. taeniorhynchus (Nayar, 1972) | L | 2.02 (1.59–3.19) | 85.9 (73.8–117.6) | 42.7 (34.5–48.5) |
| Cx. pipiens (Andreadis et al., 2014; Ciota et al., 2014; Ruybal et al., 2016) | L | 4.86 (3.83–5.84) | 169.8 (142.1–195.6) | 34.9 (32.9–37.9) |
| Cx. quinquefasciatus (Ciota et al., 2014; Oda et al., 1999) | L | 3.80 (1.85–5.29) | 136.3 (86.8–174.0) | 35.9 (32.1–48.5) |
| Cx. tarsalis (Reisen, 1995) | L | 1.69 (1.12–2.24) | 69.6 (55.8–83.5) | 41.3 (36.6–50.8) |
-
Additional data sources for other species used for fitting priors only (priors were fit using all data except that of the focal species). Lifespan (lf): Cx. pipiens molestus (Kiarie-Makara et al., 2015; Oda et al., 1999), Cx. pipiens pallens (Kiarie-Makara et al., 2015), and Cx. restuans (Ciota et al., 2014). See Appendix 1 section: Priors for trait thermal responses.
Appendix 1—table 7
Priors for trait thermal response functions: mosquito traits with unimodal responses.
Gamma distribution parameters (α [shape] and β [rate]) for priors for fitting thermal response parameters (Tmin, Tmax, and q). Scaled variances are noted in parentheses, either by the system name (applied to all parameters) or by individual parameters. See Appendix 1 section: Priors for trait thermal responses.
| Trait/System | q: α | q: β | Tmin: α | Tmin: β | Tmax: α | Tmax: β |
|---|---|---|---|---|---|---|
| Biting rate (a) | ||||||
| Cx. pipiens (0.5) | 8.84 | 64200 | 1.91 | 0.367 | 103 | 3.00 |
| Cx. quinquefasciatus | 39.1 (0.1) | 234133 (0.1) | 8.82 (0.1) | 0.997 (0.1) | 2992 | 75.8 |
| Cx. tarsalis | 40.1 (0.05) | 227752 (0.05) | 18.7 (0.05) | 1.745 (0.05) | unif. | unif. |
| Cs. melanura | 35.4 (0.75) | 229694 (0.75) | 7.77 (0.75) | 0.895 (0.75) | 2714 (0.1) | 68.5 (0.1) |
| Fecundity | ||||||
| Cx. pipiens (EFGC) (3) | 9.23 | 15.6 | 2.38 | 0.419 | 139 | 3.52 |
| Cx. quinquefasciatus (ER) | 19.1 | 30.44 | 2.87 | 0.600 | 486 | 13.2 |
| Prop. ovipositing (pO) | ||||||
| Cx. pipiens (0.5) | 9.50 | 1823 | 14.8 | 1.495 | 263 | 7.14 |
| Cx. quinquefasciatus | 32.9 | 55242 | 1.41 | 0.397 | 3346 | 106 |
| Cs. melanura | 14.4 | 2635 | 22.0 | 2.254 | 588 | 16.8 |
| Egg viability (EV) | ||||||
| Ae. vexans (0.01) | 26.6 | 12259 | 11.6 | 1.916 | 486 | 10.8 |
| Cx. pipiens (0.2) | 29.4 | 14525 | 8.83 | 1.579 | 514 | 11.1 |
| Cx. quinquefasciatus (0.1) | 101 | 262268 | 1.08 | 1.032 | 1361 | 34.9 |
| Cx. theileri | 5.86 | 2266 | 4.46 | 0.591 | 266 | 6.06 |
| Mos. dev. rate (MDR) | ||||||
| Ae. triseriatus (0.2) | 118 | 2697528 | 1.93 | 0.703 | 5542 | 145 |
| Ae. vexans (0.5) | 119 | 2739401 | 1.89 | 0.689 | 6661 | 174 |
| Cx. pipiens (0.1) | 71.9 | 1545915 | 2.03 | 0.596 | 2912 | 76.5 |
| Cx. quinquefasciatus (0.1) | 113 | 2569782 | 1.81 | 0.651 | 5900 | 155 |
| Cx. tarsalis (0.1) | 129 | 2940582 | 1.49 | 0.660 | 6431 | 169 |
| Cs. melanura (0.1) | 129 | 2941063 | 1.78 | 0.685 | 6915 | 181 |
| Larval survival (pLA) | ||||||
| Ae. triseriatus (0.05) | 163 | 46723 | 231 | 27.3 | 4667 | 122 |
| Ae. vexans (0.05) | 135 | 37701 | 210 | 24.6 | 4040 | 107 |
| Cx. pipiens (0.1) | 102 | 27382 | 217 | 24.2 | 2872 | 76.7 |
| Cx. quinquefasciatus (0.1) | 88.8 | 26461 | 123 | 14.8 | 2608 | 68.4 |
| Cx. tarsalis (0.025) | 94.6 | 23240 | 237 | 26.2 | 2564 | 69.5 |
| Cs. melanura (0.05) | 148.9 | 41533 | 239 | 27.8 | 4391 | 116 |
Appendix 1—table 8
Priors for trait thermal response functions: infection traits.
Gamma distribution parameters (α [shape] and β [rate]) for priors for fitting thermal response parameters (Tmin, Tmax, and q). Scaled variances are noted in parentheses, either by the system name (applied to all parameters) or by individual parameters. See Appendix 1 section: Priors for trait thermal responses.
| Trait/System | q: α | q: β | Tmin: α | Tmin: β | Tmax: α | Tmax: β |
|---|---|---|---|---|---|---|
| Transmission efficiency (b) | 7.72 | 3202 | 9.97 | 1.268 | 114 | 2.9 |
| SLEV | Cx. tarsalis (0.5) | 9.49 | 2373 | 79.6 | 6.181 | 153 | 3.74 |
| WEEV | Cx. tarsalis (0.1) | 8.46 | 3056 | 12.1 | 1.455 | 134 | 3.5 |
| WNV | Cx. tarsalis | 7.72 | 3202 | 9.97 | 1.268 | 114 | 2.9 |
| Infection efficiency (c) | ||||||
| SINV | Ae. taeniorhynchus (0.1) | 61.7 | 45102 | 2.49 | 0.815 | 1214 | 25.1 |
| SINV | Cx. pipiens (0.01) | 57.3 | 40236 | 2.64 | 0.799 | 1124 | 23.28 |
| WNV | Cx. pipiens | 28.5 | 15944 | 1.44 | 0.852 | 237 | 5.393 |
| SLEV | Cx. tarsalis | 65.2 (0.01) | 46656 (0.01) | 1.67 (0.01) | 0.692 (0.01) | 1071 (0.1) | 22.2 (0.1) |
| WEEV | Cx. tarsalis (0.01) | 82.2 | 35791 | 392 | 30.502 | 1264 | 26.1 |
| Vector competence (bc) | ||||||
| RVFV | Ae. taeniorhynchus (2) | 8.4 | 4775 | 2.316 | 0.421 | 147 | 3.39 |
| EEEV | Ae. triseriatus | 6.68 (3) | 3612 (3) | 2.027 (3) | 0.383 (3) | 119 (0.01) | 2.86 (0.01) |
| WNV | Cx. pipiens (0.5) | 17.6 | 7857 | 1.403 | 0.534 | 219 | 5.42 |
| WEEV | Cx. tarsalis (0.5) | 9.56 | 5344 | 3.021 | 0.498 | 180 | 4.05 |
| WNV | Cx. univittatus | 13.7 (0.01) | 2327 (0.01) | 380 (0.01) | 22.434 (0.01) | 527 (0.1) | 14.4 (0.1) |
| Parasite dev. rate (PDR) | ||||||
| RVFV | Ae. taeniorhynchus | 20.2 (0.2) | 331065 (0.2) | 8.69 (2) | 0.893 (2) | 227 (2) | 4.96 (2) |
| EEEV | Ae. triseriatus (2) | 13.2 | 167635 | 6.76 | 0.609 | 183 | 4.05 |
| WNV | Cx. pipiens | 8.71 (2) | 113904 (2) | 3.51 (5) | 0.356 (5) | 140 (2) | 3.17 (2) |
| WNV | Cx. quinquefasciatus | 15.8 | 201154 | 8.09 | 0.772 | 202 | 4.44 |
| SLEV | Cx. tarsalis | 11.8 | 151149 | 6.31 | 0.584 | 179 | 3.97 |
| WEEV | Cx. tarsalis | 10.3 | 117795 | 9.97 (0.05) | 0.768 (0.05) | 162 | 3.62 |
| WNV | Cx. tarsalis (2) | 11.7 | 148079 | 5.92 | 0.541 | 169 | 3.77 |
| WNV | Cx. univittatus | 12.3 | 146439 | 9.02 (3) | 0.773 (3) | 174 (0.2) | 3.87 (0.2) |
Appendix 1—table 9
Priors for trait thermal response functions: lifespan.
Gamma distribution parameters (α [shape] and β [rate]) for priors for fitting thermal response parameters (m and z). Scaled variances are noted in parentheses, either by the system name (applied to all parameters) or by individual parameters. See Appendix 1 section: Priors for trait thermal responses.
| Trait/System (var.) | m: α | m: β | z: α | z: β |
|---|---|---|---|---|
| Lifespan (lf) | ||||
| Ae. taeniorhynchus (0.01) | 119 | 52.9 | 268 | 3.19 |
| Cx. pipiens (0.01) | 117 | 42.4 | 238 | 2.39 |
| Cx. quinquefasciatus (0.01) | 110 | 32.9 | 207 | 1.78 |
| Cx. tarsalis (0.1) | 124 | 43.0 | 249 | 2.42 |
Appendix 1—table 10
Model results for GAMs of mean incidence (per 1000 people) of West Nile neuroinvasive disease as a function of average summer temperature.
Statistics for models fit with differing numbers of knots: edf (estimated degrees of freedom), Ref-df, F, and p-value refer to the smoothed temperature term (see Fig A24 for plots). Dev. exp. = percent deviance explained. Topt = temperature of peak incidence.
| Panel in Fig A24 | # knots | edf | Ref-df | F | p-value | Adj. R2 | Dev. exp. (%) | Topt |
|---|---|---|---|---|---|---|---|---|
| A | k = 4 | 2.96 | 2.99 | 15.87 | 4.03·10−10 | 0.018 | 2.33 | 23.8°C |
| B | k = 5 | 3.77 | 3.97 | 11.11 | 4.64·10−9 | 0.019 | 2.44 | 24.2°C |
| C | k = 6 | 4.71 | 4.96 | 11.97 | 4.77·10−11 | 0.022 | 2.85 | 23.5°C |
| D | k = 7 | 5.53 | 5.92 | 11.01 | 1.31·10−11 | 0.024 | 3.11 | 23.6°C |
| E | k = 8 | 6.55 | 6.93 | 11.12 | 2.73·10−13 | 0.026 | 3.62 | 24.1°C |
| F | k = 9 | 7.19 | 7.80 | 10.06 | 3.17·10−13 | 0.026 | 3.67 | 24.2°C |
Additional files
Download links
A two-part list of links to download the article, or parts of the article, in various formats.
Downloads (link to download the article as PDF)
Open citations (links to open the citations from this article in various online reference manager services)
Cite this article (links to download the citations from this article in formats compatible with various reference manager tools)
Transmission of West Nile and five other temperate mosquito-borne viruses peaks at temperatures between 23°C and 26°C
eLife 9:e58511.
https://doi.org/10.7554/eLife.58511


