Cadherin preserves cohesion across involuting tissues during C. elegans neurulation
- Developmental Biology Program, Memorial Sloan Kettering Cancer Center, United States
- Graduate Program in Neuroscience, Weill Cornell Medicine, United States
- Department of Neuroscience and Department of Cell Biology, Yale University School of Medicine, United States
- Instituto de Neurobiología, Recinto de Ciencias Médicas, Universidad de Puerto Rico, United States
- Molecular Cytology Core, Memorial Sloan Kettering Cancer Center, United States
Figures
Figure 1 with 4 supplements
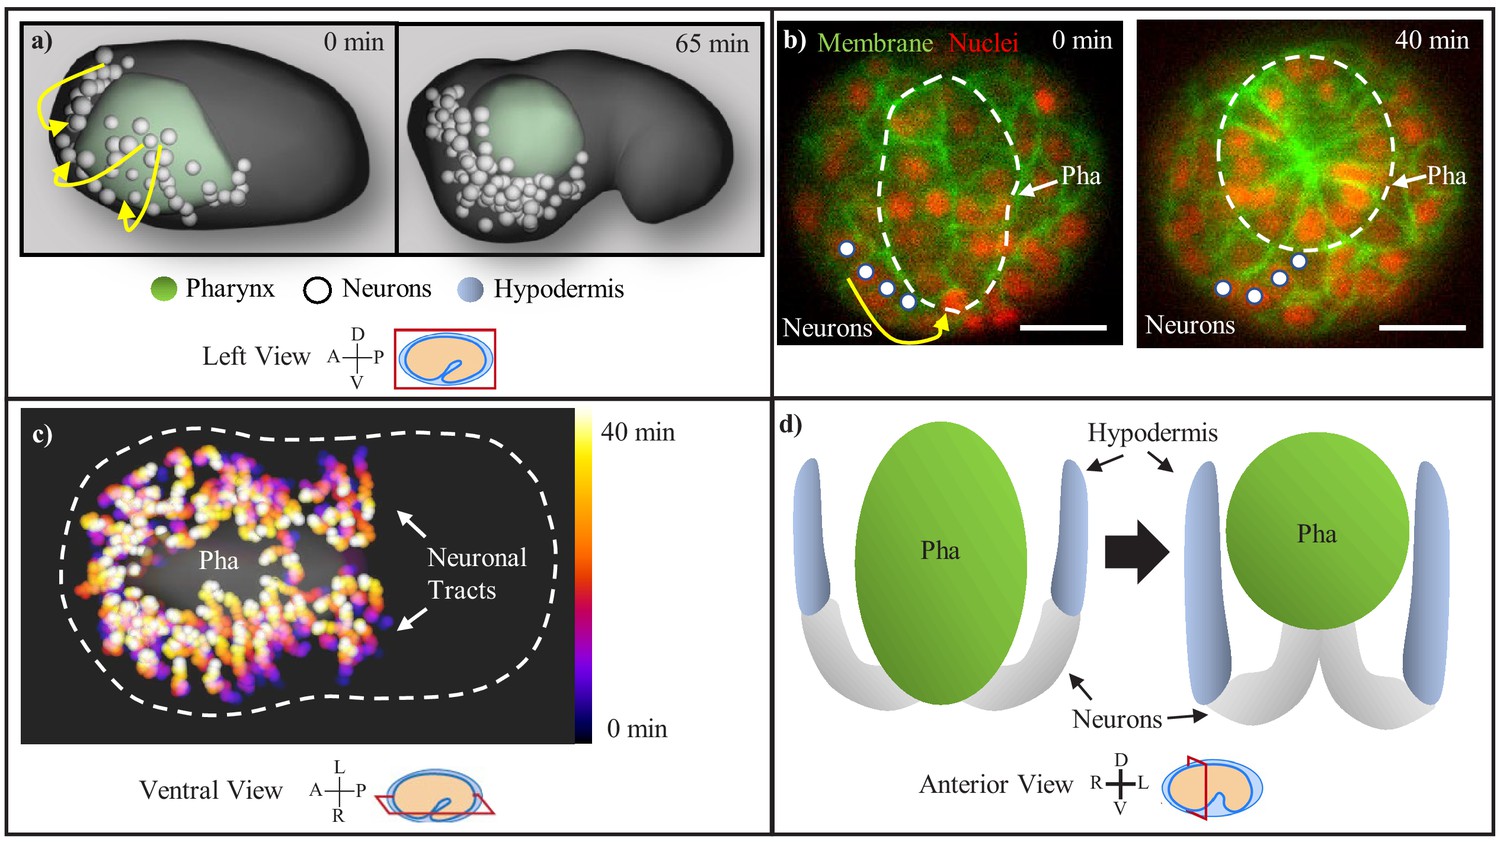
C. elegans nervous system centralization consists of the involution of the neuroectoderm with the retracting pharynx.
(a) Head neurons (white) are observed enveloping the pharynx (green) as visualized in the WormGUIDES app. Yellow arrows indicate the circumferential path of the involuting neurons. Axis compass and view plane are displayed in this format throughout all figure panels. (b) Neuron chain (marked by white circles) during involution, shown in unc33p::PH::GFP expressing embryos (transverse plane at mid-pharynx, marked by white-dashed circle). Yellow arrow indicates path of involuting neurons. Red channel is cell nuclei. Scale bars are 10 µm. (c) Temporal max projection of involuting neurons on WormGUIDES, with chains progressing over 40 min from black/purple to yellow/white. White-dashed line is the embryo outline. (d) Model showing the pharynx (green), neuron chain (white), and hypodermis (blue) before and after pharynx retraction and involution.
Figure 1—figure supplement 1
Persistent contact between involuting neuroectoderm and hypoderm.
(a) Hypodermal cells (marked by blue circles) and neuroectodermal cells (marked by white circles) during involution, shown in unc33p::PH::GFP expressing embryos (left view, pharynx marked by white-dashed circle). Yellow arrow indicates interface between hypodermal cells and neuroectoderm. Red channel is cell nuclei. Scale bars are 10 µm.
Figure 1—video 1
Video of involution in WormGUIDES embryo.
Involuting neuronal nuclei are labeled in white, and the pharynx (calculated as a Voronoi diagram from pharyngeal nuclei) is labeled in green. The neurons can be observed involuting toward the retracting ventral and anterior sides of the pharynx. Timing is 1 hr, from WG time 270–330.
Figure 1—video 2
Anterior View, video of involution in WormGUIDES embryo.
Involuting neuronal nuclei are labeled in white, and the pharynx (calculated as a Voronoi diagram from pharyngeal nuclei) is labeled in green. The neurons can be observed involuting toward the retracting ventral and anterior sides of the pharynx. Timing is 1 hr, from WG time 270–330.
Figure 1—video 3
Pan membrane (Unc-33::PH::GFP) imaging with histone:RFP marker, side view, shows leading edge of the hypodermis cohesively attached to involuting chain of neuroectoderm (marked by blue arrow).
Scale bar = 10 µm.
Figure 2
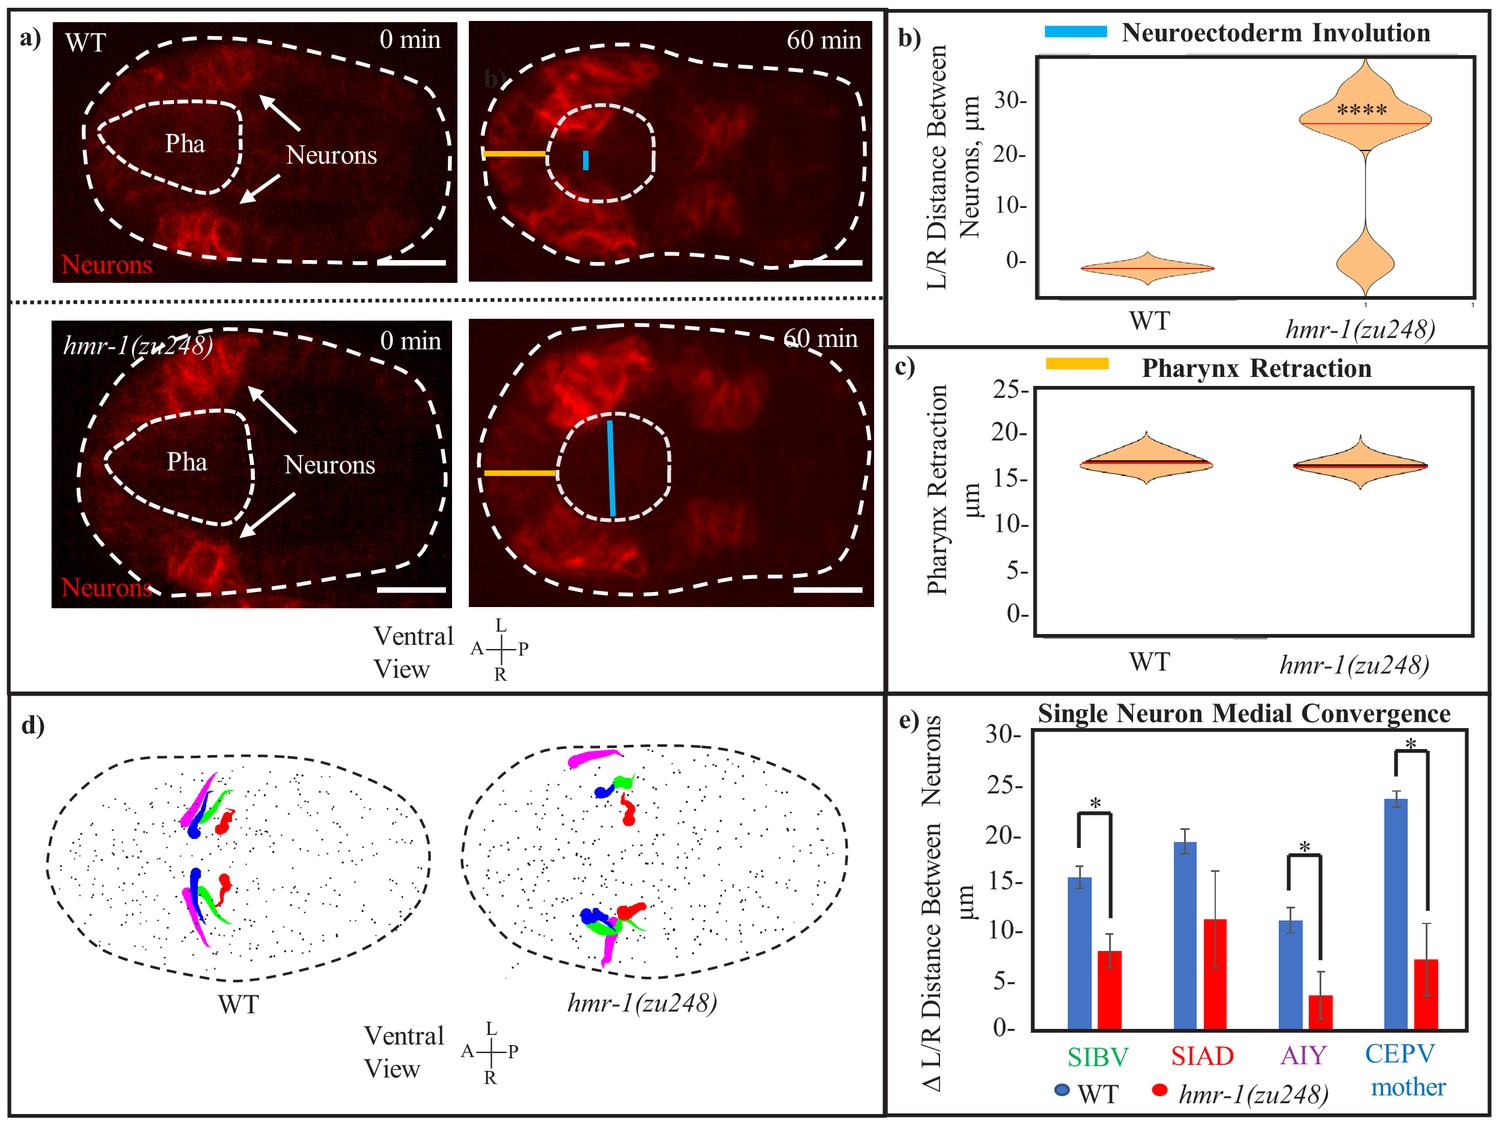
Involution of the C. elegans head neurons requires HMR-1.
(a) Ventral neurons in cnd1p::PH::RFP expressing embryos move toward the midline during involution. Distance between left/right leading edges (blue line) is visibly increased in hmr-1(zu248) mutants. Outer dashed line is embryo outline, inner dashed line is pharynx. Distance of pharynx retraction (orange line) is conserved. Scale bars are 10 µm. (b) Involution of the neuroectoderm is measured as the distance between left and right side neurons in (n = 12) hmr-1(zu248) embryos versus in (n = 10) WT embryos (measurement of the blue line from panel a). Measurement is performed at the timepoint where the line is the shortest. Median is marked by red, significance was calculated with a one-tailed student’s t-test. ****p < 0.001. (c) Pharynx retraction in WT vs hmr-1(zu248) embryos. Measurement is of length from anterior pole of embryo to anterior pole of pharynx (orange line in a). n = 6 embryos (WT) and n = 8 embryos (hmr-1 mutant). Red line in plot marks median. (d) Motion paths of select neurons near the leading edge of involuting tissue in WT and hmr-1(zu248) embryos. Tadpole shape represents progression from early timepoints (tail) to late timepoints (head). Colors of neuron names in (d) are the same as the color of the equivalent motion paths (left and right). Dashed line is embryo outline, gray dots are other cells. (e) Quantification of movement trajectories from (c), measuring distance traveled by L/R partners toward each other. Significance across n = 3 embryos was calculated with a one-tailed student’s t-test. *p < 0.05.
-
Figure 2—source data 1
Measurements of neuroectoderm involution and pharynx retraction for Figure 2b and c, determined in Fiji from 10 cnd1p::PH::RFP embryos.
WT embryos are listed above and hmr-1(zu248) below, with neuroectoderm involution (distance between opposite side neurons) listed on the left and pharynx retraction (distance of pharynx from anterior edge of embryo) on the right. Pixels are translated into microns at a ration of 3:1.
- https://cdn.elifesciences.org/articles/58626/elife-58626-fig2-data1-v1.xlsx
-
Figure 2—source data 2
Data for Figure 2e.
Start and end distances between left/right neuronal pairs. Top table is start/end distances, and second table is made by subtracting start/end distances to get total distance traveled toward each other and averaging between n = 3 embryos. Pixel to micron ratio is 3:1. t-test is as described in Statistical methods section.
- https://cdn.elifesciences.org/articles/58626/elife-58626-fig2-data2-v1.xlsx
Figure 3 with 2 supplements
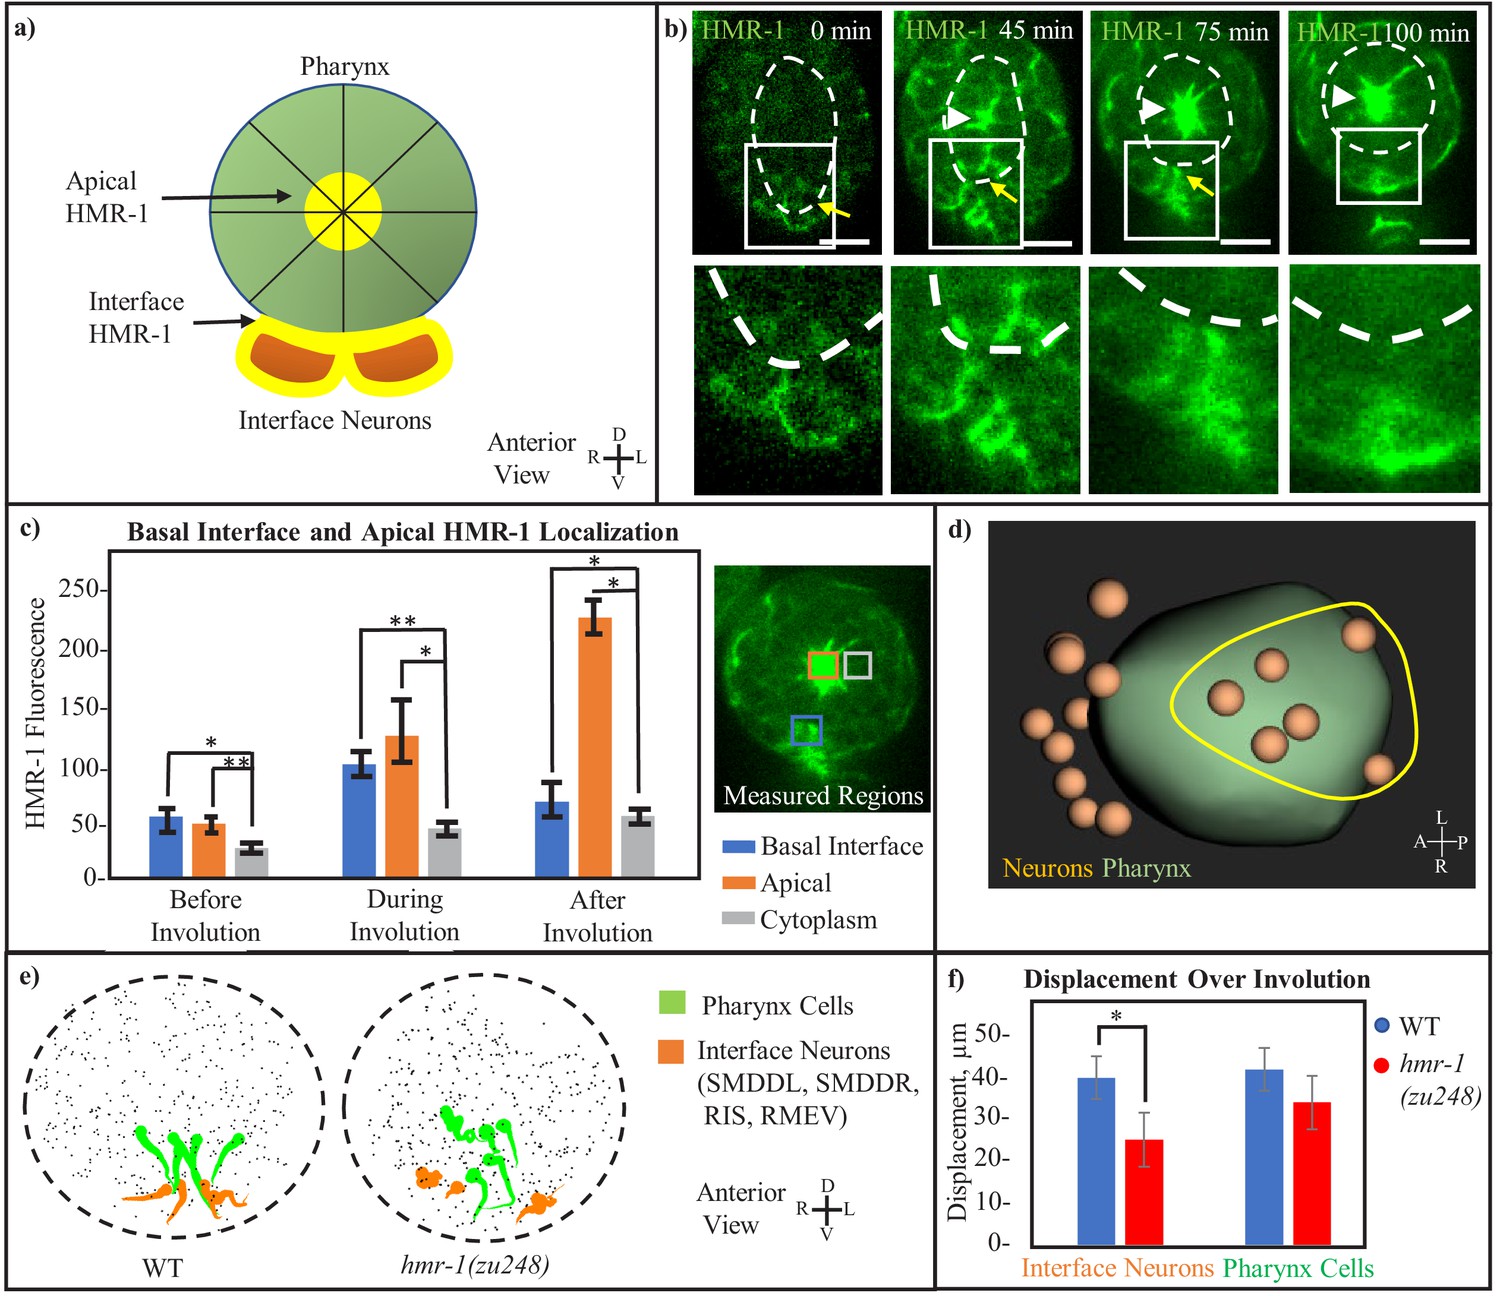
Cohesion at the inter-tissue interface is maintained by a local HMR-1 patch.
(a) Model of the adhesive HMR-1 interface (yellow) at the connection between ventral interface neurons (orange) and the retracting pharynx (green) mediating inter-tissue cohesion during involution. Apical HMR-1 is labeled, and lines through pharynx indicate apical constriction. (b) Anterior view HMR-1::GFP timeseries showing the basolateral (interface) and apical HMR-1 patches, starting before pharynx retraction when the interface patch is first forming, and ending after pharynx retraction when the interface patch disappears and only the apical localization remains. White arrowheads indicate apical HMR-1, yellow arrow indicates interface HMR-1. Cutouts show enlarged view of the interface at each timepoint. White-dashed line indicates pharynx. Scale bars are 10 µm. (c) Local HMR-1::GFP fluorescence intensity minus background, assessed across n = 5 embryos at three timepoints before, during, and after retraction. Measurements were taken in an anterior view, with measured regions highlighted in corresponding colors. Error bars represent standard deviation at given timepoint. A 2-tailed t-test with equal variance was performed, * < 0.05, **p < 0.01. (d) Interface neurons, defined as those with a persistent connection to a pharynx cell from the beginning of involution for at least 75% of timepoints, form a patch near the ventral midline (full data in Figure 3—figure supplement 1 and Table 1). Yellow circle indicated rough shape of the group of interface neurons on the ventral side of the pharynx. (e) Anterior view shows motion paths of four interface neurons (orange) as well as their pharyngeal neighbors (green) in WT and hmr-1(zu248). Tadpoles are as in (2e). Black dashed circle is embryo outline, gray dots are other cells. (f) Graph showing the total displacement over the timecourse of involution (n = 3 embryos). Neurons: SMDDL, SMDDR, Pharynx Cells: Selected in each embryo according to proximity to SMDDL/R. *p < 0.05.
-
Figure 3—source data 1
Data for Figure 3c.
HMR-1::GFP fluorescence intensity values listed before, during and after involution from anterior viewpoints of 5 WT embryos. Pharynx retraction degree was used to determine retraction degree. Basal, apical, and cytoplasm locations are indicated in Figure 3c, and background is calculated from outside of the embryo.
- https://cdn.elifesciences.org/articles/58626/elife-58626-fig3-data1-v1.xlsx
-
Figure 3—source data 2
Data from Figure 3f.
Distance between pharyngeal nuclei and interface neuron before and after pharynx retraction, in WT and hmr-1(zu248) mutants.
- https://cdn.elifesciences.org/articles/58626/elife-58626-fig3-data2-v1.xlsx
Figure 3—figure supplement 1
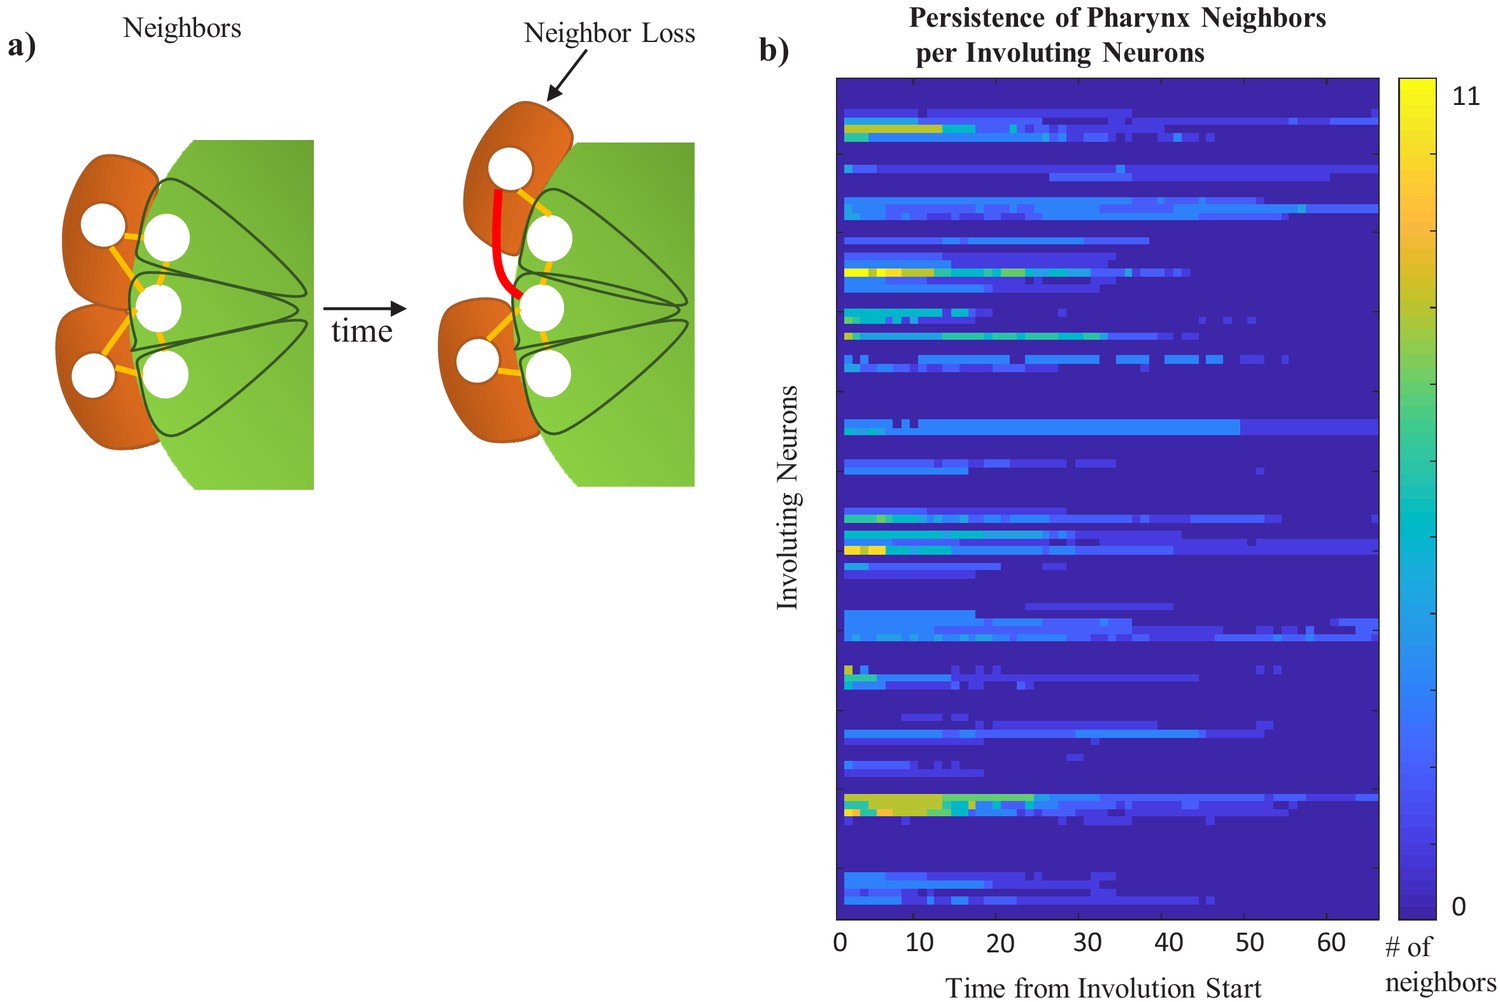
Computational assessment of persistent cohesion from relative nuclear location.
(a) Model of a Delaunay triangulation of an optimized cell nucleus–cell nucleus Voronoi graph. If an edge between two cells cannot be drawn without intersecting the nucleus of another cell (red line), the cells are not neighbors. If it can (orange lines), they are neighbors (b) Quantity of initial pharyngeal neighbors maintained over time for each neuron as measured by Delaunay triangulation. Coloring of blue to yellow indicates total # of pharyngeal neighbors to a given neuron at any timepoint. Full data in Table 1.
Figure 3—video 1
HMR-1:GFP localization at the ventral pharynx–neuron interface in addition to the apical lumen of the pharynx.
Video of progression in (Figure 3e). Scale bar = 10 µm.
Figure 4 with 1 supplement
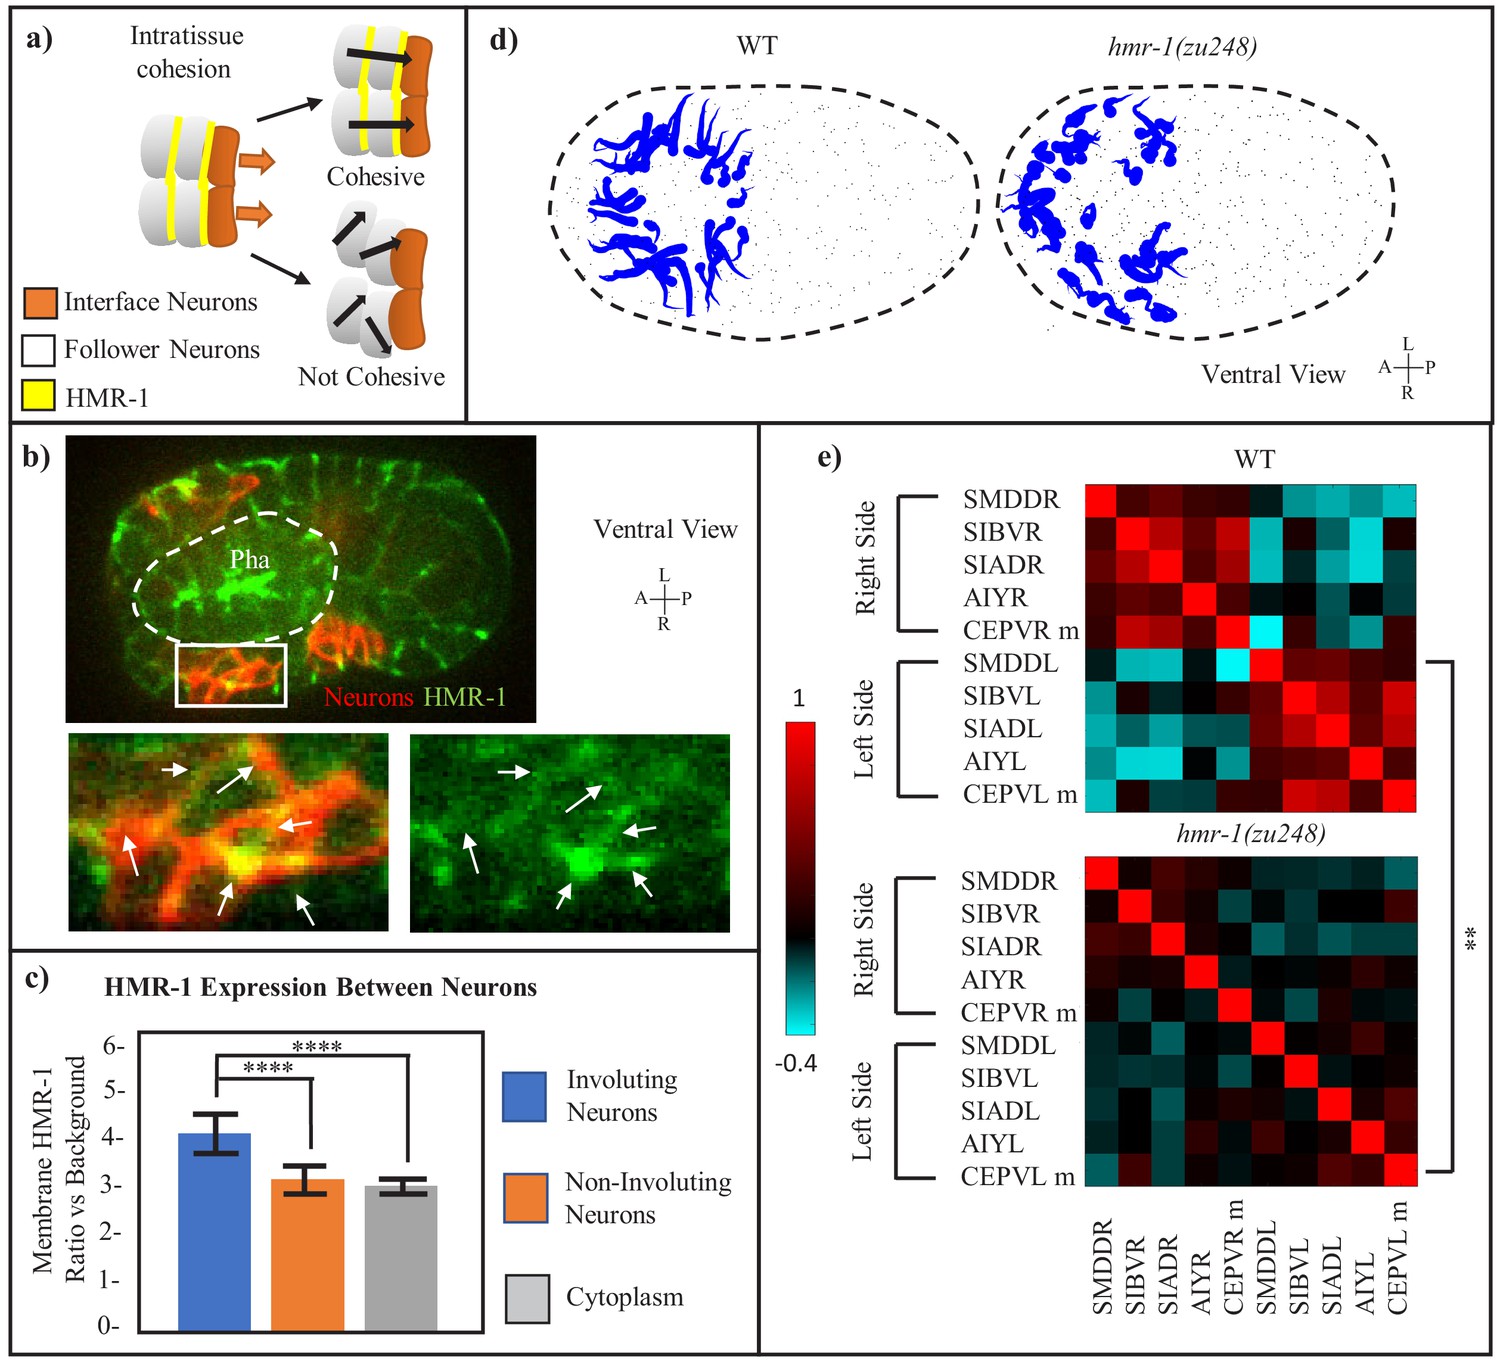
Intratissue Cohesion in the Neuroectoderm also Requires hmr-1.
(a) Model of expected neuronal behavior with and without intratissue cohesion. Yellow lines indicate adhesive interfaces between cells. Orange arrows mark the movement of interface neurons with the pharynx, black arrows mark the expected path of neurons. (b) HMR-1::GFP localization at the connection between involuting neurons. The patch of neurons is marked by cnd1p::PH::RFP expression and enlarged in cutout. White-dashed line represents pharynx. White arrows in cutout indicate HMR-1::GFP signal at cell boundaries. Scale bars = 10 µm. (c) Quantification of HMR-1::GFP fluorescence at involuting neuronal boundaries, assessed at cnd1p::PH::RFP+ membranes (n = 6 embryos, five membranes per embryo). Amphid neurons, which are not involved in involution, are used as a control. Error bars represent standard deviation. Statistical comparison was done with a 2-tailed t-test for equal variance, ****p < 0.0001. (d) Motion paths of neurons in WT and hmr-1(zu248) embryos, tadpoles are as in (2e). Black dashed circle is embryo outline, gray dots are other cells. (e) Movement path correlation of select involuting neurons in a cluster on the ventral side, between WT (n = 3) and hmr-1(zu248) (n = 3) embryos. Bar indicates correlation value for each color (1 = moving in same direction, −1 = moving in opposite directions). Left side vs right side neurons are labeled. P-value of. 01 calculated with paired t-test applied globally between neurons. M is mother. **p < 0.01.
-
Figure 4—source data 1
Data for Figure 4c.
HMR-1::GFP fluorescence is measured at cell edges among involuting neurons and non-involuting neurons (amphid), and also in the cytoplasm of involuting neurons. All measurements are mid-involution, and normalization to the background is done by using background values from outside the embryo.
- https://cdn.elifesciences.org/articles/58626/elife-58626-fig4-data1-v1.xlsx
-
Figure 4—source data 2
Data for Figure 4e.
Motion path correlation path values are given for neurons in n = 3 embryos, and the average for each pairwise correlation is displayed in the heatmap shown in Figure 4e.
- https://cdn.elifesciences.org/articles/58626/elife-58626-fig4-data2-v1.xlsx
Figure 4—figure supplement 1
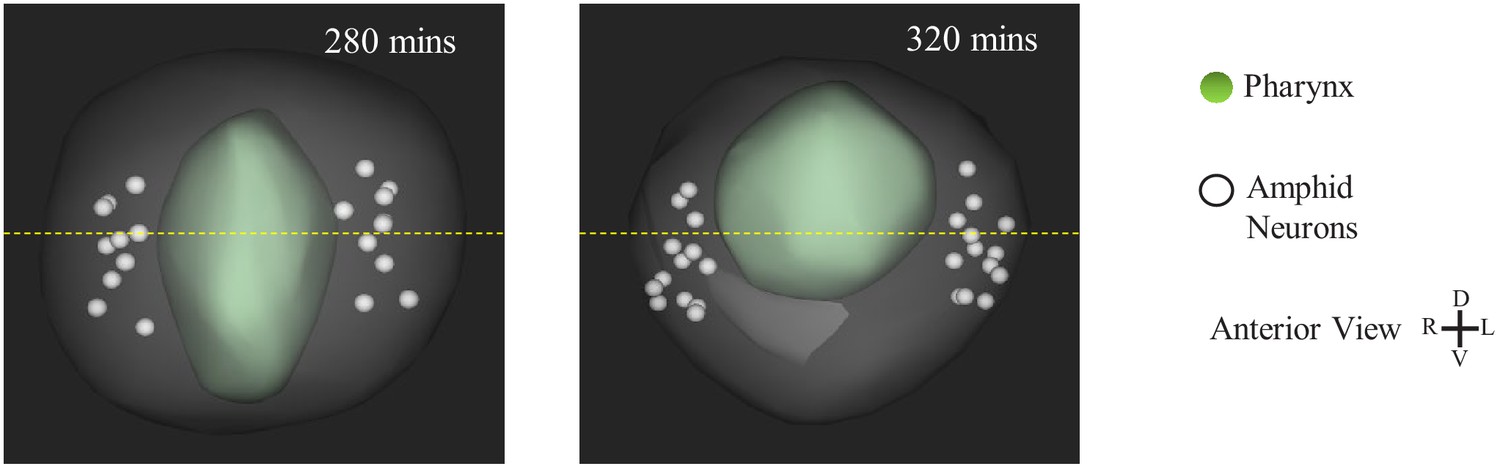
Amphid Neurons Fail to Move toward the Ventral Midline.
(a) WormGUIDES rendering of the amphid neuron nuclei during pharynx retraction. The yellow- dashed line represents the dorsal-ventral midpoint of the embryo.
Figure 5
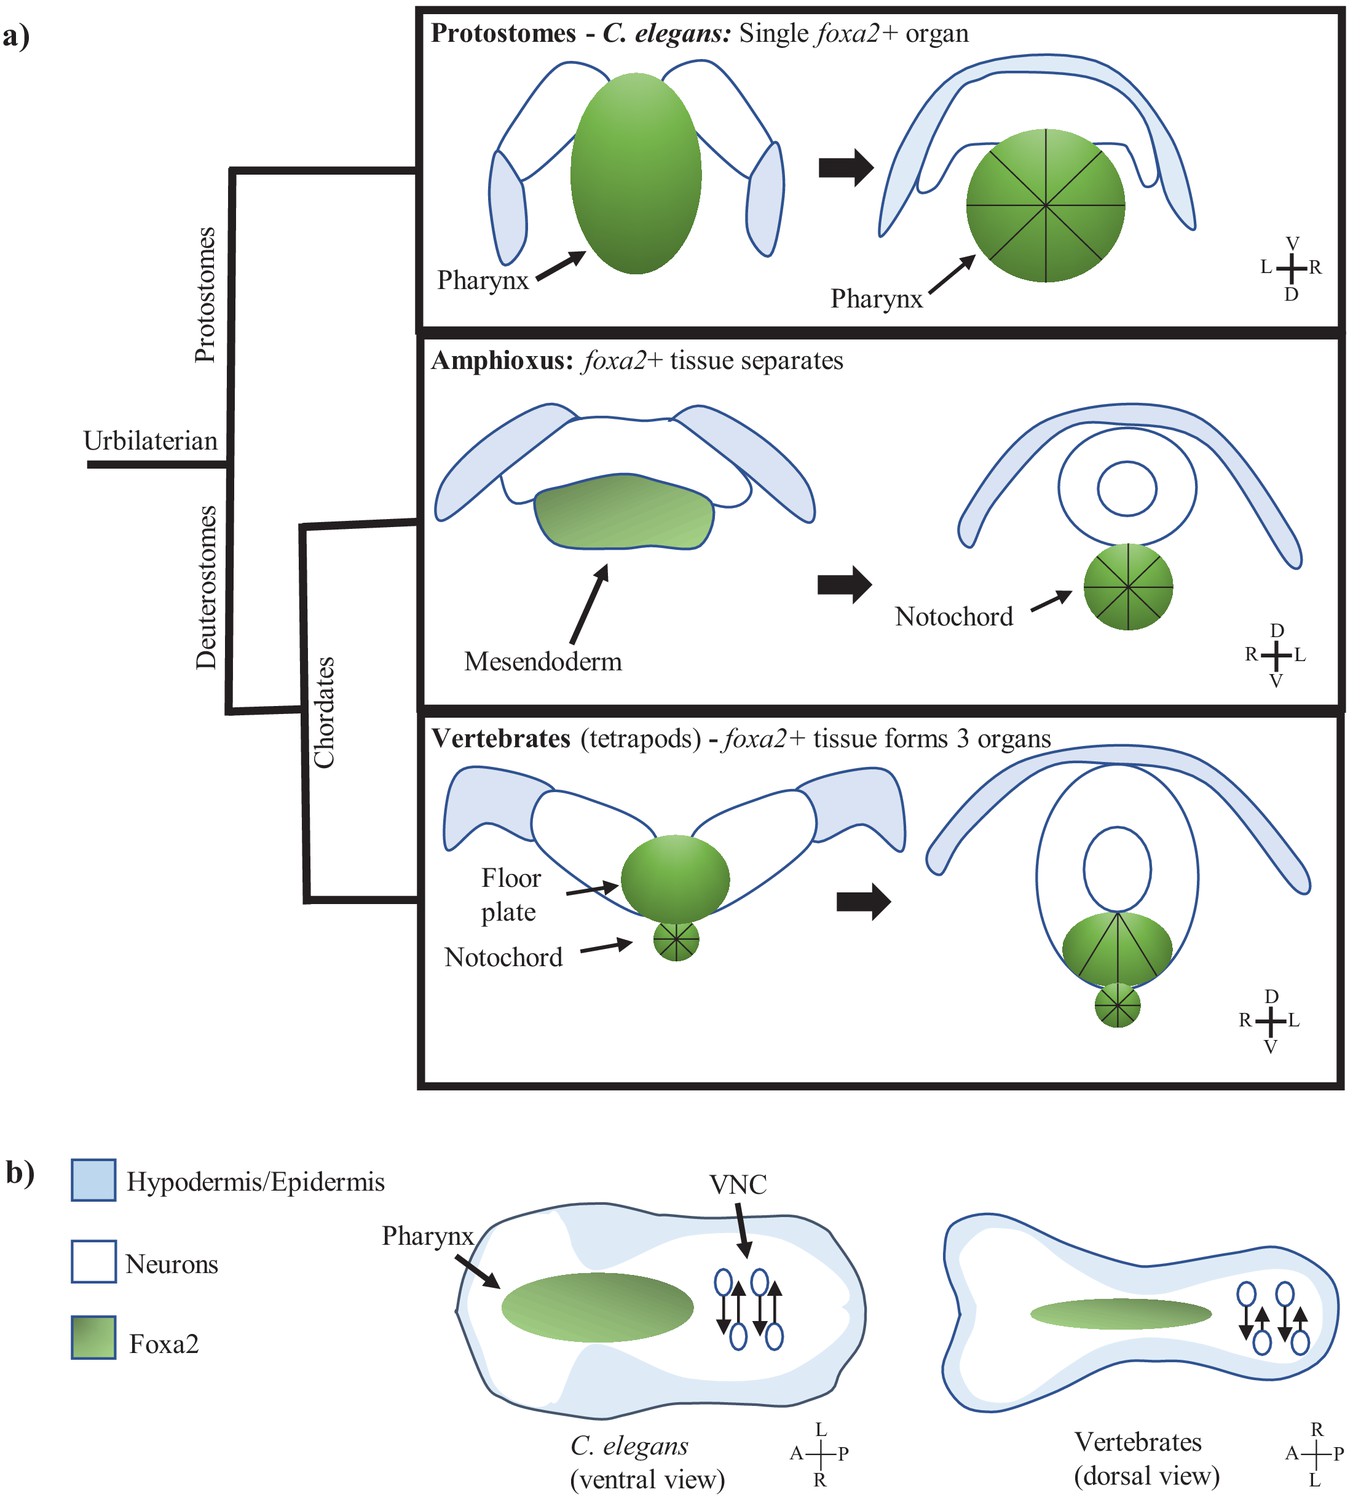
The multi-tissue process of C. elegans involution may be homologous to chordate neurulation.
(a) Model showing foxa2 specified force generator during nervous system involution across three clades. Left images are before involution, right images are after. Black lines indicate apically constricting cells. Protostomes (C. elegans) have involution driven by a single foxa2+ tissue (the pharynx). Amphioxus also has a single foxa2+ layer from which the future notochord forms. Vertebrates have separation of the foxa2+ tissue into the floor plate and notochord before involution. (b) Model of morphology during nervous system involution in C. elegans as well as chordates (an approximation based off of amniote neurulation), labeling involution in the anterior of the embryo (pharynx in green, neuroectoderm as white background) and PCP/CE-driven nerve cord formation in the posterior of the embryo (neurons as white circles). Hypodermis is in blue. Body axis is flipped between C. elegans and vertebrates (in (b) as well).
Tables
Table 1
Persistence of pharynx contact across neurons and selected leader cells.
| Cell | Timepoints contacting initial neighbors | % Time | Cell | Timepoints contacting initial neighbors | % Time | Cell | Timepoints contacting initial neighbors | % Time |
|---|---|---|---|---|---|---|---|---|
| 'AIAL' | 0 | 0.0 | 'IL2DR' | 27 | 41.5 | 'RMGR' | 0 | 0.0 |
| 'AIAR' | 0 | 0.0 | 'IL2L' | 0 | 0.0 | 'SAADL' | 0 | 0.0 |
| 'AIML' | 0 | 0.0 | 'IL2R' | 0 | 0.0 | 'SAADR' | 7 | 10.8 |
| 'AIMR' | 0 | 0.0 | 'IL2VL' | 0 | 0.0 | 'SAAVL' | 43 | 66.2 |
| 'AINL' | 35 | 53.8 | 'IL2VR' | 0 | 0.0 | 'SAAVR' | 18 | 27.7 |
| 'AINR' | 56 | 86.2 | 'OLLL' | 0 | 0.0 | 'SABD' | 0 | 0.0 |
| 'AIYL' | 39 | 60.0 | 'OLLR' | 0 | 0.0 | 'SABVL' | 0 | 0.0 |
| 'AIYR' | 40 | 61.5 | 'OLQDL' | 63 | 96.9 | 'SABVR' | 0 | 0.0 |
| 'ALA' | 0 | 0.0 | 'OLQDR' | 65 | 100.0 | 'SIADL' | 7 | 10.8 |
| 'AVAL' | 0 | 0.0 | 'OLQVL' | 0 | 0.0 | 'SIADR' | 23 | 35.4 |
| 'AVAR' | 0 | 0.0 | 'OLQVR' | 0 | 0.0 | 'SIAVL' | 51 | 78.5 |
| 'AVDL' | 65 | 100.0 | 'RIAL' | 0 | 0.0 | 'SIAVR' | 18 | 27.7 |
| 'AVDR' | 34 | 52.3 | 'RIAR' | 32 | 49.2 | 'SIBVL' | 0 | 0.0 |
| 'AVEL' | 0 | 0.0 | 'RID' | 16 | 24.6 | 'SIBVR' | 2 | 3.1 |
| 'AVER' | 0 | 0.0 | 'RIFL' | 0 | 0.0 | 'SMBDL' | 11 | 16.9 |
| 'AVG' | 51 | 78.5 | 'RIFR' | 0 | 0.0 | 'SMBDR' | 17 | 26.2 |
| 'AVHL' | 65 | 100.0 | 'RIGL' | 0 | 0.0 | 'SMBVL' | 0 | 0.0 |
| 'AVHR' | 54 | 83.1 | 'RIGR' | 0 | 0.0 | 'SMBVR' | 0 | 0.0 |
| 'AVJL' | 0 | 0.0 | 'RIH' | 27 | 41.5 | 'SMDDL' | 65 | 100.0 |
| 'AVJR' | 0 | 0.0 | 'RIPL' | 54 | 83.1 | 'SMDDR' | 53 | 81.5 |
| 'AVKL' | 37 | 56.9 | 'RIPR' | 0 | 0.0 | 'SMDVL' | 52 | 80.0 |
| 'AVKR' | 0 | 0.0 | 'RIR' | 41 | 63.1 | 'SMDVR' | 10 | 15.4 |
| 'AVL' | 33 | 50.8 | 'RIS' | 59 | 90.8 | 'URAVL' | 0 | 0.0 |
| 'BAGL' | 32 | 49.2 | 'RIVL' | 65 | 100.0 | 'URAVR' | 0 | 0.0 |
| 'BAGR' | 42 | 64.6 | 'RIVR' | 0 | 0.0 | 'URADL' | 0 | 0.0 |
| 'CEPDL' | 26 | 40.0 | 'RMDDL' | 22 | 33.8 | 'URADR' | 0 | 0.0 |
| 'CEPDR' | 31 | 47.7 | 'RMDDR' | 16 | 24.6 | 'URBL' | 0 | 0.0 |
| 'CEPVL' | 0 | 0.0 | 'RMDL' | 0 | 0.0 | 'URBR' | 0 | 0.0 |
| 'CEPVR' | 0 | 0.0 | 'RMDR' | 0 | 0.0 | 'URXL' | 26 | 40.0 |
| 'IL1DL' | 19 | 29.2 | 'RMDVL' | 0 | 0.0 | 'URXR' | 31 | 47.7 |
| 'IL1DR' | 19 | 29.2 | 'RMDVR' | 18 | 27.7 | 'URYDL' | 13 | 20.0 |
| 'IL1L' | 0 | 0.0 | 'RMED' | 16 | 24.6 | 'URYDR' | 44 | 67.7 |
| 'IL1R' | 42 | 64.6 | 'RMEL' | 41 | 63.1 | 'URYVL' | 0 | 0.0 |
| 'IL1VL' | 0 | 0.0 | 'RMER' | 54 | 83.1 | 'URYVR' | 0 | 0.0 |
| 'IL1VR' | 0 | 0.0 | 'RMEV' | 65 | 100.0 | |||
| 'IL2DL' | 36 | 55.4 | 'RMGL' | 0 | 0.0 |
Key resources table
| Reagent type (species) or resource | Designation | Source or reference | Identifiers | Additional information |
|---|---|---|---|---|
| Genetic reagent (E. coli) | OP50 | Caenorhabditis Genetics Center | OP50 | RRID:WB-STRAIN:WB Strain 00041971 |
| Genetic reagent (C. elegans) | xnIs96 ([hmr-1p::hmr-1::GFP::unc-54 3'UTR + unc-119(+)]) | Caenorhabditis Genetics Center | FT250 | RRID:WB-STRAIN:WB Strain 00007535 |
| Genetic reagent (C. elegans) | zyIs36 [cnd1-p::PH::RFP]X | Dr. Antonio Colavita | OU412 | |
| Genetic reagent (C. elegans) | olaex2540 [unc-33p:PH:GFP] | Dr. Daniel Colon-Ramos | DCR4318 | |
| Genetic reagent (C. elegans) | ujIs113[pie-1::mCherry::H2B + unc-119(+); Pnhr-2::mCherry::histone + unc-119(+)] II | Caenorhabditis Genetics Center | JIM113 | RRID:WB-STRAIN:WB Strain 00022462 |
| Genetic reagent (C. elegans) | hmr-1(zu248) | Caenorhabditis Genetics Center | JJ1142 | RRID:WB-STRAIN:WB Strain 00022484 |
| Genetic reagent (C. elegans) | zuEx2 (W02B9(cosmid) + rol-6(su1006)) | Caenorhabditis Genetics Center | JJ1142 | RRID:WB-STRAIN:WB Strain 00022484 |
| Software, algorithm | Fiji | https://fiji.sc/ | ||
| Software, algorithm | MATLAB | https://www.mathworks.com | ||
| Software, algorithm | Metamorph | https://www.moleculardevices.com | ||
| Software, algorithm | Starry Nite | https://wormguides.org/starry-nite/ | ||
| Software, algorithm | AceTree | https://github.com/zhirongbaolab/AceTree | ||
| Software, algorithm | WormGUIDES atlas | https://wormguides.org/wormguides-atlas/ |
Additional files
-
Supplementary file 1
List of neurons used in figure panels identities of neurons used in WormGUIDES renderings and visualizations derived from WormGUIDES data, with corresponding figures listed.
- https://cdn.elifesciences.org/articles/58626/elife-58626-supp1-v1.docx
-
Transparent reporting form
- https://cdn.elifesciences.org/articles/58626/elife-58626-transrepform-v1.docx
Download links
A two-part list of links to download the article, or parts of the article, in various formats.
Downloads (link to download the article as PDF)
Open citations (links to open the citations from this article in various online reference manager services)
Cite this article (links to download the citations from this article in formats compatible with various reference manager tools)
Cadherin preserves cohesion across involuting tissues during C. elegans neurulation
eLife 9:e58626.
https://doi.org/10.7554/eLife.58626


