Concentration-dependent mortality of chloroquine in overdose
- Mahidol Oxford Tropical Medicine Research Unit, Faculty of Tropical Medicine, Mahidol University, Thailand
- Centre for Tropical Medicine and Global Health, Nuffield Department of Medicine, University of Oxford, United Kingdom
- Assistance Publique - Hôpitaux de Paris, France
- Université de Paris, France
- Université de Paris, INSERM UMRS-11 44, France
- Reanimation Medicale et Toxicologique, Hopital Lariboisiere, France
- Clinique du Sport, France
Figures
Figure 1
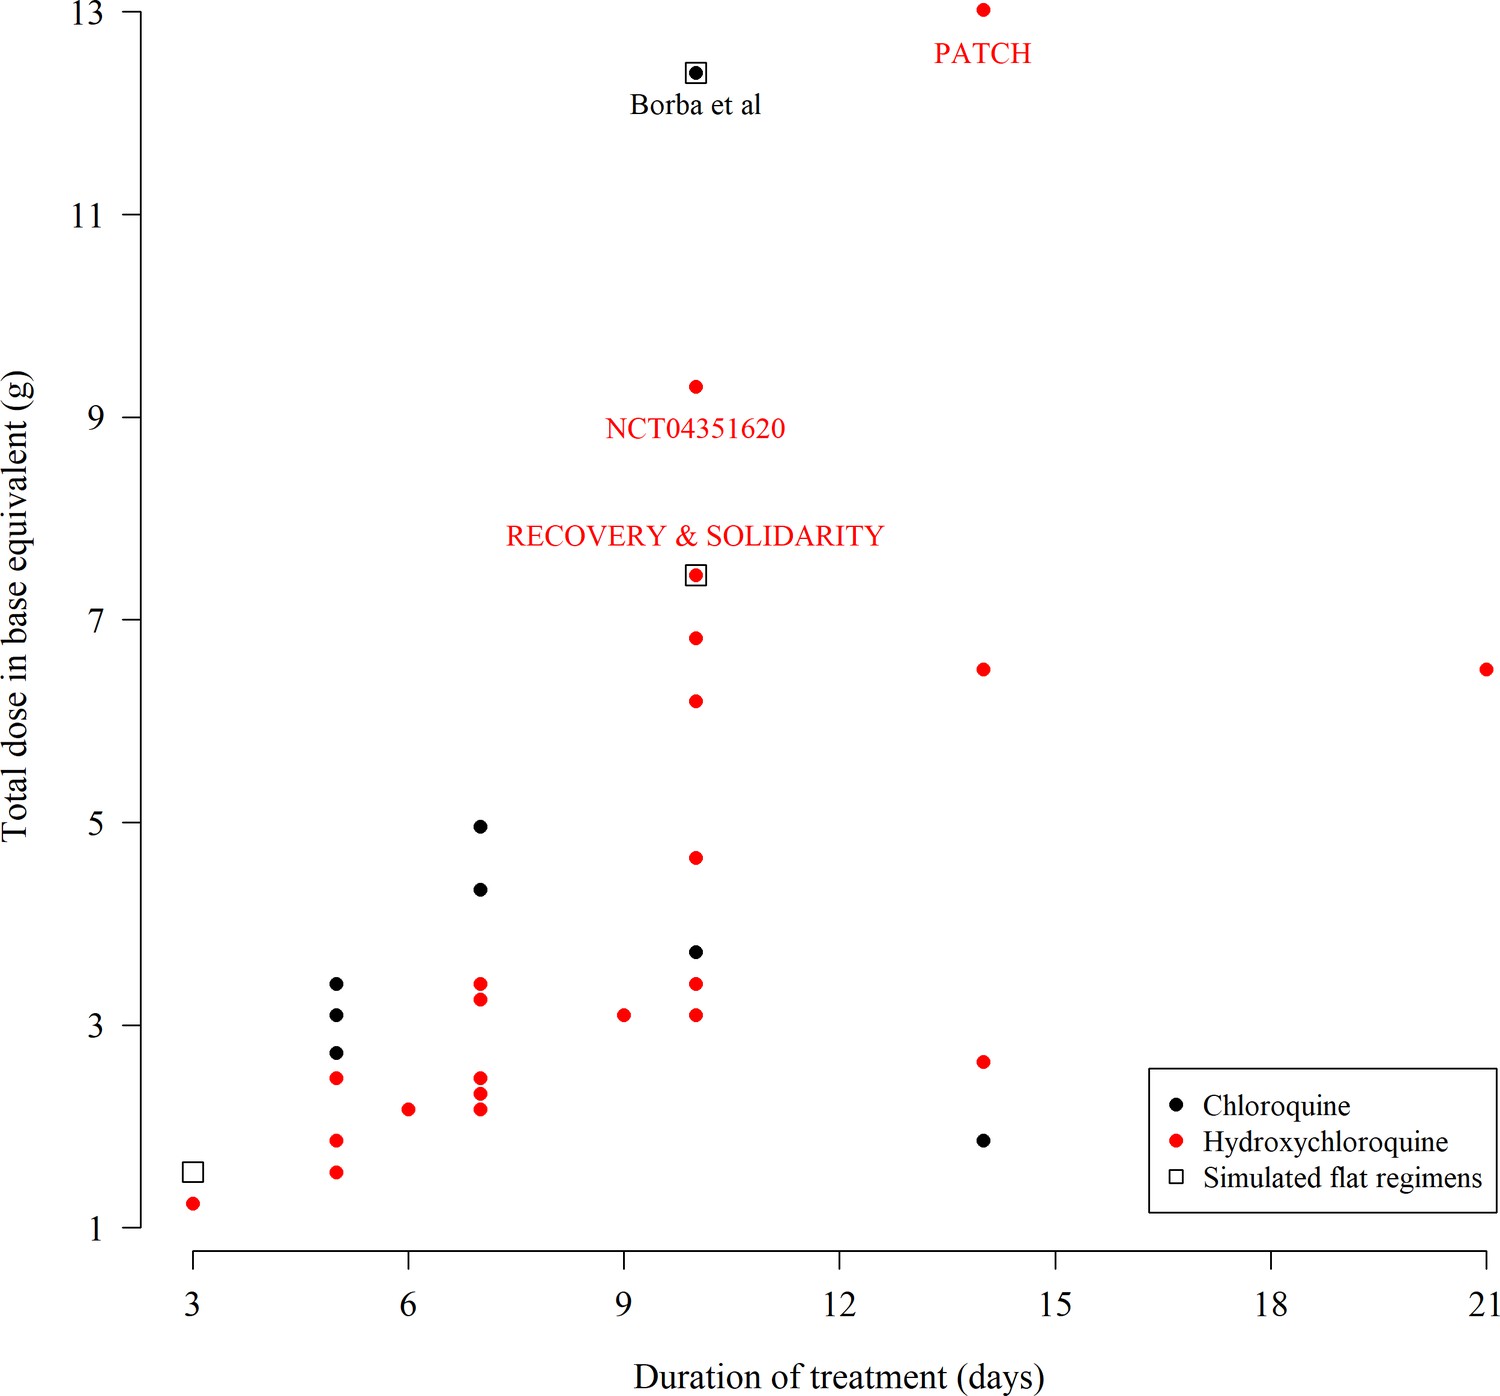
The total chloroquine or hydroxychloroquine dose (in grams) and duration of 55 COVID-19 treatment trials currently recruiting participants, extracted from ClinicalTrials.gov on the 11th June 2020.
The black open square boxes show the four ‘flat’ dosing chloroquine regimens simulated in this paper. Note that many trials give the same dose regimen so there are fewer than 55 unique points on the graph. Some multi-country trials such as SOLIDARITY use both hydroxychloroquine or chloroquine depending on the countries included. As the majority of countries worldwide use hydroxychloroquine we have colored these trials in red. The extracted data can be found in the supplementary materials.
-
Figure 1—source data 1
Extracted meta-data from 55 trials registered on Clinicaltrials.gov using chloroquine or hydroxychloroquine for the treatment of COVID-19.
- https://cdn.elifesciences.org/articles/58631/elife-58631-fig1-data1-v2.xlsx
Figure 2
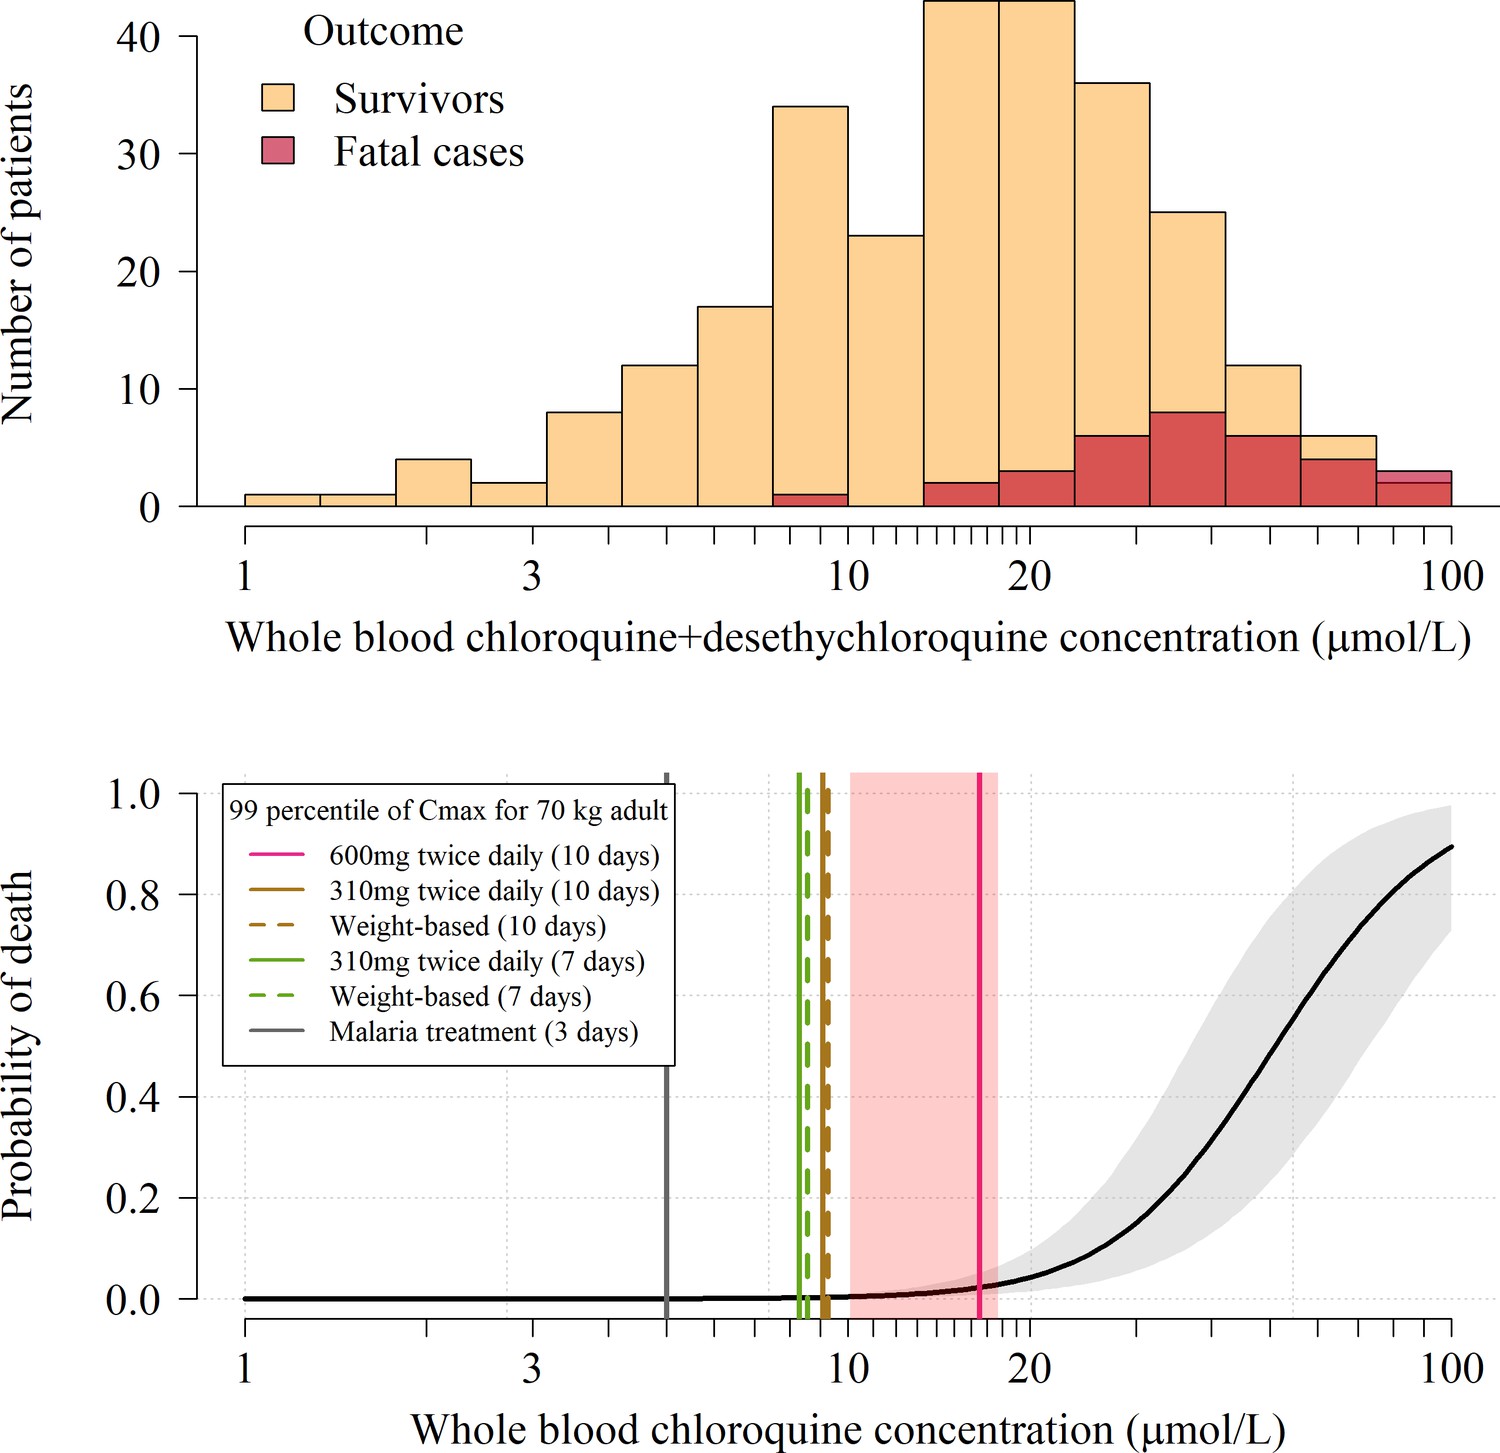
Pharmacokinetic-pharmacodynamic model of chloroquine induced mortality.
Top: pooled whole blood chloroquine + desethylchloroquine concentrations from admission samples in 302 prospectively studied self-poisoning patients (Riou et al., 1988; Clemessy et al., 1995; Clemessy et al., 1996; Mégarbane et al., 2010). The data are shown as overlapping histograms for survivors (yellow, ) and fatal cases (red, ). Bottom: Bayesian posterior distribution over the concentration-response curve (mean and 95% credible interval) describing the relationship between inferred whole blood chloroquine peak concentrations (after adjustment for the desethyl metabolite) and death, with the chloroquine concentration shown on the log10 scale. The vertical lines show the upper 99 percentiles of the predicted Cmax distribution in a 70 kg adult under the whole blood pharmacokinetic model for the six adult dose regimens considered (pink: 10 day regimen with 12 hourly maintenance dose of 600 mg (base); brown: 10 day regimen with 12 hourly maintenance dose of 310 mg (base); green: 7 day regimen with 12 hourly maintenance dose of 310 mg (base) ; grey: malaria treatment regimen). The vertical light pink shaded area shows the posterior credible interval over the concentrations associated with 1% mortality. The equivalent output with the plasma pharmacokinetic model is shown in Appendix 4.
Figure 3
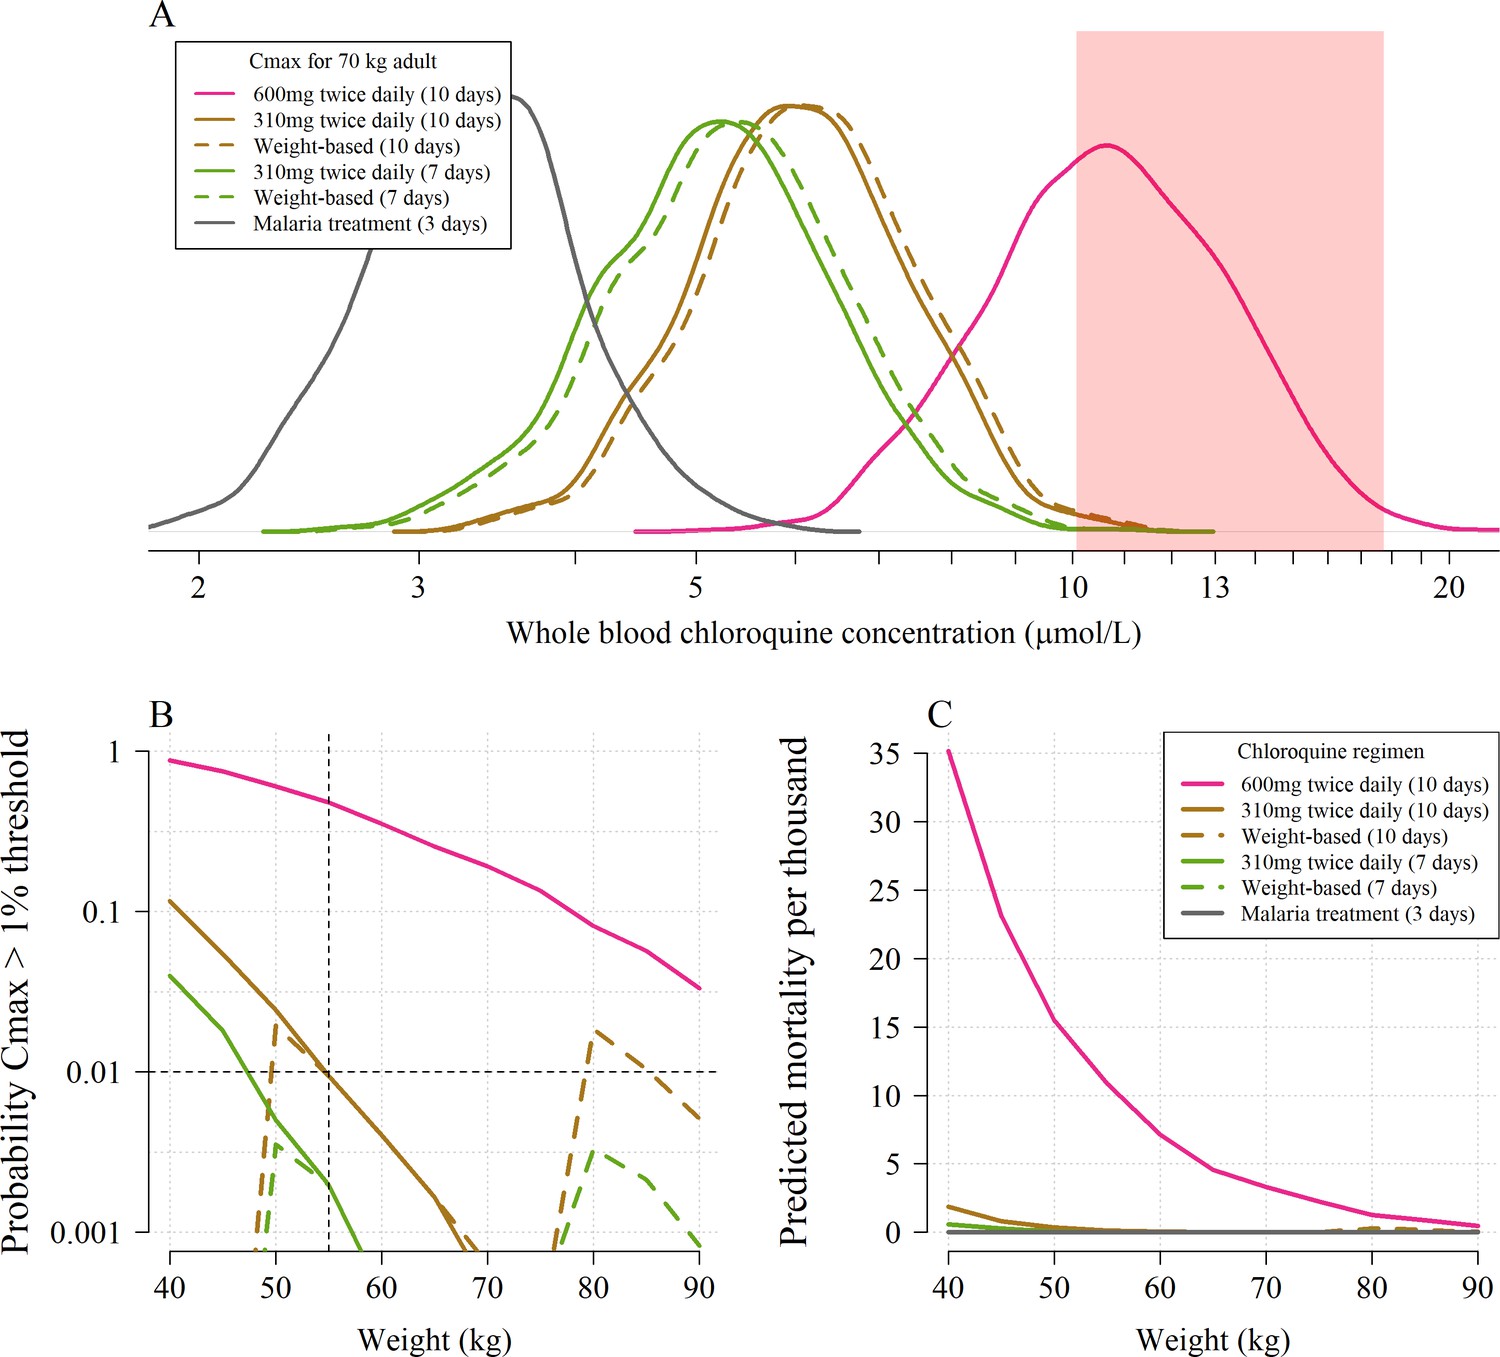
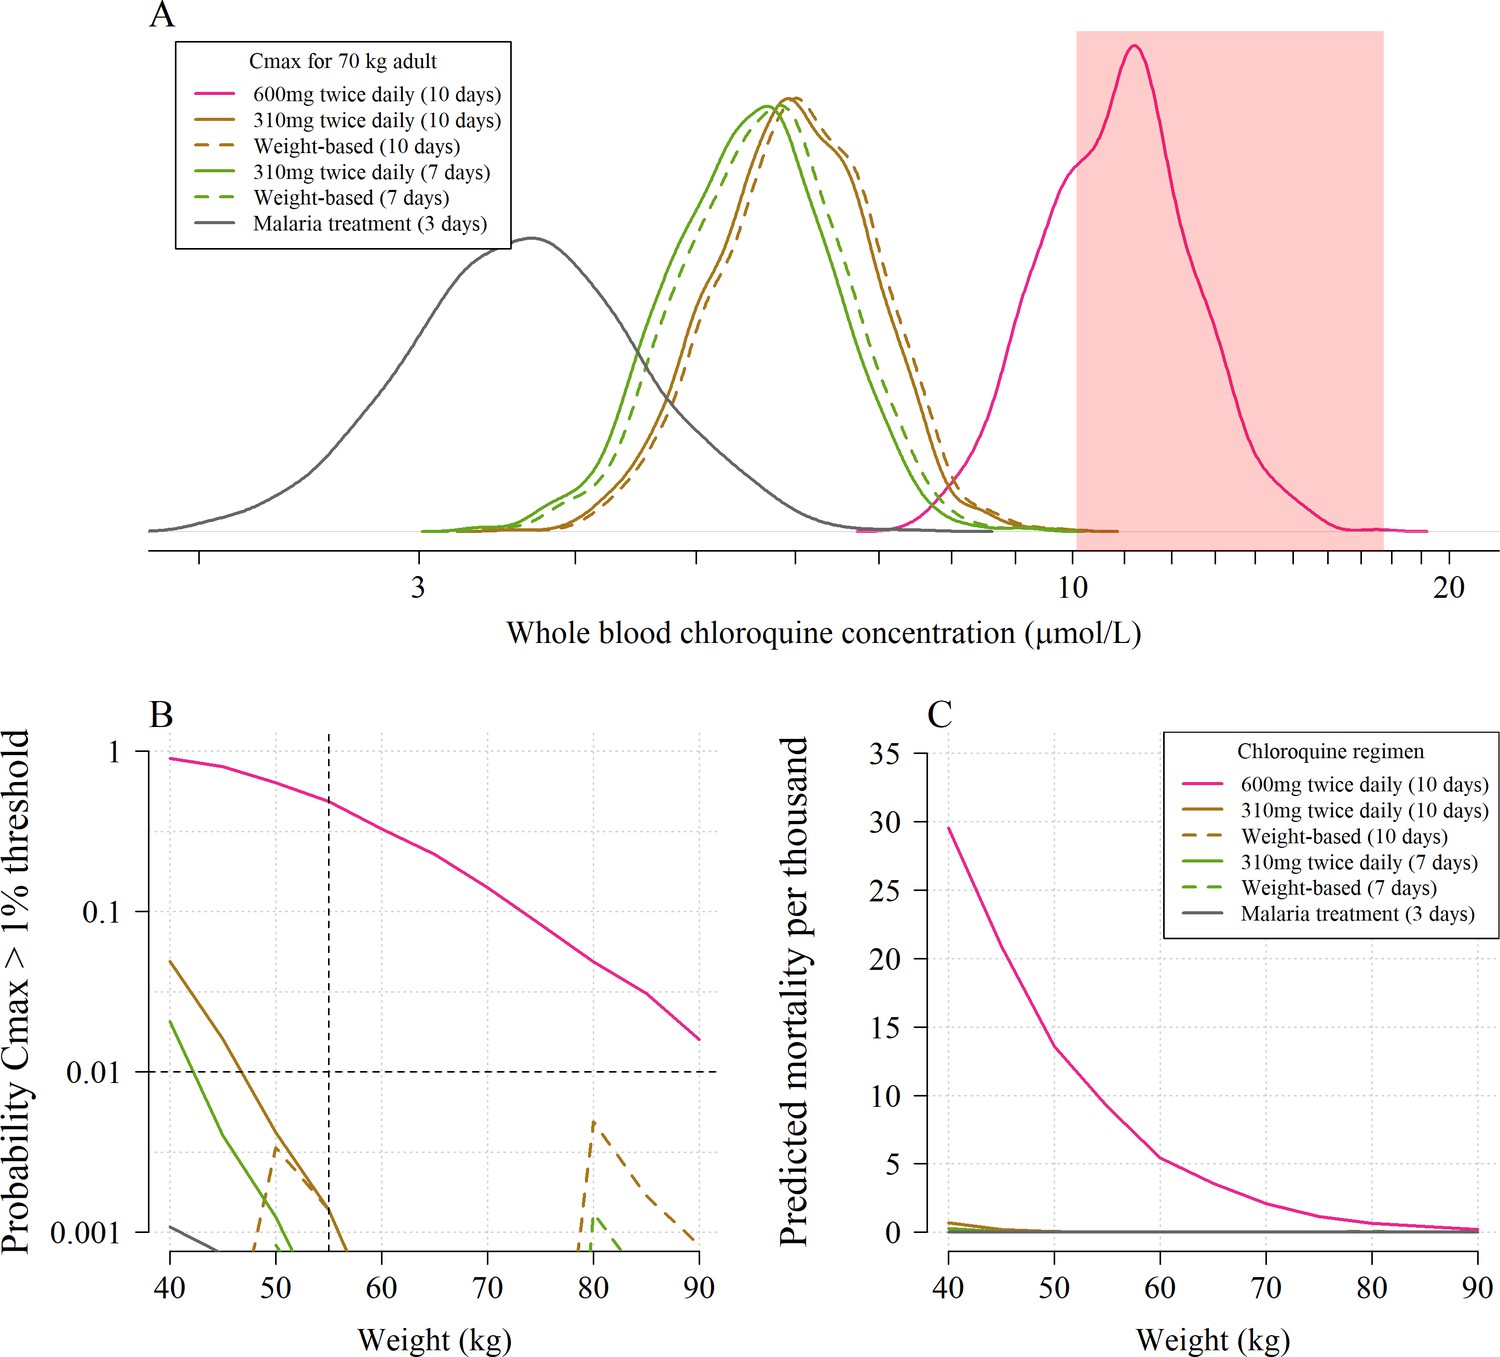
The predicted risk of potentially fatal chloroquine toxicity across the six regimens simulated under the whole blood pharmacokinetic model.
Panel A shows the simulated distribution of Cmax values in a 70 kg adult for the five COVID-19 treatment regimens under evaluation and the standard malaria treatment regimen. The vertical light pink shaded area shows the 95% credible interval for the 1% mortality threshold concentration. Panel B shows the probability that an individual will cross the 1% mortality threshold value as a function of body weight for the different chloroquine regimens (log10 scale on the y-axis). Panel C shows the predicted mortality per thousand for the six chloroquine regimens as a function of body weight. The equivalent output using the plasma pharmacokinetic model is given in Appendix 4.
Figure 4
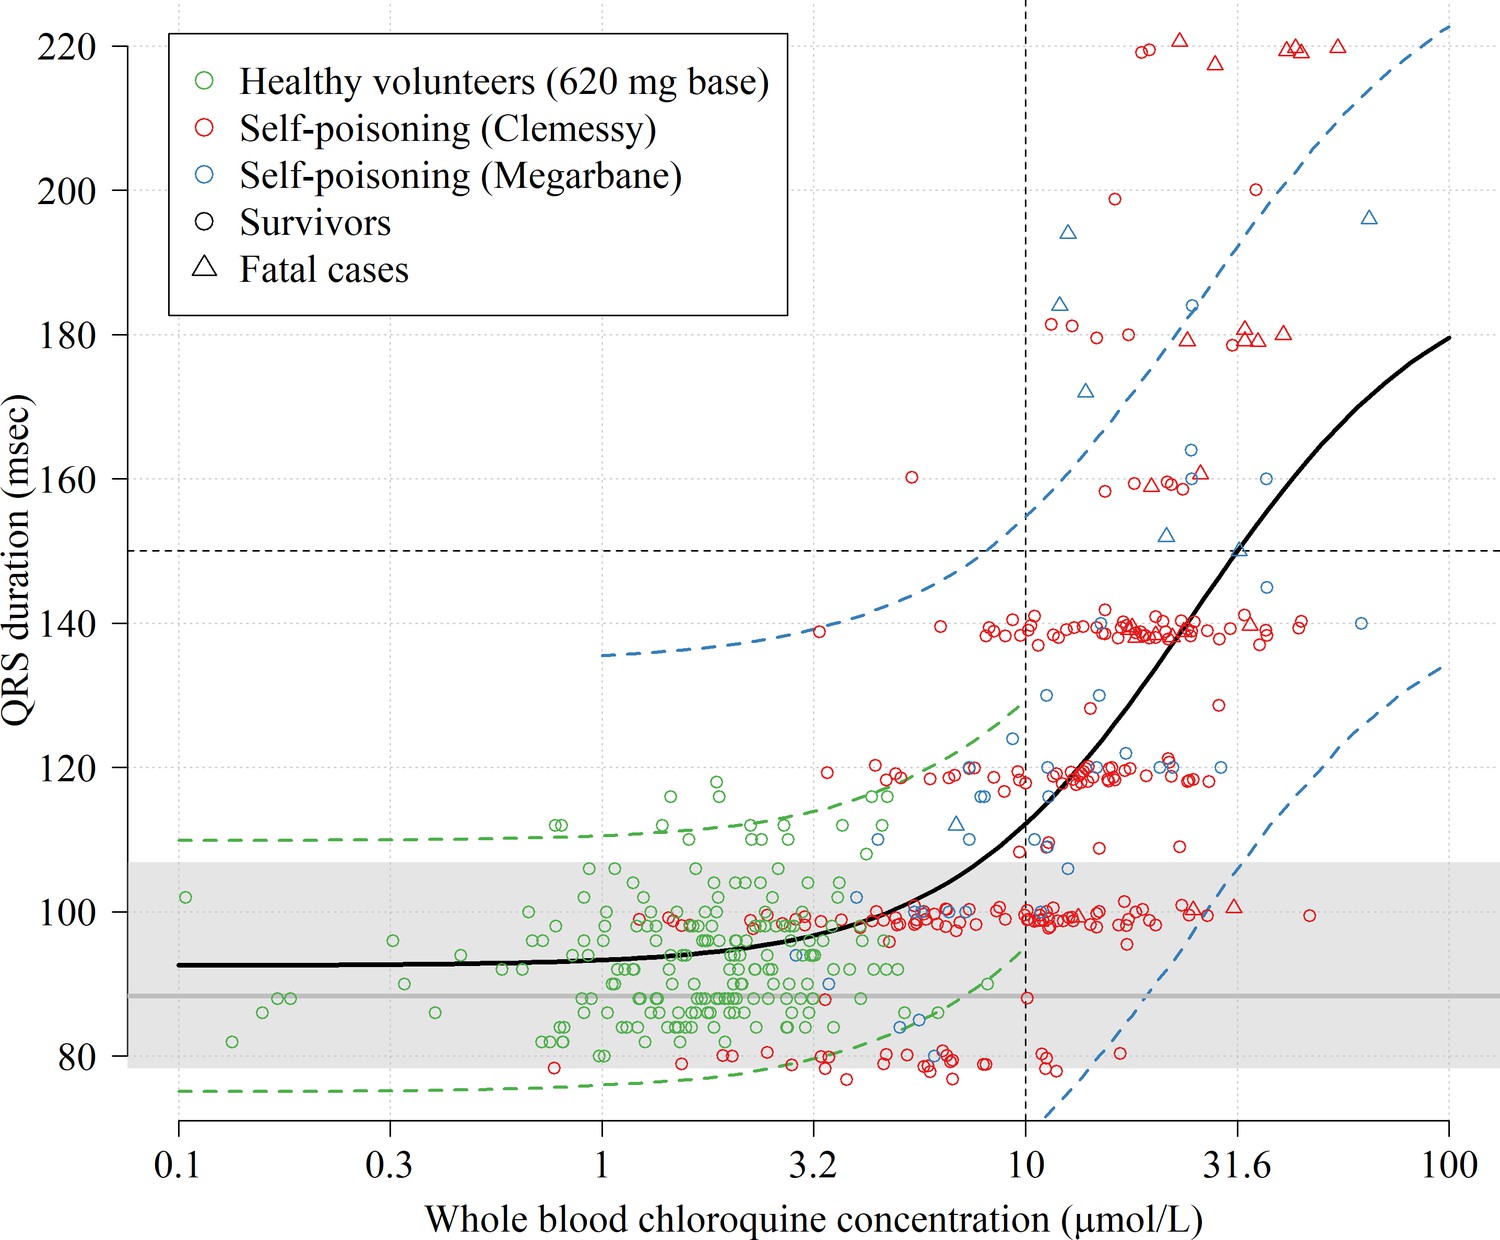
Electrocardiograph QRS interval duration as a function of whole blood chloroquine concentrations.
The data shown in the scatter plot are from 16 healthy volunteers who took a single 620 mg base oral dose (green circles, 192 paired concentration-QRS data-points, plasma concentrations were multiplied by 4) and 290 chloroquine self-poisoning patients (red and blue, hospital admission concentrations). Random normal jitter (standard deviation of 1 ms) was added to the Clemessy cohort self-poisoning QRS values for improved visualization. Survivors are shown as circles and fatal cases as triangles. The self-poisoning electrocardiograph QRS values from the Clemessy series (Clemessy et al., 1995; Clemessy et al., 1996) were read manually and are adjusted for a bias term (see Materials and methods, non-adjusted data are shown in Appendix 5). The grey line (grey area) shows the estimated median QRS duration (range) in the 16 healthy volunteers in absence of measurable drug. The thick black line shows the mean posterior Emax sigmoid regression model, fitted to the pooled data. The dashed green and blue lines show the posterior predictive distribution under the error distributions for the healthy volunteers and Megarbane self-poisoning cohort (smaller measurement error than in the Clemessy cohort), respectively (see Materials and methods for the full specification of the model). Note that the Emax regression model does not account for concentration-dependent heteroskedasticity but only inter-individual variation for healthy volunteers and inter-study variation (differences in measurement).
Appendix 1—figure 1
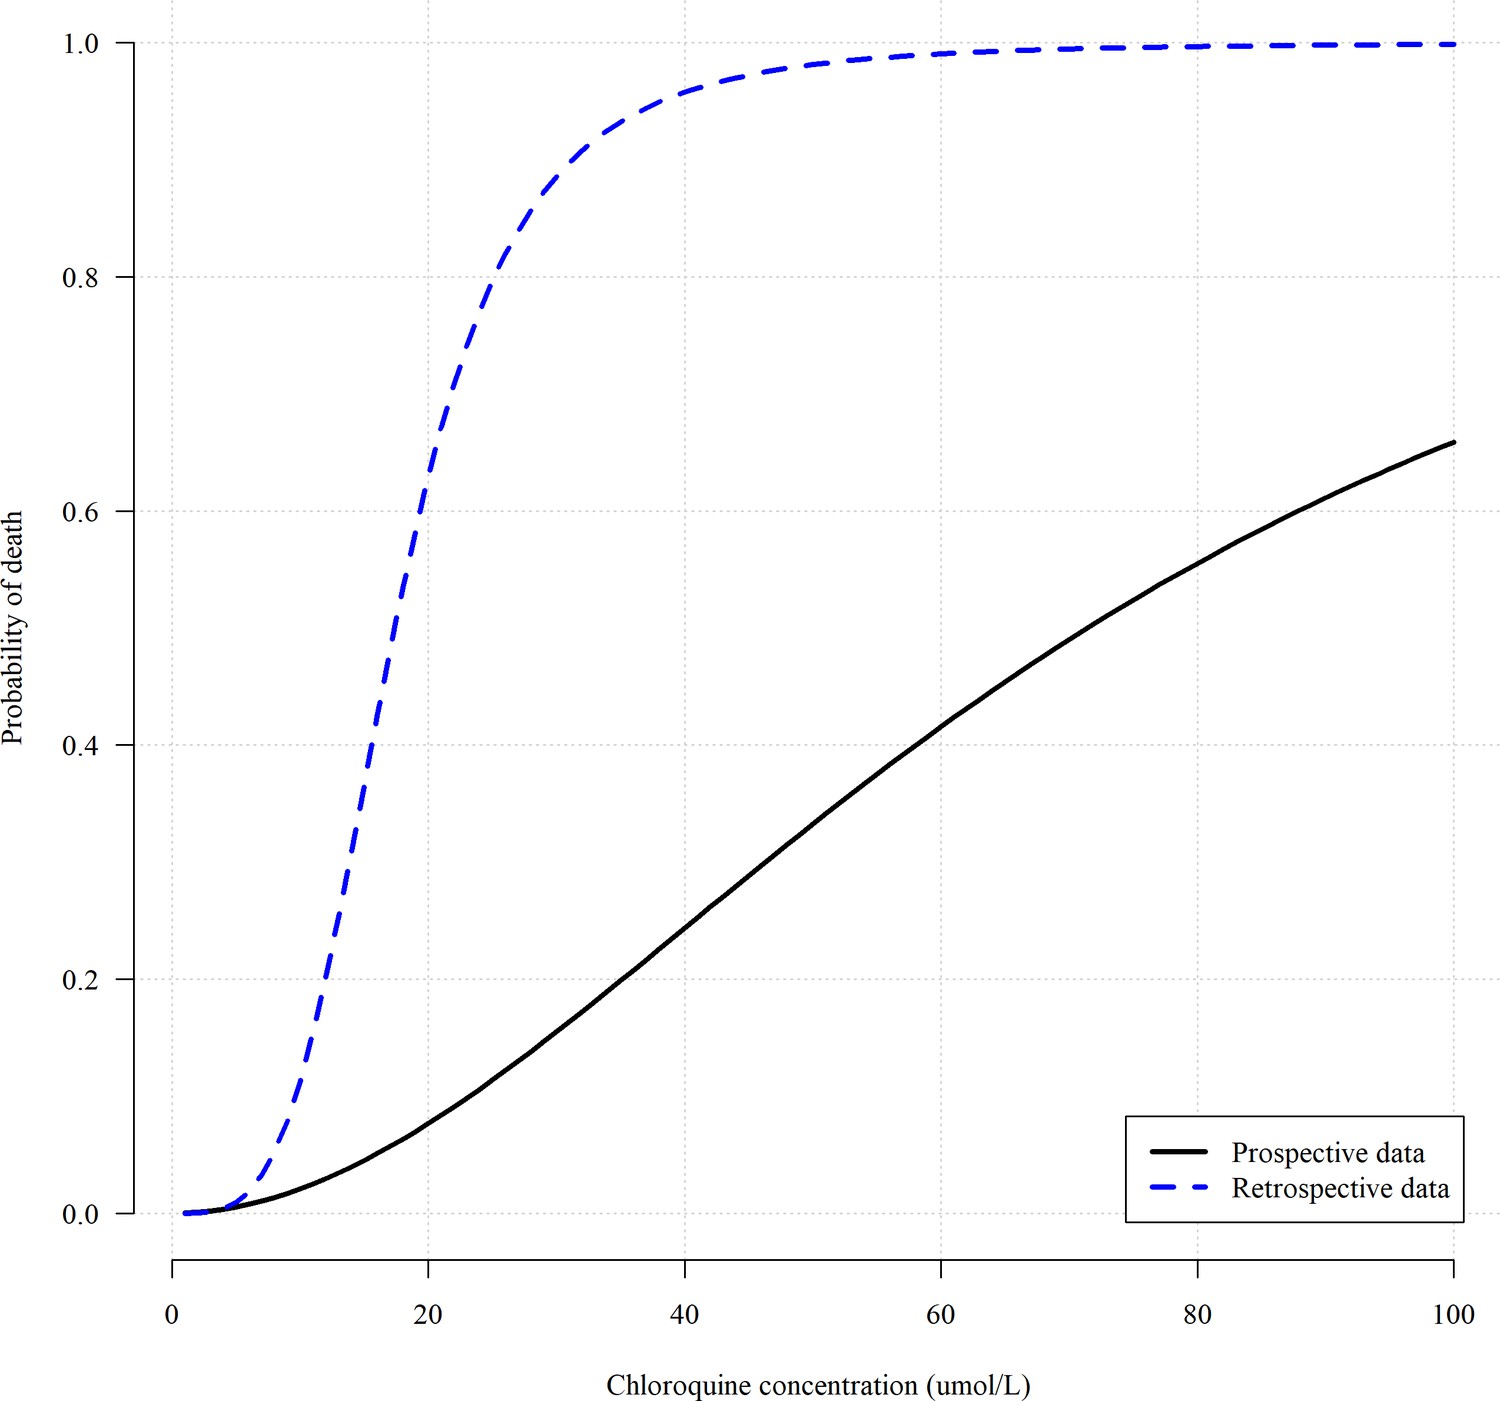
Comparing the concentration fatality-curves obtained when using the retrospectively gathered data (blue dashed line, , Riou et al., 1988) versus the prospectively gathered data (black solid line, , Riou et al., 1988; Clemessy et al., 1995; Clemessy et al., 1996; Mégarbane et al., 2010).
The parameters of the two logistic regression fits correspond to maximum likelihood estimates.
Appendix 2—figure 1
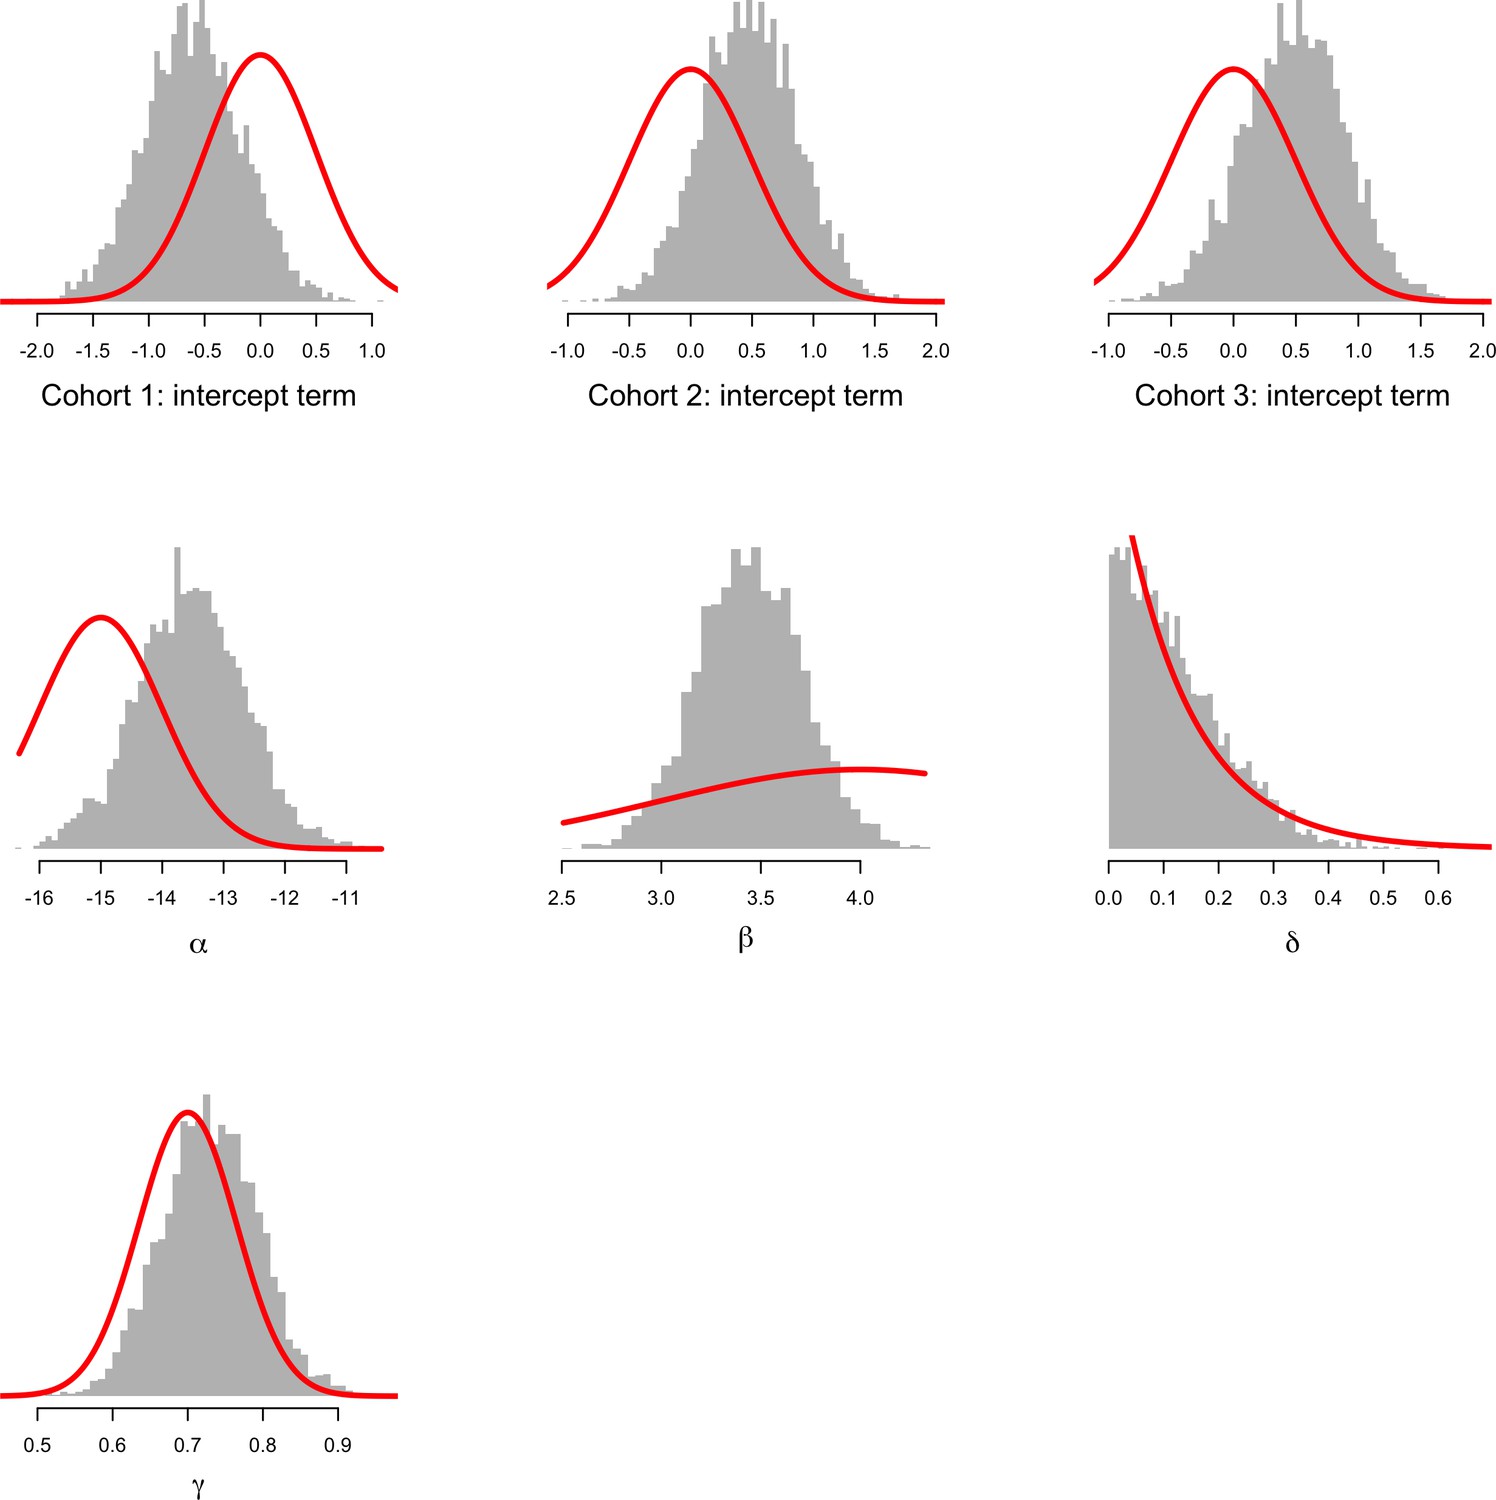
Comparison between prior distributions (thick red lines) and posterior distributions (shown as histograms) for the parameters of the concentration-fatality model.
The top three histograms show the estimated intercept terms for the three cohorts (cohort 1: Riou et al., 1988; cohort 2: Clemessy et al., 1995, Clemessy et al., 1996; cohort 3: Mégarbane et al., 2010). α is overall intercept term; β: log-concentration coefficient; δ: bias term for patients whose peak concentration was not observed; γ: fraction of concentration that is due to chloroquine and not the metabolite. This shows that the data are informative with respect to the β coefficient on the log concentration. This is the desired behaviour given we know that chloroquine at low doses is very safe. See the meta-analysis of the related bisquinoline compound piperaquine showing that under normal dosing, the mortality is unlikely to be greater than the background mortality rate (Chan et al., 2018).
Appendix 2—figure 2
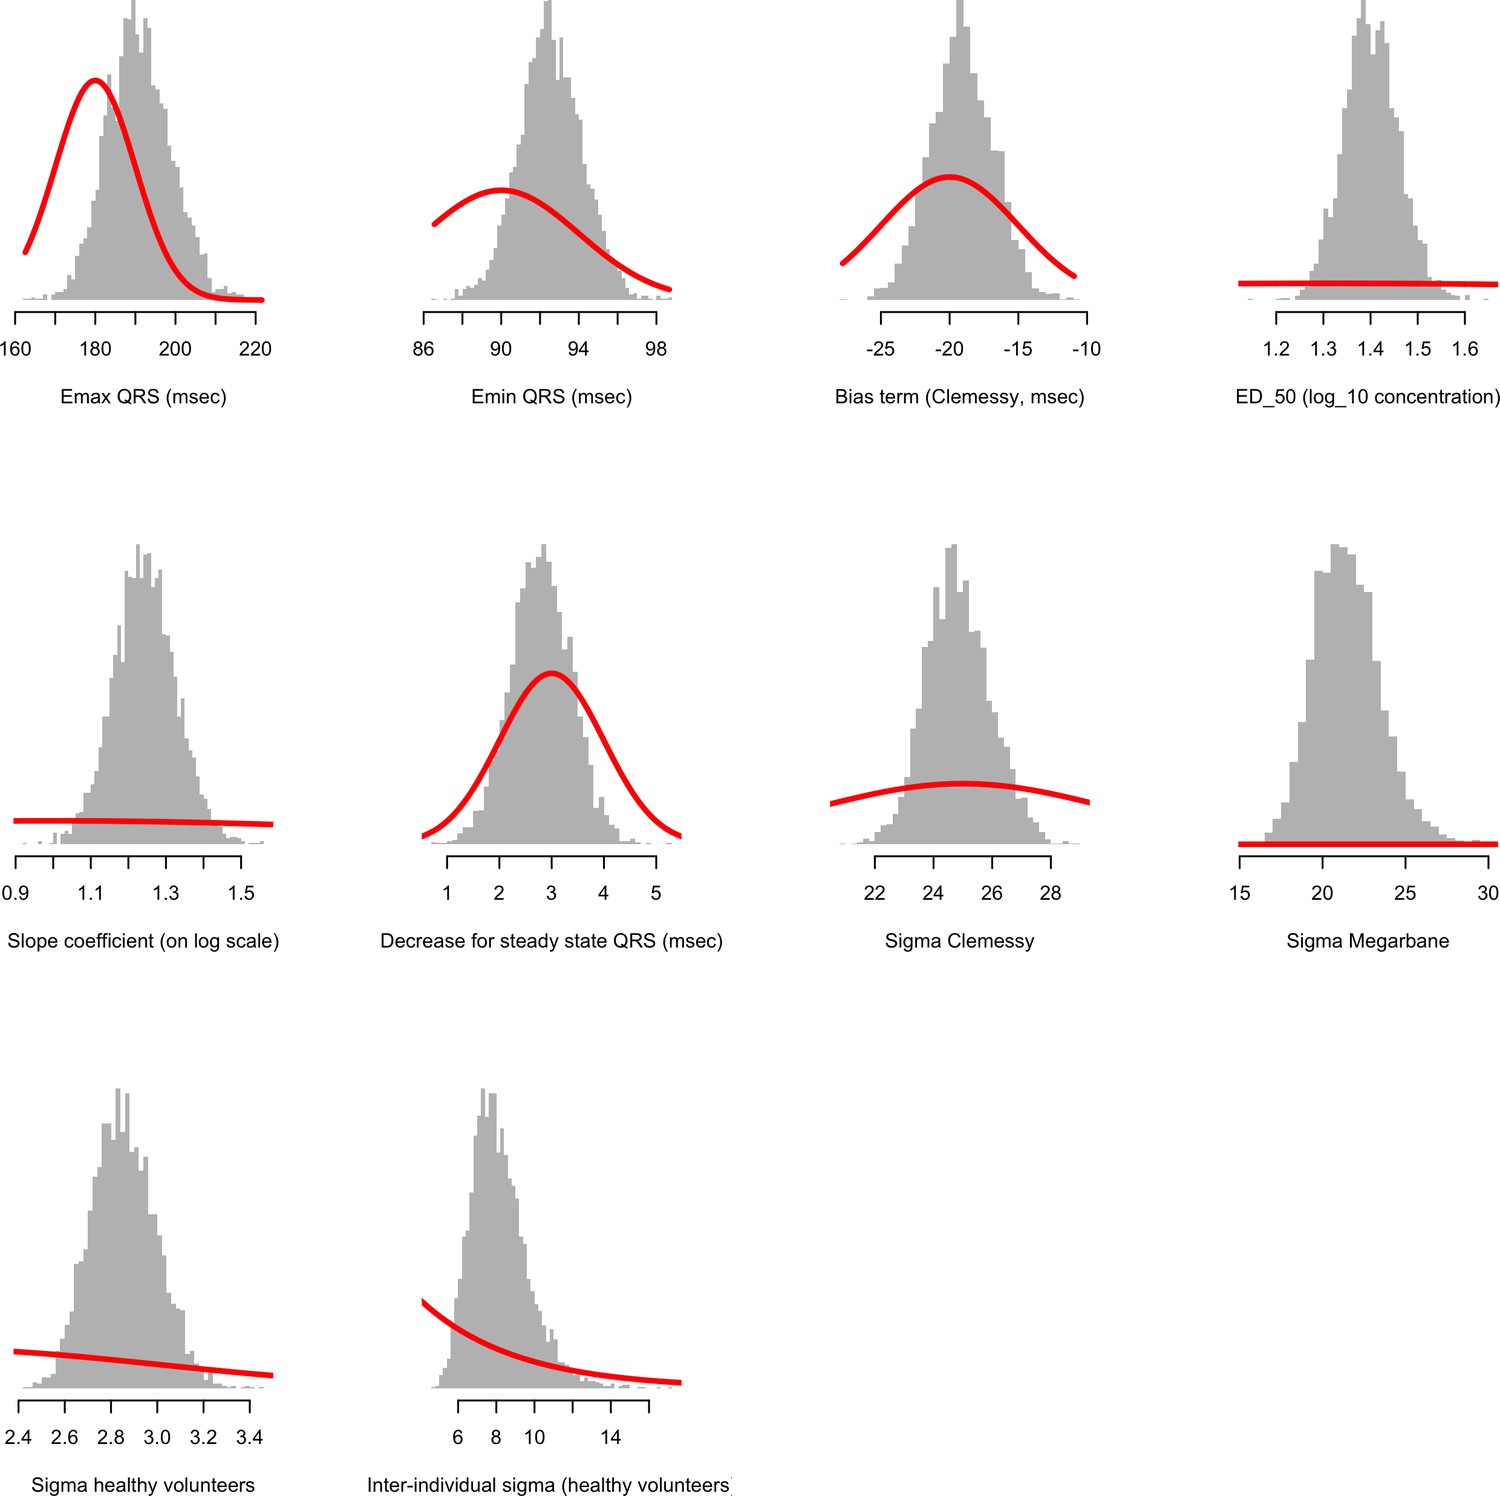
Comparison between prior distributions (thick red lines) and posterior distributions (shown as histograms) for the population parameters of the concentration-QRS duration Emax sigmoid regression model.
Appendix 3—figure 1

Predicted Cmax distributions for a 70 kg adult for the plasma pharmacokinetic model (black) and the whole blood pharmacokinetic model (red) under the six different regimens.
The predicted plasma concentrations were scaled by four to produce approximate whole blood concentrations. The areas under all the curves are equal to 1, with the all y-axes given the same height in order to highlight differences in width of predicted distributions.
Appendix 4—figure 1

Pharmacokinetic-pharmacodynamic model of chloroquine induced mortality under the plasma pharmacokinetic model of chloroquine.
Top: pooled whole blood chloroquine + desethylchloroquine concentrations from admission samples in prospectively studied self-poisoning patients (Riou et al., 1988; Clemessy et al., 1995; Clemessy et al., 1996; Mégarbane et al., 2010). The data are shown as overlapping histograms for survivors (blue, ) and fatal cases (red, ). Bottom: Bayesian posterior distribution over the concentration-response curve (mean and 95% credible interval) describing the relationship between admission whole blood chloroquine concentrations (after adjustment for the deseythl metabolite) and death, with the chloroquine concentration shown on the log10 scale. The vertical lines show the upper 99 percentiles of the predicted Cmax distribution in a 70 kg adult under the plasma pharmacokinetic model for the six regimens considered (yellow: 10 day regimen with maintenance dose of 310 mg; pink: 10 day regimen with maintenance dose of 600 mg; brown: 7 day regimen with maintenance dose of 310 mg; grey: malaria regimen). The vertical light pink shaded area shows the posterior credible interval over the concentrations associated with 1% mortality. This is the equivalent output of the whole blood model shown in Figure 2, main text.
Appendix 4—figure 2
The predicted risk of fatal toxicity across the six chloroquine regimens simulated under the plasma pharmacokinetic model.
Panel A shows the simulated distribution of Cmax values in a 70 kg adult for the six regimens considered. The vertical red shaded area shows the 95% credible interval for the 1% mortality threshold concentration. Panel B shows the probability that an individual will cross the 1% mortality threshold value as a function of body weight for the different regimens (log10 scale on the y-axis). Panel C shows the predicted mortality per thousand for the six regimens as a function of body weight.
Appendix 5—figure 1
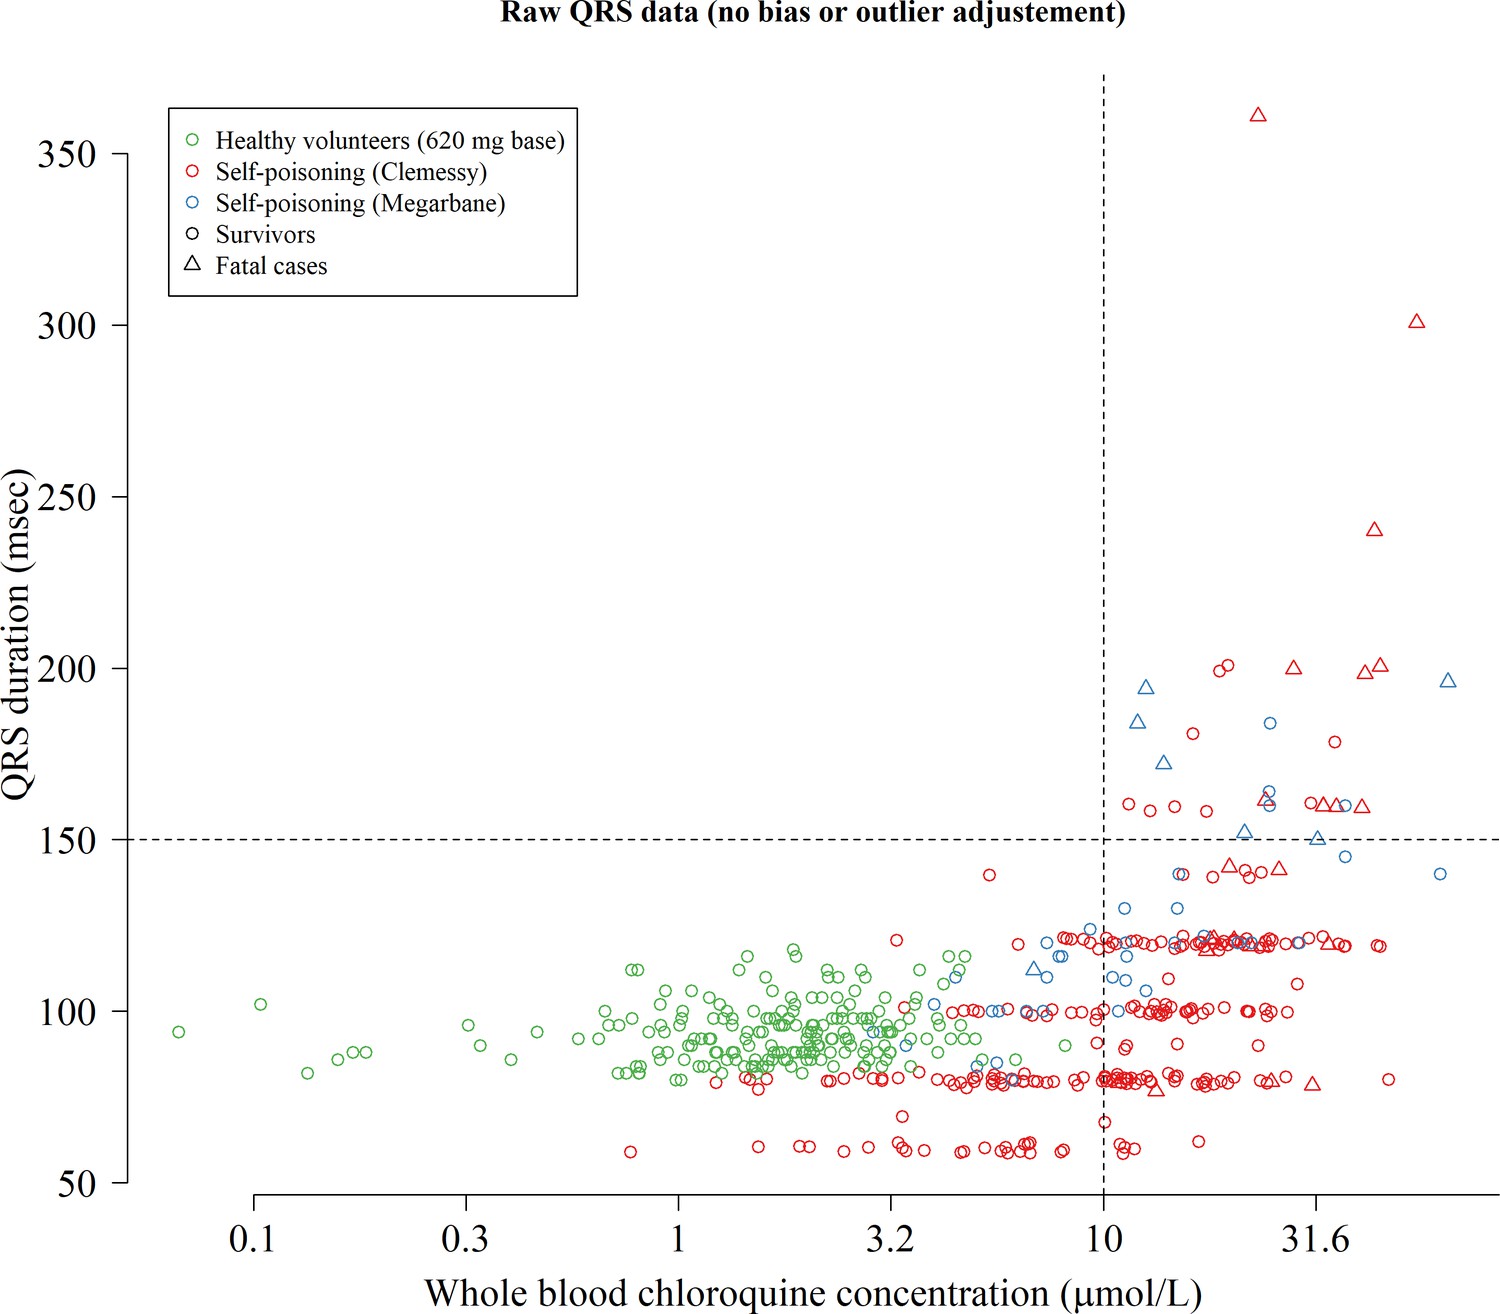
Raw concentration-QRS interval scatter plot without any bias adjustment or truncation of the QRS data.
To model the relationship between concentrations and QRS intervals we truncated the QRS values at 200 msec (durations longer than 200 msec are physiologically very unlikely) and estimated a bias term for the data from the Clemessy series (Clemessy et al., 1995; Clemessy et al., 1996).
Appendix 6—figure 1
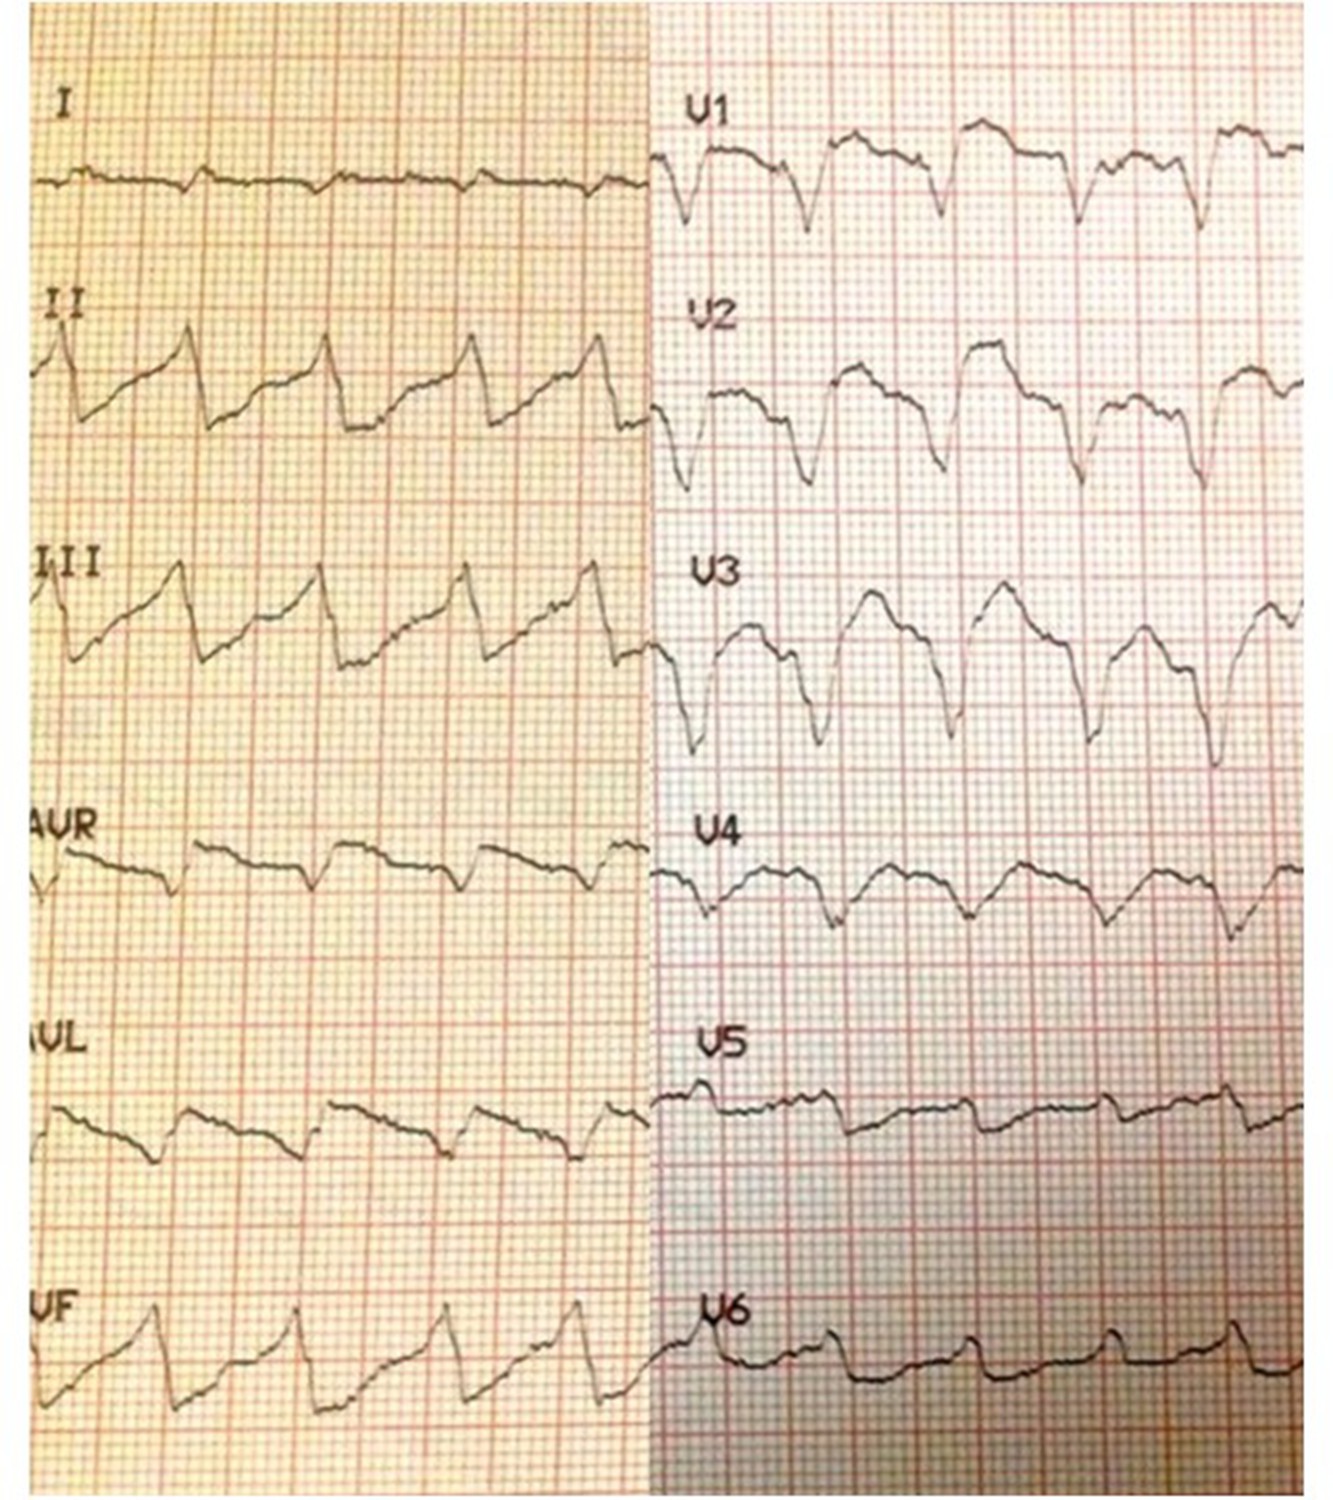
Electrocardiograph showing marked intraventricular conduction delay (QRS widening) with moderate JT prolongation in a 28-year-old female who had taken 5 g of chloroquine.
Her admission whole blood chloroquine + desethychloroquine concentration was 35.4 µmol/L but fortunately she survived.
Additional files
Download links
A two-part list of links to download the article, or parts of the article, in various formats.
Downloads (link to download the article as PDF)
Open citations (links to open the citations from this article in various online reference manager services)
Cite this article (links to download the citations from this article in formats compatible with various reference manager tools)
Concentration-dependent mortality of chloroquine in overdose
eLife 9:e58631.
https://doi.org/10.7554/eLife.58631


