Global alignment and assessment of TRP channel transmembrane domain structures to explore functional mechanisms
- Molecular Physiology and Biophysics Section, Porter Neuroscience Research Center, National Institute of Neurological Diseases and Stroke, National Institutes of Health, United States
- Computational Structural Biology Section, Porter Neuroscience Research Center, National Institute of Neurological Diseases and Stroke, National Institutes of Health, United States
Figures
Figure 1
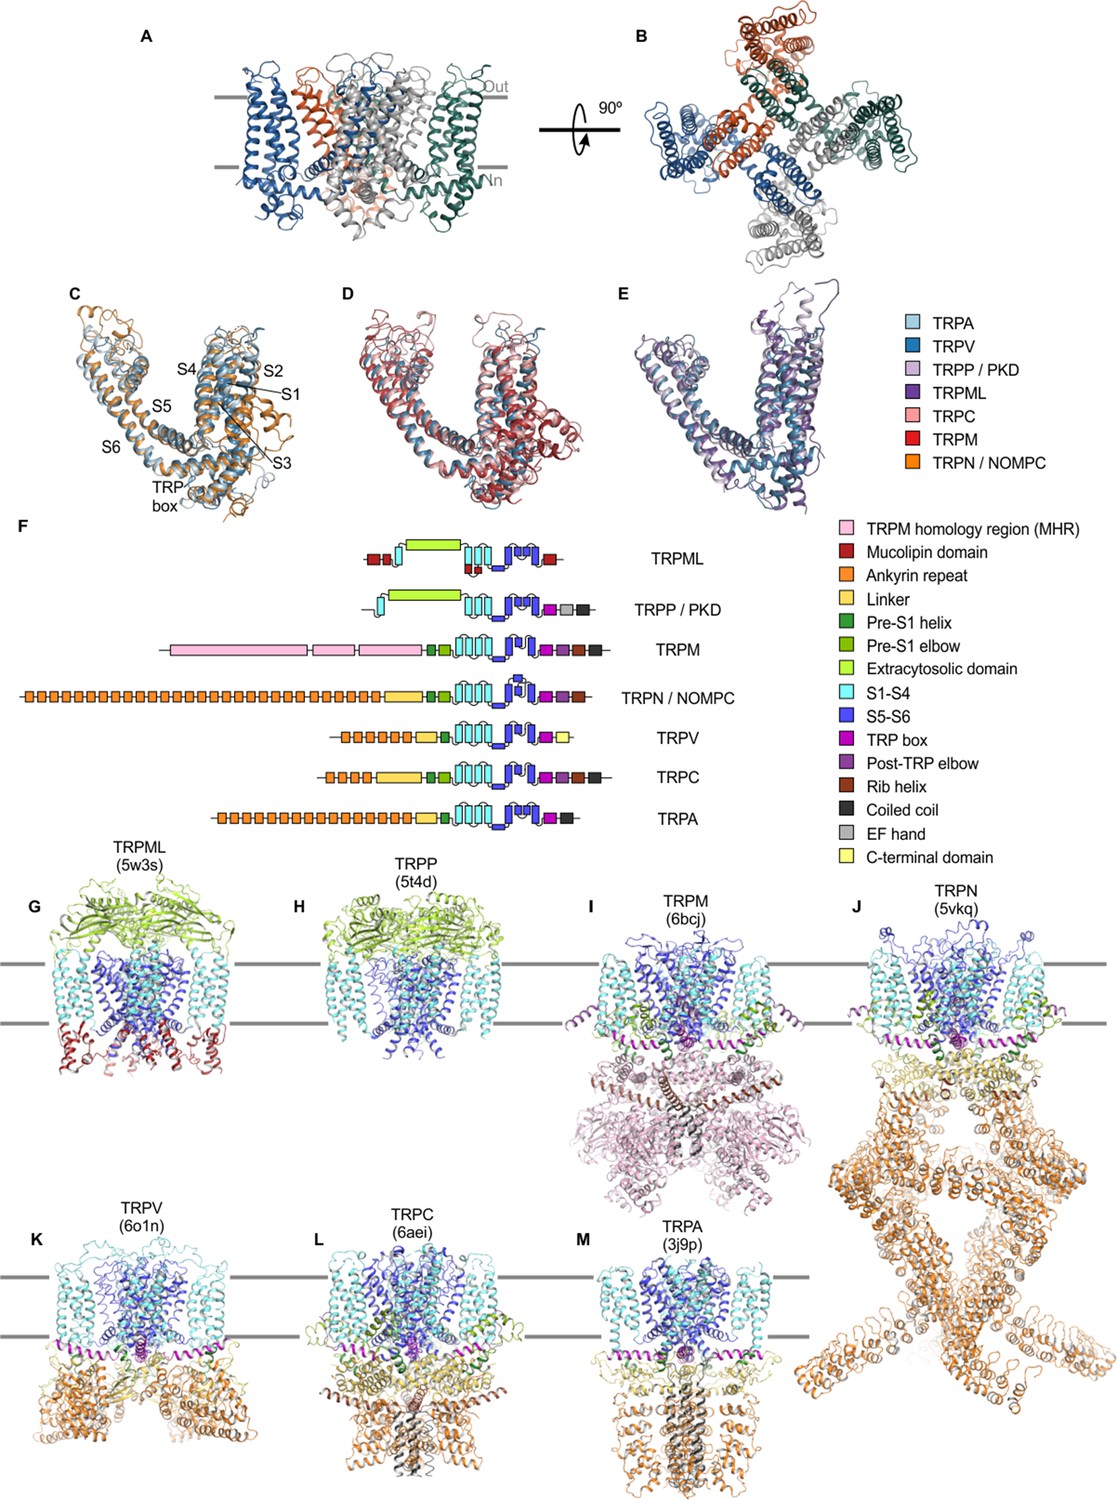
Structures of TRP channel subfamilies.
(A) Backbone fold of apo TRPV1 in nanodiscs (5irz) viewed from the side, with approximate boundaries of the membrane indicated with gray bars. (B) Same structure as in A viewed from the extracellular side. (C–E) Superimposed structures of TM domains for apo TRPV1 (blue; 5irz) with (C) apo TRPN (orange; 5vkq) and apo TRPA1 (light blue; 3j9p), (D) apo TRPC5 (pink; 6aei) and apo TRPM4 (red; 6bcj). (E) apo TRPML3 (dark purple; 5w3s) and apo TRPP1 (light purple; 5t4d). For clarity, only one of the four subunits shown. (F) Schematic of domain architecture of TRP channel subunits. (G–M) Cartoon representation of structure with domains colored as in F of apo structures of (G) TRPML3 (5w3s), (H) TRPP1 (5t4d), (I) TRPM4 (6bcj), (J) TRPN (5vkq), (K) TRPV5 (6o1n), (L) TRPC5 (6aei), and (M) TRPA1 (3j9p).
Figure 2 with 4 supplements
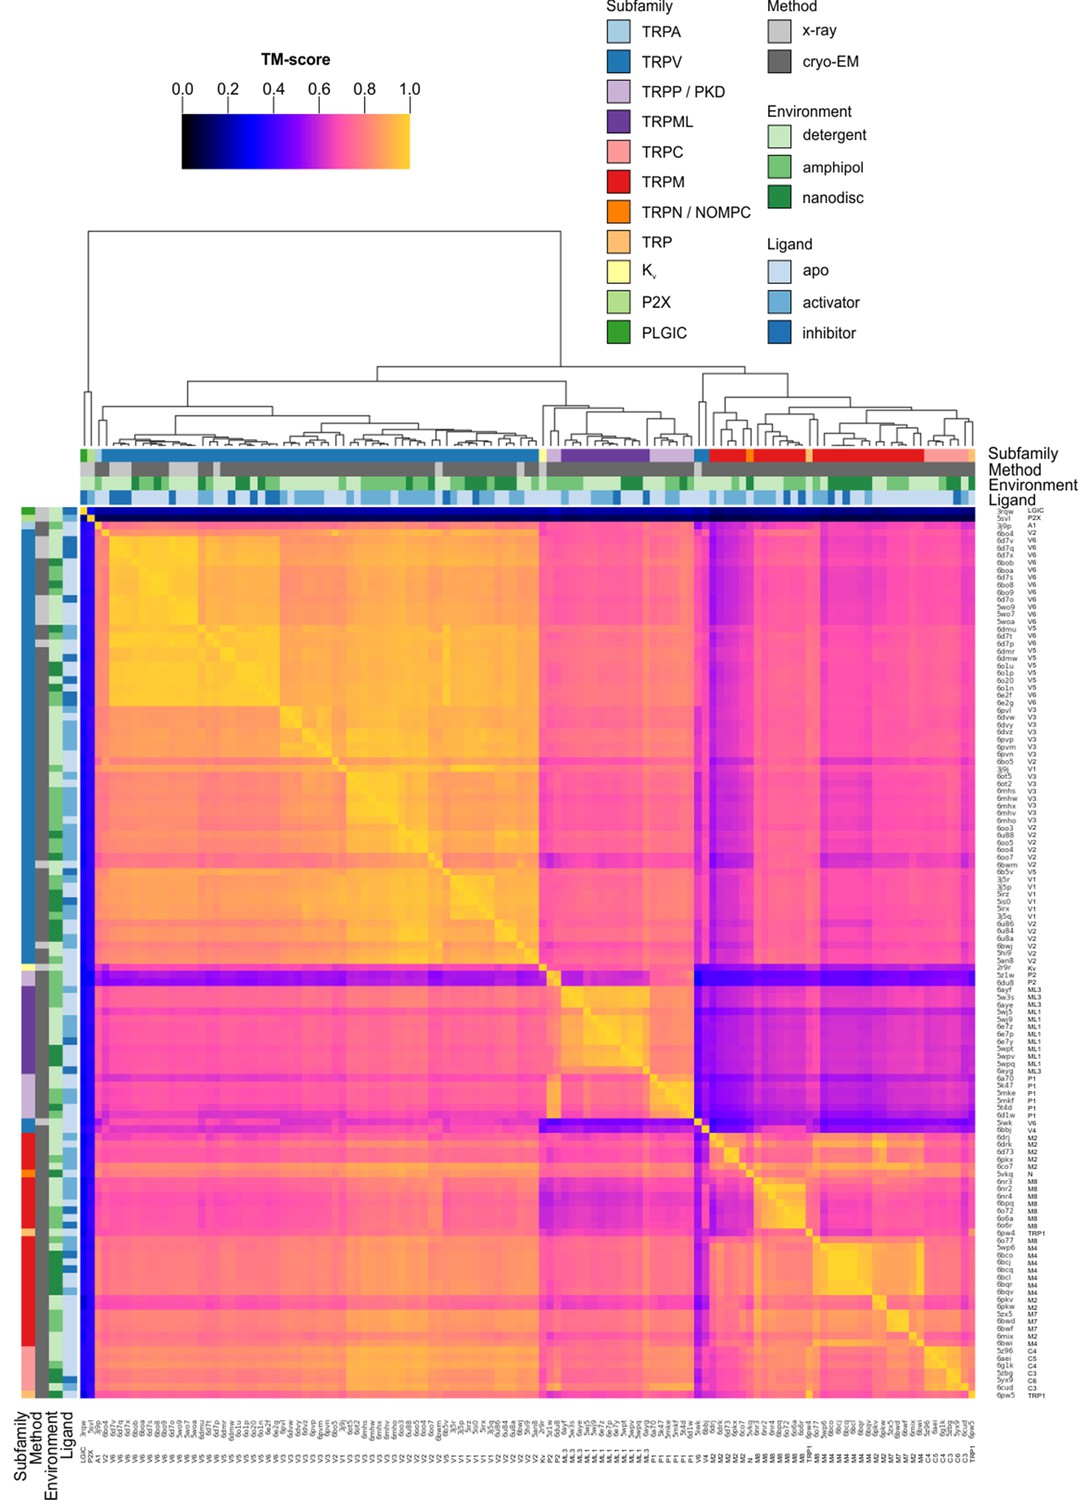
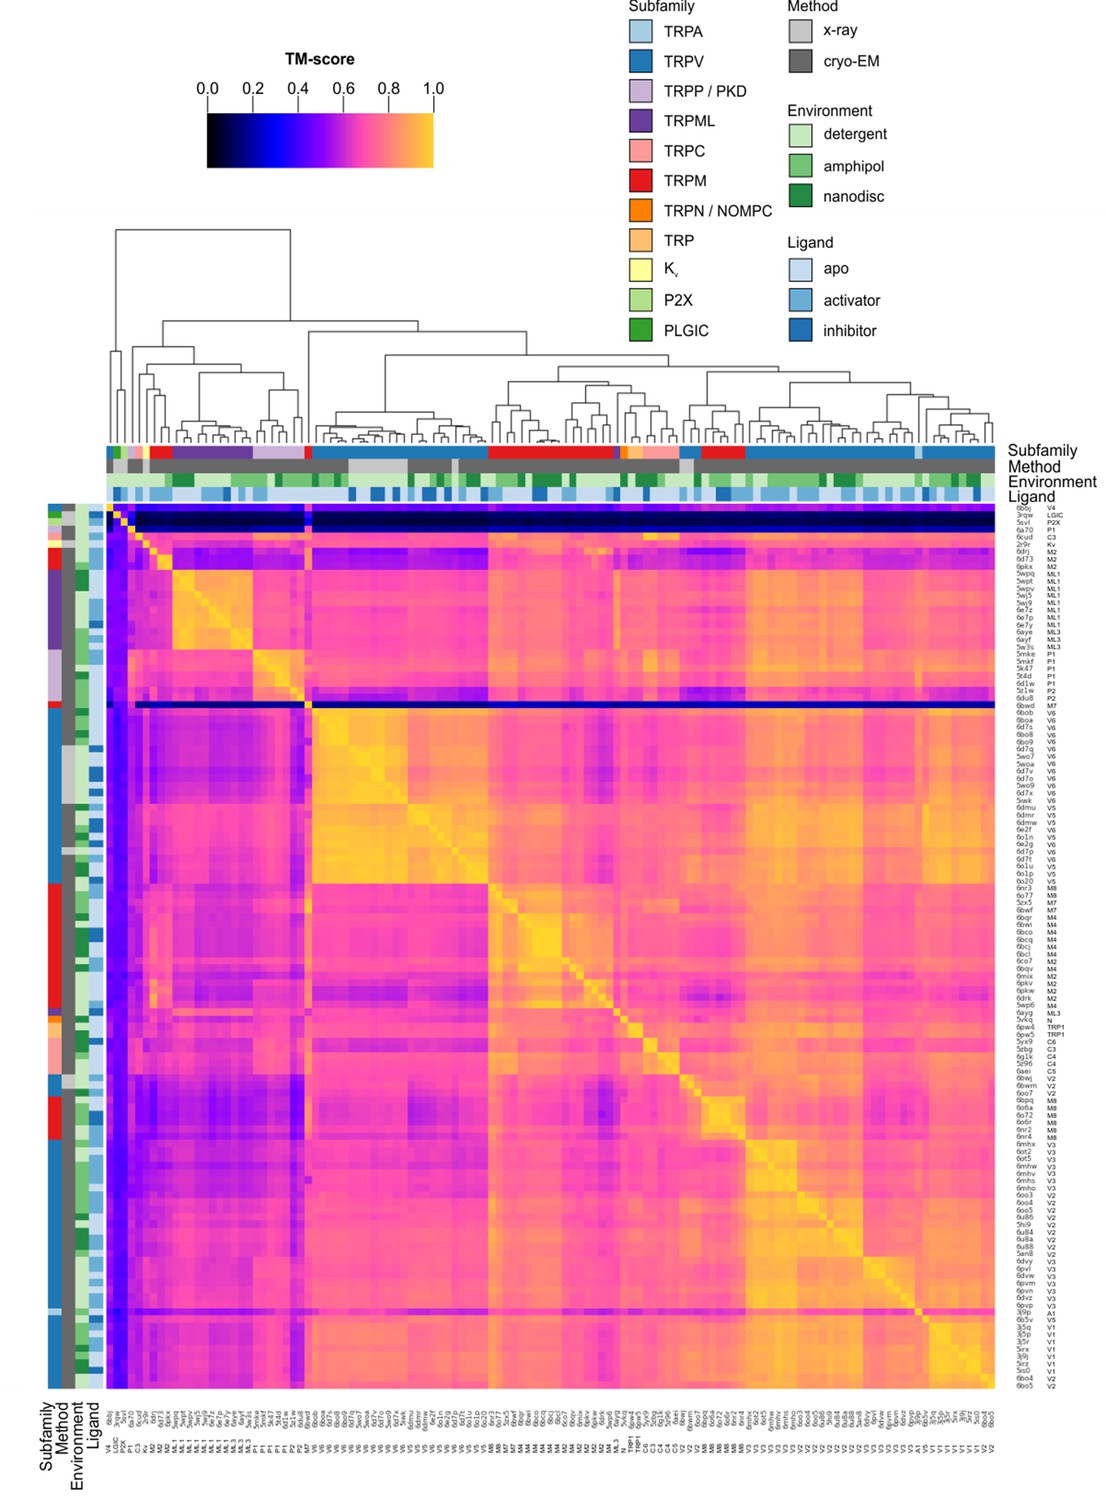
Clustered heatmap of TM-scores for the pairwise structural alignments of the TM domains of TRP channels.
The heatmap indicates how similar the TM domain (pre-S1 to TRP box) of each pair of TRP channel structures is, as expressed by the TM-score reported for each pairwise structural alignment performed with Fr-TM-align. A comparison of identical structures is indicated with yellow (TM-score of 1), whereas no structural similarity is indicated with black (TM-score of 0). The TM-score is further used to cluster the TRP channel structures. Representative Kv, P2X and PLGIC channel structures are included as a control. Note that the heatmap is not symmetric because the TM-score takes into account the sequence length of the reference structure (see Materials and methods).
-
Figure 2—source data 1
Master TRP channel list.
- https://cdn.elifesciences.org/articles/58660/elife-58660-fig2-data1-v1.xlsx
-
Figure 2—source data 2
Data file for clustered heatmap of TM domain.
- https://cdn.elifesciences.org/articles/58660/elife-58660-fig2-data2-v1.csv
-
Figure 2—source data 3
Data file for clustered heatmap of pore domain.
- https://cdn.elifesciences.org/articles/58660/elife-58660-fig2-data3-v1.csv
-
Figure 2—source data 4
Data file for clustered heatmap of S1-S4 domain.
- https://cdn.elifesciences.org/articles/58660/elife-58660-fig2-data4-v1.csv
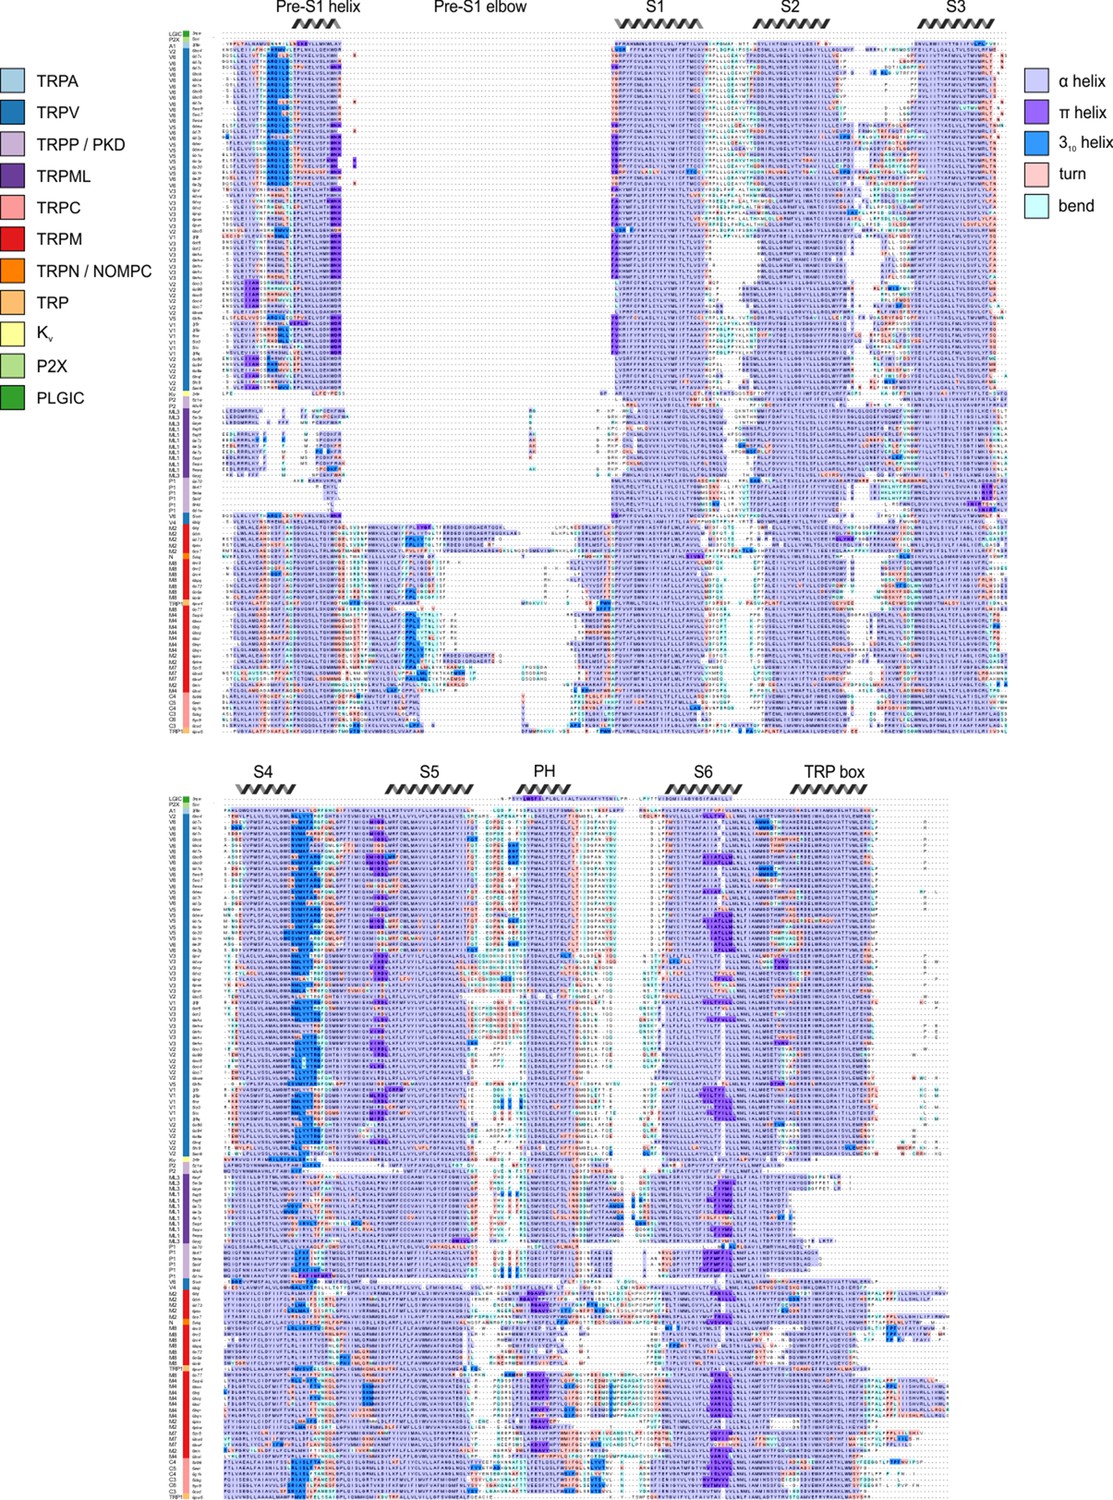
Figure 2—figure supplement 1
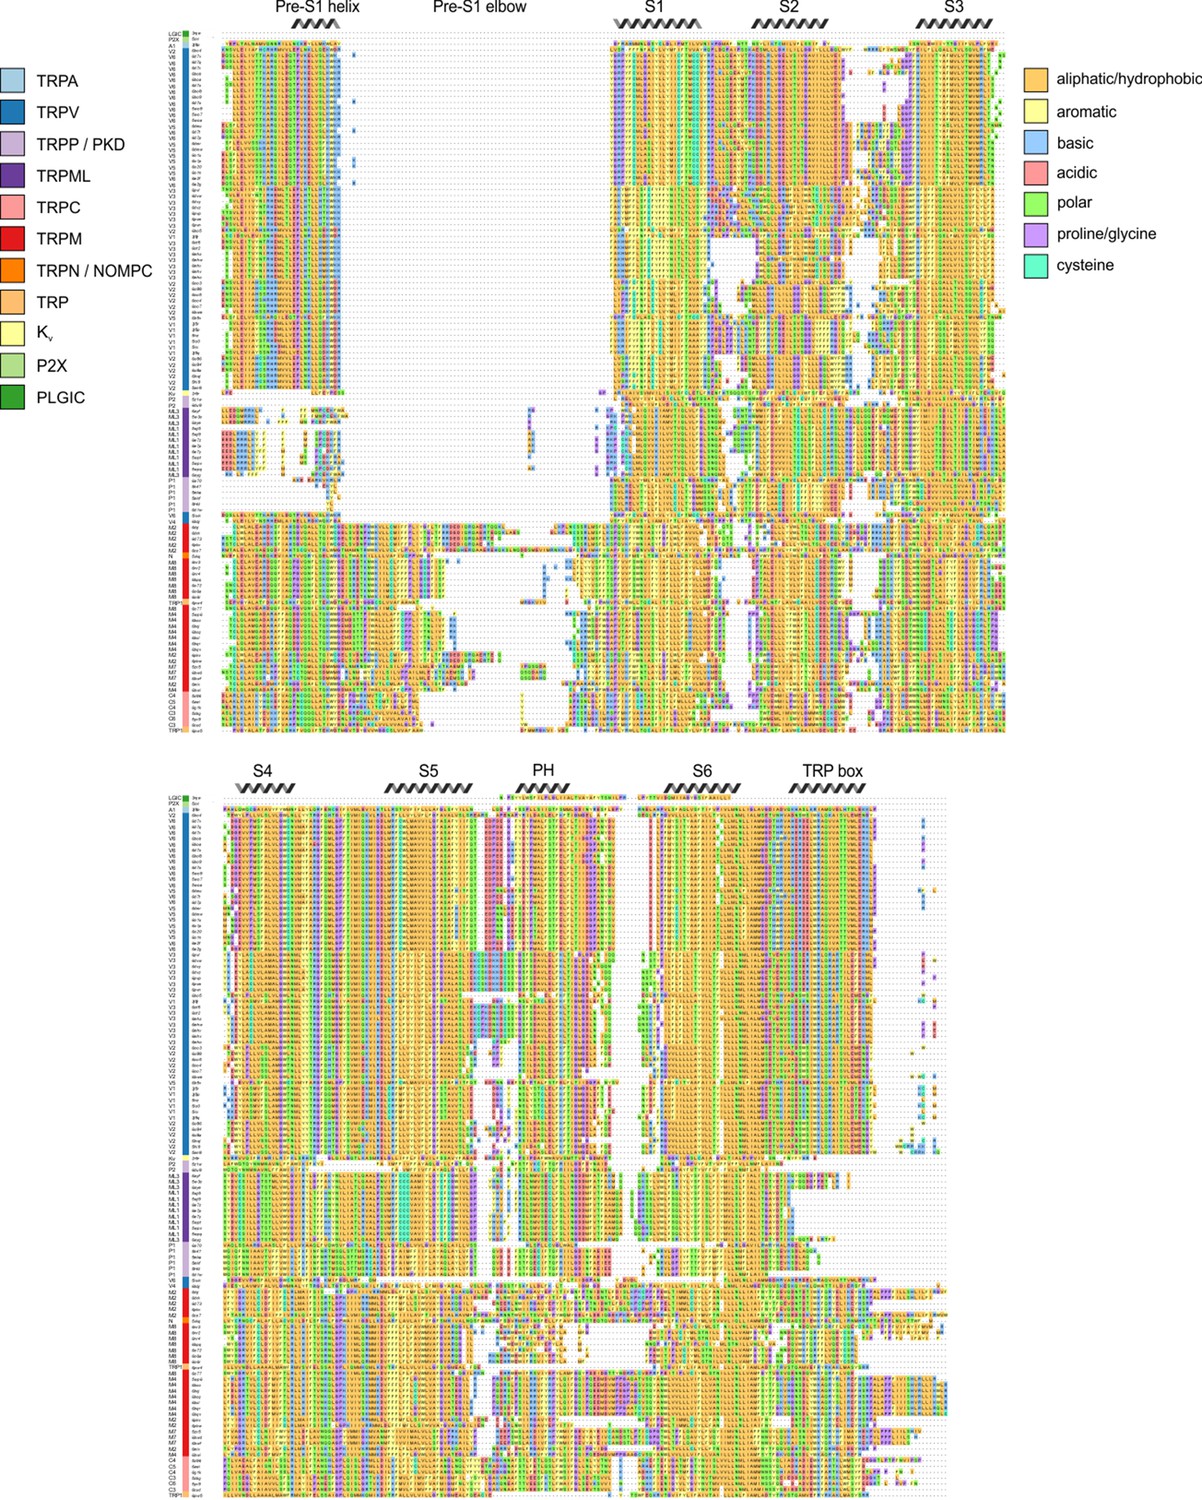
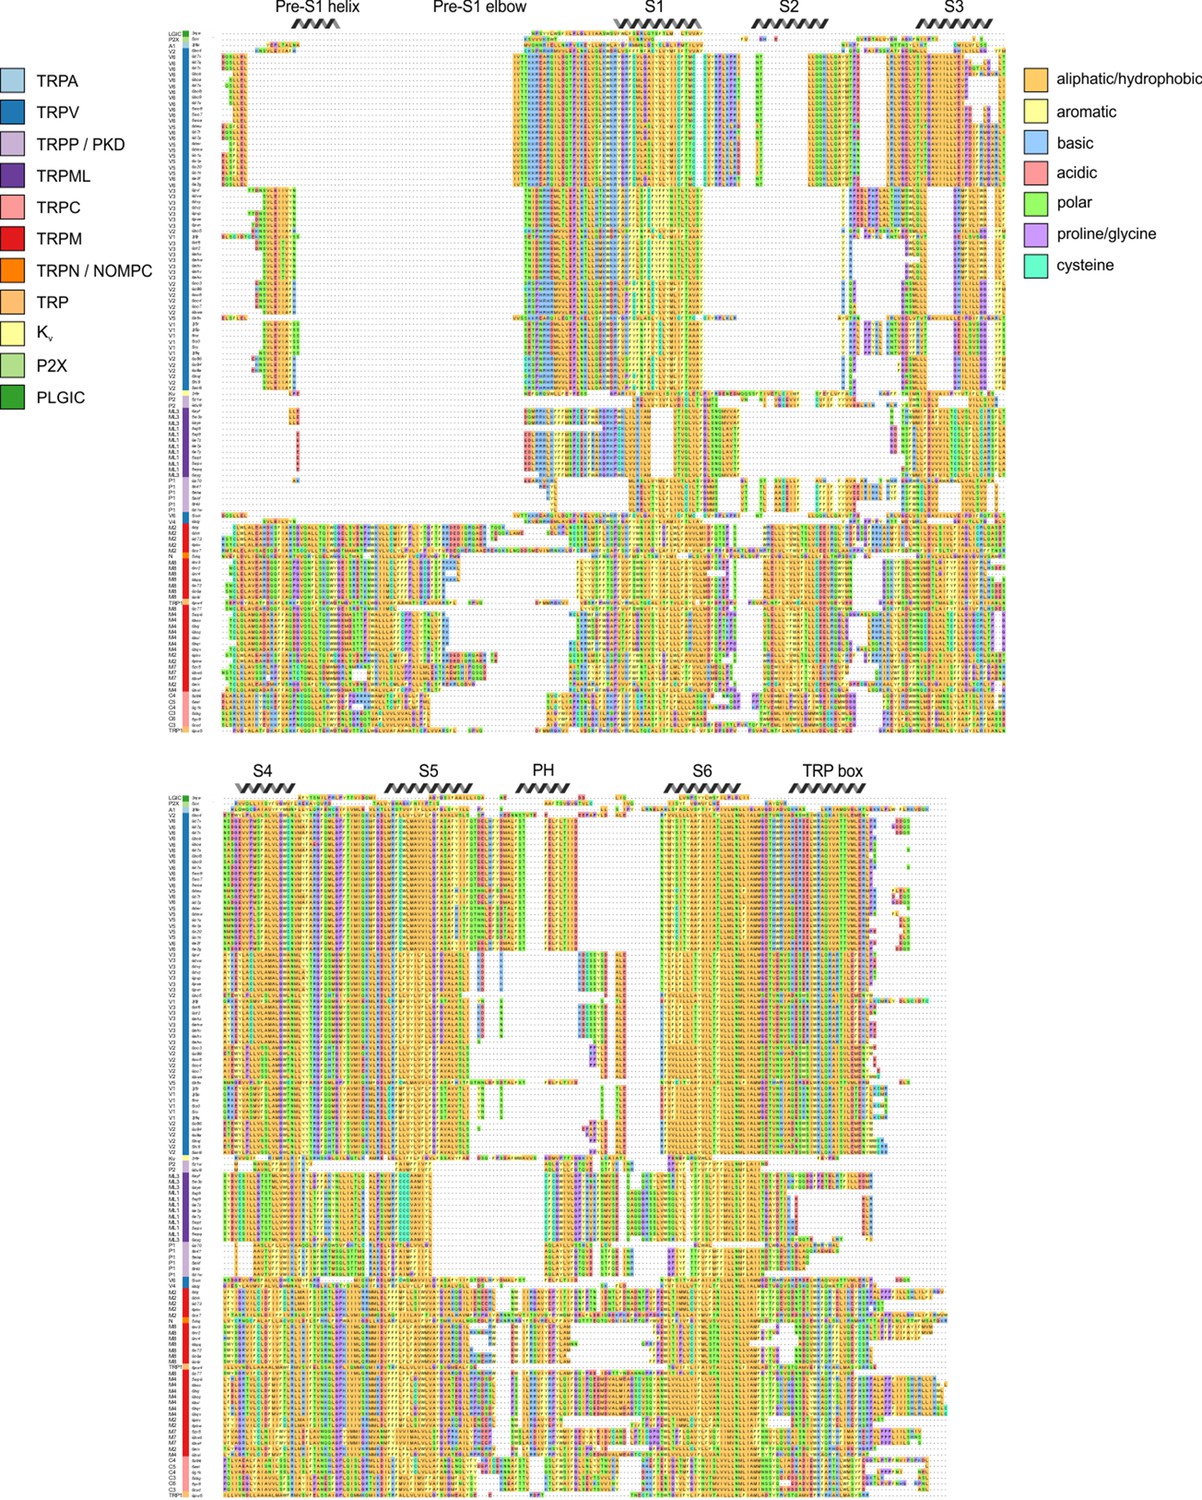
Structure-based multiple sequence alignment for TRP channels structures.
Structure-based multiple sequence alignment generated from Fr-TM-Align pairwise alignments of each structure with 6co7 as the template, omitting any residue that did not align to a residue in 6co7. Sequences are ordered based on hierarchical clustering from Figure 2. This sequence alignment shows the bounds of what was considered part of the TM domain, spanning from the pre-S1 helix to the TRP box. All domains are labeled based on structural consensus. PH stands for pore helix.
Figure 2—figure supplement 2
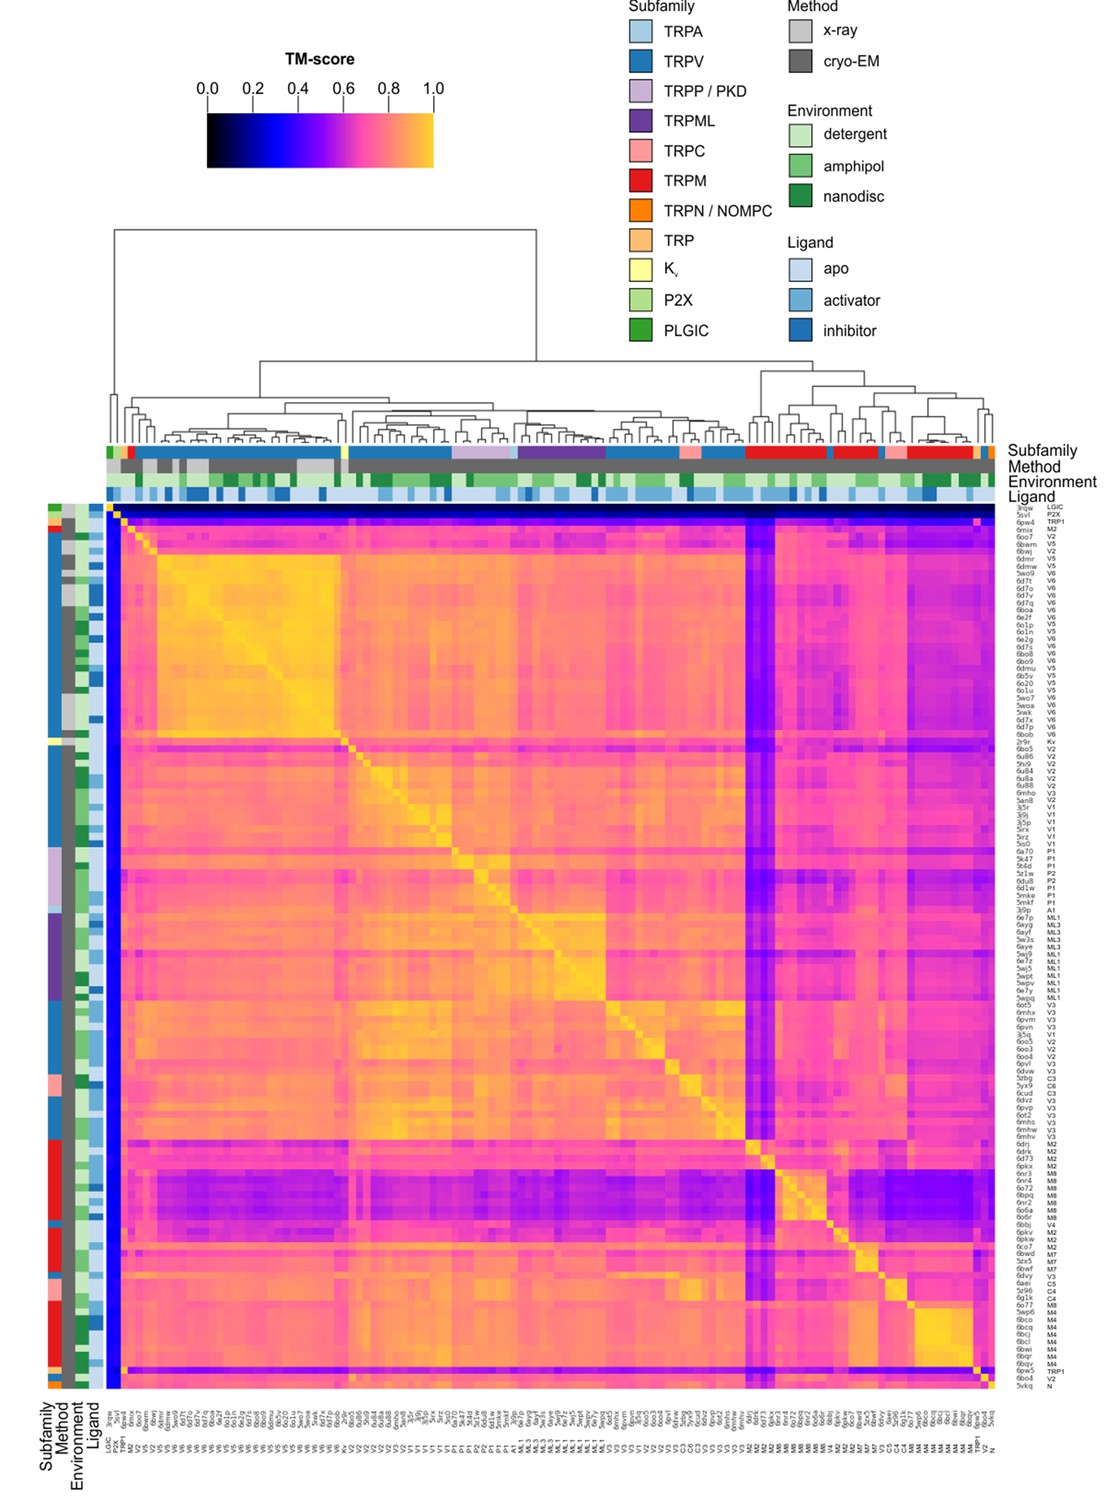
Clustered heatmap of TM-scores for the pairwise structural alignments of the pore domains of TRP channels.
The heatmap indicates how similar the pore domain (S5–S6) of each pair of TRP channel structures is, as expressed by the TM-score reported for each pairwise structural alignment performed with Fr-TM-align. A comparison of identical structures is indicated with yellow (TM-score of 1), whereas no structural similarity is indicated with black (TM-score of 0). The TM-score is further used to cluster the TRP channel structures. Representative Kv, P2X and PLGIC channel structures are included as a control. Note that the heatmap is not symmetric because the TM-score takes into account the sequence length of the reference structure (see Materials and methods).
Figure 2—figure supplement 3
Clustered heatmap of TM-scores for the pairwise structural alignments of the S1-S4 domains of TRP channels.
The heatmap indicates how similar the S1-S4 domain of each pair of TRP channel structures is, as expressed by the TM-score reported for each pairwise structural alignment performed with Fr-TM-align. A comparison of identical structures is indicated with yellow (TM-score of 1), whereas no structural similarity is indicated with black (TM-score of 0). The TM-score is further used to cluster the TRP channel structures. Representative Kv, P2X and PLGIC channel structures are included as a control. Note that the heatmap is not symmetric because the TM-score takes into account the sequence length of the reference structure (see Materials and methods).
Figure 2—figure supplement 4
Multiple sequence alignment for TRP channel sequences whose structures have been determined and used for structure-based alignment.
Sequence-based multiple sequence alignment generated from ClustalOmega alignment of amino acid sequences from every determined structure, omitting any residue that did not align to a residue in 6co7. Sequences are ordered based on hierarchical clustering from Figure 2. All domains are labeled based on reference structure (6co7). PH stands for pore helix.
Figure 3 with 3 supplements
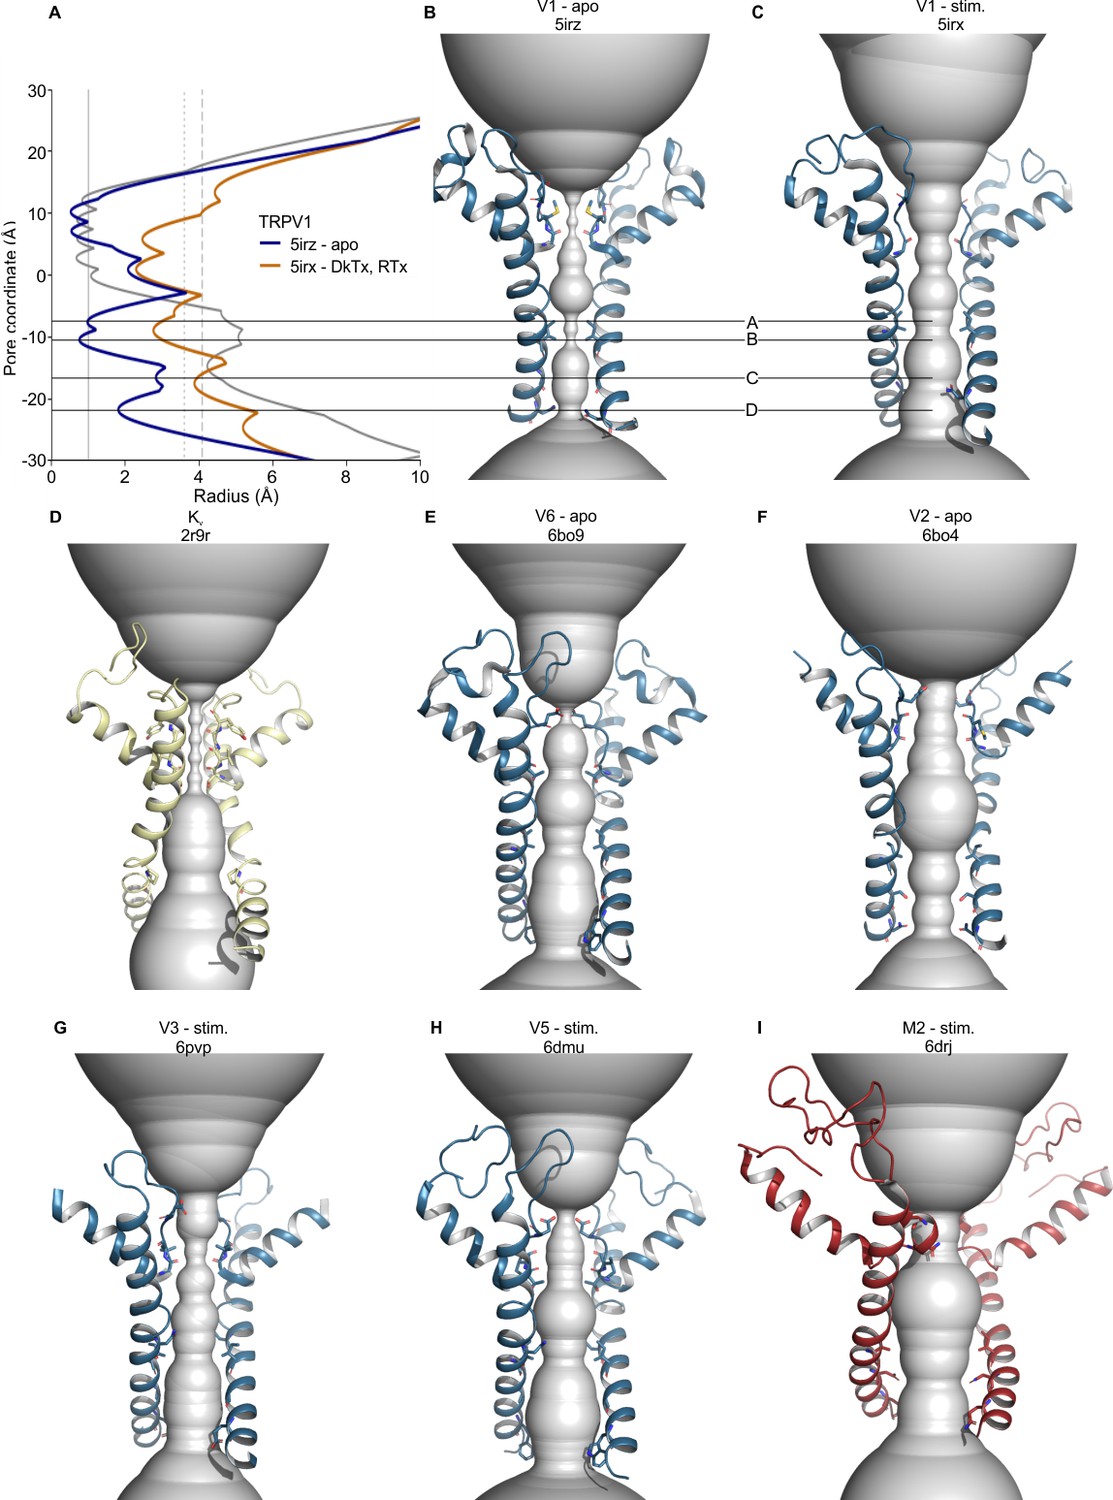
Pore radii in the S5-S6 pore domains of selected TRP channels according to HOLE.
(A) Pore radius profiles for TRPV1 apo (blue, 5irz) and RTx/DkTx complex (orange, 5irx) structures and for the Kv1.2/2.1 paddle chimera (grey, 2r9r). Vertical lines indicate radii of dehydrated Na+ and Ca2+ ions (solid), hydrated Na+ (dotted, HNa+) and Ca2+ ions (dashed, HCa2+). (B–I) Backbones of tetrameric cation channel pore domains, focusing on structures with the widest S6 gate radii, with HOLE representations in gray for (B) apo TRPV1 (5irz), (C) TRPV1 with RTx/DkTx bound (5irx), (D) Kv 1.2/2.1 paddle chimera (2r9r), (E) apo TRPV6 (6bo9), (F) apo TRPV2 (6bo4), (G) TRPV3 Y564A mutant after pretreatment at 37°C (6pvp), (H) TRPV5 with PIP2 (6dmu), and (I) TRPM2 with Ca2+ and ADP-ribose (6drj).
-
Figure 3—source data 1
Data file containing HOLE profile analysis for TRP channel pore domains.
- https://cdn.elifesciences.org/articles/58660/elife-58660-fig3-data1-v1.csv
-
Figure 3—source data 2
Data file for minimum SF and S6 radii scatterplot.
- https://cdn.elifesciences.org/articles/58660/elife-58660-fig3-data2-v1.csv
Figure 3—figure supplement 1
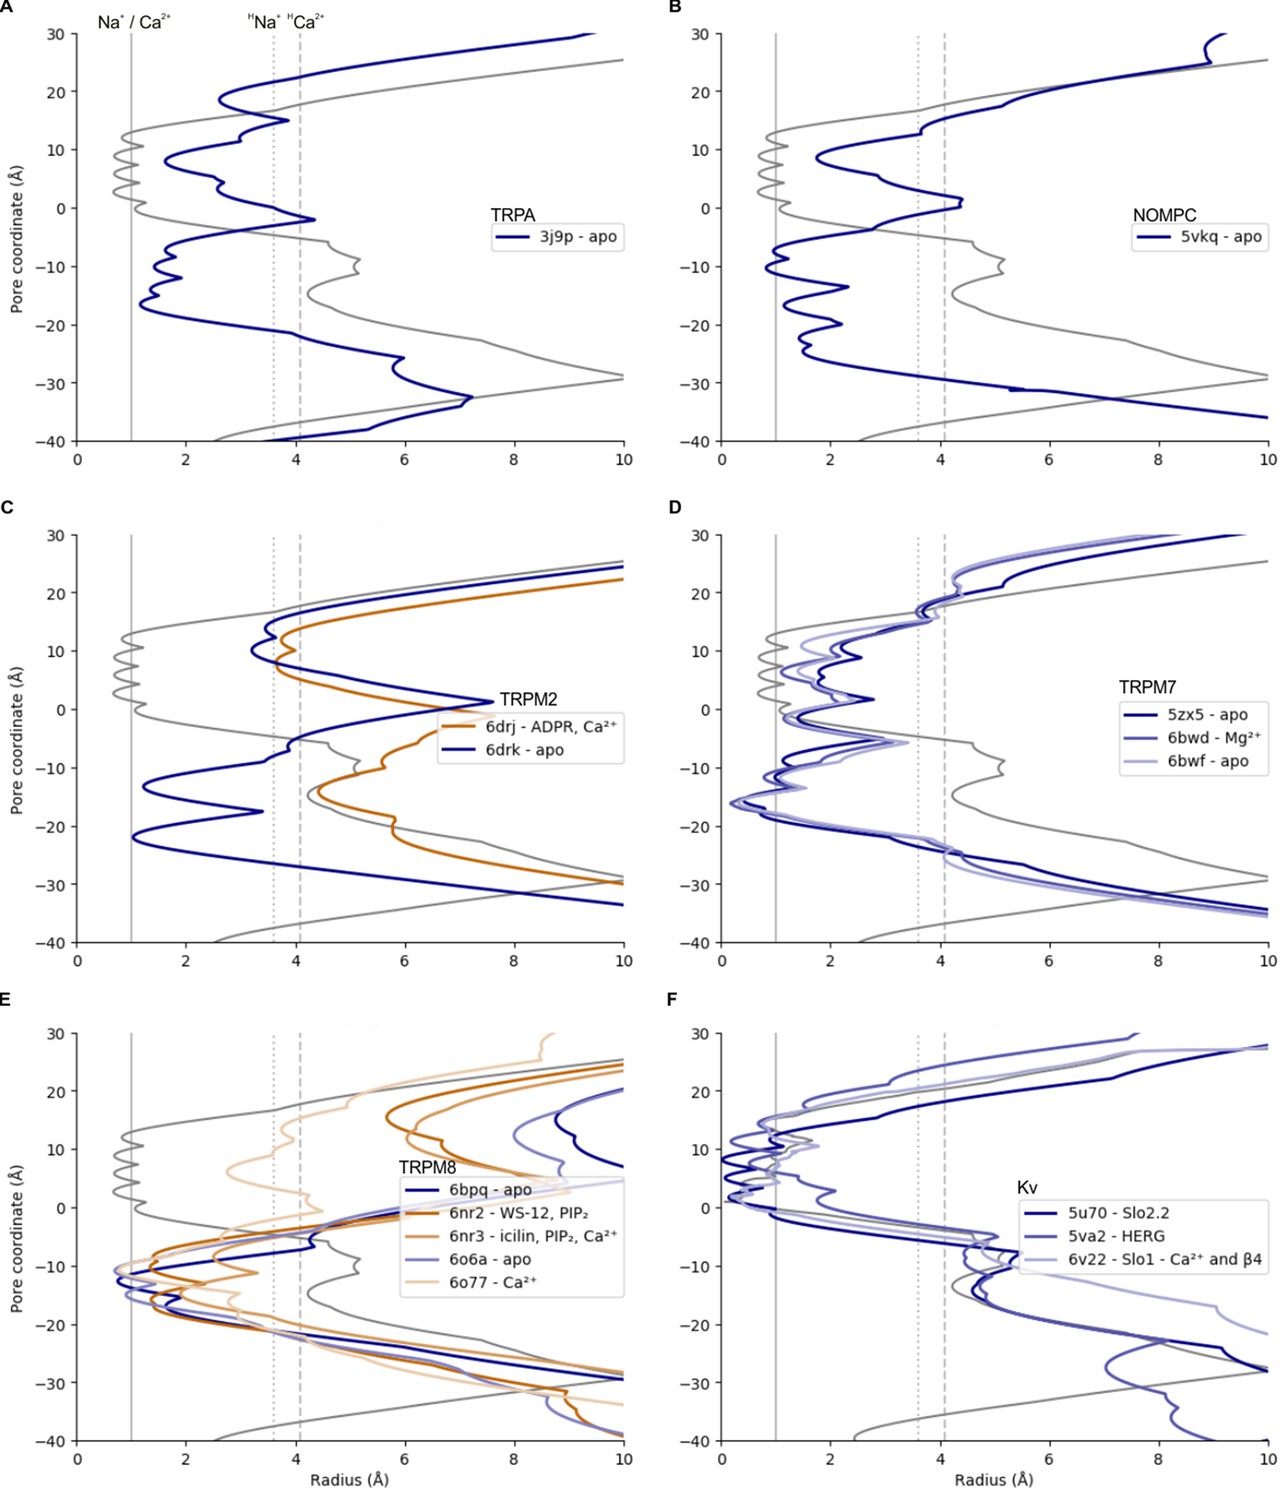
HOLE pore radius representations for S5-S6 pore domains of representative TRP and Kv channels.
Pore radius profiles for TRP channel structures and for the Kv1.2/2.1 paddle chimera (grey, 2r9r). Vertical lines indicate radii of dehydrated Na+ and Ca2+ ions (solid), hydrated Na+ (dotted, HNa+) and Ca2+ ions (dashed, HCa2+). Profiles are shown for structures of (A) TRPA1, (B) NOMPC, (C) TRPM2, (D) TRPM7, (E) TRPM8, and (F) Kv. Where applicable, apo structure profiles are shown in blue and activator-bound structure profiles are shown in orange. Note that for TRPM8 structures shown, only 6o77 has sufficient resolution in the extracellular selectivity filter.
Figure 3—figure supplement 2
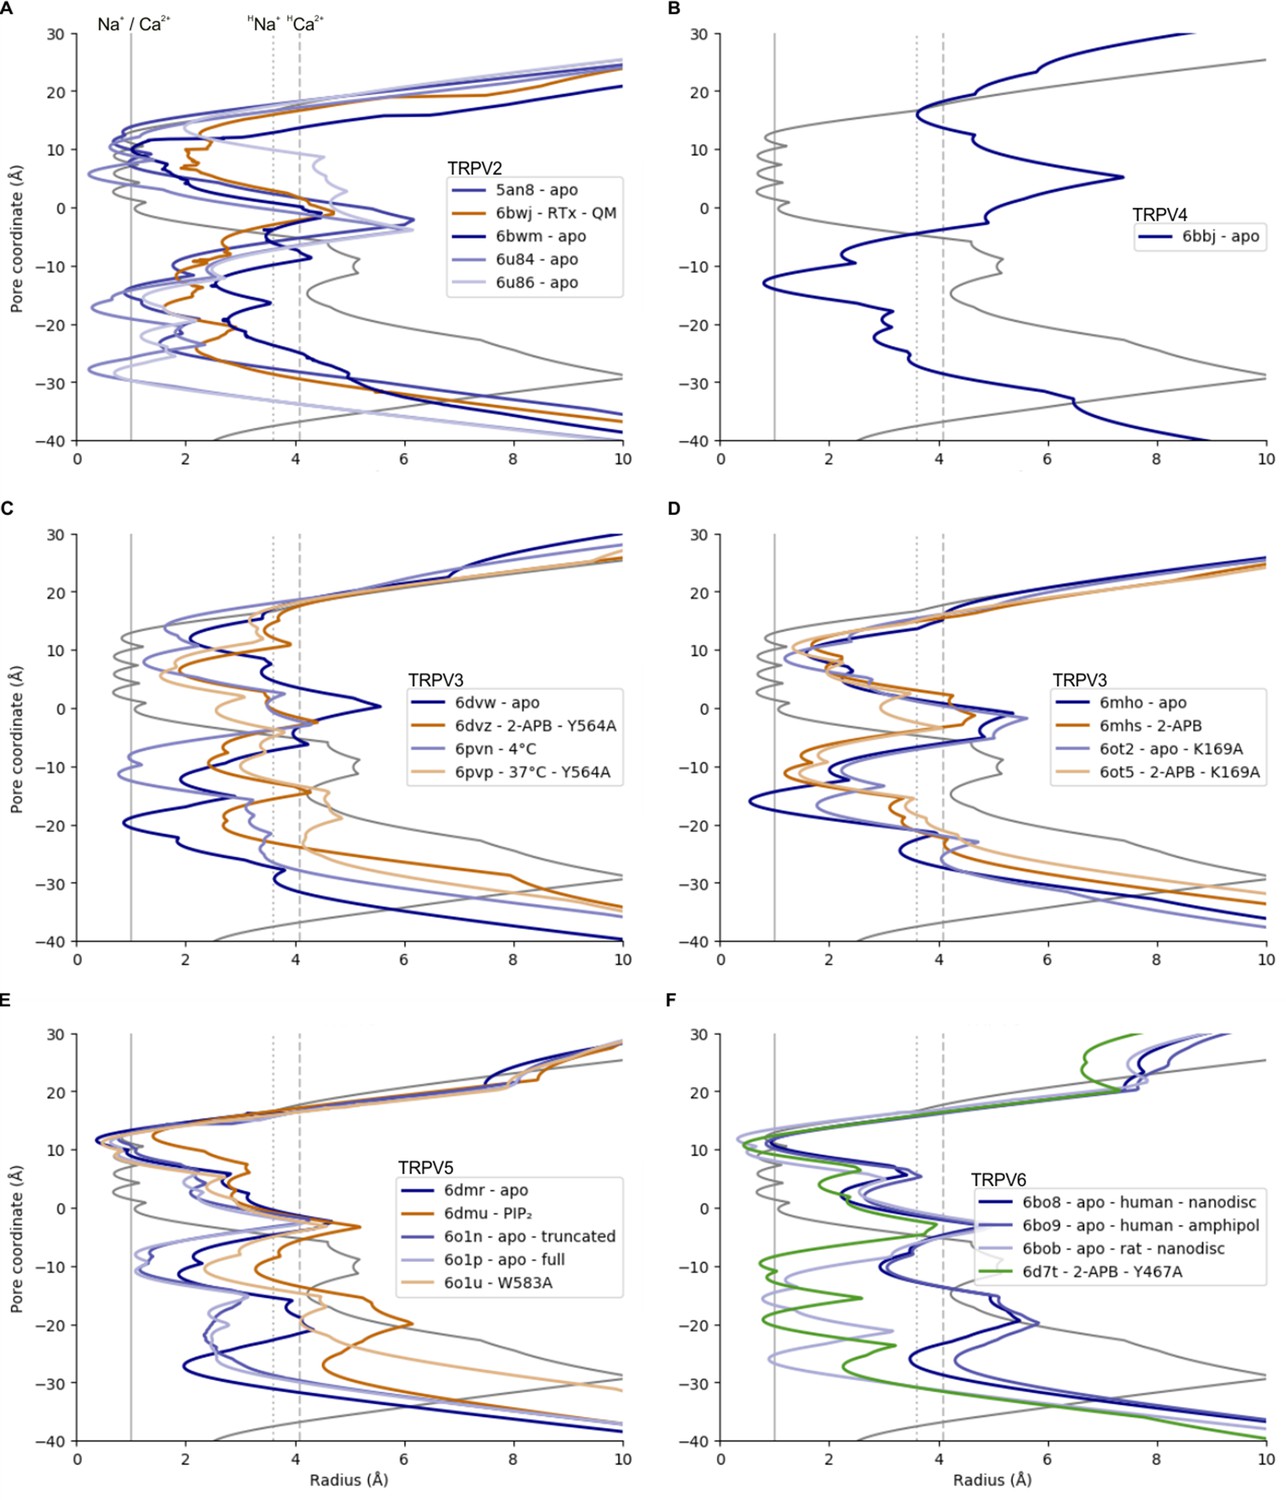
HOLE pore radius representations for S5-S6 pore domains of representative TRP channels.
Pore radius profiles for TRP channel structures and for the Kv1.2/2.1 paddle chimera (grey, 2r9r). Vertical lines indicate radii of dehydrated Na+ and Ca2+ ions (solid), hydrated Na+ (dotted, HNa+) and Ca2+ ions (dashed, HCa2+). Profiles are shown for structures of (A) TRPV2, (B) TRPV4, (C,D) TRPV3, (E) TRPV5, and (F) TRPV6. Where applicable, apo structure profiles are shown in blue, activator-bound structure profiles are shown in orange, and inhibitor-bound structure profiles are shown in green.
Figure 3—figure supplement 3
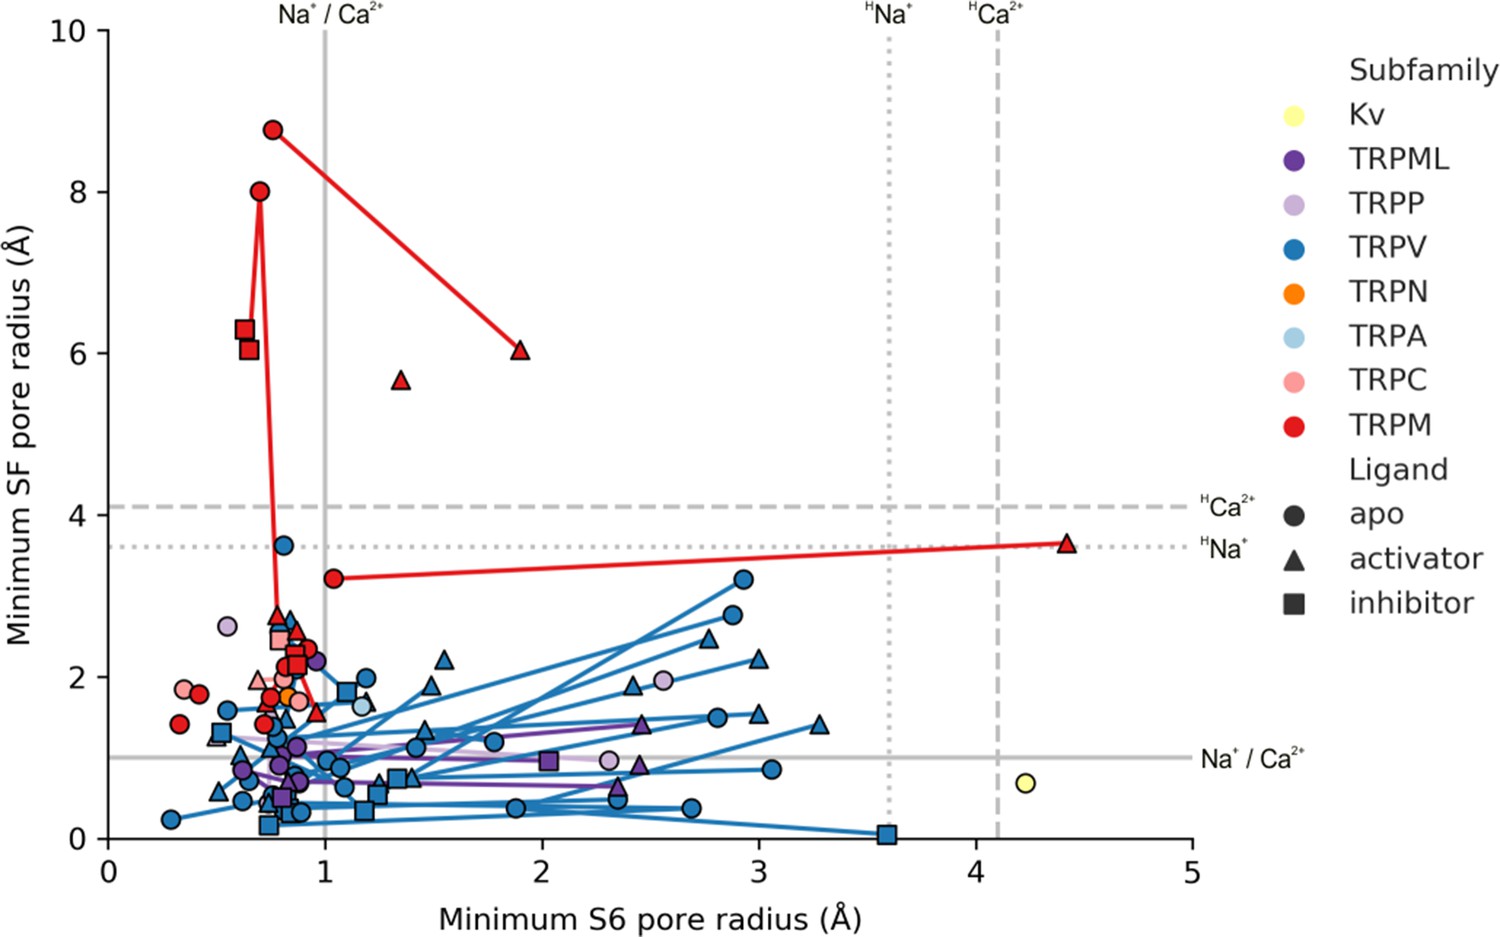
Comparing selectivity filter and internal pore minimum radii for TRP channel structures.
The narrowest pore radius formed by the selectivity filter (SF) is plotted against the narrowest pore radius found at the internal end of S6. Each marker represents one structure. Markers that represent the same channel determined under different conditions to obtain different conformations are connected with lines. Grey lines represent radii of dehydrated Na+ and Ca2+ ions (solid), hydrated Na+ (dotted, HNa+) and hydrated Ca2+ ions (dashed, HCa2+).
Figure 4 with 1 supplement
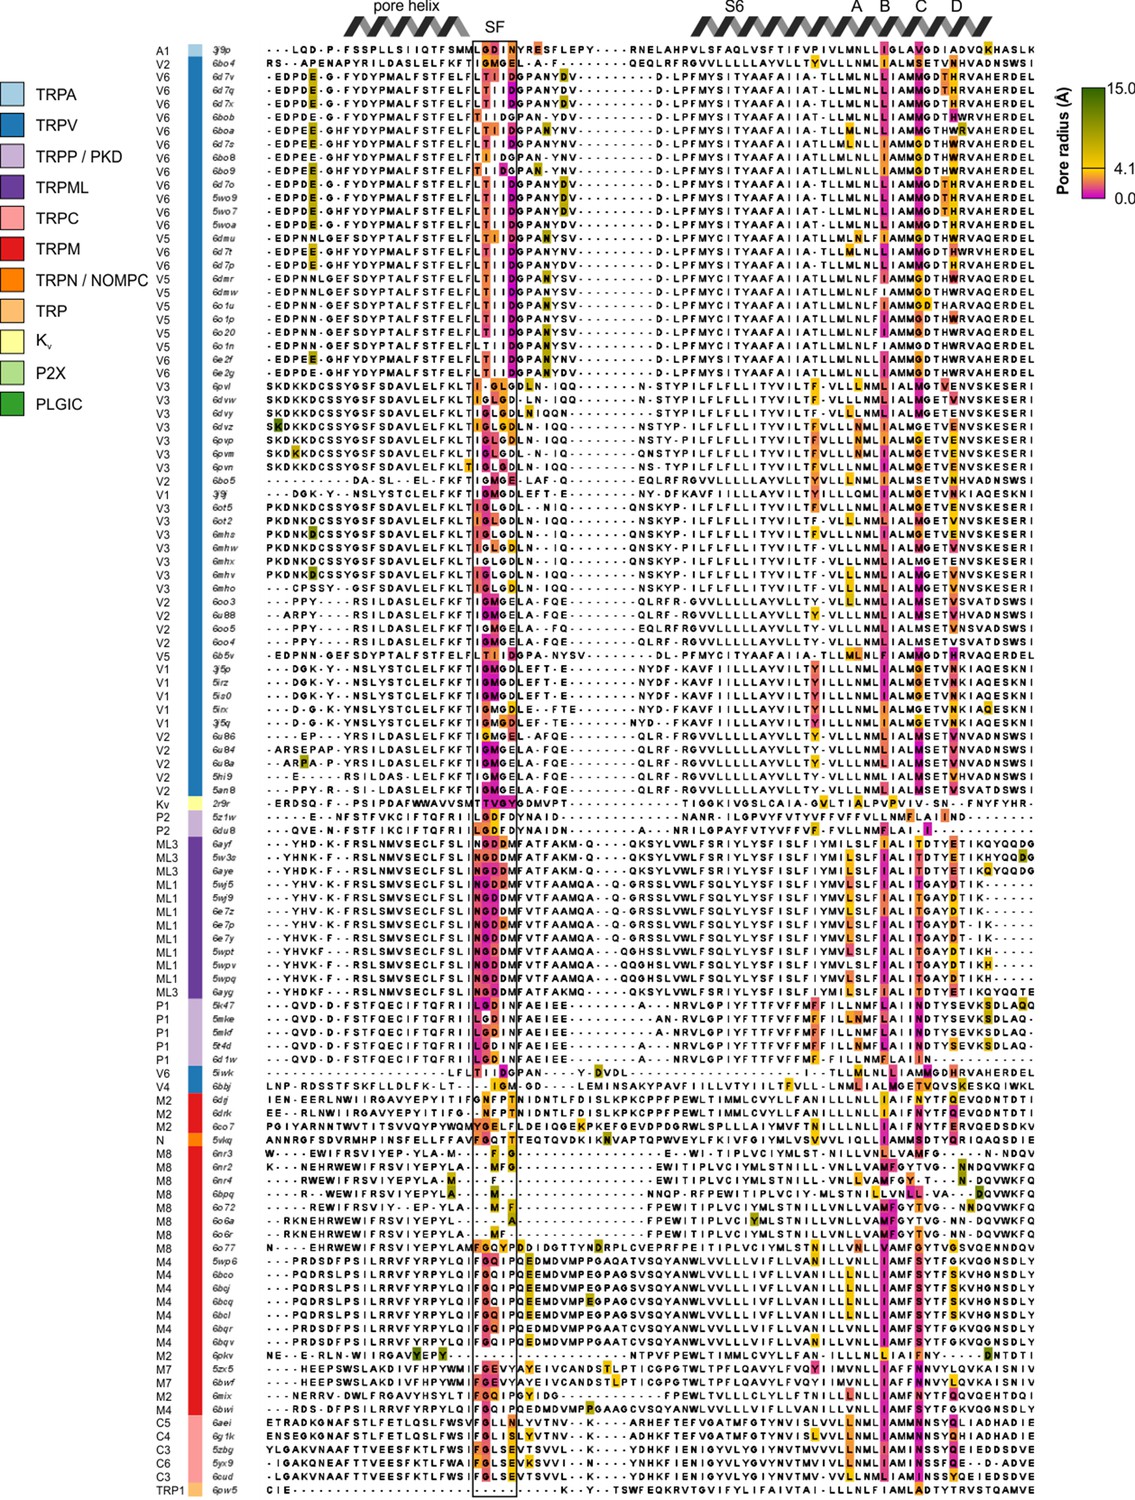
Structure-based multiple sequence alignment of pore-lining residues.
Structure-based multiple sequence alignment of pore-lining residues, with pore-contributing residues colored based on the narrowest pore radius associated with any atom in that residue (from magenta for narrowest to green for widest, passing through gold at 4.1 Å to represent the radius of a hydrated Ca2+ ion). Uncolored residues do not have any atoms whose van der Waals radii intersect with the HOLE profile. Sequences are ordered based on hierarchical clustering from Figure 2. The selectivity filter is indicated by SF.
-
Figure 4—source data 1
Excel file.
- https://cdn.elifesciences.org/articles/58660/elife-58660-fig4-data1-v1.csv
Figure 4—figure supplement 1
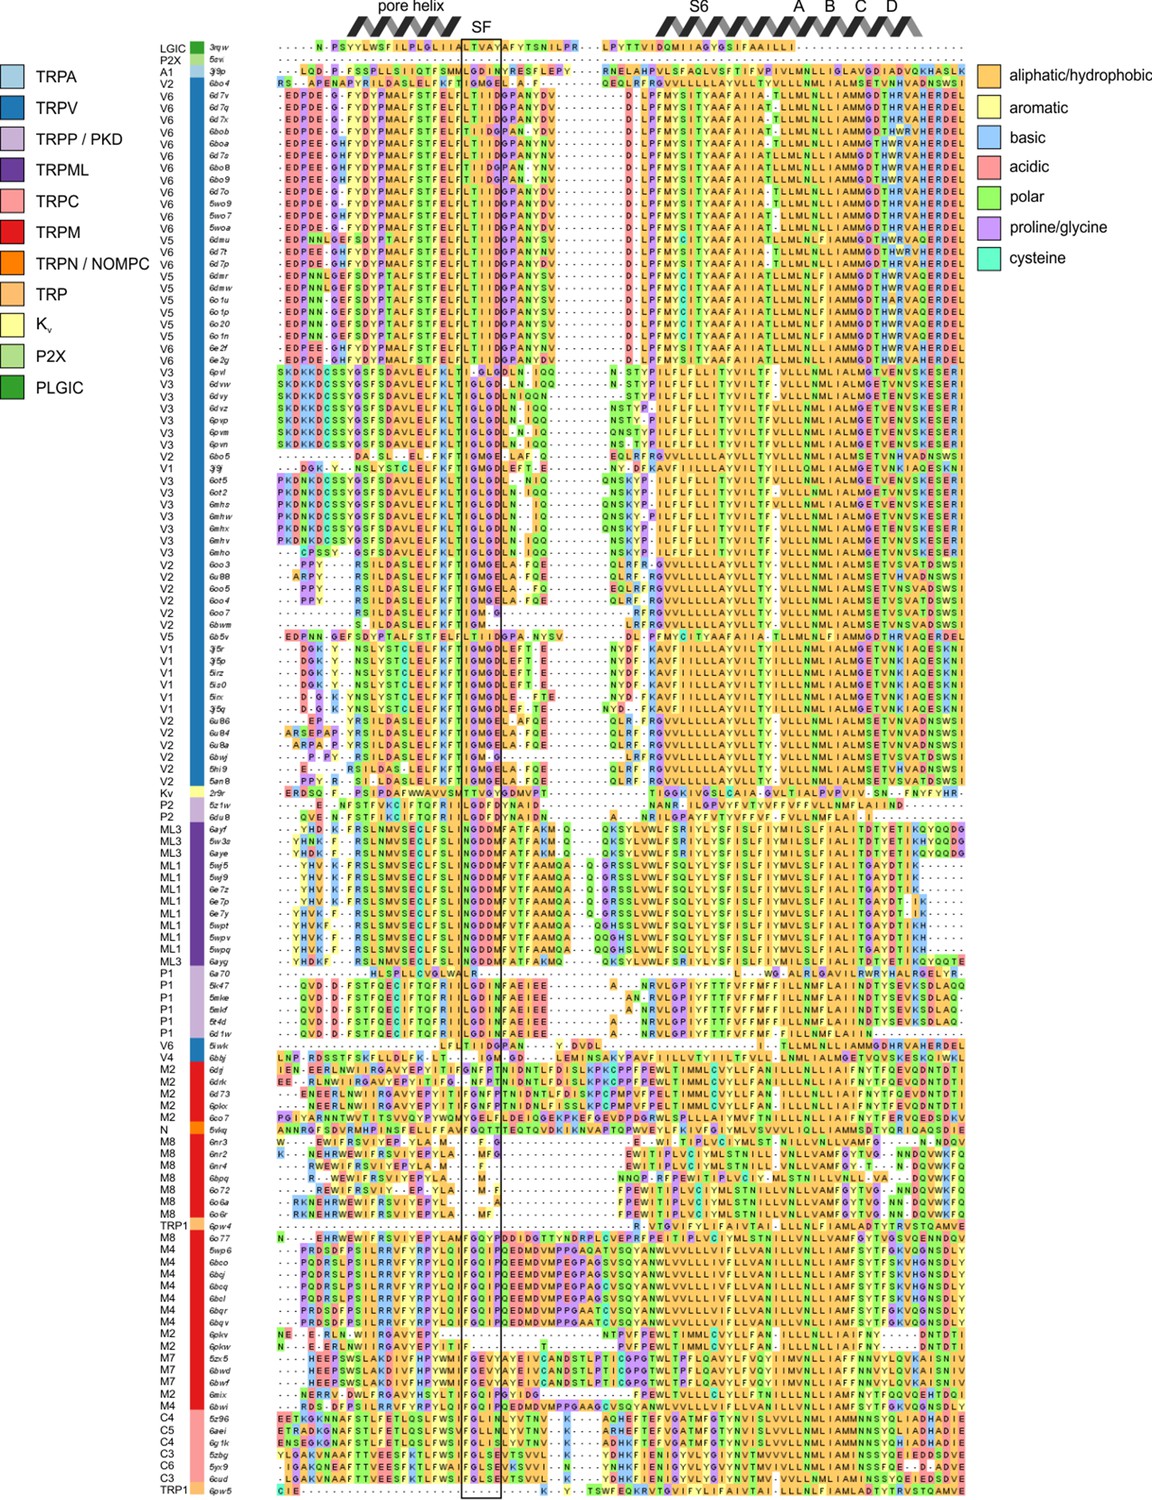
Structure-based multiple sequence alignment of pore-lining residues.
Structure-based multiple sequence alignment of pore-lining residues, with all residues colored based on side chain character. Sequences are ordered based on hierarchical clustering from Figure 2. The selectivity filter is indicated by SF.
Figure 5 with 2 supplements
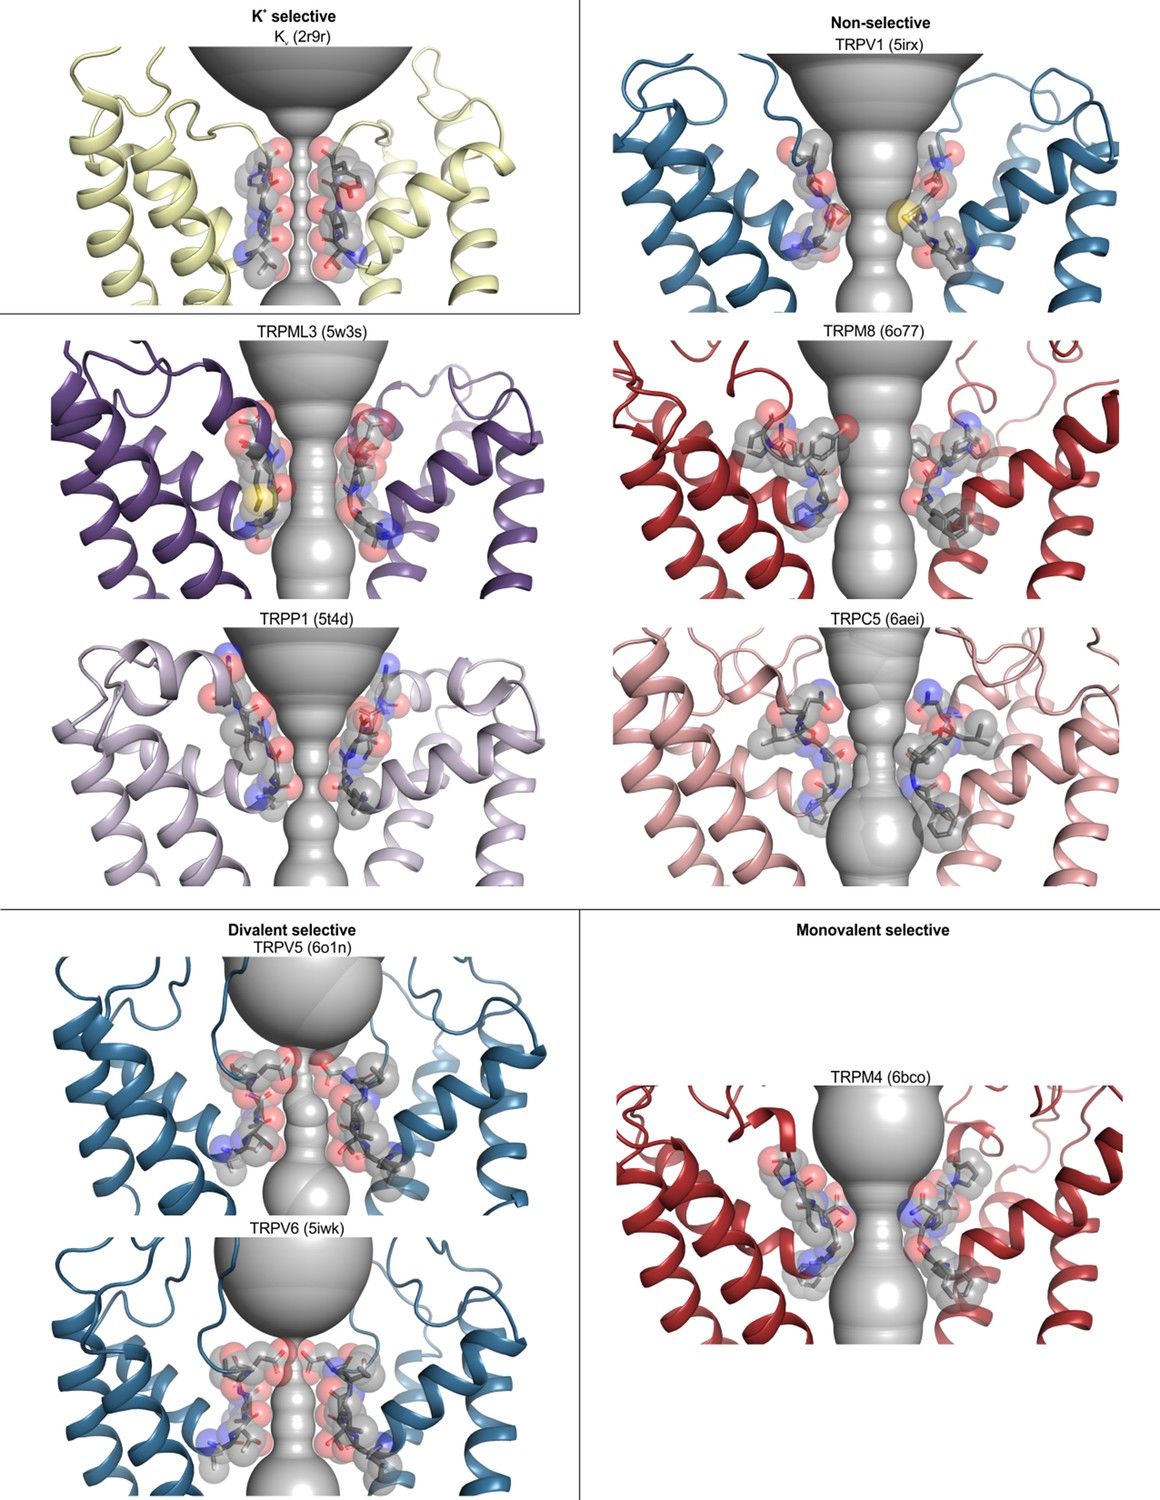
Selectivity filters in TRP channels with different ion selectivity.
Pore domains (S5–S6) of selected TRP channels, focusing on the selectivity filter constriction at the extracellular end of the pore. Residues lining the selectivity filter are shown as grey sticks and spheres, with HOLE profiles shown in grey. PDB accession codes are 2r9r (Kv 1.2/2.1 paddle chimera), 5irx (TRPV1), 5w3s (TRPML3), 6o77 (TRPM8), 5t4d (TRPP1), 6aei (TRPC5), 6o1n (TRPV5), 5iwk (TRPV6), and 6bco (TRPM4). While TRPM5 is also classified as monovalent-selective, there are no structures available for this channel.
Figure 5—figure supplement 1
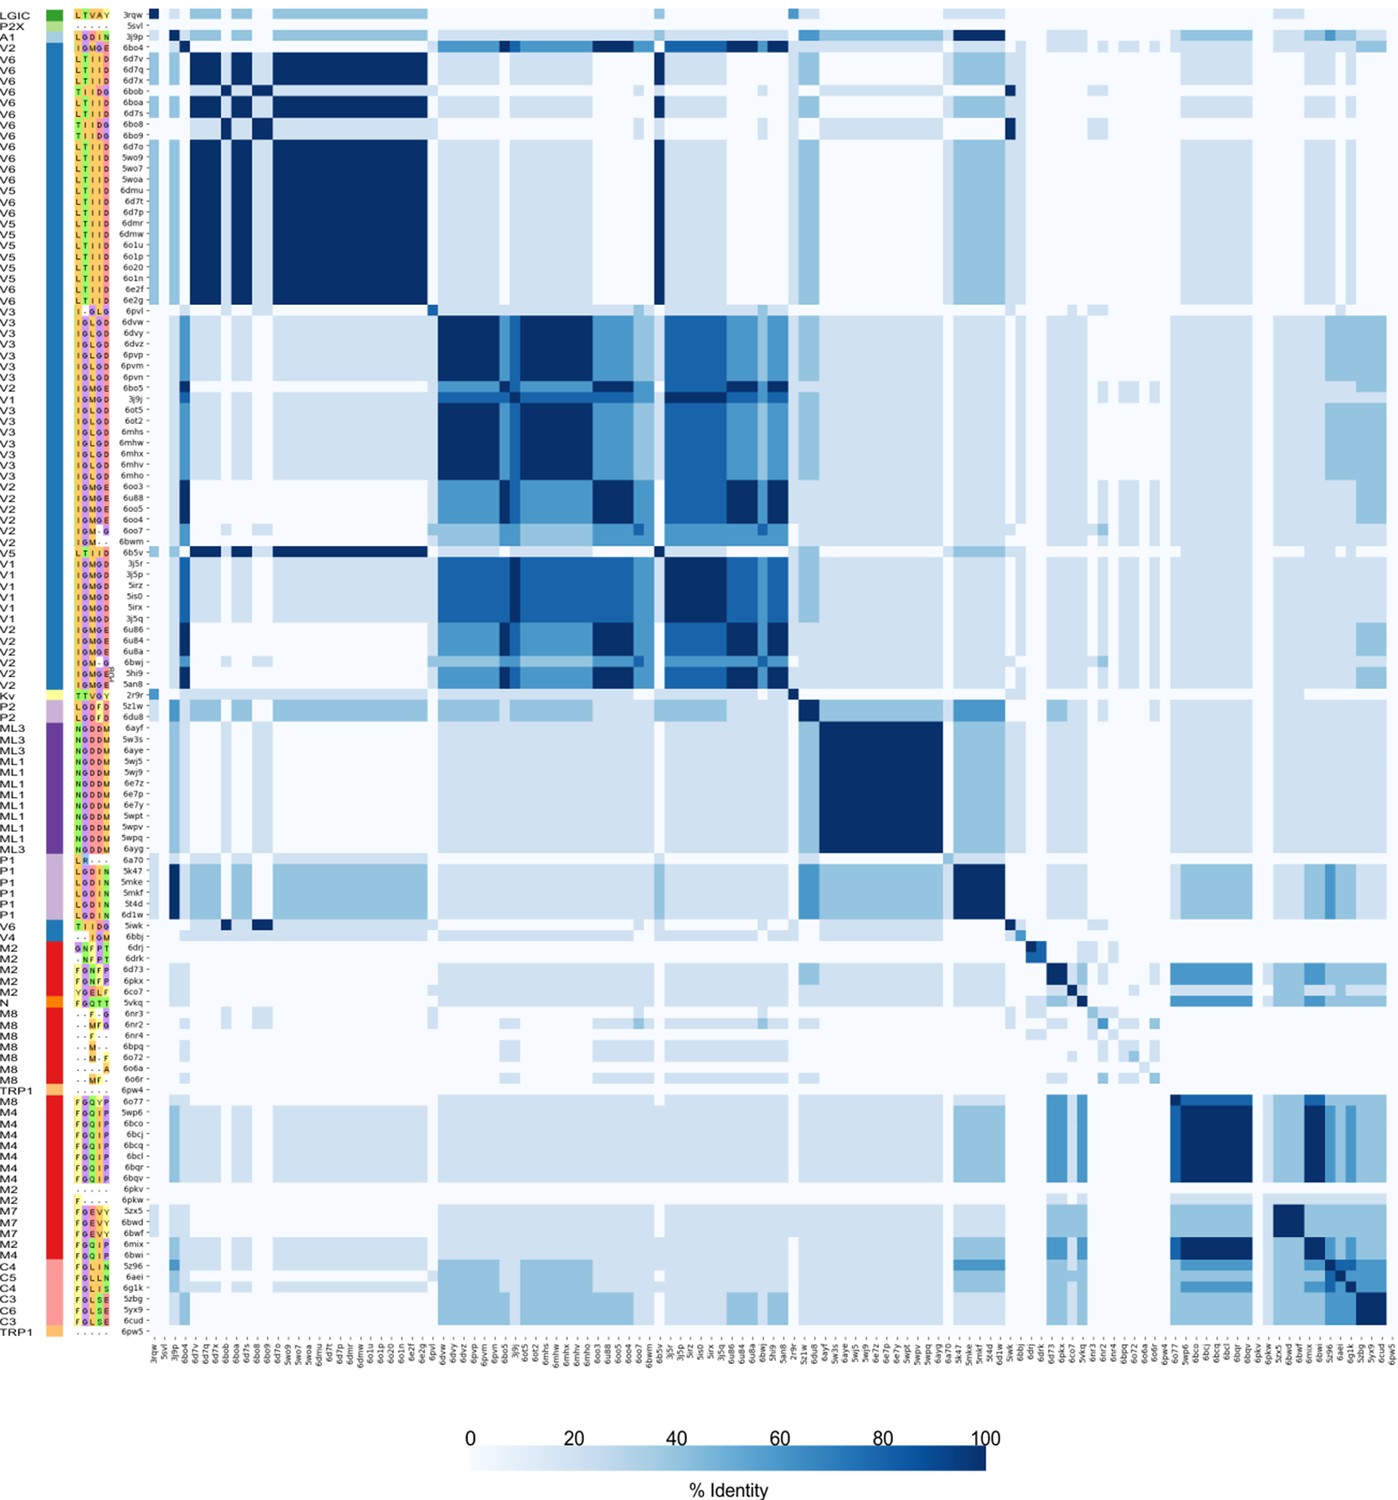
Heatmap comparing selectivity filter identity in TRP channels.
Selectivity filters highlighted in Figure 4—figure supplement 1 were compared pairwise for all TRP channel structures to calculate percent identity (0–100, white to blue). Sequences on both axes are ordered based on hierarchical clustering from Figure 2. Color coding for TRP channels (left) and for side-chain character in selectivity filter sequences are from Figure 4—figure supplement 1.
Figure 5—figure supplement 2
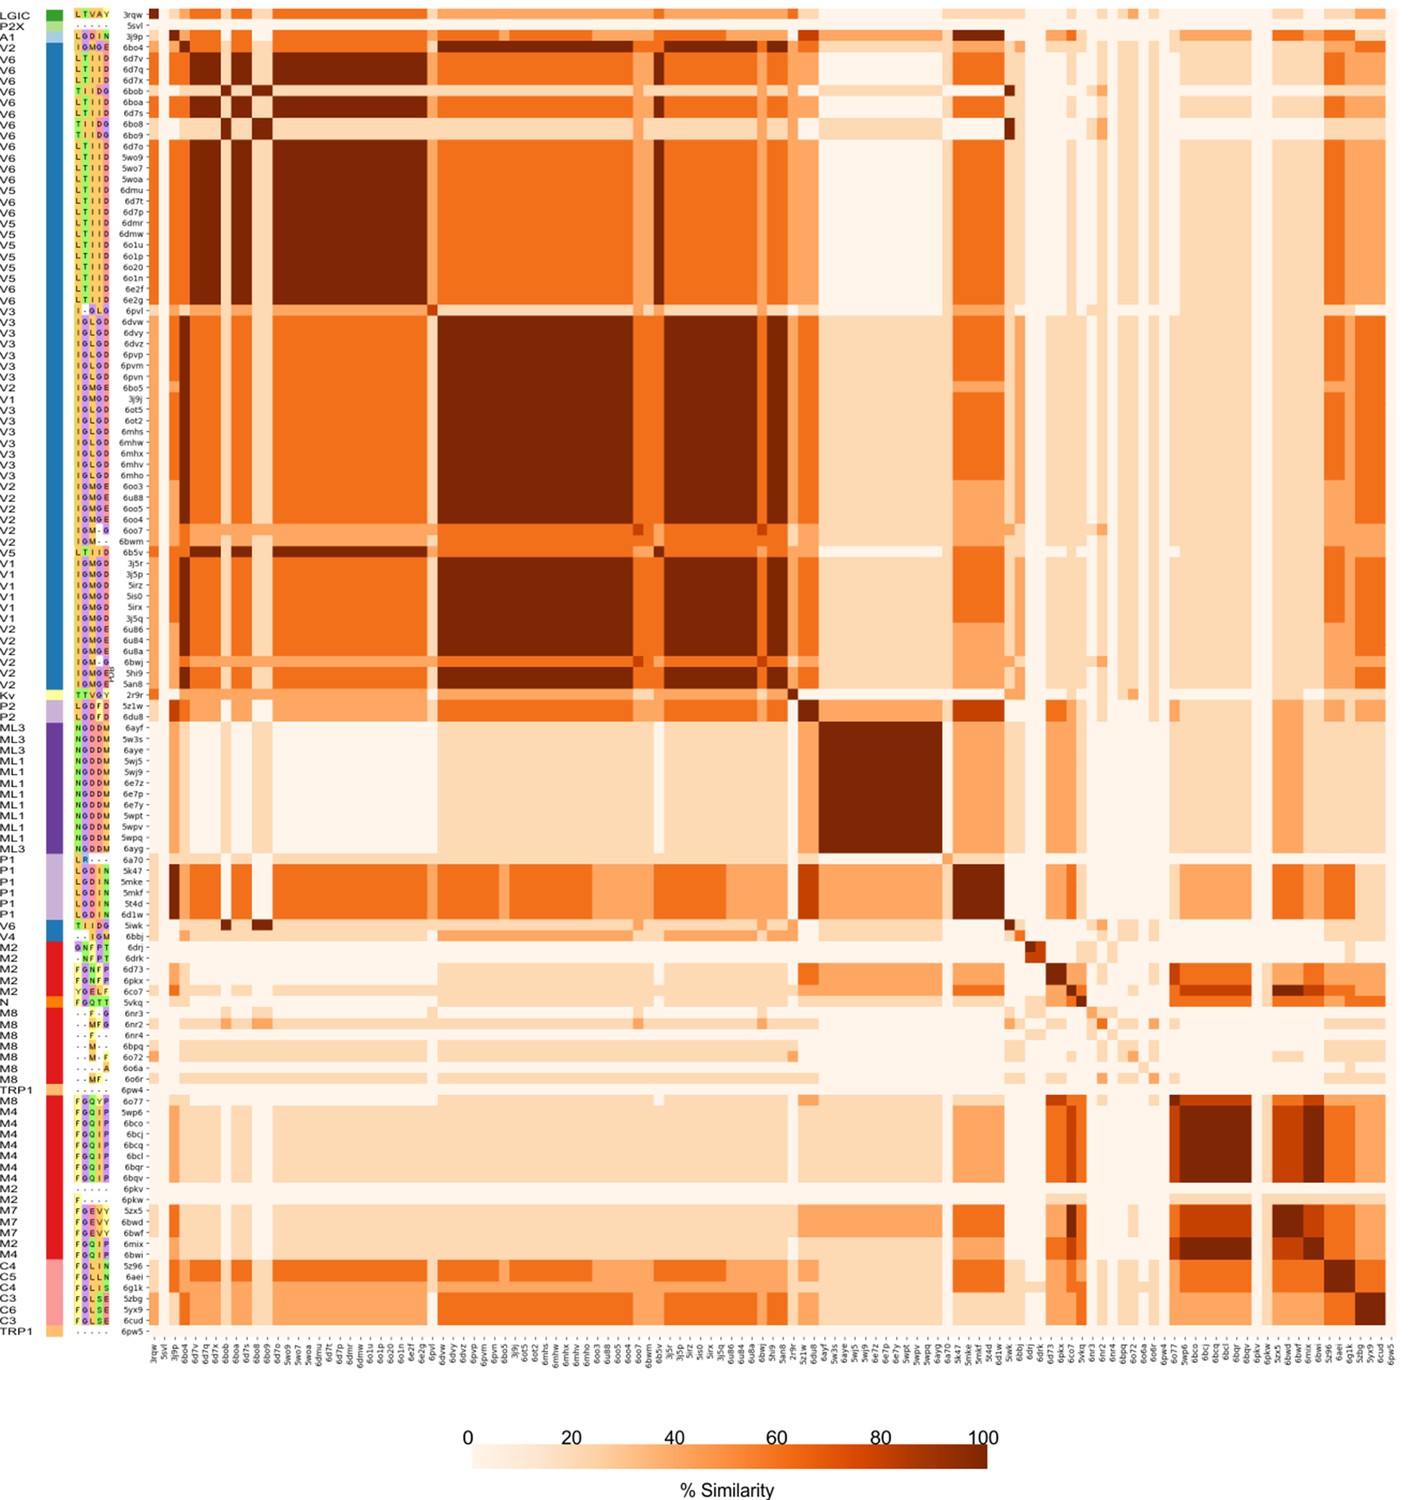
Heatmap comparing selectivity filter similarity in TRP channels.
Selectivity filters highlighted in Figure 4—figure supplement 1 were compared pairwise for all TRP channel structures to calculate percent similarity (0–100, white to orange). Sequences on both axes are ordered based on hierarchical clustering from Figure 2. Color coding for TRP channels (left) and for side-chain character in selectivity filter sequences are from Figure 4—figure supplement 1.
Figure 6 with 2 supplements
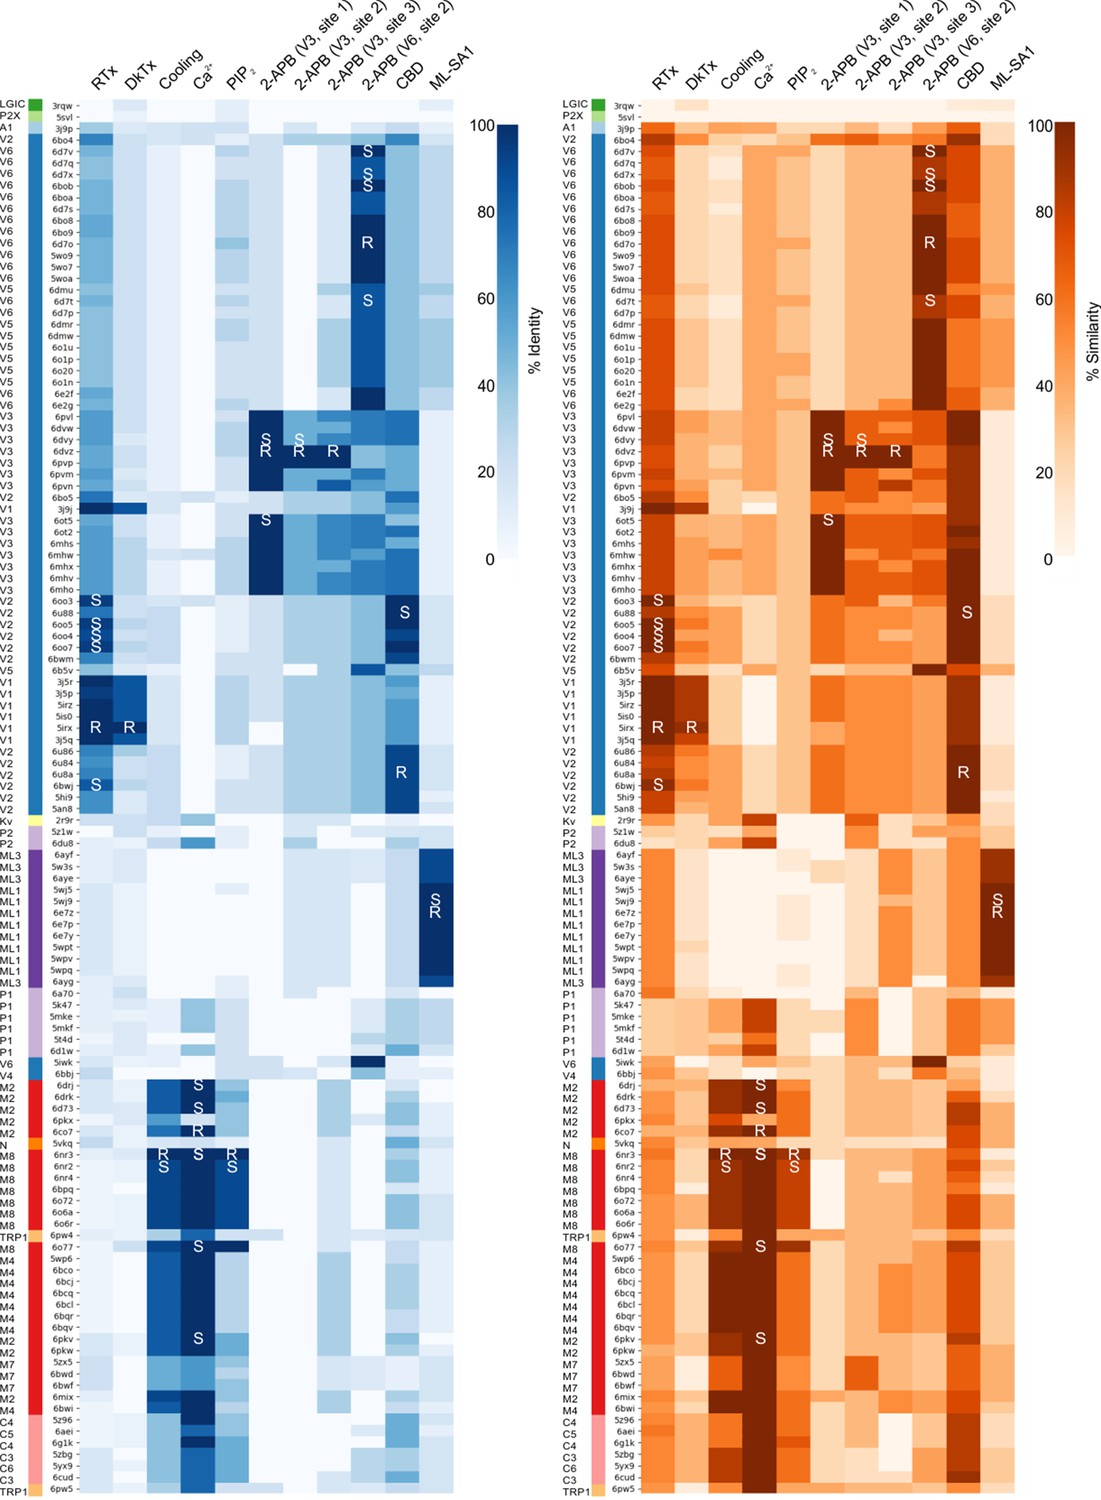
Heatmaps comparing ligand binding pocket motifs in TRP channels.
Ligand-binding motifs were identified as including any residues with a side chain within 4 Å of the ligand. Heatmaps comparing the ligand-binding motifs in all structures based on percent identity (0–100, white to blue) or similarity (0–100, white to orange) when compared to the reference ligand-binding motif indicated with the letter R. Additional structures in which the ligand is also found are indicated with S (for secondary). Ligand-protein interactions are shown in Figure 7, Figure 8, Figure 9, and Figure 9—figure supplement 1. Sequences are ordered based on hierarchical clustering from Figure 2. Color code for TRP channels is from Figure 2.
-
Figure 6—source data 1
Ligand motif identity heatmap data.
- https://cdn.elifesciences.org/articles/58660/elife-58660-fig6-data1-v1.csv
-
Figure 6—source data 2
Ligand motif similarity heatmap data.
- https://cdn.elifesciences.org/articles/58660/elife-58660-fig6-data2-v1.csv
Figure 6—figure supplement 1
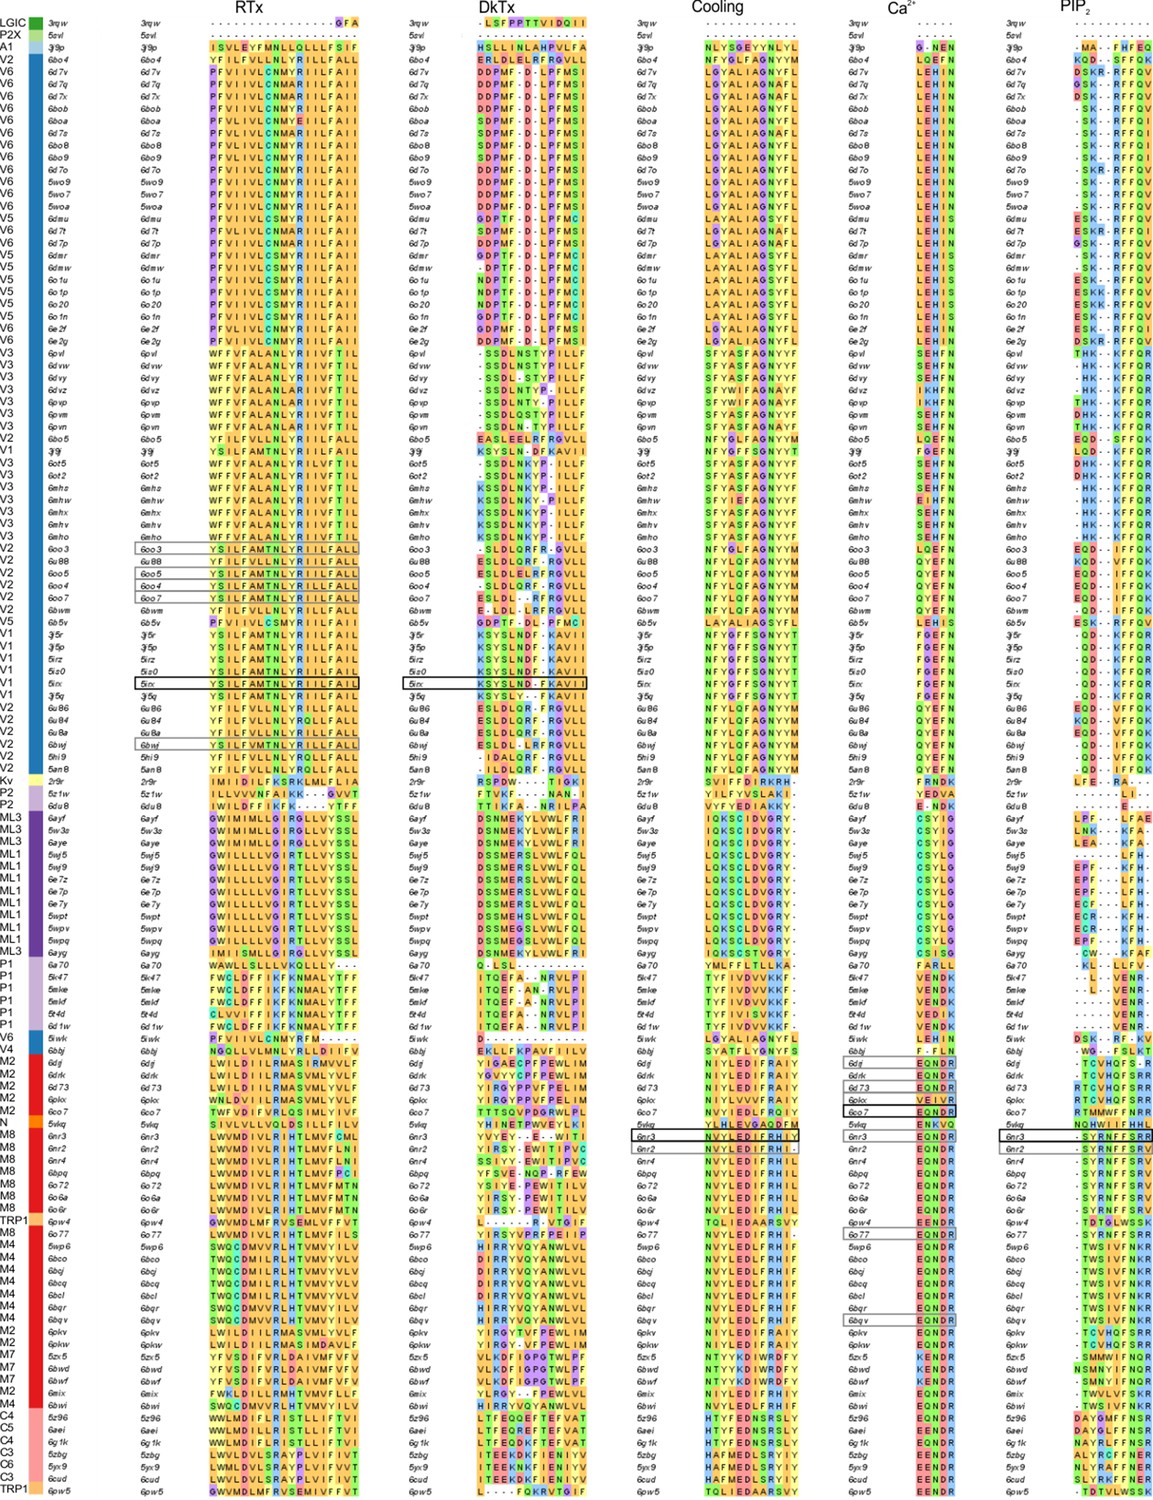
Multiple sequence alignments for ligand-binding pocket motifs in TRP channels.
Ligand-binding motifs were identified as including any residues with a side chain within 4 Å of the ligand. Equivalent ligand-binding motifs for each structure identified based on alignment with the ligand-binding motif from the parent ligand-bound structure. The reference ligand-bound structures are highlighted with black boxes, and secondary ligand-bound structures are highlighted with grey boxes. Ligand binding locations are shown in Figure 7 and Figure 8. Sequences are ordered based on hierarchical clustering from Figure 2. Color coding for TRP channels (left) and for side-chain character are from Figure 4—figure supplement 1.
Figure 6—figure supplement 2
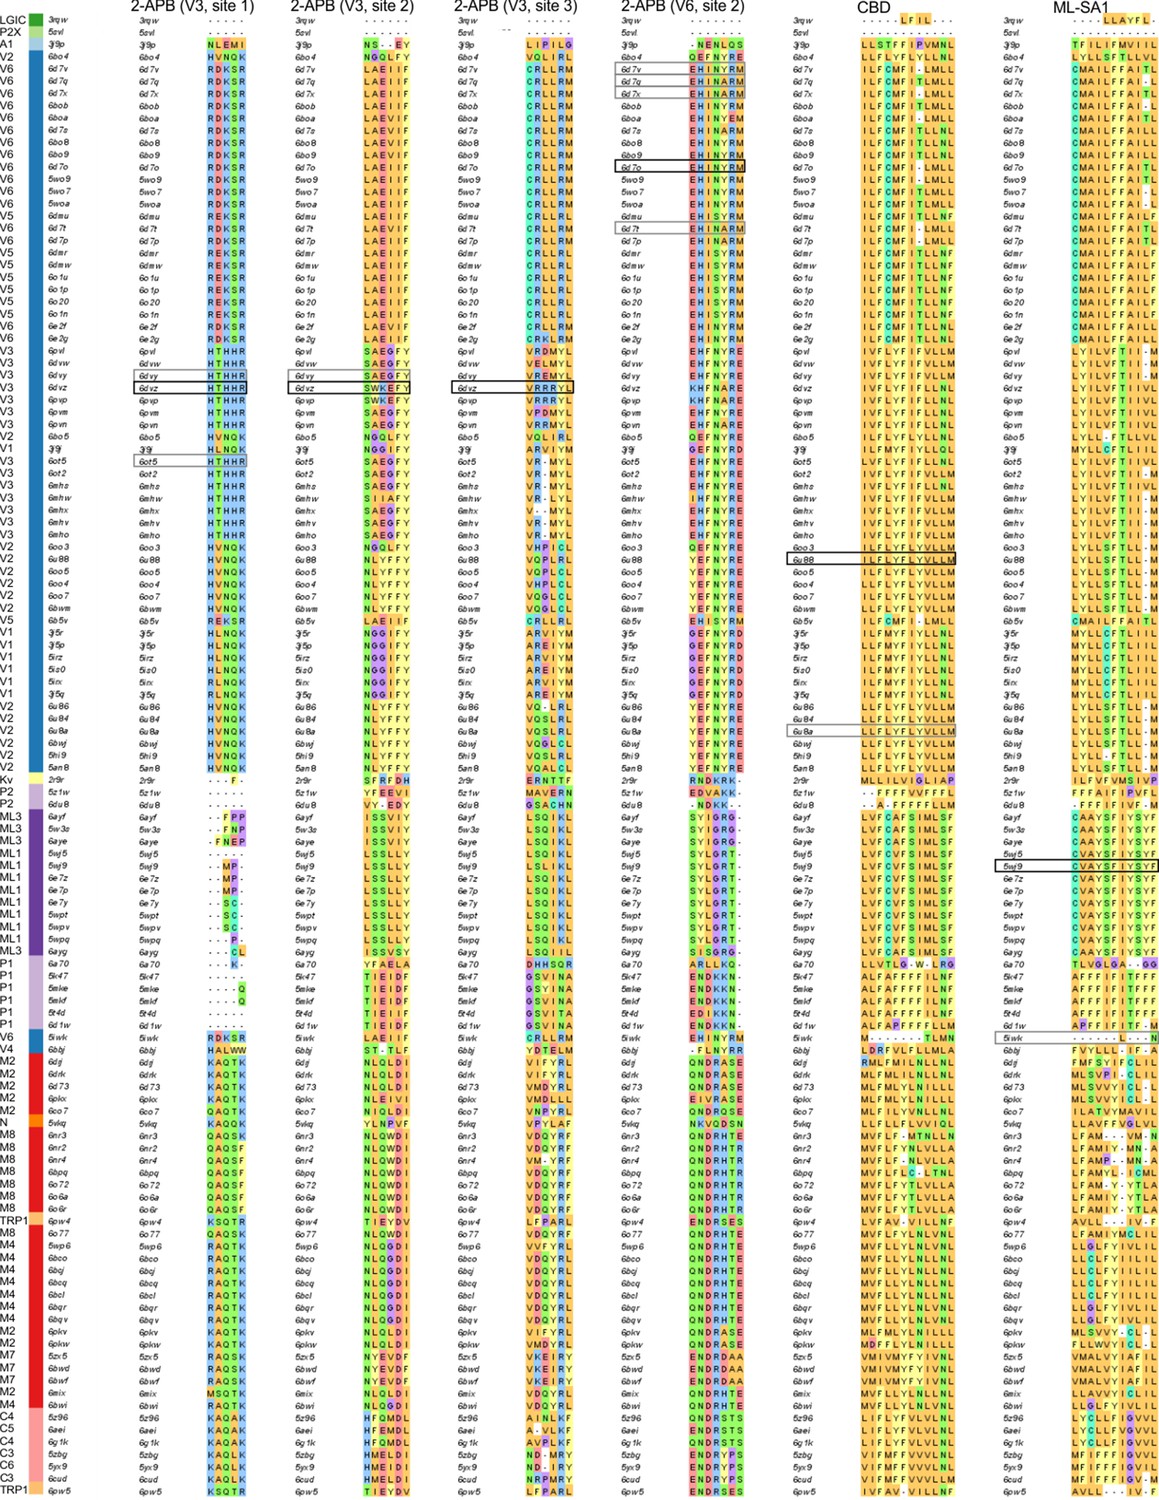
Multiple sequence alignments for ligand binding pocket motifs in TRP channels.
Equivalent ligand-binding motifs for each structure identified based on alignment with the ligand-binding motif from the parent ligand-bound structure. The reference ligand-bound structures are highlighted with black boxes, and secondary ligand-bound structures are highlighted with grey boxes. Ligand binding locations are shown in Figure 9 and Figure 9—figure supplement 1. Sequences are ordered based on hierarchical clustering from Figure 2. Color coding for TRP channels (left) and for side-chain character are from Figure 4—figure supplement 1.
Figure 7
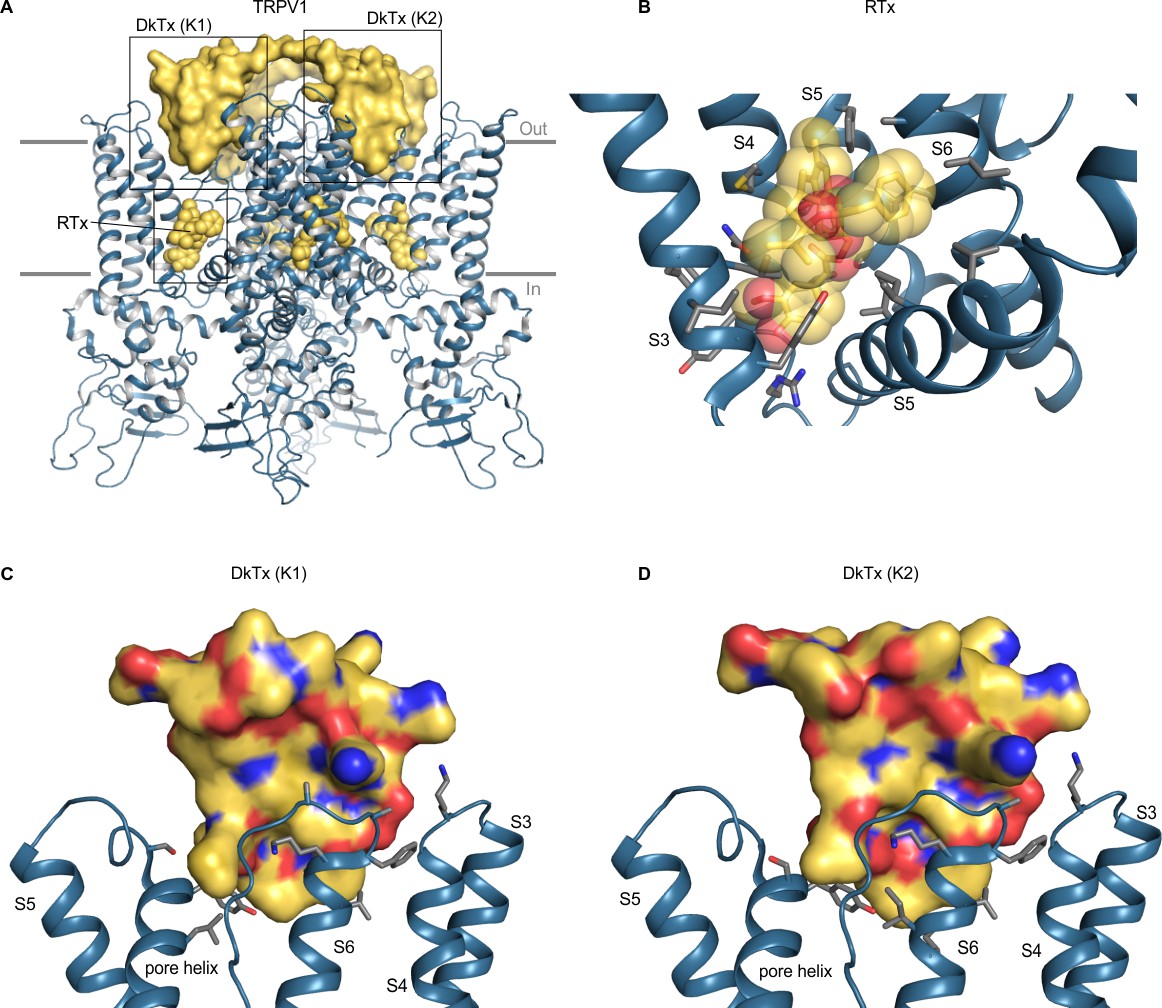
Structure of TRPV1 with RTx and DkTx bound.
(A) Structure of TRPV1 in nanodiscs with RTx and DkTx shown as yellow spheres and yellow surface, respectively (5irx). (B) Close-up view of the RTx binding pocket with side chains colored by atom: carbon (gray), oxygen (red) and nitrogen (blue). (C,D) Close-up views of the DkTx binding surface showing either K1 or K2 knots, with linker omitted and side chain coloring as in B. Views are from the central pore axis looking out toward the lipid membrane. For clarity, helices without binding pocket residues have been hidden in panels B-D.
Figure 8
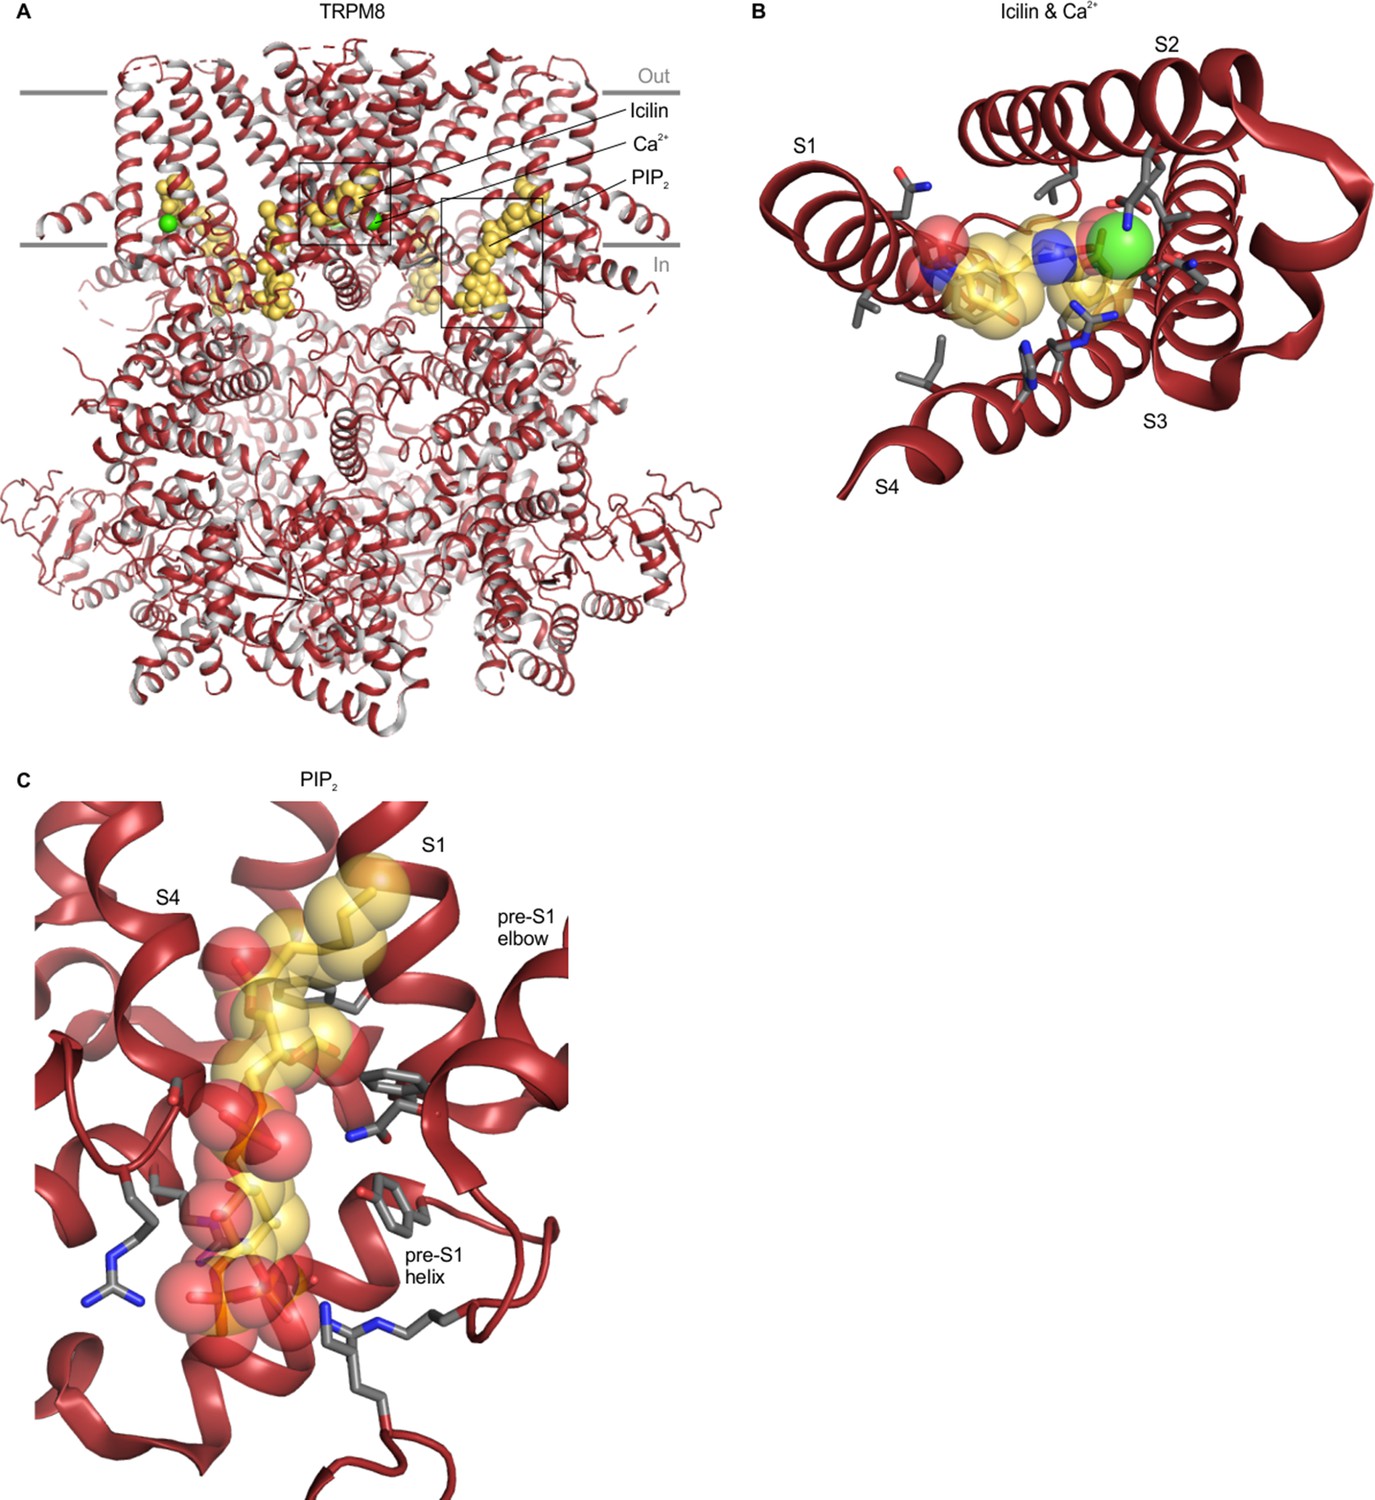
Structure of TRPM8 with icilin, Ca2+ and PIP2 bound.
(A) Structure of TRPM8 with icilin, Ca2+ and PIP2 bound (6nr3), with yellow spheres for ligands and green spheres for Ca2+. (B) Close-up view of the icilin and Ca2+ binding site from the intracellular side of the membrane with side chains colored by atom: carbon (gray), oxygen (red) and nitrogen (blue). The TRP helix has been removed for clarity. (C) Close-up views of the PIP2 binding site, with side chain coloring as in B. For clarity, helices without binding pocket residues have been hidden in panels B and C.
Figure 9 with 1 supplement
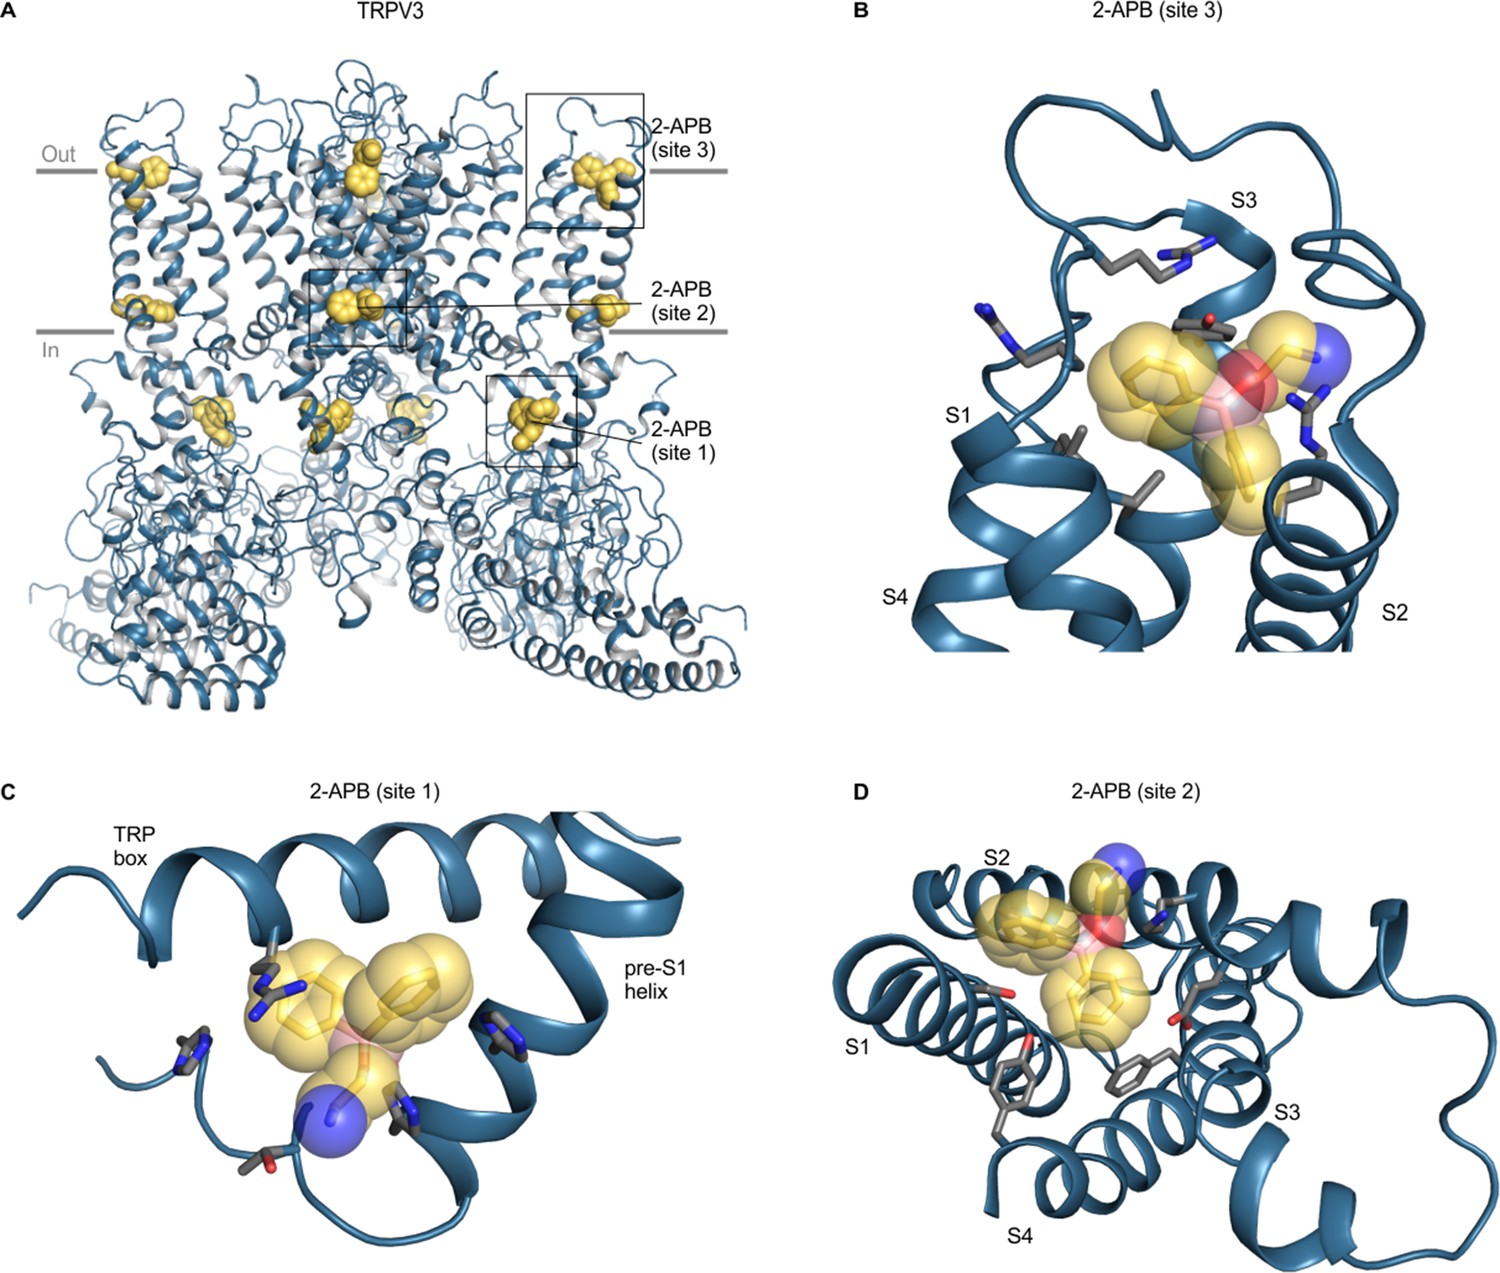
Structure of TRPV3 with 2-APB bound.
(A) Structure of 2-APB bound TRPV3 (6dvz), with ligands shown as yellow spheres. (B–D) Close-up views of the three 2-APB-binding sites with side chains colored by atom: carbon (gray), oxygen (red) and nitrogen (blue). Boron atoms in 2-APB are colored in pink. Close-up in D is shown from the intracellular side of the membrane from same point of view as Figure 8B. For clarity, helices without binding pocket residues have been hidden in panels B-D.
Figure 9—figure supplement 1
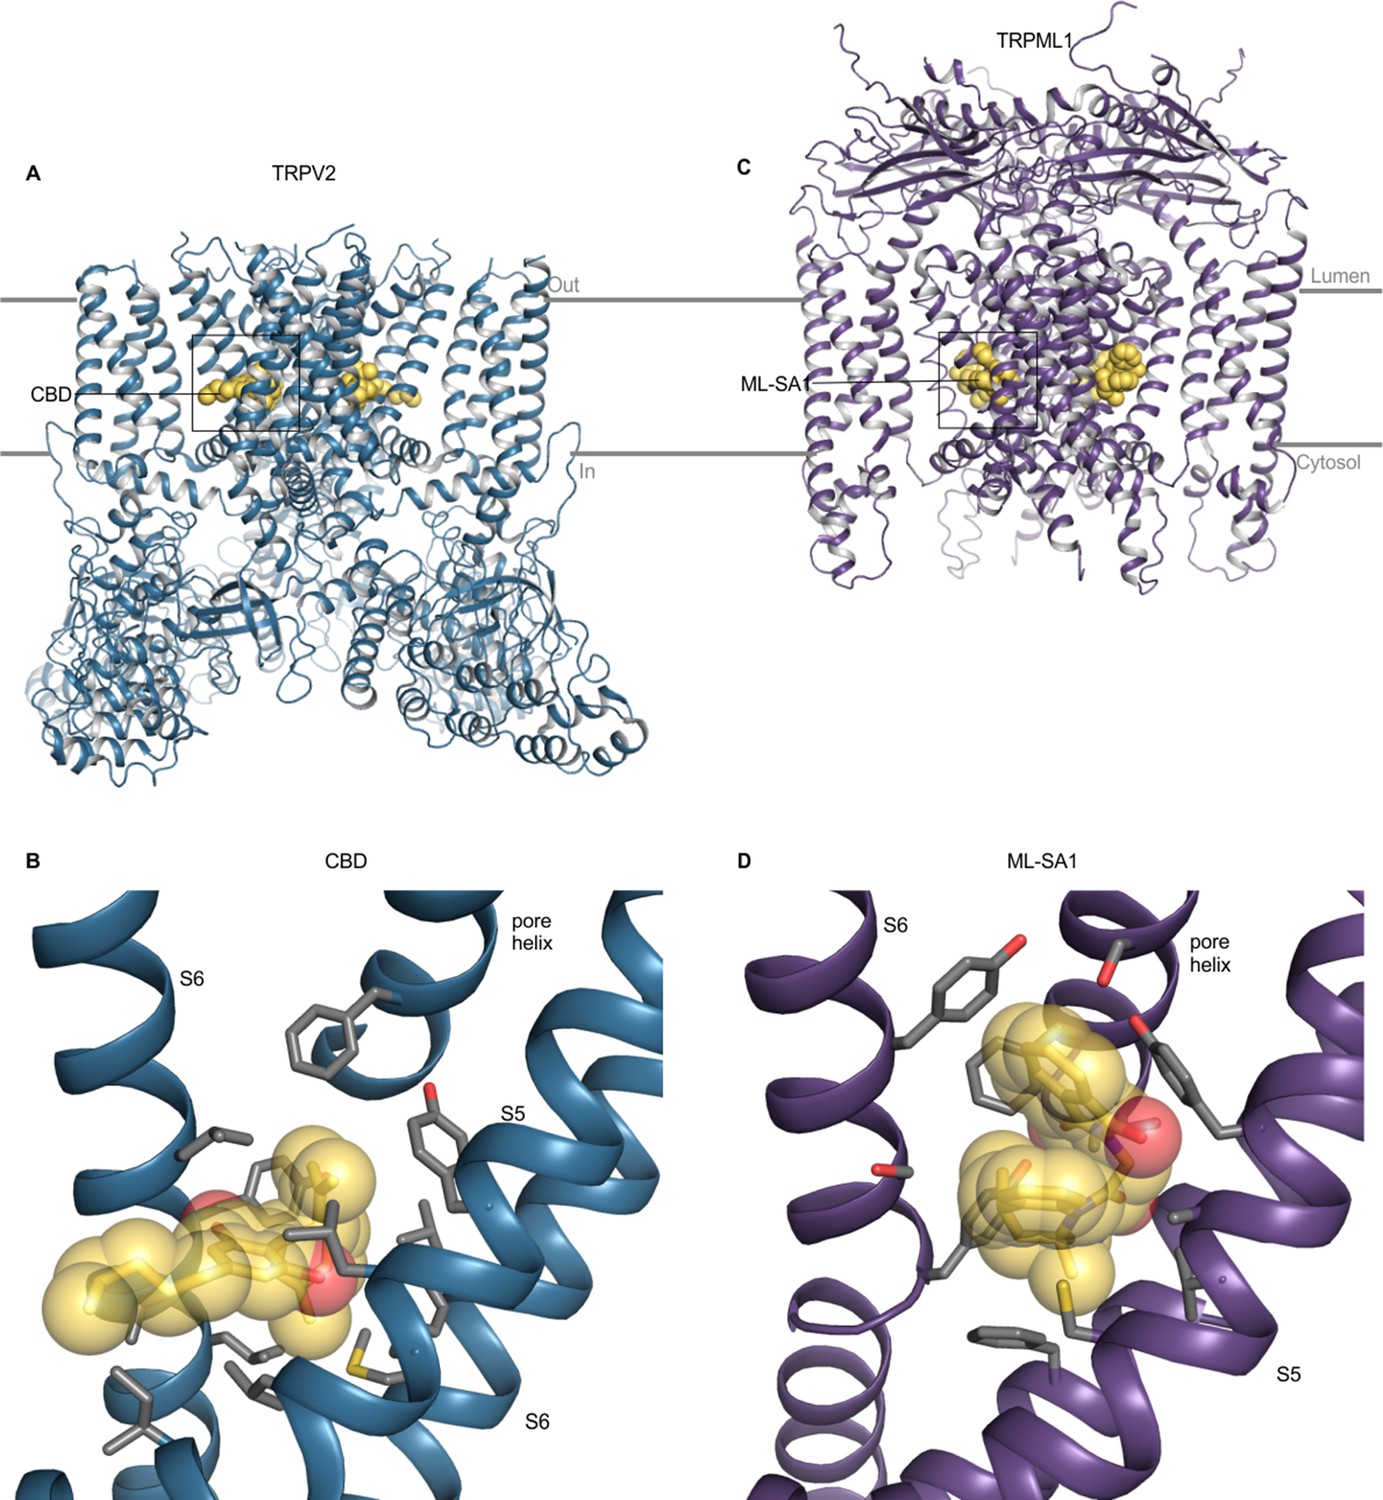
Ligand-binding sites in TRPV2 and TRPML1.
(A) Structure of TRPV2 with CBD bound (6u88), with ligands shown as yellow spheres. (B) Close-up view of the CBD-binding site with side chains colored by atom: carbon (gray) and oxygen (red). For clarity, helices without binding pocket residues have been hidden. (C) Structure of TRPML1 with ML-SA1 bound (5wj9), with carbon (yellow) and oxygen (red). (D) Close-up view of the ML-SA1 binding site with side chains colored by atom: carbon (gray) and oxygen (red). For clarity, helices without binding pocket residues have been hidden. Panels B and D are from same point of view.
Figure 10 with 1 supplement
Alternate helical conformations with the TM segments of TRP channels.
Structure-based sequence alignment, with residues colored based on secondary structure assigned by the DSSP algorithm. Sequences are ordered based on hierarchical clustering from Figure 2. Segments, including TM helices and other regions identified in Figure 1F, are labeled based on α-helicity consensus. PH stands for pore helix.
-
Figure 10—source data 1
Data file for S6 radius and consecutive S6 π helices scatterplot.
- https://cdn.elifesciences.org/articles/58660/elife-58660-fig10-data1-v1.csv
Figure 10—figure supplement 1
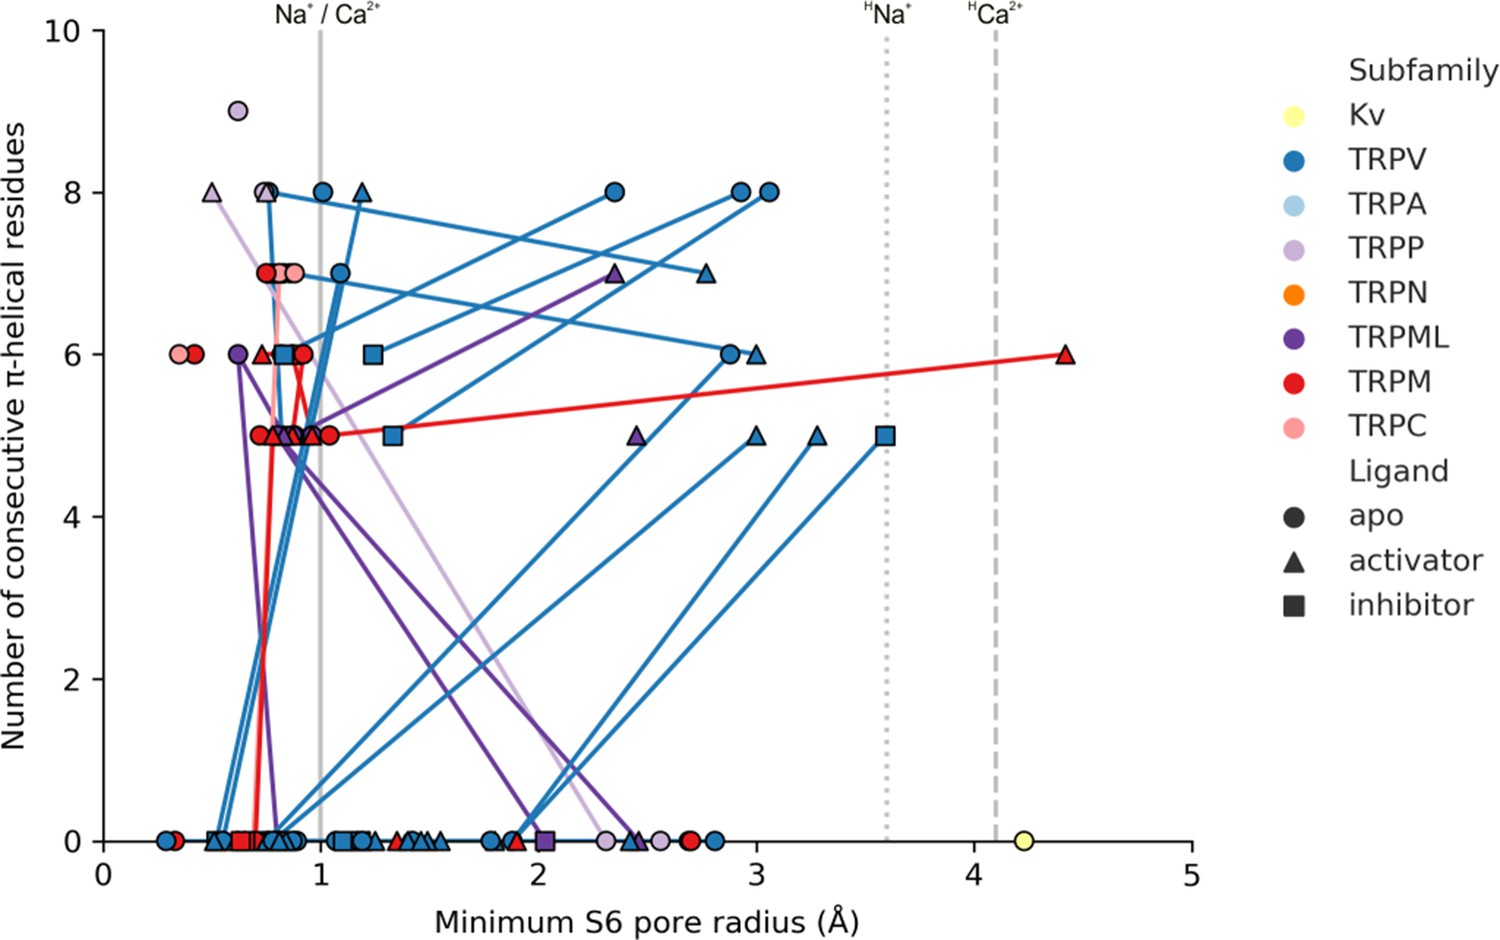
Relationships between alternate helix conformations and the radius of the internal pore in TRP channels.
Plot of the number of consecutive residues in S6 that are identified as π-helical by the DSSP algorithm against the minimal internal pore radius. Each marker represents one structure. Markers that represent the same channel determined under different conditions to obtain different conformations are connected with lines. Grey lines represent radii of dehydrated Na+ and Ca2+ ions (solid), hydrated Na+ (dotted, HNa+) and hydrated Ca2+ ions (dashed, HCa2+).
Additional files
Download links
A two-part list of links to download the article, or parts of the article, in various formats.
Downloads (link to download the article as PDF)
Open citations (links to open the citations from this article in various online reference manager services)
Cite this article (links to download the citations from this article in formats compatible with various reference manager tools)
Global alignment and assessment of TRP channel transmembrane domain structures to explore functional mechanisms
eLife 9:e58660.
https://doi.org/10.7554/eLife.58660


