Unbiased homeologous recombination during pneumococcal transformation allows for multiple chromosomal integration events
- Department of Fundamental Microbiology, Faculty of Biology and Medicine, University of Lausanne, Switzerland
- Laboratoire de Microbiologie et Génétique Moléculaires (LMGM), Centre de Biologie Intégrative (CBI), France
Figures
Figure 1
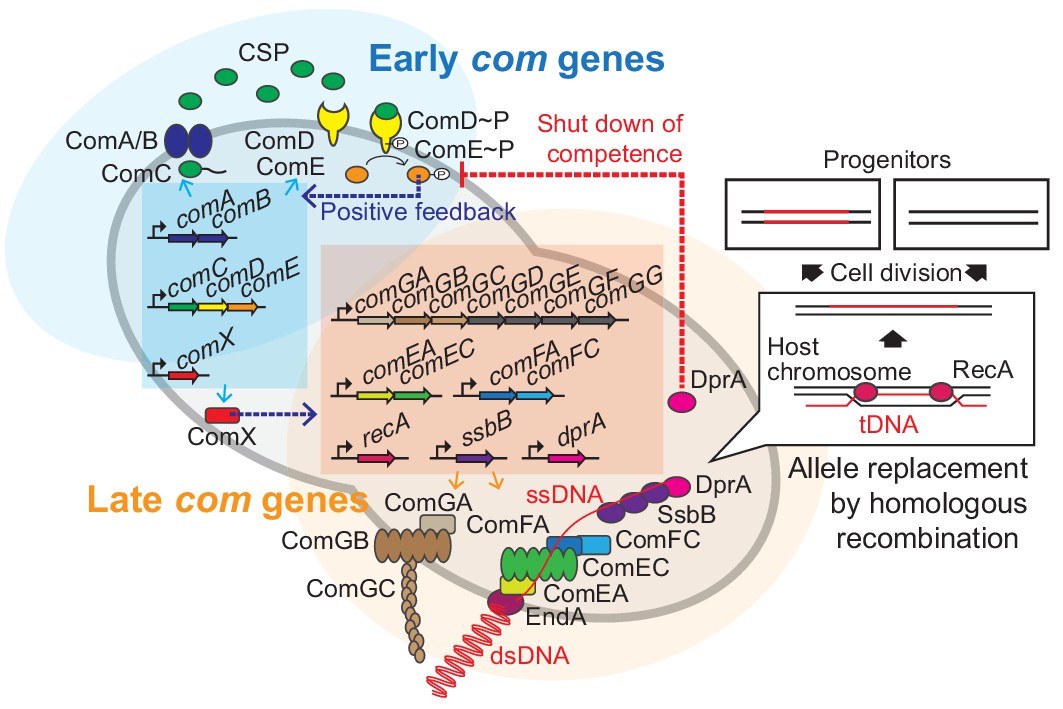
Regulation of pneumococcal competence and transformation.
Schematic overview showing representative competence-related genes involved in pneumococcal transformation. Competence development is initiated by activation of the early com genes (shown in blue area). ComAB exports ComC and processes it into the competence stimulating peptide (CSP). The two-component system ComDE recognizes CSP and positively regulates the early com genes. Subsequently, the alternative sigma factor ComX, activates late com gene expression (shown in orange area). ComGA, GB, and GC are assembled to form the DNA-binding pilus. EndA is the endonuclease that cleaves dsDNA into ssDNA. ComEA, ComEC, ComFA, and ComFC form the ssDNA uptake channel. Internalized foreign ssDNA is protected by SsbB and DprA. DprA ensures the loading of RecA on single strand tDNA to form a presynaptic filament and the resulting DNA scanning complex is capable of homologous (or homeologous) recombination with the recipient chromosome.
Figure 2 with 2 supplements

Single-cell analysis of competence activation and DNA binding.
(A) Kinetics of bacterial growth and competence development. Growth curves (top) and OD-normalized bioluminescence activity (bottom) of strain DLA3 (PssbB-luc) in the presence (orange) or absence (gray) of CSP. Arrow indicates the moment after addition of CSP (0 min). Lines and confidence bands represent means of three replicates and SD, respectively. (B) Single- cell imaging of fluorescence competence reporter cells. VL2219 (PssbB-msfYFP) was treated with (top, gray frame) or without (bottom, orange frame) CSP for 20 min and analyzed by fluorescence microscopy. Images are overlays of phase contrast and YFP signal. Scale bar: 20 μm. (C) Quantification of the imaging. Scatter plots of single-cell YFP signal intensity (y axis) against cell length (x axis), based on microscopy images. Red line indicates the threshold used to score YFP positive cells. Proportion of positive cells (%) is shown. (D) Quantification of cells expressing the transformation machinery. Fluorescence signal intensity for indicated strain harboring comGA-msfYFP (VL2536), msfYFP-comEA (VL2537), comFA-msfYFP (VL2538) or dprA-msfYFP (VL3355) treated with (orange) or without (gray) CSP for 20 min. Red line indicates threshold for YFP positive cells. Proportion of positive cells (%) is shown. (E) Correlation between competence activation and ComGA production. VL2536 (comGA-msfYFP, PssbB_mScarlet-I) was incubated with or without CSP. Scatter plot of single-cell YFP signal intensity (translational fusion of ComGA) against mScarlet-I signal (transcriptional fusion to ssbB). Red line indicates threshold used. Proportion of positive cells (%) is shown on each plot. (F and G) DNA-binding analysis using Cy3-labeled DNA added to induced- or spontaneous competent cells. (f) Representative image of Cy3-labeled DNA-bound TD290 (ssbB_luc, ∆endA) cells. Scale bar: 2 μm. (G) Quantification of microscopy images of Cy3-labeled DNA-bound D39V cells. Bacteria were treated with CSP for 20 min to induce competence in C+Y (pH 7.9). Efficiency of spontaneous competent cells (no CSP) is also represented. Total of 6027 cells (without added CSP) and 3082 cells (with CSP) were collected over three independent experiments.
Figure 2—figure supplement 1
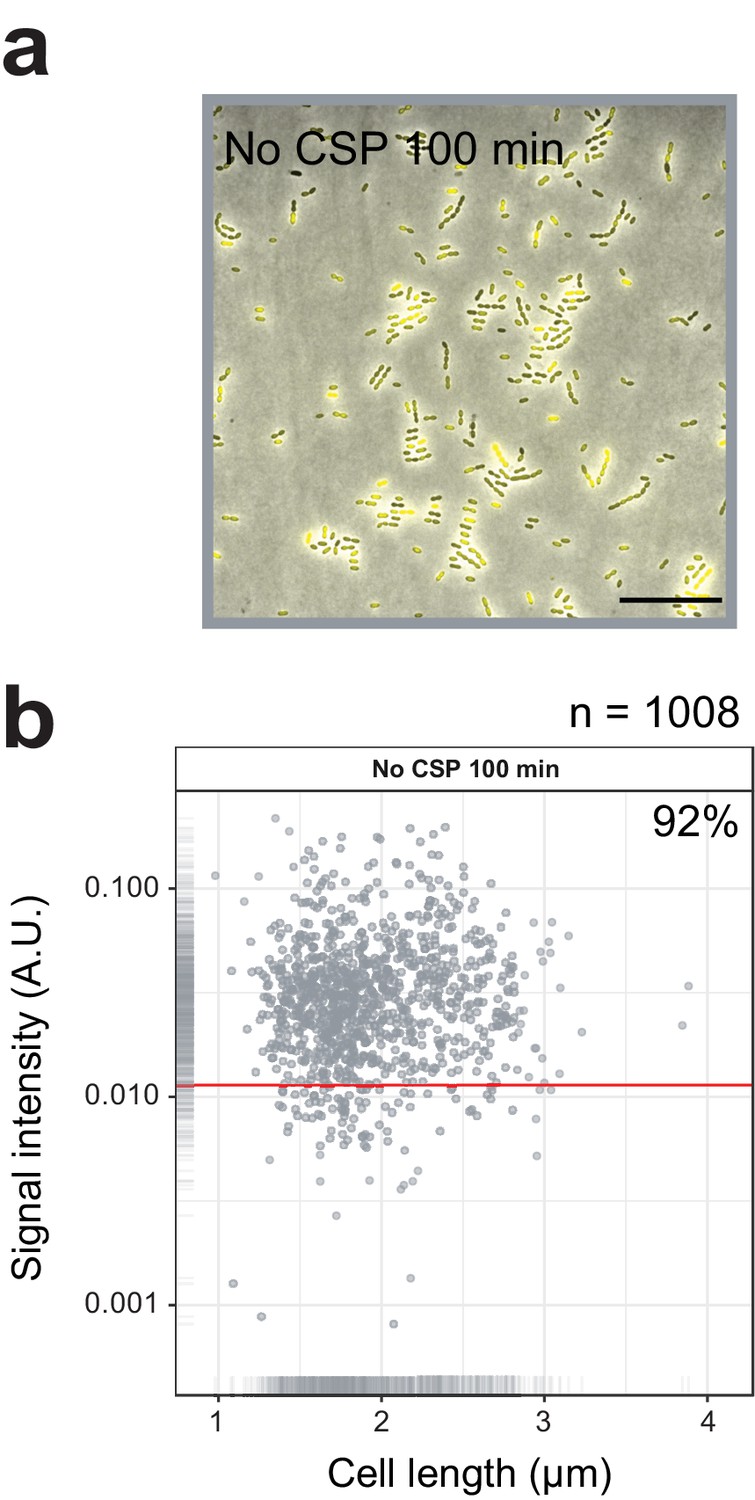
Single cell quantification of spontaneously activated competence.
(A) Competence reporter strain VL2219 (cytoplasmic msfYFP reporter of transcriptional fusion to ssbB) was incubated in C+Y in the absence of CSP. After 100 min (peak of spontaneous competence, see Figure 2A), the cells were analyzed by fluorescence microscopy. Images are overlays of phase contrast and YFP signal. Scale bar, 20 µm. (B) Quantification of competence positive cells. Scatter plot of single-cell YFP signal intensity (y axis) against cell length (x axis), based on microscope images shown in panel a. Red line indicates threshold used to score YFP positive cells. Proportion of positive cells (%) is shown.
Figure 2—figure supplement 2
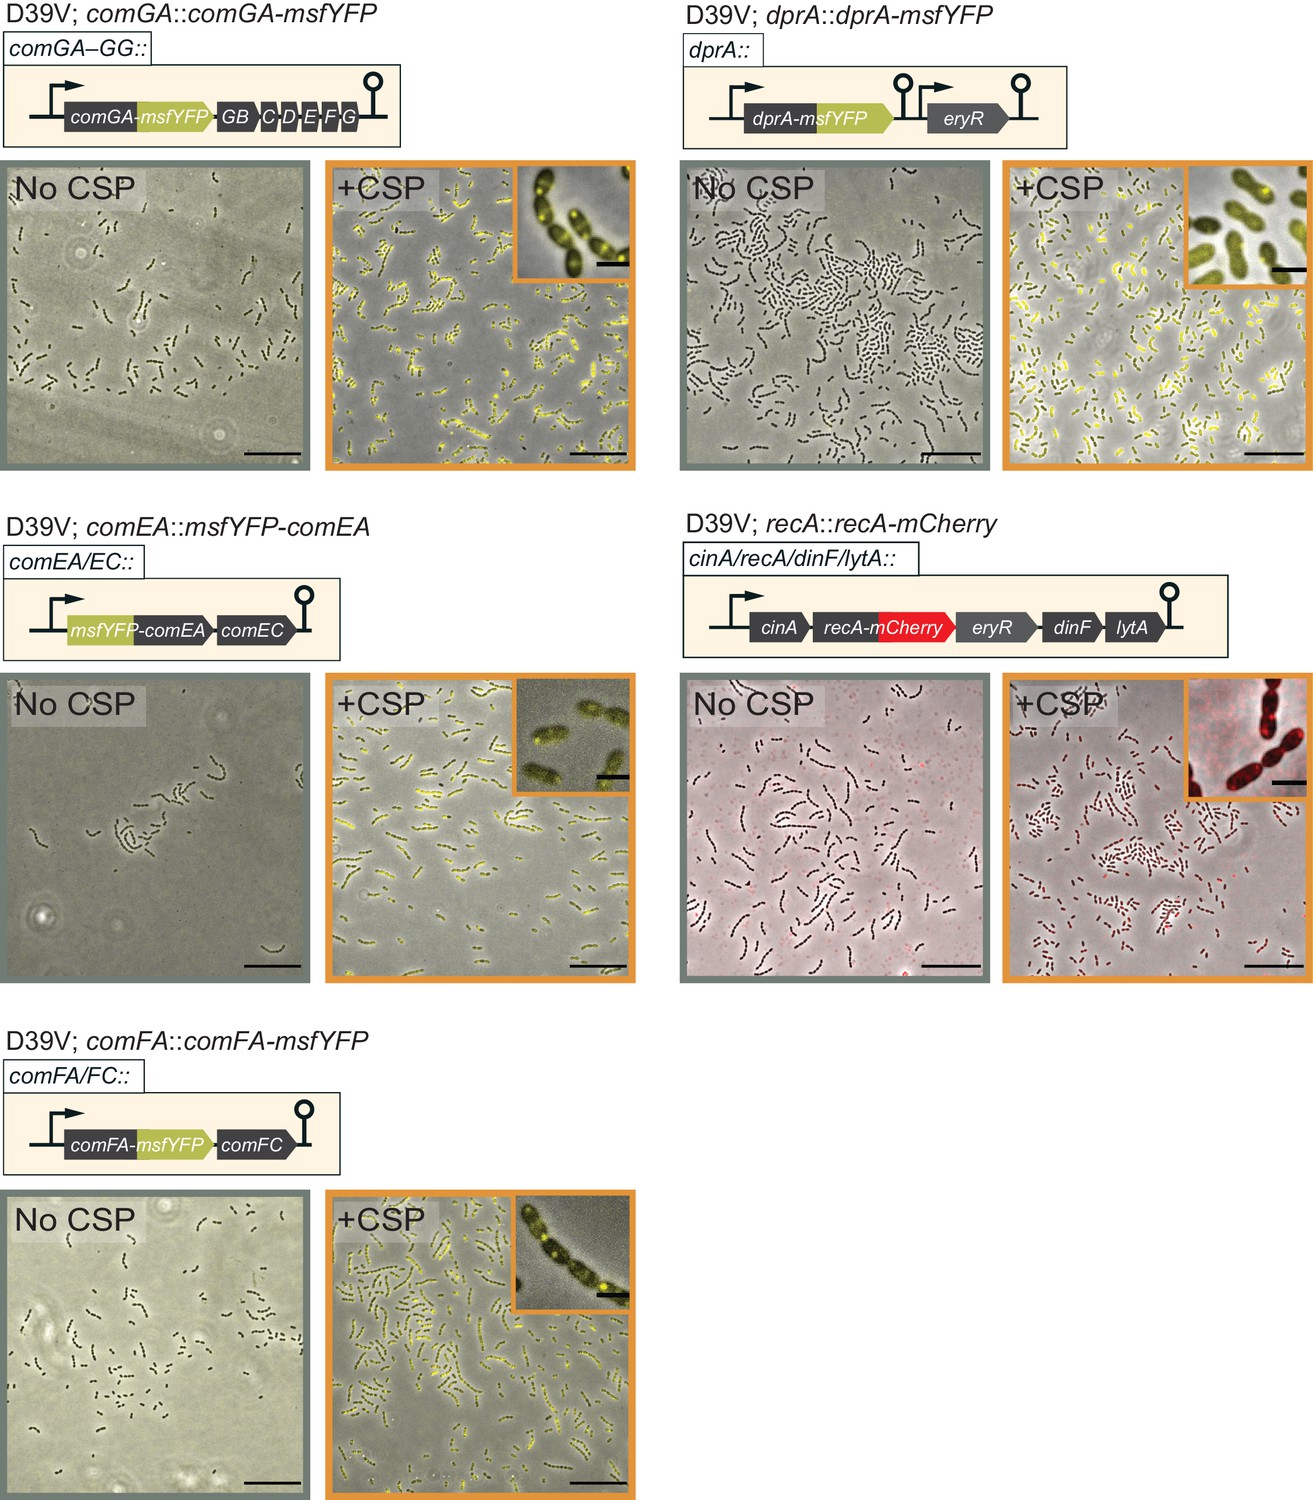
Fluorescence microscopy images of VL2536 (msfYFP-comEA), VL2537 (comFA-msfYFP), VL2538 (comGA-msfYFP), VL3355 (dprA::dprA-msfYFP), and VL361 (recA::recA-mCherry) treated with (orange frame) or without (gray frame) CSP for 20 min.
Images are overlays of phase contrast and YFP signal. Scale bar, 20 µm. Magnified images of induced condition are also shown in the inset. Scale bar, 2 µm.
Figure 3 with 4 supplements
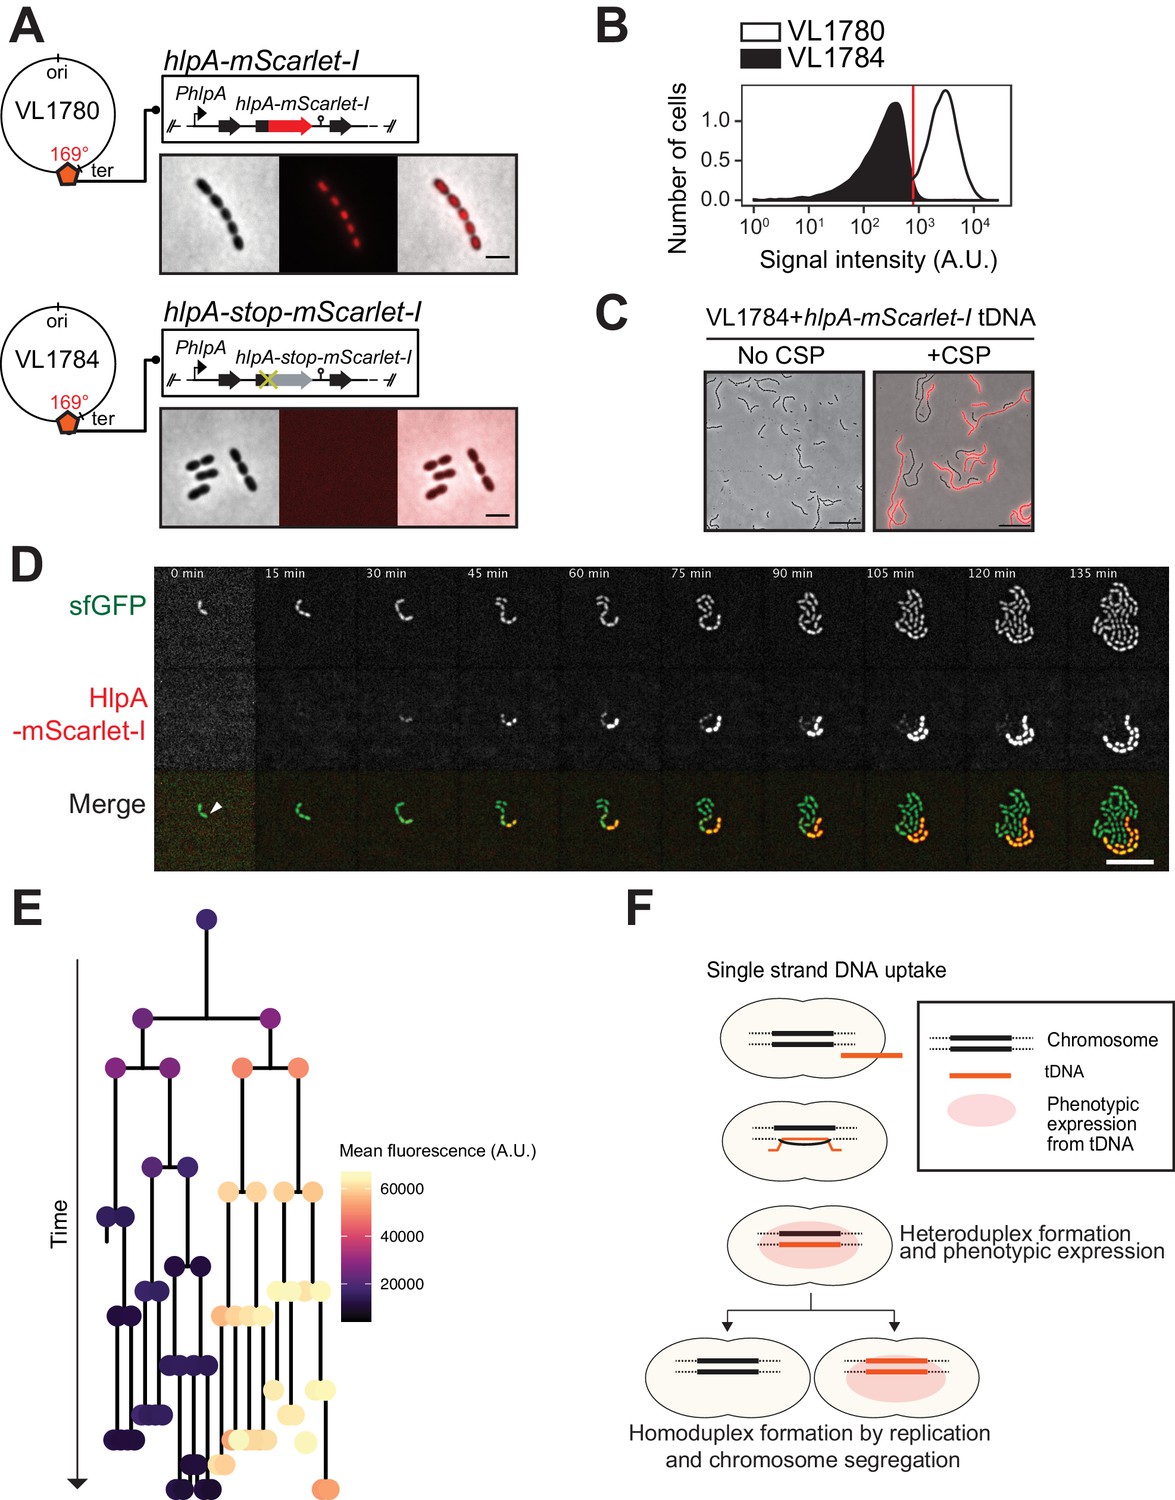
Development of a fluorescence-based real-time reporter for genetic transformation in S. pneumoniae.
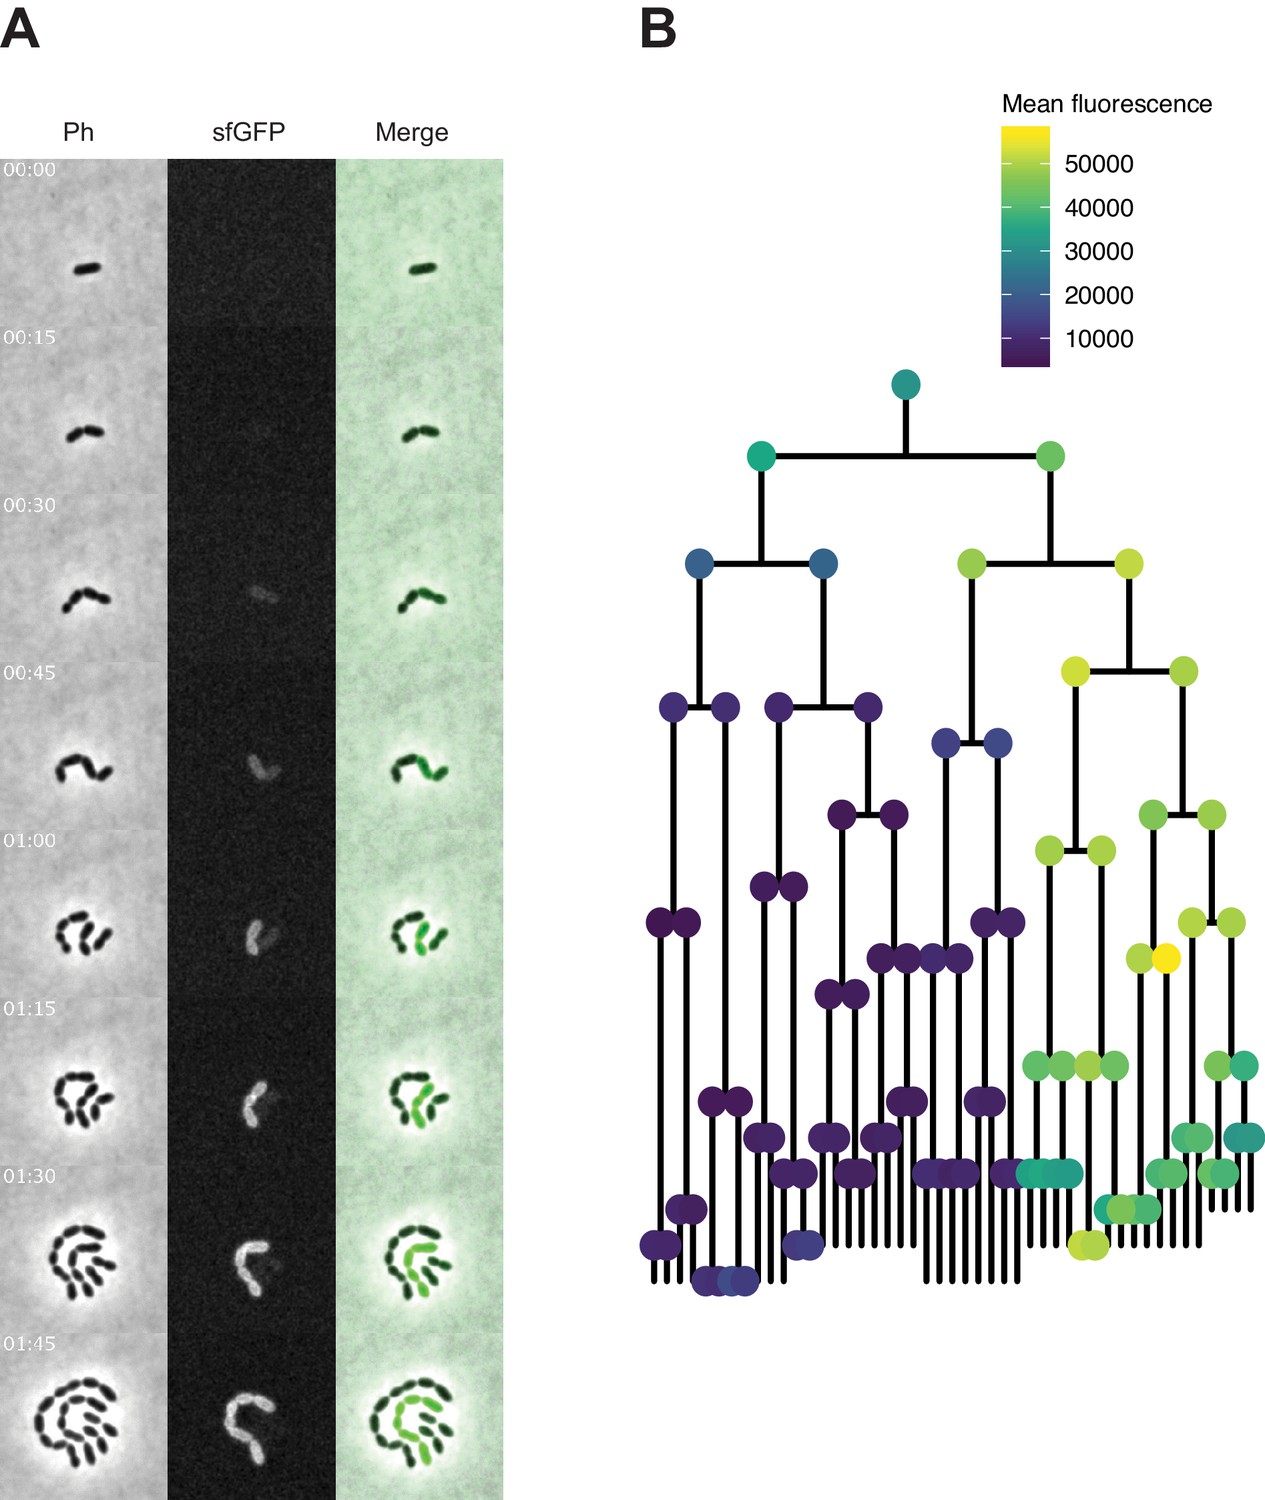
(A) Schematic representation of the reporter system. hlpA-mScarlet-I was inserted downstream of the native hlpA locus as a second copy (strain VL1780), resulting in red-fluorescently marked nucleoids as shown by fluorescence microscopy (Left: phase contrast, middle: red fluorescence, right: overlay, scale bar: 4 μm). A single nucleotide mutation generating a stop codon was introduced in the linker sequence between hlpA and mScarlet-I, resulting in non-fluorescent strain VL1784 (hlpA-stop-mScarlet-I). (B) Flow-cytometry measurement of hlpA-mScarlet-I signal of VL1780 (hlpA-mScarlet-I, white) and VL1784 (hlpA-stop-mScarlet-I, gray). (C) CSP-treated (right) or untreated (left) VL1784 was provided with tDNA (hlpA-mScarlet-I) and analyzed by fluorescence microscopy after 4 hr of incubation. Scale bar, 20 µm. (D) Time-lapse visualization of transformation with hlpA-mScarlet-I in VL1832 (VL1784+constitutively expressing cytoplasmic sfGFP). VL1832 was treated with CSP for 10 min, tDNA added (hlpA-mScarlet-I) for 10 min, and then spotted on C+Y agarose pad to start time-lapse imaging with a 5-min interval. Signal of constitutively expressed cytoplasmic sfGFP (top, green in the overlay) was used for cell segmentation in image analysis. Successfully transformed cells were detected by expression of HlpA-mScarlet-I (middle, red in the overlay). Scale bar, 10 µm. Also see Video 1. (E) Cell lineage tree with superimposed fluorescence intensity was built based on the time-lapse image shown in E. The quantified mean mScarlet-I signal intensity of each cell during its cell cycle was plotted as a color-coded dot onto the lineage tree with each dot corresponding to the moment of ‘birth’. Note that the tree represents the lineage from only one of the two progenitor cells (indicated by white arrow in panel d). (F) Working model for DNA integration and chromosomal segregation of the transformed allele. tDNA is internalized as ssDNA, and recombines to replace one strand on the host chromosome forming a hetero-duplex after recombination. Following chromosomal replication and segregation, the two daughter cells have distinct homo-duplexes (either the original allele or the tDNA allele). Note that initial hetero-duplex formation might permit for phenotypic expression from the newly acquired allele if the noncoding strand is replaced by tDNA (see main text).
Figure 3—figure supplement 1
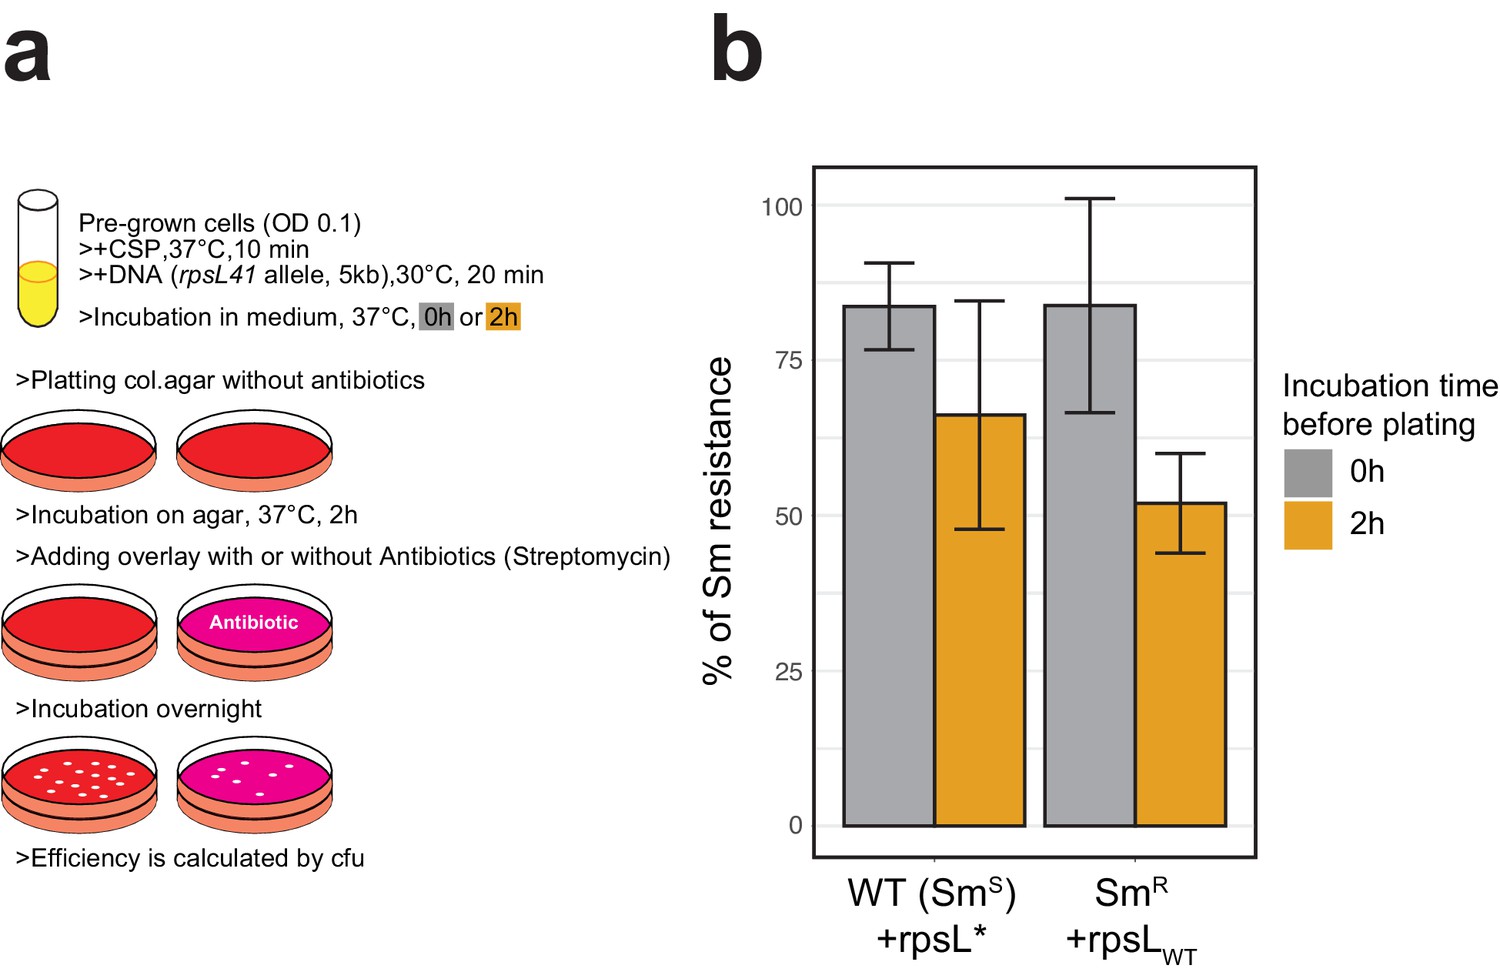
Classical methodology for transformation frequency estimation by antibiotics selection.
(A) Workflow representation of the experiment. D39V wild-type (Sm susceptible) or its rpsL mutant derivative (Sm-resistant) were treated with synthetic CSP and transformed with Sm resistance (rpsL*) or Sm susceptible (rpsLWT) of rpsL allele, respectively (5 kb, SNP in the middle, 3.2 nM of DNA). With or without additional incubation for 2 hr in liquid C+Y medium, then serially diluted bacterial suspensions were plated onto two Columbia agar plates for each. For phenotypic expression, agar plates were incubated 2 hr in 37°C and then overlaid with additional Columbia agar containing streptomycin or no antibiotics, followed by over-night incubation. Colony forming units (cfu) were counted for each plate and the ratio of Sm resistant cfu (on +Sm plate) divided by total cfu (on plate without antibiotic) was calculated to evaluate the transformation frequency. (B) Histogram represents mean and SD (from three replicates) of Sm-resistant cfu against total cfu for each transformation setting. Note that when transforming the smR host, smR cfu reflects the untransformed population.
Figure 3—figure supplement 2
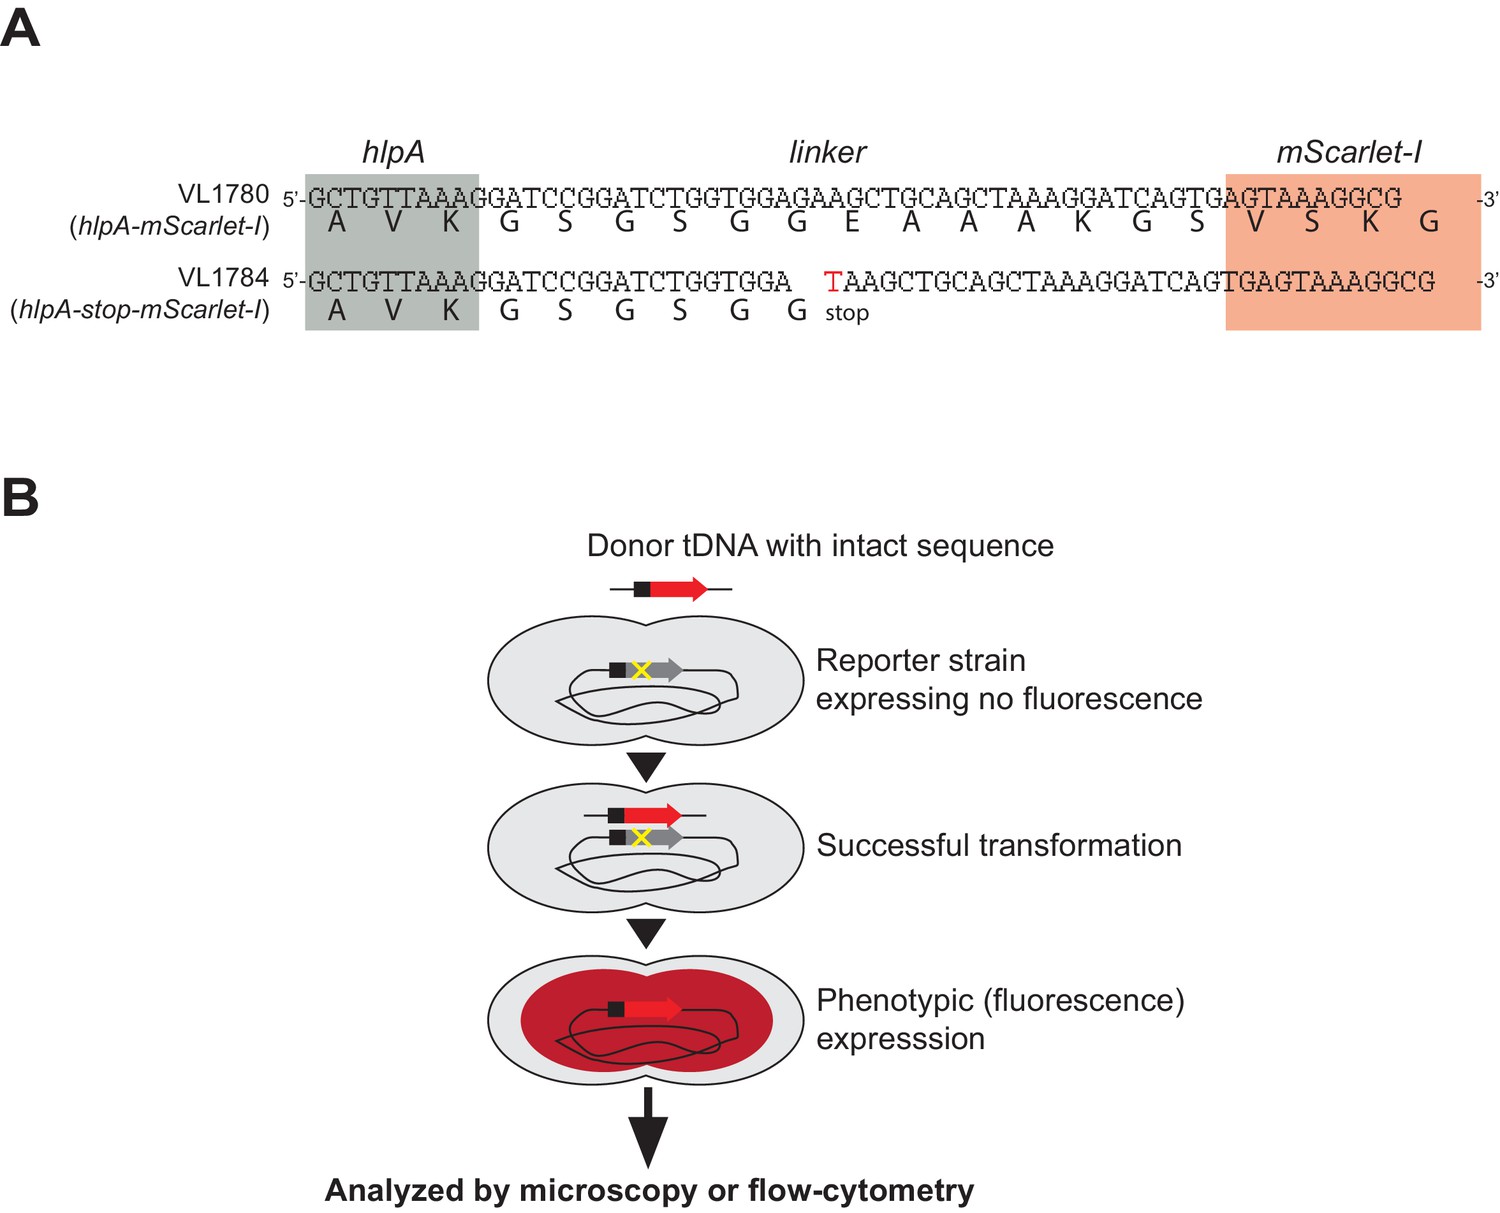
Fluorescence-based detection of successful genetic transformation.
(A) Stop codon generating SNP introduced in reporter strain. Nucleotide sequence of linker between hlpA (gray) and mScarlet-I (red) in strains VL1780 (up) and VL1784 (bottom) are shown. Bold letter under the nucleotide sequence indicates translated amino acids. In parent strain VL1780 (hlpA-mScarlet-I), translation of hlpA and mScarlet-I are bridged by a linker sequence (39 bp, 13 amino acids). In reporter strain VL1784 (hlpA-stop-mScarlet-I), a single nucleotide mutation (G > T) was induced, resulting in a stop codon in the middle of the linker so that mScarlet-I is not translated unless it is transformed with the intact sequence (i.e. hlpA-mScarlet-I). Note that other reporter genes used in this study have the identical linker sequence and SNP.( B) Schematic representation of the fluorescence-based transformation reporter. Once genetic recombination of donor DNA (intact PCR fragment of hlpA-mScarlet-I from VL1780) into strain VL1784 succeeds, the stop codon between hlpA and mScarlet-I is repaired, which allows for production of the fluorescent protein.
Figure 3—figure supplement 3
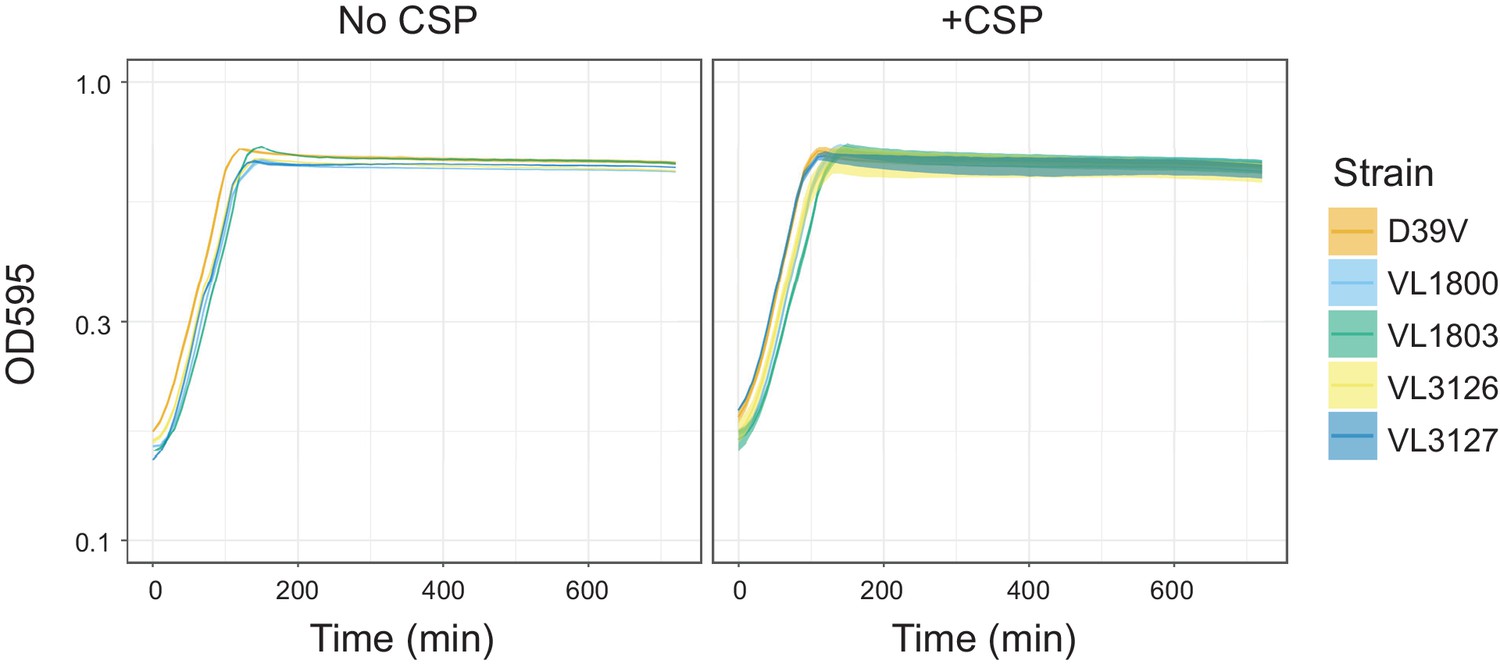
Growth curves of the reporter strains.
Pre-cultured S. pneumoniae strains D39V (wild-type), VL1800 (hlpA-mScarlet-I, spv_1159-sfGFP), VL1803 (hlpA-stop-mScarlet-I, spv_1159-stop-sfGFP), VL3126 (ftsZ-mTurquoise2, spv_1159-msfYFP, hlpA-mScarlet-I) and VL3127 (ftsZ-stop-mTurquoise2, spv_1159-stop-msfYFP, hlpA-stop-mScarlet-I), were inoculated into fresh C+Y media at initial concentration of OD = 0.1 with or without CSP, which is the exact same cultivation condition to transformation experiment implemented in this study. Lines and confidence bands represent means of three replicates and SD, respectively.
Figure 3—figure supplement 4
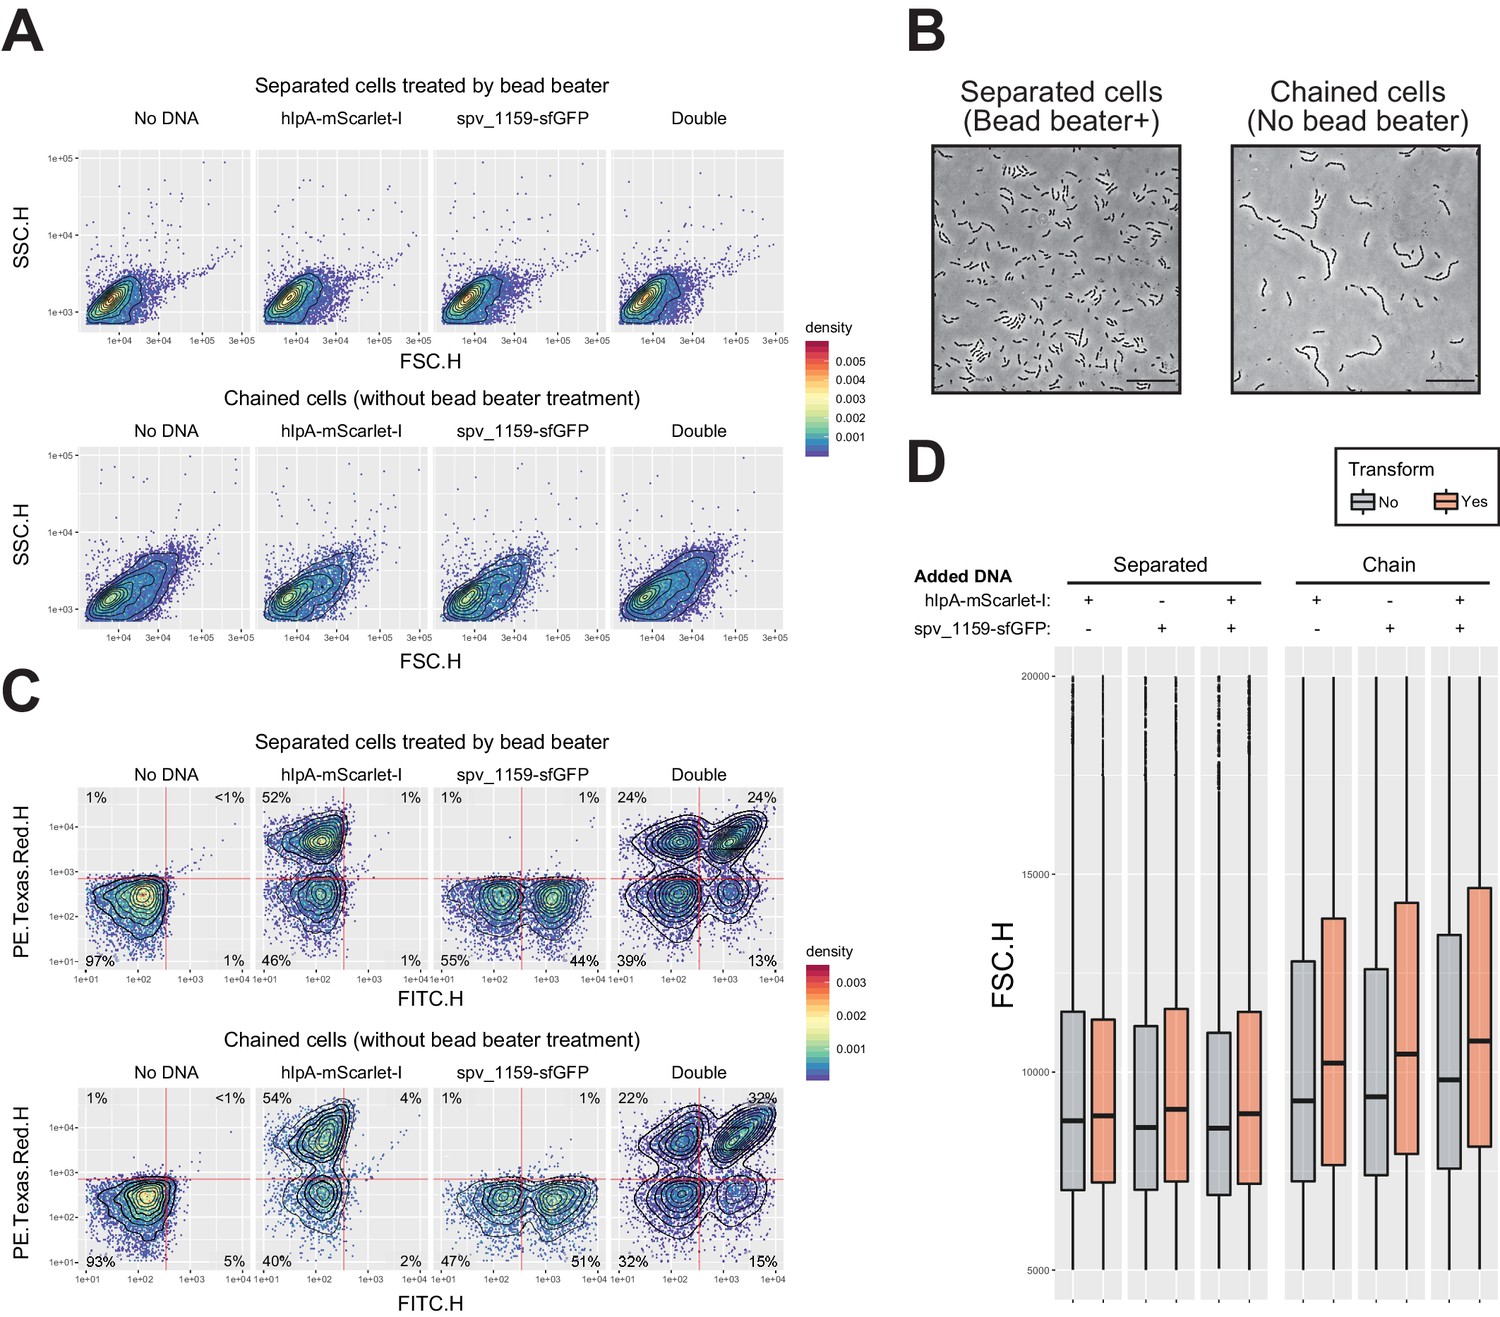
Effect of multicellular filament disruption by beadbeater on estimation of transformation frequency in flow-cytometry analysis.
(A) Effect of cell separation treatment by beadbeater on FSC-SSC profile. Dual reporter strain VL1803 treated with CSP was transformed with mock (no DNA) or single (hlpA-mScarlet-I fragment or spv_1159-sfGFP) or double tDNA fragments. After 4 hr incubation for phenotypic expression and chromosome segregation, cells were analyzed by flow-cytometry. Without beadbeater treatment (bottom panels), FSC-SSC profile showed increased value and heterogeneity compared to beadbeater cells (top panels). It is noted that one event in flow-cytometry does not indicate one single cell but one particle, which might consist of a multicellular filament. (B) Microscopic images of cells prepared in panel a. Bead beater-untreated cells showed chained phenotype consisting of >4 cells, meanwhile bead beater-treated cells showed shorter chain consisting of 2–4 cells, in line with FSC-SSC profile in flow-cytometry (panel A). Scale bar, 20 µm.( C) Effect of cell separation treatment by beadbeater on apparent transformation frequency in flow-cytometry. Note that bead beater-untreated cells tend to show generally more population of fluorescence positive cells compared to beadbeater-treated cells. This may be explained by masking of the negative cells by positive cells within the same chain as height values (highest peak) are measured for fluorescence. Vertical or horizontal red line represent threshold for green or red fluorescence intensity, respectively. (D) Correlation between particle size and apparent transformation frequency. Distributions of FSC value (particle size in flow-cytometry) grouped by transformed- (including both of each single and double transformed population, orange bars) or untransformed (gray bars) population are shown. In separated cells, there is no significant difference in FSC profile between untransformed and transformed particles. Meanwhile, in beadbeater-untreated cells, transformed group tends to show higher FCS value than untransformed group. Events with high FSC (longer filament) tend to have more chance to be estimated as transformed.
Figure 4 with 2 supplements
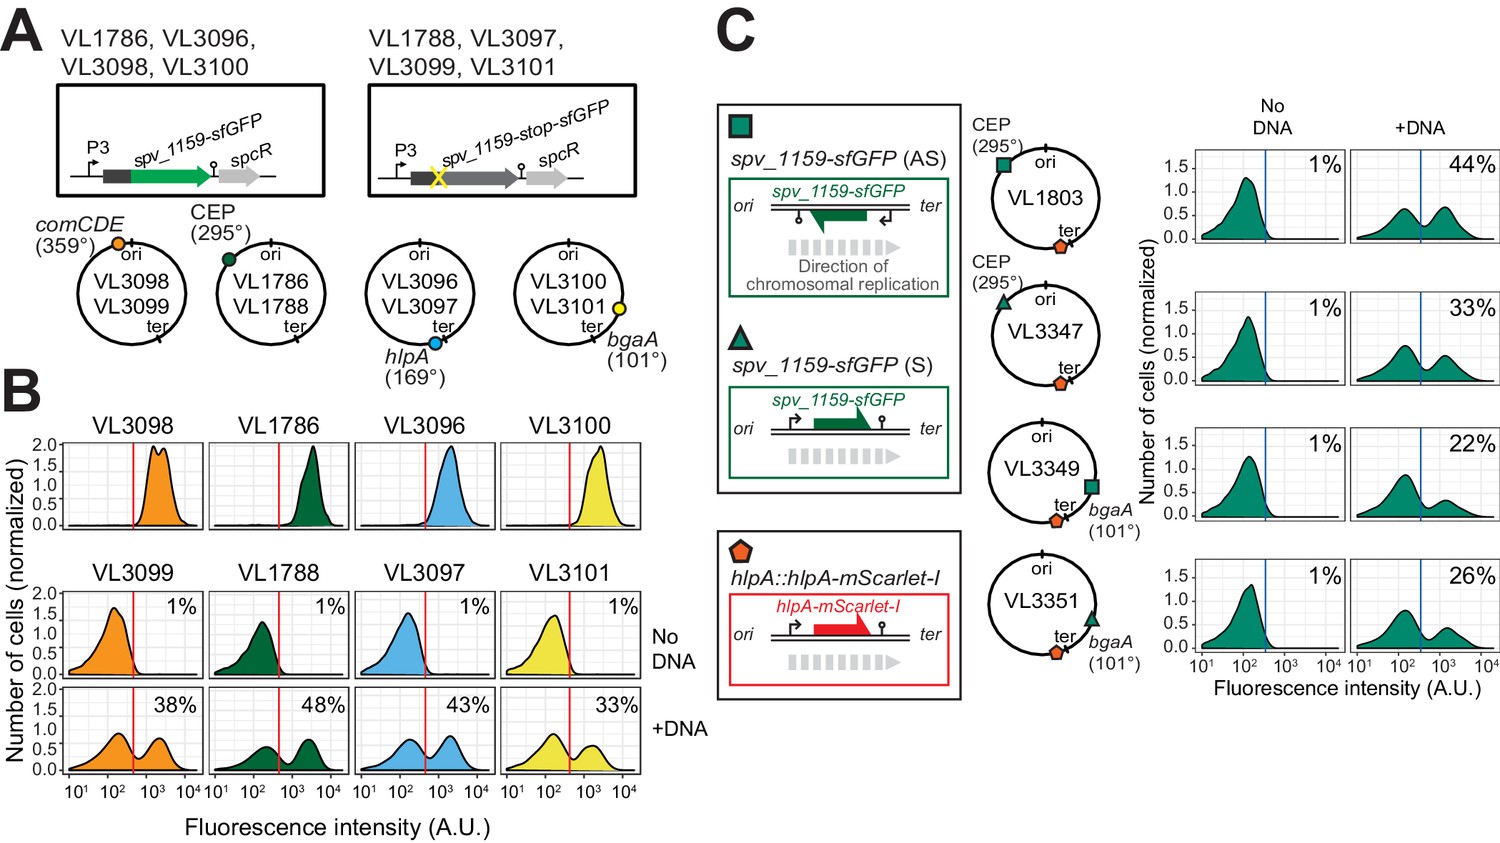
Effect of chromosomal position and strand on recombination potential.
(A) The spv_1159-sfGFP reporter was cloned into various loci: CEP (295°; VL1786, VL1788), hlpA (169°; VL3096, VL3097), comCDE (359°; VL3098, VL3099) or bgaA (101°; VL3100, VL3101). A point mutation that generates a stop codon was introduced in the linker sequence between spv_1159 and sfGFP for each strain (VL1788, VL3097, VL3099 or VL3101). (B) Flow-cytometry analysis on transformations with intact spv_1159-sfGFP tDNA. Strain VL1788, VL3097, VL3099 or VL3101 was transformed with intact spv_1159-sfGFP tDNA with 5 kb homology arm at the final concentration of 3.2 nM. 4 hr post transformation, cells were separated by beat beating and analyzed by flow-cytometry. The red vertical line indicates the threshold of positive cells in spv_1159-sfGFP signal expression. (C) Genetic orientation effect on transformation efficiencies. All dual reporter strains VL1803, VL3347, VL3349, or VL3351 harbor both hlpA-stop-mScarlet-I and spv_1159-stop-sfGFP reporters, but spv_1159-sfGFP was cloned at distinct chromosomal positions and different reading directions. spv_1159-stop-sfGFP was cloned at the CEP (295°) or bgaA (101°) locus resulting in strains VL1803/VL3347 or VL3349/3351, respectively. The coding strand of spv_1159-sfGFP was cloned either in the same direction as the DNA replication fork (read direction on the leading strand) (green triangle, strains VL3347/3351) or in the opposite direction (read direction on the lagging strand) (green square, strains VL1803/3349). The strains were treated with CSP and transformed with corresponding spv_1159-sfGFP tDNA (5 kb, 3.2 nM) alone. Transformants were analyzed by flow-cytometry. Vertical blue lines represent the threshold for green fluorescence intensity. Experiments were performed at least three times and FACS analysis of a typical experiment is shown.
Figure 4—figure supplement 1
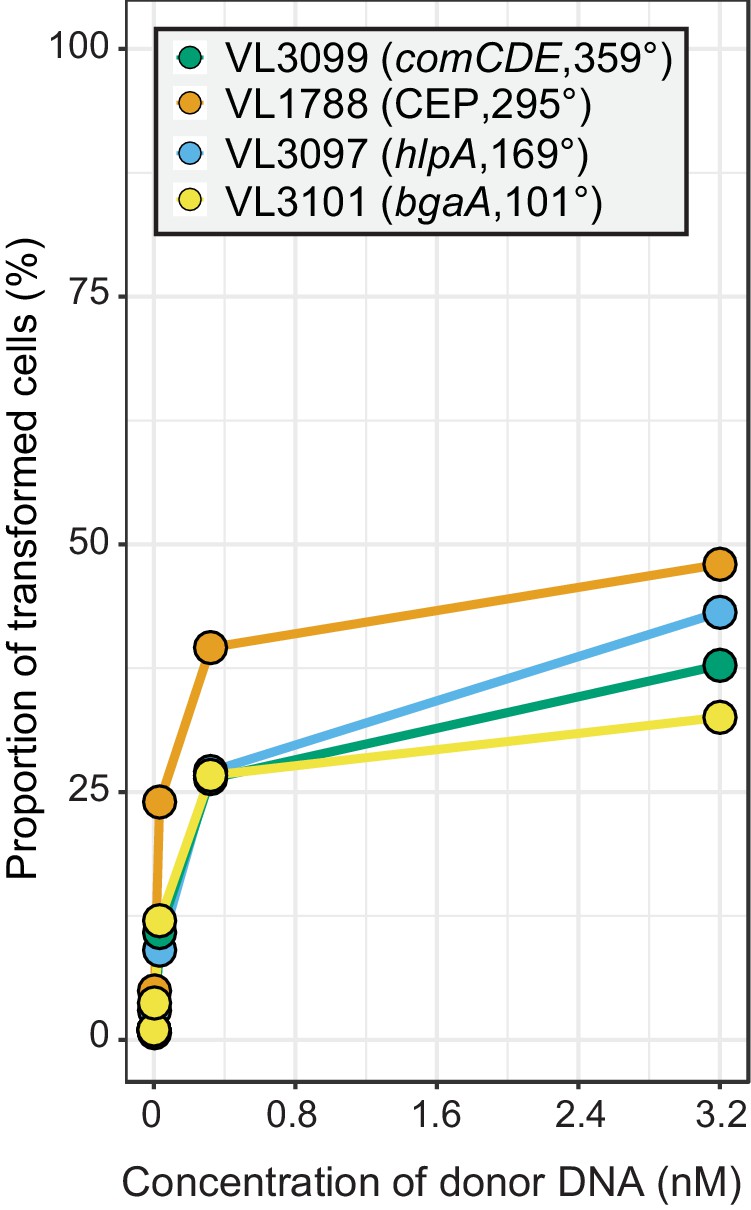
Chromosomal position effect on correlation between transformation frequency and tDNA concentration.
The spv_1159-sfGFP reporter was cloned into various loci; CEP (295°; VL1788), hlpA (169°; VL3097), comCDE (359°; VL3099) or bgaA (101°; VL3101). A point mutation that generates a stop codon was introduced in the linker sequence between spv_1159 and sfGFP for each strain (Figure 4A). Flow-cytometry analysis on transformations with intact spv_1159-sfGFP tDNA. Strains VL1788, VL3097, VL3099, or VL3101 were transformed with intact spv_1159-sfGFP tDNA with 5 kb homology arm at the final concentration of 0, 0.032, 0.32 or 3.2 nM. 4 hr post transformation, cells were separated by bead beating and analyzed by flow-cytometry. Transformation frequency was plotted against final concentration of donor DNA. Frequency was calculated by dividing the number of cells with a FL intensity above the threshold by the total number of cells based on flow-cytometry data.
Figure 4—figure supplement 2
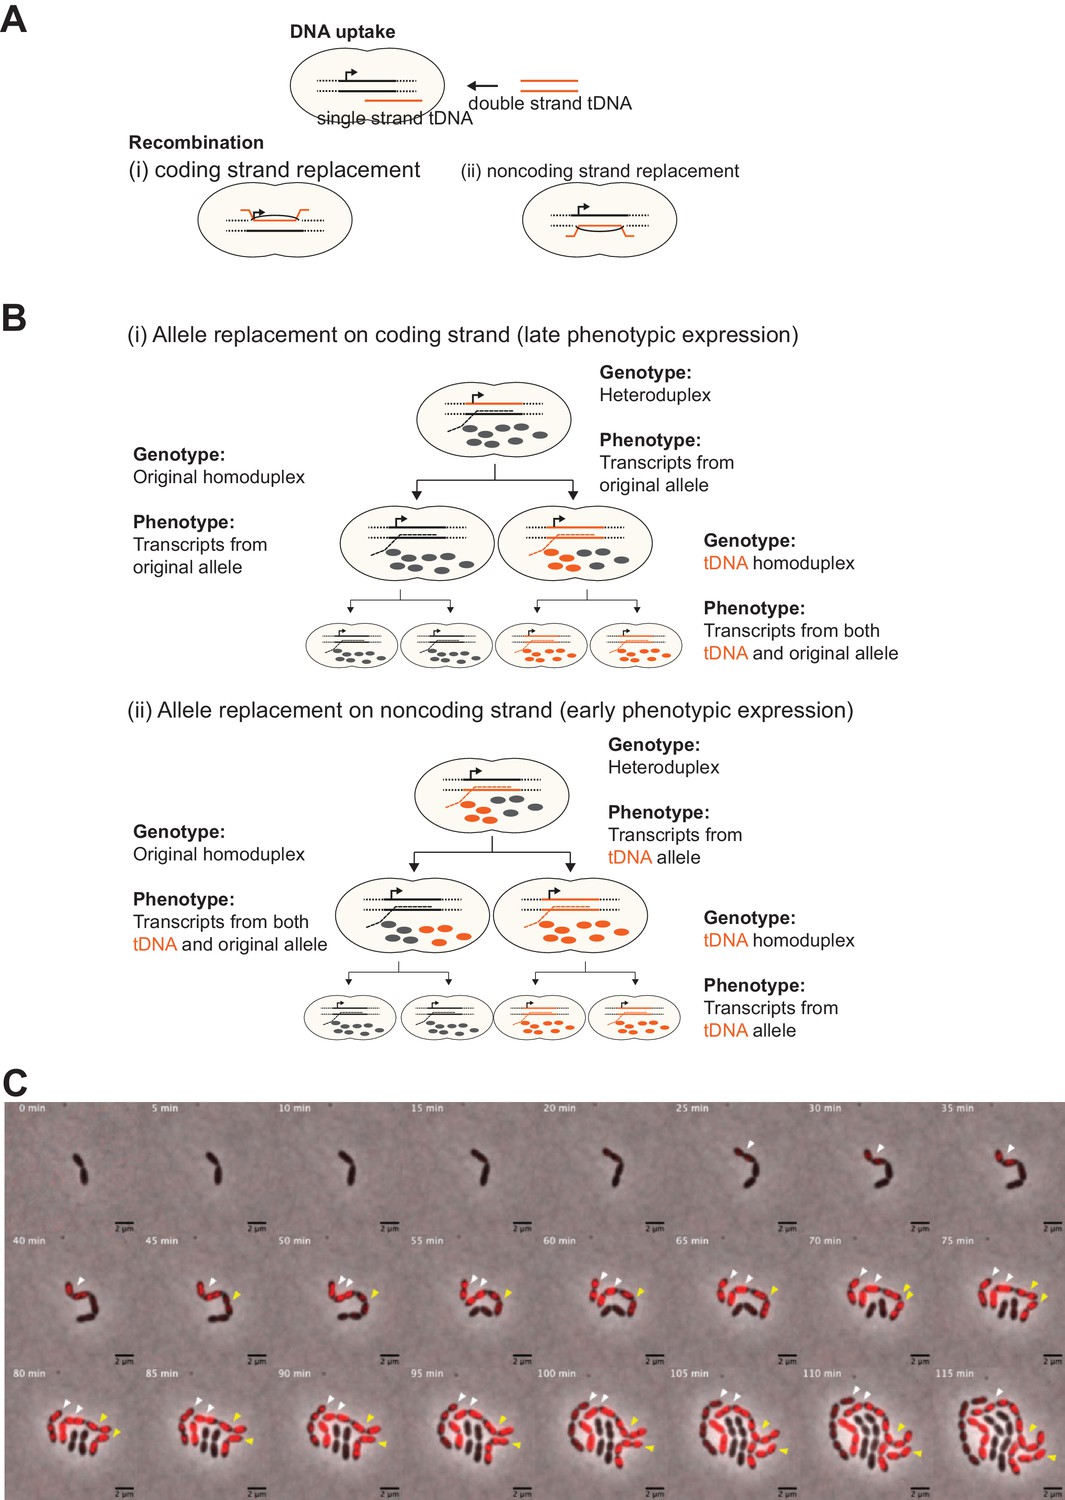
Effect of chromosomal strand to be replaced by tDNA on progression of phenotypic expression during cell division.
(A) Two possible recombination outcomes of single-stranded (ssDNA) tDNA into the host chromosome are shown. As tDNA (orange line) is processed to a ssDNA DNA molecule during internalization, recombination can only occur on one strand of the host chromosome. Therefore, if the tDNA encodes new phenotypic information, which of (i) coding or (ii) noncoding strand to be replaced will affect phenotypic expression dynamics derived from the newly acquired allele. (B) Hypothetical model of phenotypic expression dynamics depending on which strand is replaced by tDNA. In case of coding strand replacement (i), RNAP uses the original allele as template to synthesize transcripts (gray dashed line), and transcription of tDNA-derived sequence occurs only once the homo-duplex forms after one replication cycle. Also, it may take more cell divisions to replace the original product (proteins, etc.) (gray balls) by tDNA-derived products (orange balls) to express visible phenotype. Meanwhile, in case of noncoding strand replacement (ii), transcription from tDNA is permitted as RNAP recognizes the tDNA sequence and synthesizes transcripts from it (orange dashed line). Consequently, tDNA-derived products (orange balls) come up right after recombination before cell division without forming the homo-duplex. After cell division, tDNA-derived products can be nongenetically distributed even in progenitor with homo-duplex of original allele not only in one with homo-duplex of tDNA-derived allele. Therefore, in this case nongenetic inheritance is observed. This phenotypically intermediate state should be solved according to a couple of cell divisions as nongenetic inheritance will be diluted out. (C) Representative example of two types of phenotypic expression. The model described in panel B is also suggested by actual observations. Shown is a time-lapse montage of VL1784 (hlpA-stop-mScarlet-I) transformed with hlpA-mScarlet-I tDNA where two transformed events (indicated by white and yellow arrows, respectively) are visualized side by side. Similarly, as already shown in Figure 3, the cell indicated by the white arrow expresses fluorescence relatively early during the time -lapse, and also gradual reduction of fluorescence is observed in progenitors in one side of the lineage. On the other hand, the cells indicated by yellow arrow started expressing fluorescence a little bit later than cells indicated by white arrow, suggesting that this lineage might need cell division to form homo-duplex to transcribe tDNA allele. Importantly, this cell lineage did not show evidence of nongenetic phenotypic expression. Collectively, according to the model described in panel B, it seems that the cell lineage indicated by the white arrow was transformed at the noncoding strand, and the cell indicated by the yellow arrow was transformed at the coding strand. Scale bar, 4 µm.
Figure 5 with 3 supplements
Single-cell quantification of recombination reveals an upper level of transformation efficiency.
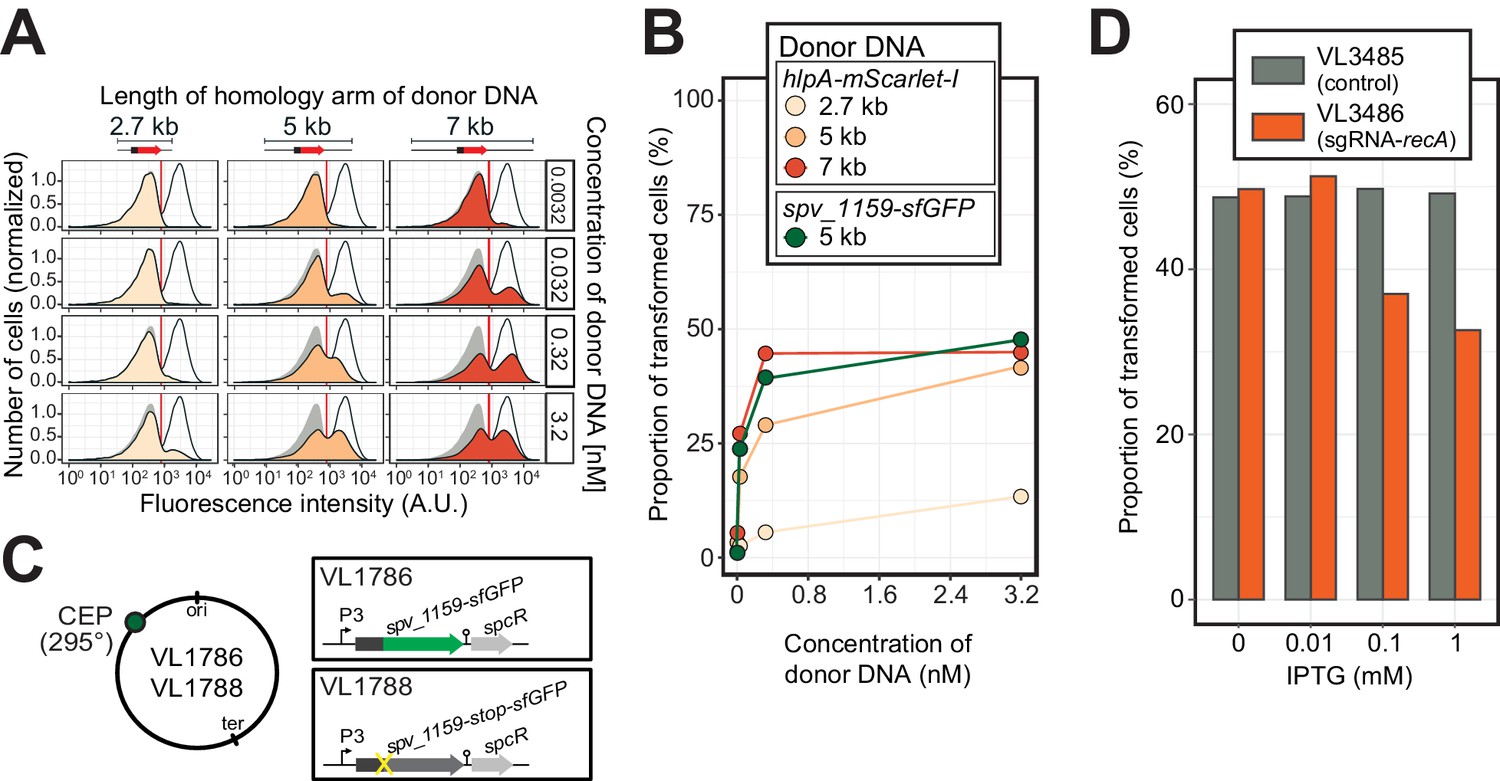
(A) Quantification of transformation frequency by flow-cytometry. CSP-treated VL1784 was transformed with hlpA-mScarlet-I tDNA of various lengths (2.7, 5, or 7 kb) at differing tDNA concentrations (0.0032, 0.032, 0.32, or 3.2 nM). The single nucleotide variant to repair the point mutation is located in the middle of each fragment (Figure 3—figure supplement 2). After 4 hr incubation post tDNA addition, cell chains were separated (see Figure 3—figure supplement 4) and analyzed by flow-cytometry. Negative control without any donor DNA (filled gray histogram) and positive control (VL1780, open histogram) is shown in all panels. Red vertical line indicates the threshold used to score mScarlet-I positive cells. (B) Correlation between transformation frequency and donor DNA concentration. Transformation frequency was plotted against final concentration of donor DNA. Frequency was calculated by dividing the number of cells with a FL intensity above the threshold by the total number of cells based on flow-cytometry data, as shown in panel A. (C) Alternative transformation reporter present on a different chromosomal position. The spv_1159-sfGFP reporter fusion was cloned into the CEP locus (295°; VL1786, VL1788). A point mutation resulting in a stop codon was introduced in the linker sequence separating spv_1159 and sfGFP in VL1788. (D) Reduction of transformation efficiency by CRISPRi-based recA depletion. CRISPRi-based depletion strains VL3485 (Plac_dcas9, no sgRNA control) and VL3486 (Plac_dcas9, sgRNA targeting recA) were introduced in the hlpA-stop-mScarlet-I reporter strain. Strains were pre-grown with or without IPTG (0, 0.01, 0.1 or 1 mM) in acidic C+Y (pH 6.8), and then incubated with CSP (100 ng/µL) in fresh C+Y (pH 7.8) provided with donor tDNA (5 kb length, 0.32 nM). After 4 hr of phenotypic expression, transformed cells were analyzed by flow-cytometry.
Figure 5—figure supplement 1
Time-lapse imaging of transformation with spv_1159-sfGFP fragment in VL1788.
(A) Time-lapse visualization of transformation with spv_1159-sfGFP fragment in VL1788 (CEP::P3_spv_1159-stop-sfGFP). VL1788 was treated with CSP for 10 min, added with tDNA (spv_1159-sfGFP) for 10 min, and then spotted on C+Y agarose pad to start time-lapse imaging with 5 min intervals. Phase contrast images (left panels) were obtained for cell segmentation in image analysis. Successfully transformed cells were detected by expression of SPV_1159-sfGFP (middle panels). Also see Video 2 for original movie. (B) Cell lineage tree with fluorescence intensity was built based on the time-lapse image in panel A. Means of sfGFP signal intensity of each cells were calculated and displayed with ball color. Note that fluorescence signals detected in the initial few time points were mostly background from C+Y medium rather than that derived from SPV_1159-sfGFP.
Figure 5—figure supplement 2
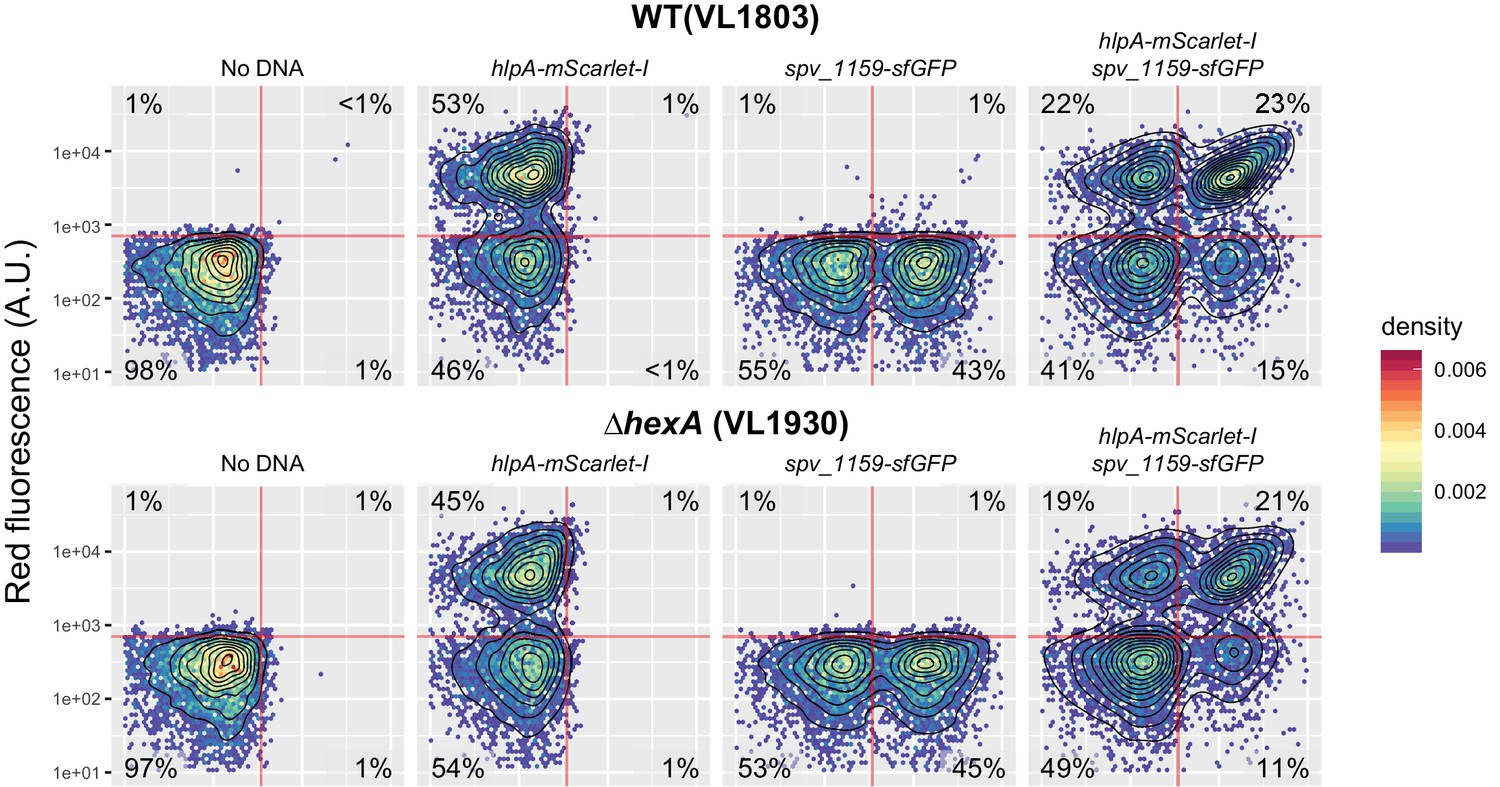
Effect of hexA knockout on transformation frequency in the fluorescence-based reporter.
Dual reporter strain VL1803 (hlpA-stop-mScarlet-I, spv_1159-stop-sfGFP) and its derivative VL1930 (VL1803+∆hexA) were treated with CSP and transformed with hlpA-mScarlet-I or/and spv_1159-sfGFP tDNA (3.2 µM each). The transformed cells were analyzed by flow-cytometry. Vertical or horizontal red line represent threshold for green or red fluorescence intensity, respectively.
Figure 5—figure supplement 3
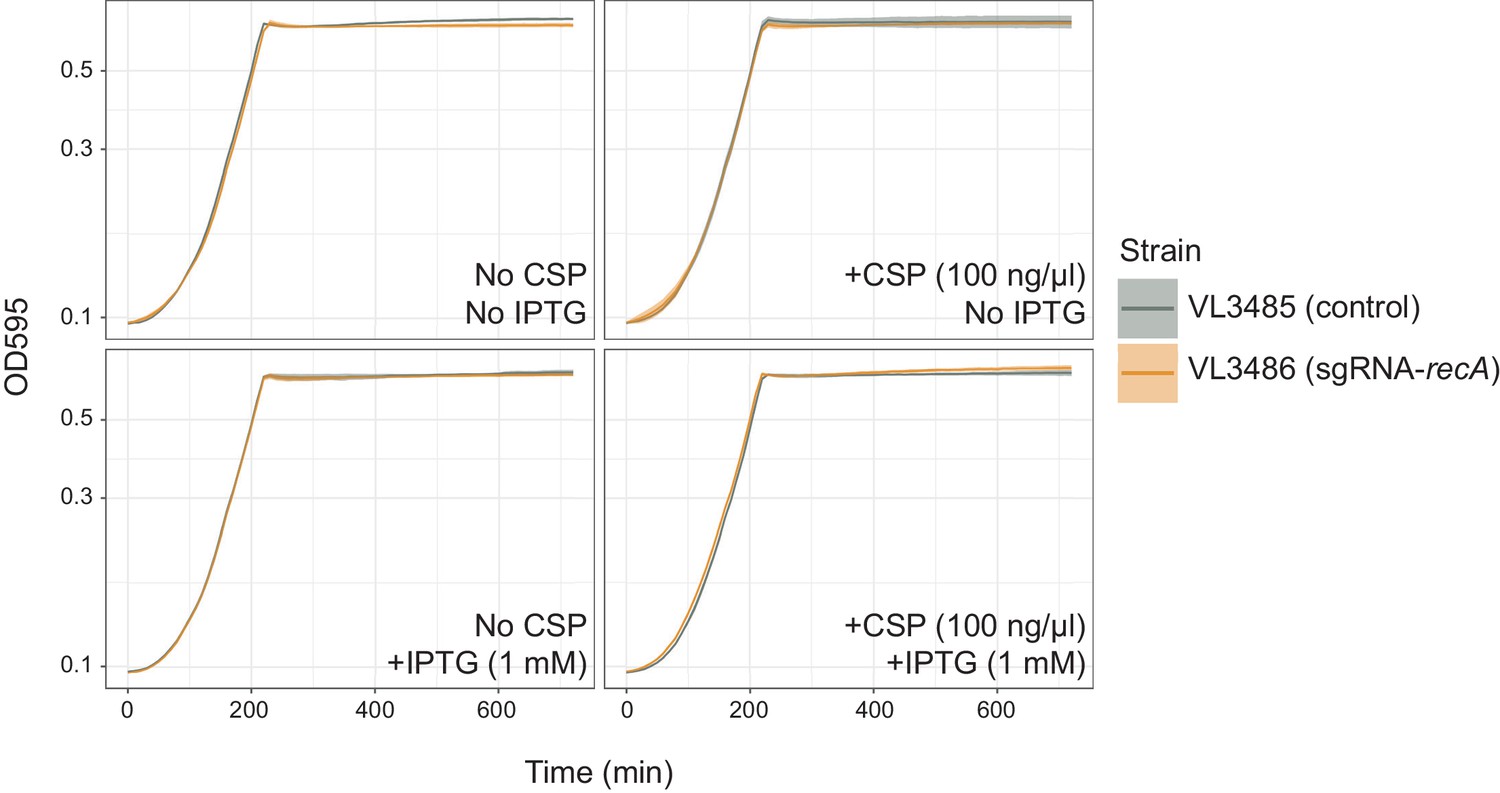
Effect of recA knock-down on bacterial growth.
Pre-cultured S. pneumoniae strains, DL3485 (prs1::lacI; bgaA::Plac_dcas9, hlpA::hlpA_hlpA-stop-mScarlet-I) and DL3486 (prs1::lacI; bgaA::Plac_dcas9, cep::P3_recA-sgRNA; hlpA::hlpA_hlpA-stop-mScarlet-I) were inoculated into fresh C+Y media at initial concentration of OD = 0.01 with or without CSP and IPTG. Lines and confidence bands represent means of three replicates and SD, respectively.
Figure 6 with 1 supplement
Dual transformation at distinct chromosomal positions.
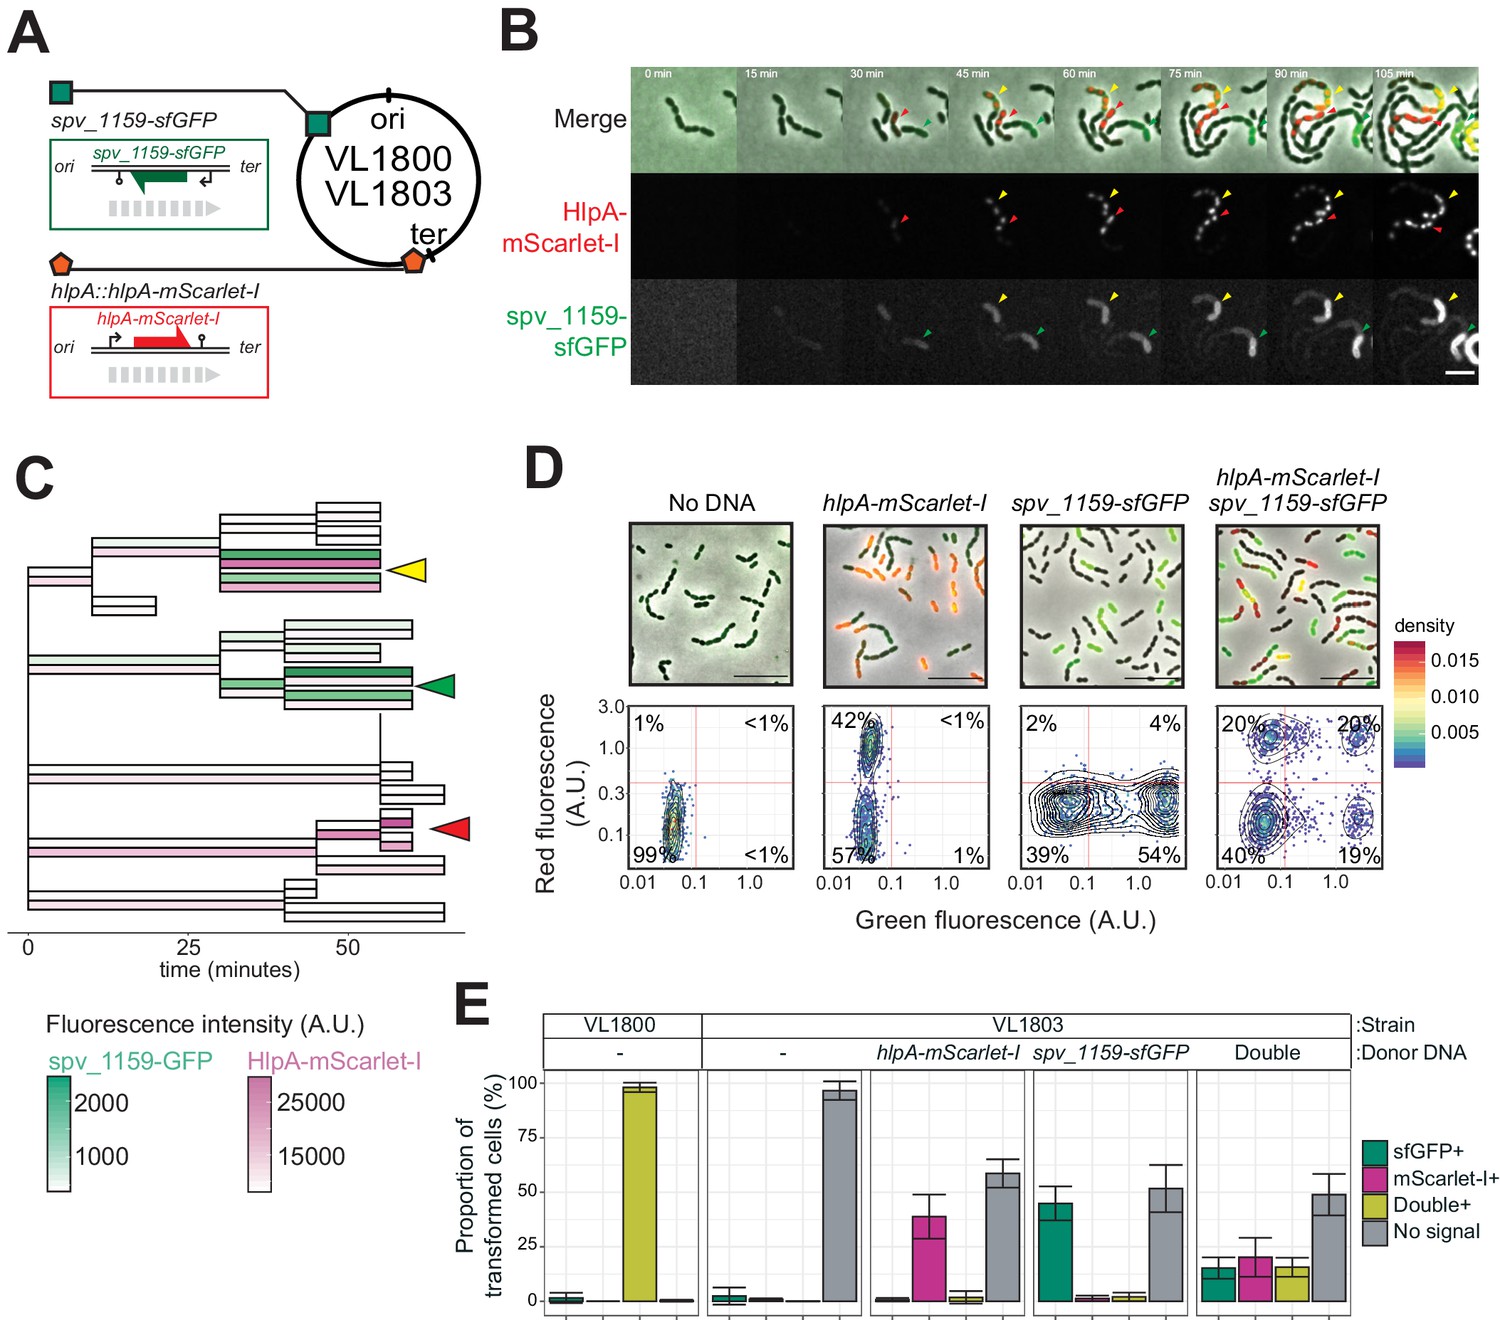
(A) Graphical representation of dual reporter strains. Dual transformation reporter strain VL1804 harbors the two transformation reporter constructs hlpA-stop-mScarlet-I and spv_1159-stop-sfGFP, at the hlpA and CEP loci, respectively. Donor tDNA (5 kb) hlpA-mScarlet-I and spv_1159-sfGFP were amplified from strain VL1800 and used for transformation. (B) Time-lapse visualization of double transformation. Dual reporter strain VL1803 (hlpA-stop-mScarlet-I, spv_1159-stop-sfGFP) was treated with CSP for 10 min, provided with 3.2 nM of both hlpA-mScarlet-I and spv_1159-sfGFP tDNAs (5 kb) for 10 min, and then spotted on a C+Y agarose pad to start time-lapse imaging at 5 min intervals. Successfully transformed cells were detected by expression of HlpA-mScarlet-I (middle, red in merge) and spv_1159-sfGFP (bottom panels, green in merge). Red and Green arrows indicate single transformed cells with hlpA-mScarlet-I and spv_1159-sfGFP tDNA, respectively. Yellow arrows indicate doubly transformed cells. Scale bar: 4 μm. See Video 5. (C) Cell lineage tree with superimposed fluorescence intensity was built based on the time-lapse image shown in B. Means of mScarlet-I (pink) and sfGFP (green) signal intensity of each cell was calculated and displayed with a color bar. Yellow, green, and red arrows indicate double transformed, single spv_1159-sfGFP-transformed, and single hlpA-mScarlet-I-transformed lineages, respectively. (D) Snap shots and quantitative image analysis of transformed populations. Strain VL1803 was transformed with single (hlpA-mScarlet-I or spv_1159-sfGFP) or double (hlpA-mScarlet-I/spv_1159-sfGFP) tDNA(s) (5 kb) at final concentration of 3.2 nM. After 4 hr of incubation, still images were obtained, and the fluorescence intensities were quantified and plotted. Scale bar: 10 μm. Experiments were performed at least three times and microscopy analysis of a typical experiment are shown.( E) Proportion of transformed phenotypes. Stacked bars represent the fraction of single transformed (red or green), double transformed (yellow), and non-transformed (gray) cells. Population of each transformed phenotype was quantified from microscopy images. Bars represent mean ± SD of three independent replicates. Analyzed data of the positive control strain VL1800 (hlpA-mScarlet-I, spv_1159-sfGFP) and negative control non-transformed strain VL1803 (hlpA-stop-mScarlet-I, spv_1159-stop-sfGFP) are also shown, demonstrating the accuracy of the threshold used to score positive transformants.
Figure 6—figure supplement 1
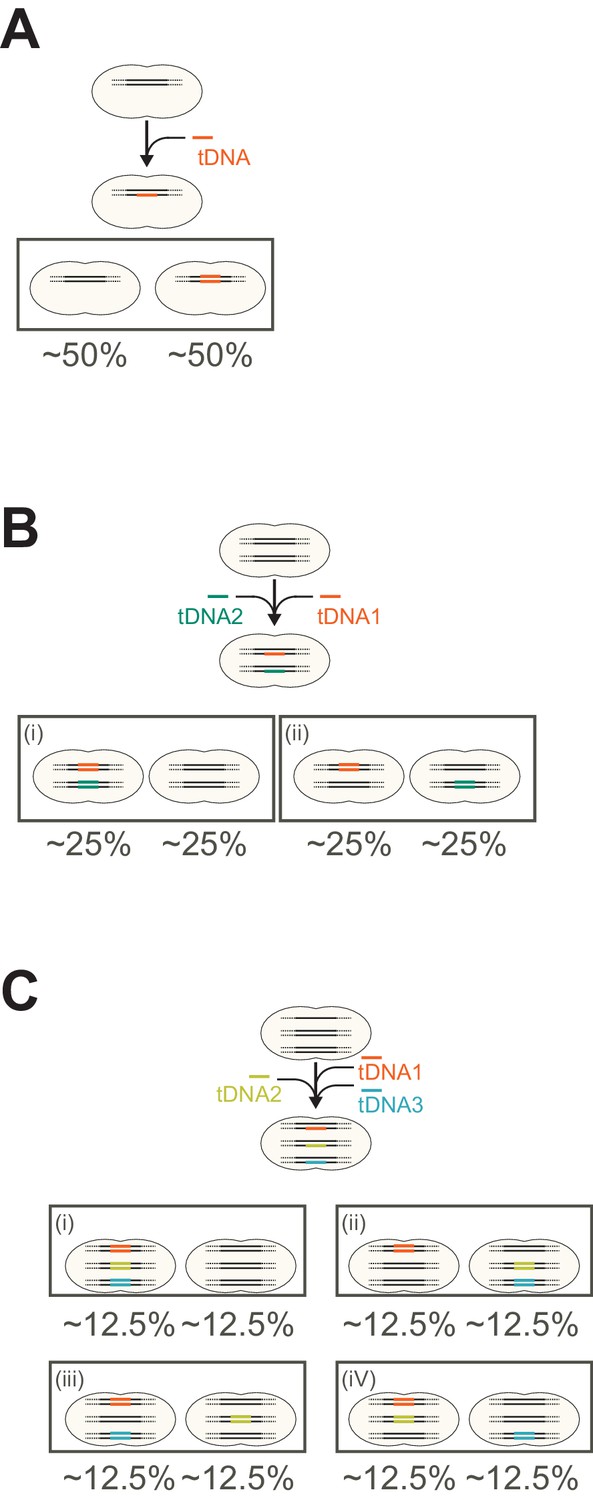
Expected outcome of genetic proportion after saturated transformation.
(A) Expected genetic proportion after saturated single transformation. In single fragment (allele) transformation the proportion of progenitors with a tDNA-replaced allele or the original allele becomes 50:50. This can be predicted and explained by the principle mechanism of natural genetic transformation in which tDNA is processed into single-stranded DNA (ssDNA) and is integrated into one strand of the host chromosome. (B, C) Expected genetic proportion after saturated multiple transformations in case each recombination event is independent from the other. Note that for simplification, the single circular chromosome is depicted as separate linear fragments. As shown in this study, multiple transformation events can occur at the distinct loci at the same time in single cell. If multiple transformation events do not interfere with each other and take place independently, most cells in the population would have a higher chance to acquire a tDNA, and the proportion of untransformed cells that did not acquire any tDNA fragments should be reduced. In the case of 2 tDNAs (panel b), the expected outcome would be that 25% of the transformants obtained both new alleles, 25% just one of the two tDNAs and 25% would have the wild-type genome. In the case of 3 tDNAs (panel c), the expected outcome, when every tDNA would be converted on one of the recipient strands independent from the next tDNA, would be that 12.5% of the transformants would have the wild-type genome. Note that the theoretical outcomes showcased in panels a–c do not match our experimental observations (Figures 6E and 7C–D) in which in general more than 50% of the cells did not acquire the SNP. However, the relative transformation efficiencies do seem to be independent. For instance, from the data of Figure 6 (double tDNA), the observed transformation frequencies were for single hlpA-mScarlet-I red transformants (R) 20.2%. The observed transformation frequency to become green (G) by the take-up and integration of spv_1159-sfGFP was 15.2% (P(G) = 0.152). The observed transformation frequencies for both hlpA-mScarlet-I (R) and spv_1159-sfGFP (G) was 15.6%. So, the observed number of R cells were 20.2 + 15.6 = 35.8% and the observed number of G cells were 15.2 + 15.6 = 30.8%. These values are largely in line if transformation of both mScarlet-I (R) and spv_1159-sfGFP (G) are independent as the chance (P) to become R = 0.358 × (1–0.308) = 24.7% (observed 20.2%). For G: 0.308 × (1–0.358) = 19.7% (observed 15.2%). For both R and G: 0.358 × 0.308 = 11.0% (observed 15.6%). Finally, the proportion of untransformed cells: (1–0.308) × (1–0.358) = 44.4% (observed 49%). A similar calculation can be done for the triple tDNA transformation from Figure 7: hlpA-mScarlet-I (Red, R), spv_1159-msfYFP (Yellow, Y) and ftsZ-mTurquoise2 (Cyan, C). Observed values were: P(C) = 12.7+2.2+4.1+1.5 = 20.5 ≥ 0.205. P(Y) = 7.7+2.2+2.1+1.5 = 13.5 ≥ 0.135. P(R) = 11.0+4.1+2.1+1.5 = 18.7 ≥ 0.187. If these tDNAs are taken up independent of each other the expected percentages would be: C+Y: 0.205 × 0.135 × (1–0.187) = 2.2% (observed: 2.2%). C+R: 0.205 × 0.187 × (1–0.135) = 3.3% (observed: 4.1%). Y+R: 0.135 × 0.187 × (1–0.205) = 2.0% (observed: 2.1%). C+Y+R: 0.205 × 0.135 × 0.187 = 0.5% (observed: 1.5%). Untransformed: (1–0.205)(1–0.135)(1–0.187) = 55.9% (observed: 58.7%). Together, these data suggest that in principle each transformation event is independent from each other but, since non-homologous DNA can compete for successful recombination events (Figure 7E), saturation of the uptake and integration system become limiting as well as off target recombination events that cannot be measured in our SNP assay. This last point is illustrated in Figure 7E of the main text.
Figure 7

Direct observation of recombination of three separate tDNAs during a single transformation event.
(A) Schematic representation of the triple-labeled strain VL3126 harboring three reporter cassettes: hlpA-mScarlet-I, spv_1159-msfYFP, and ftsZ-mTurquoise2 at the hlpA, CEP, and ftsZ loci, respectively. Strain VL3127 contains stop codon mutations in the linker between each of the fluorescent fusion proteins. Gray arrows indicate the direction of the DNA replication fork relative to the reporter cassette. (B) Microscope image of strain VL3127 treated with CSP and transformed with the tDNAs of hlpA-mScarlet-I, spv_1159-sfGFP, and ftsZ-mTurquioise2 (3.2 nM each) amplified from VL3126. Merge image of phase contrast, cyan (FtsZ-mTurquoise2), yellow (spv_1159-msYFP) and red (HlpA-mScarlet-I) fluorescence is shown. Scale bar: 10 μm. (C and D) Proportion of transformed phenotypes. Population of each transformed phenotype was quantified from microscope images. Representative images for each phenotype are shown. Scale bar: 2 μm. (D) Stacked bars represent proportion of single transformed (cyan, yellow or red), double transformed [green (cyan+yellow), blue (cyan+red), orange (yellow+red)], triple transformed (white) and non-transformed (gray) cells. Bars represent mean ± SD of three independent replicates. Analyzed data of the positive control strain VL3126 (ftsZ-mTurquoise2, spv_1159-msfYFP, hlpA-mScarlet-I) and negative control non-transformed strain VL3127 (ftsZ-stop-mTurquoise2, spv_1159-stop-msfYFP, hlpA-stop-mScarlet-I) are also shown, demonstrating the accuracy of the threshold used to score positive transformants. (E) Competition effect of unrelated DNA on transformation frequency. CSP-treated VL1803 was transformed with 7 kb hlpA-mScarlet-I tDNA at the final concentration of 0.32 nM in the absence or the presence of an unrelated DNA fragment (0.32 nM or 3.2 nM) amplified from E. coli. After incubation of 4 hr post transformation, cells were separated and analyzed by flow-cytometry. Red vertical line indicates the threshold of positive cells in mScarlet-I signal expression. The proportion of positive cells (%) is depicted in the plots. (F). Fragmented tDNA recombination model. The fluorescence-based reporters used in this study rely on replacement of the stop codon SNP (gray star) by intact (amino acid coding) SNP (yellow star) that is located in the middle of the tDNA fragment (orange line). All prepared tDNA molecules have obviously intact SNP, but, integration into host chromosome may take place outside the SNP, which is never distinguished from true untransformed cells by the fluorescence-based system and effectively acting as competing DNA for tDNAs that transform the SNP.
Figure 8
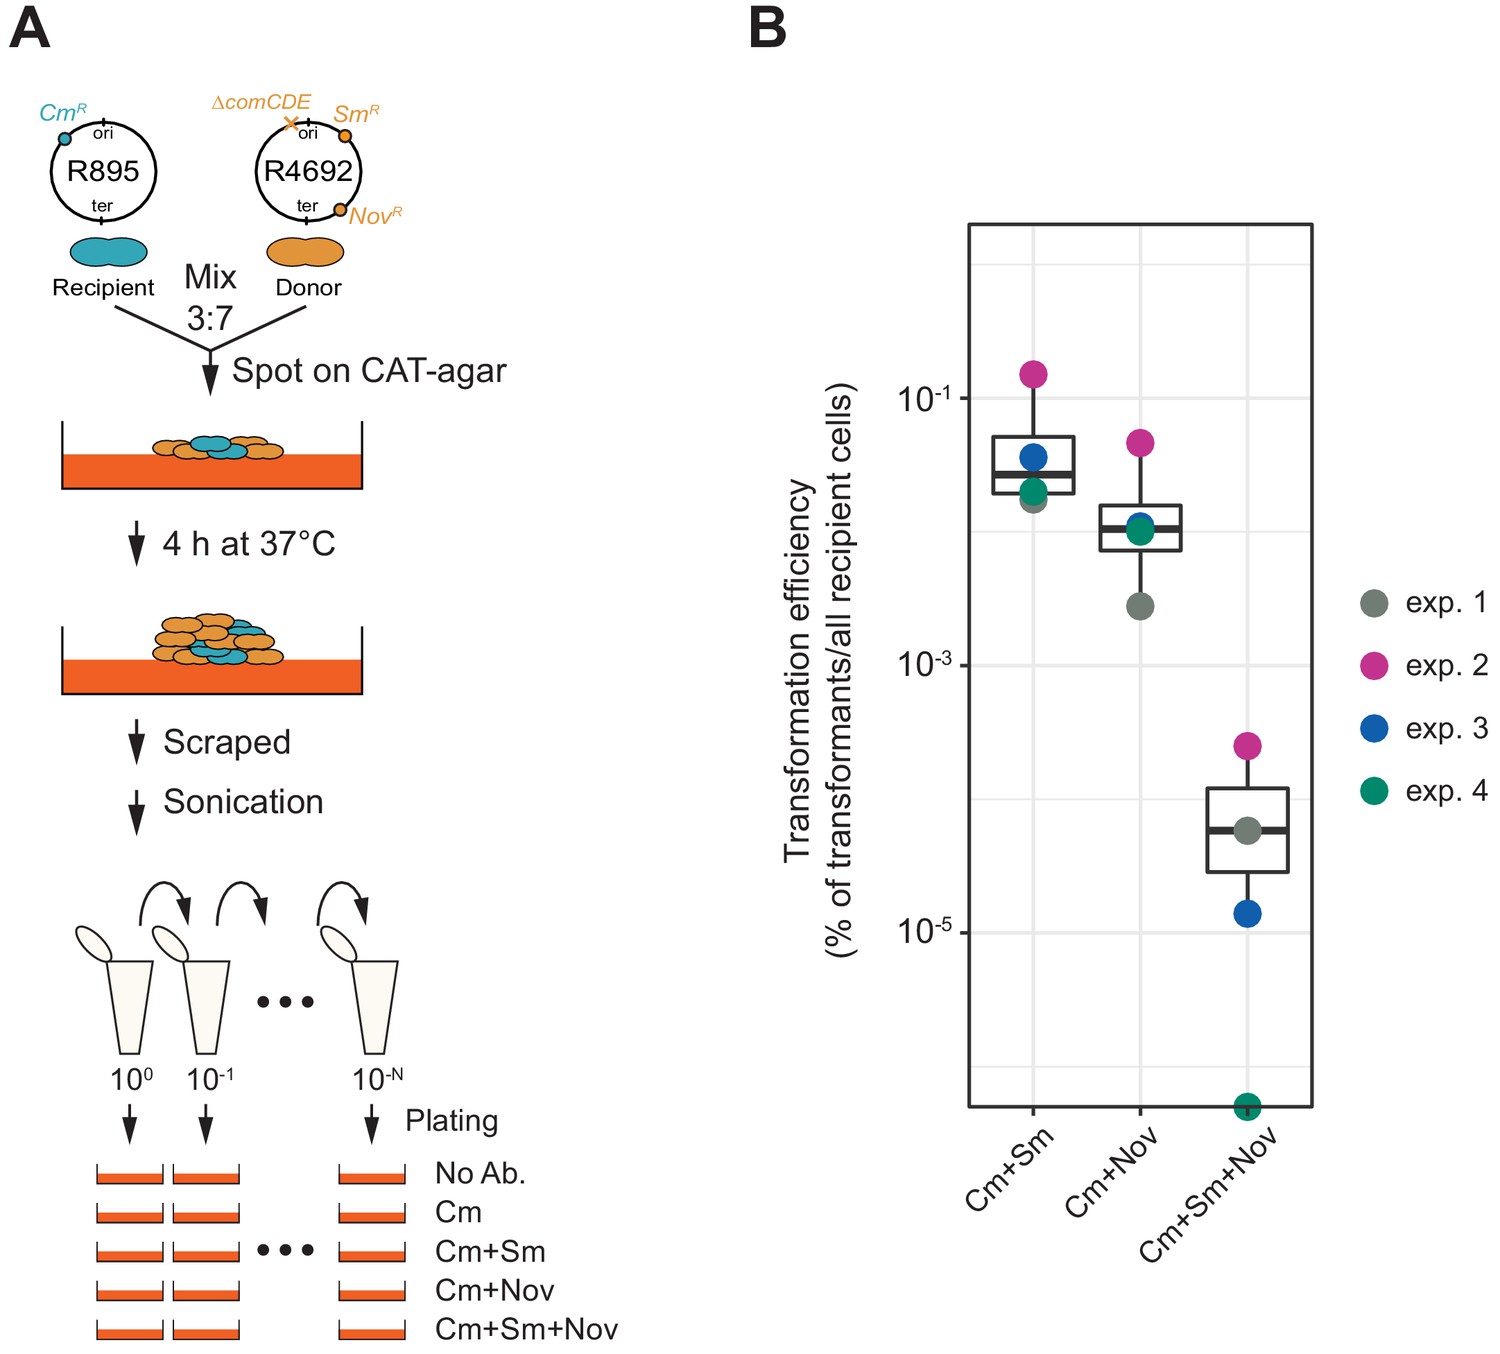
Horizontal gene transfer between S. pneumoniae strains.
(A) Schematic representation of the transformation assay between S. pneumoniae strains. Pre-cultured recipient strain R895 (cmR) and donor strain R4692 (∆comCDE, smR, novR) were mixed in approximately 3:7 ratio, and spotted on 3% horse blood CAT-agar (see Materials and methods). After 4 hr incubation at 37°C to allow strain-to-strain transformation, cells were scraped and separated by sonication. Then, serial dilutions of cell suspensions were plated with 4.5 µg/mL of chloramphenicol (Cm, for the recovery of the total number of viable recipient cells) and with combinations of chloramphenicol plus streptomycin (Sm, 10 µg/mL) and/or novobiocin (Nov, 4 µg/mL). (B) Transformation efficiency was calculated by dividing the number of transformants by the total number of viable recipient count. Four independent biological replicates were performed and box plots demonstrate the average efficiencies.
Videos
Video 1
Visualization of transformation using hlpA-mScarlet-I reporter.
Shown is a movie of transformation with hlpA-mScarlet-I tDNA fragment in VL1832 (hlpA-stop-mScarlet-I) depicted in Figure 3E. Images are sfGFP (left), mScarlet-I (middle) and merged image (right). Frame interval, 5 min. Scale bar, 4 µm.
Video 2
Visualization of population dynamics after transformation using hlpA-mScarlet-I reporter.
Shown is a movie of transformation with hlpA-mScarlet-I tDNA fragment in VL1832 (hlpA-stop-mScarlet-I) in lower magnification. Images are merged of phase contrast and mScarlet-I fluorescence signal. Frame interval, 5 min. Scale bar, 20 µm.
Video 3
Visualization of transformation using spv_1159-sfGFP reporter.
Shown is a movie of transformation with spv_1159-sfGFP tDNA fragment in VL1788 (spv_1159-stop-sfGFP) depicted in Figure 4—figure supplement 1. Images are phase contrast (left), sfGFP (middle), merged image (right) Frame interval, 5 min. Scale bar, 4 µm.
Video 4
Visualization of differential phenotypic expression timing on sense strand and anti-sense strand transformation.
Shown is a movie of transformation with hlpA-mScarlet-I tDNA fragment in VL1832 (hlpA-stop-mScarlet-I) depicted in Figure 4—figure supplement 2. Images are an overlay between phase contrast and mScarlet-I signal. White arrow indicates a likely anti-sense strand transformed cell, and the yellow arrow indicates a likely sense strand transformed cell (See text for details). Frame interval, 5 min. Scale bar, 4 µm.
Video 5
Visualization of double transformation in the population.
Shown is a movie of double transformation with hlpA-mScarlet-I and spv_1159-sfGFP tDNA fragments in dual reporter strain VL1803 (hlpA-stop-mScarlet-I, spv_1159-stop-sfGFP). White arrow indicates a double transformed cell lineage. Frame interval, 5 min. Scale bar, 20 µm.
Video 6
Visualization of double transformed cells.
Shown is an enlarged movie of hlpA-mScarlet-I and spv_1159-sfGFP tDNA fragments in dual reporter strain VL1803 (hlpA-stop-mScarlet-I, spv_1159-stop-sfGFP) depicted in Figure 6B. Images are mScarlet-I (left), sfGFP (middle), merged image (right) Frame interval, 5 min. Scale bar, 4 µm.
Video 7
Visualization of triple transformation in population.
Shown is a movie of triple transformations with ftsZ-mTurquoise2, spv_1159-msfYFP and hlpA-mScarlet-I tDNA fragments in triple reporter strain VL1803 (ftsZ-stop-mTurquoise2, spv_1159-stop-msfYFP, hlpA-stop-mScarlet-I). Frame interval, 10 min. Scale bar, 20 µm.
Tables
Key resources table
| Reagent type (species) or resource | Designation | Source or reference | Identifiers | Additional information |
|---|---|---|---|---|
| Strain, strain background (Streptococcus pneumoniae) | Various | This paper | NCBI Taxon: 1313 | See Supplementary file 1 |
| Sequence-based reagent | Various oligonucleotides | This paper (Sigma-Aldrich) | Primers for cloning | See Supplementary file 2 |
| Chemical compound, drug | D-Luciferine | Synchem | bc219; CAS: 115144-35-9 | |
| Software, algorithm | FIJI | doi:10.1038/nmeth.2019 | RRID:SCR_002285 | |
| Software, algorithm | Oufti | doi:10.1111/mmi.13264 | RRID:SCR_016244 | |
| Software, algorithm | BactMAP | doi:10.1111/mmi.14417 | https://github.com/veeninglab/BactMAP | |
| Software, algorithm | SuperSegger | doi:10.1111/mmi.13486 | https://github.com/wiggins-lab/SuperSegger |
Additional files
-
Supplementary file 1
Strains used in this study (MS excel file).
- https://cdn.elifesciences.org/articles/58771/elife-58771-supp1-v2.xlsx
-
Supplementary file 2
Oligonucleotides used in this study (MS excel file).
- https://cdn.elifesciences.org/articles/58771/elife-58771-supp2-v2.xlsx
-
Transparent reporting form
- https://cdn.elifesciences.org/articles/58771/elife-58771-transrepform-v2.pdf
Download links
A two-part list of links to download the article, or parts of the article, in various formats.
Downloads (link to download the article as PDF)
Open citations (links to open the citations from this article in various online reference manager services)
Cite this article (links to download the citations from this article in formats compatible with various reference manager tools)
Unbiased homeologous recombination during pneumococcal transformation allows for multiple chromosomal integration events
eLife 9:e58771.
https://doi.org/10.7554/eLife.58771


