Converting endogenous genes of the malaria mosquito into simple non-autonomous gene drives for population replacement
- Department of Life Sciences, Imperial College London, United Kingdom
Figures
Figure 1
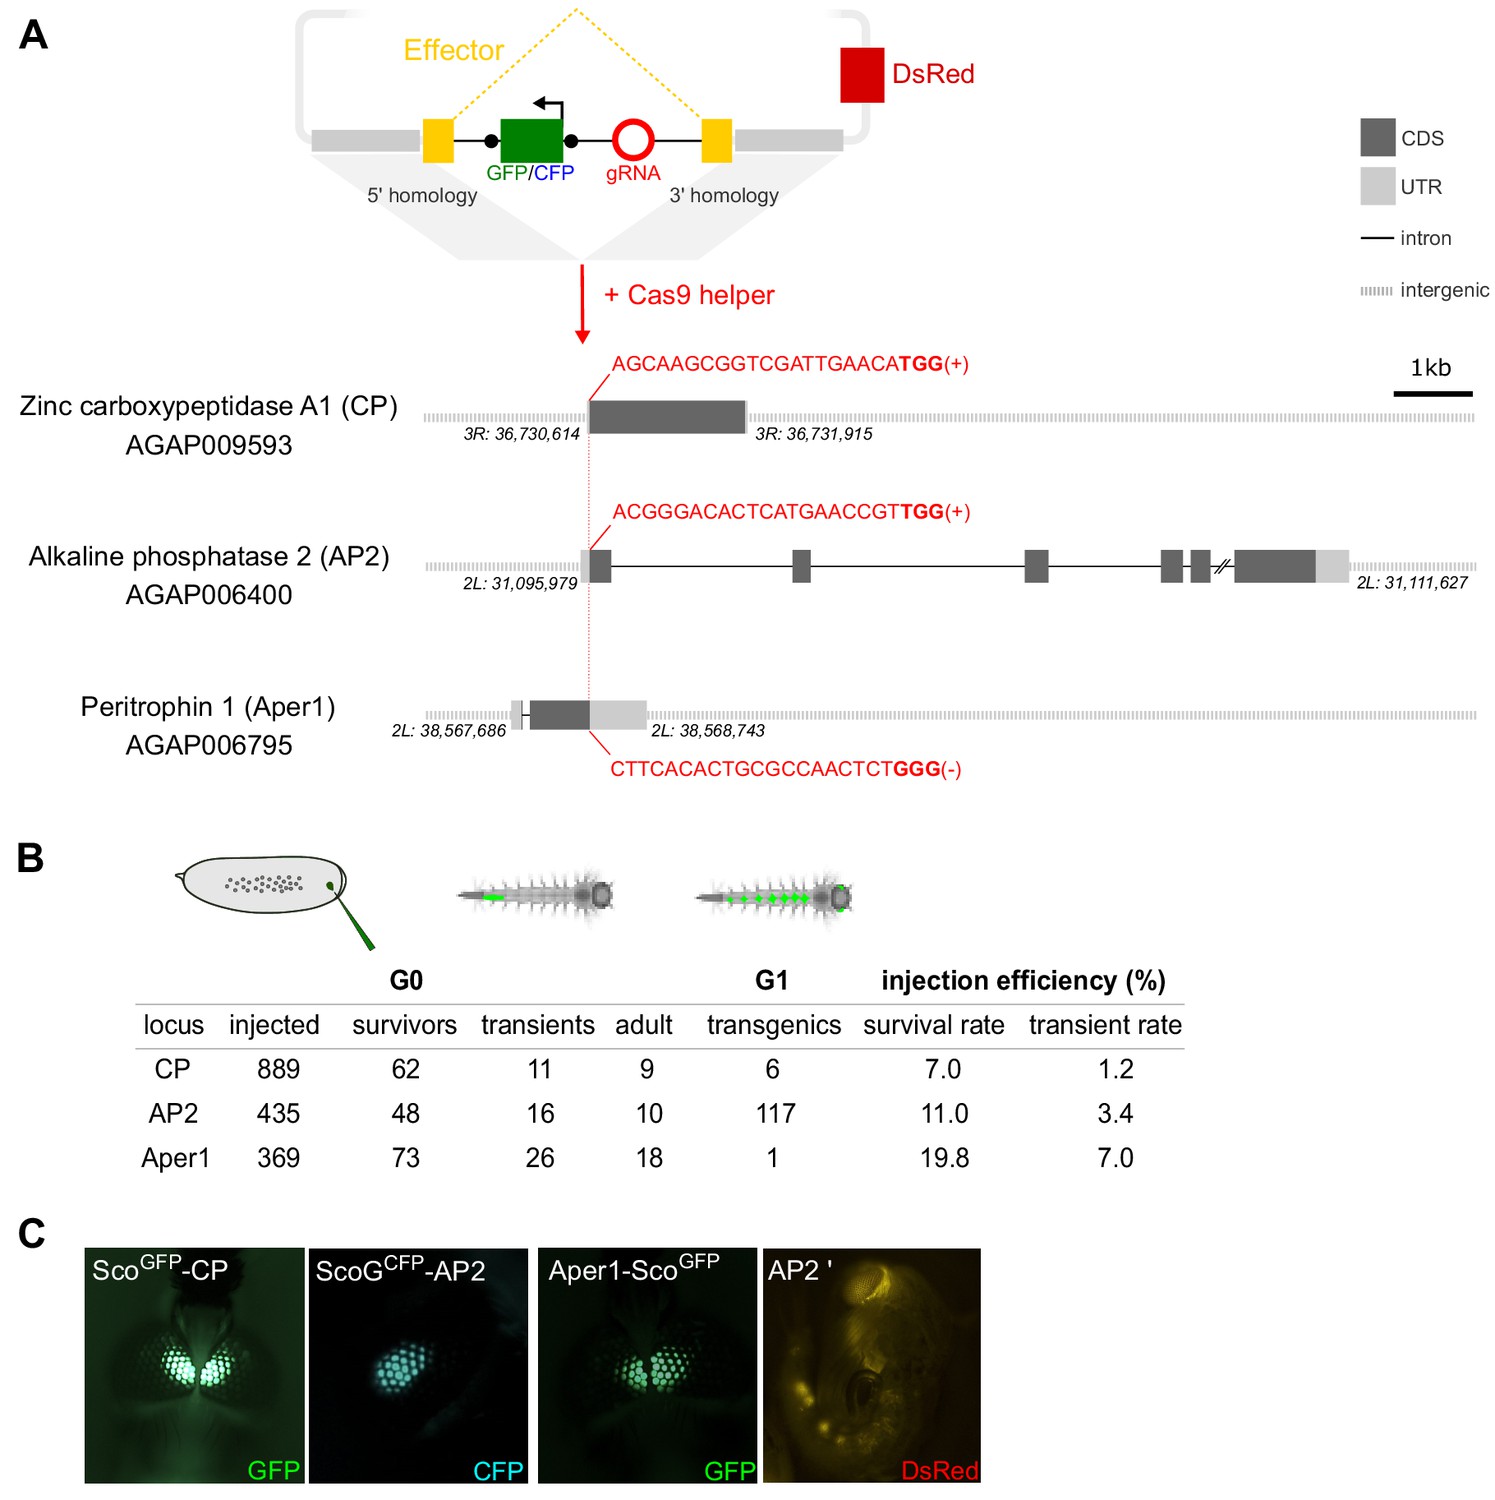
Homology-directed modification of Anopheles gambiae midgut loci by CRISPR/Cas9.
(A) Schematic showing the insertion of the effector construct at the carboxypeptidase (CP), alkaline phosphatase 2 (AP2), and peritrophin 1 (Aper 1) loci. The donor plasmid supplies the effector coding sequence (yellow), which accommodates an artificial intron. The intron harbours a fluorescent marker (either GFP or CFP, green) under the control of the 3xP3 promoter flanked by loxP sites (black dots) and a U6 driven guide-RNA module (red), required for both transgenesis and subsequently for gene drive. The plasmid features regions of homology that drive N- or C-terminal insertion at the start (CP, AP2) or stop codon (Aper1) as well as a 3xP3::DsRed plasmid-backbone marker. The gRNA target sequence (red) including the PAM motif (bold) and the target strand are indicated. (B) Summary of embryo microinjections and the identification of transgenic individuals by fluorescent screening. (C) Adult transgenic mosquitos with fluorescent expression of GFP or CFP in the eyes under the control of the 3xP3 promoter as well as a pupa showing DsRed fluorescence, indicating plasmid-backbone integration (AP2’).
Figure 2 with 1 supplement

Generation of minimal genetic modifications.
(A) Schematic showing the inserted transgene constructs within the exon structure of the CP, AP2, and Aper1 loci prior and following the excision of the marker gene by Cre recombinase (top) and the observed changes in green or cyan fluorescence in L3 larvae (bottom). Half arrows indicate primers for the PCRs shown in panel C and white arrows indicate the eyes in the markerless individuals. 2A indicates the F2A self-cleaving peptide signal. (B) Crossing scheme used for the establishment of markerless strain Sco-CP by crossing to a Cre recombinase expressing strain. Non-fluorescent adults were allowed to hatch individually, and their pupal cases were used for genotyping. (C) PCR genotyping of genomic DNA of homozygous individuals of all strains with primer-pairs (shown in A) spanning the three loci. The entire locus could not be amplified in strain ScoGCFP-AP2 that contains both GFP and CFP, and hence separate 5’ and 3’ fragments were analysed by PCR.
Figure 2—figure supplement 1
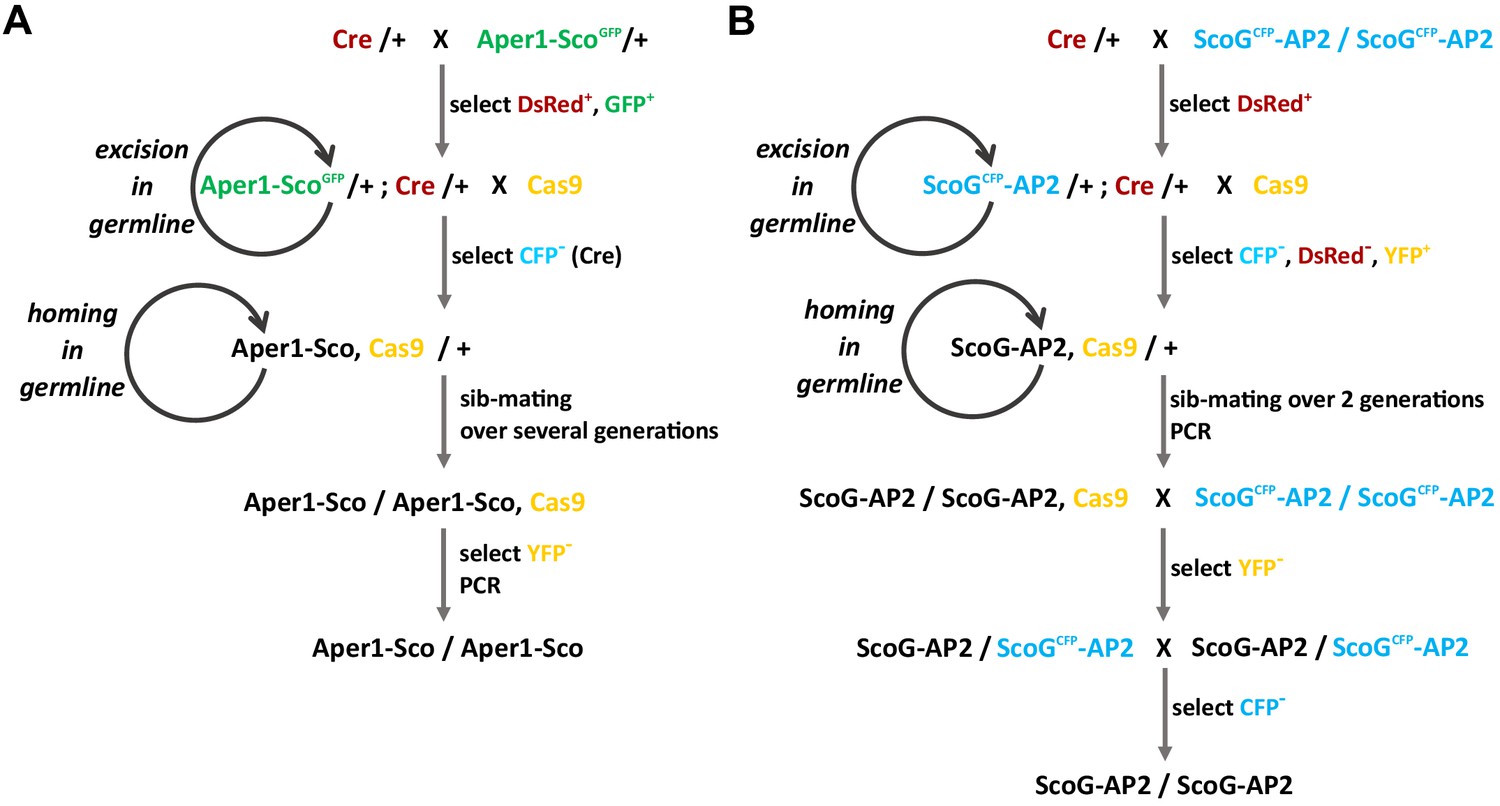
Crossing schemes used for the establishment of markerless strains.
The strains Aper1-Sco (A) and ScoG-AP2 (B) were rendered homozygous by first crossing to a Cre recombinase and then a Cas9 expressing strain and by employing positive and negative selection via the fluorescent markers at each stage.
Figure 3 with 1 supplement
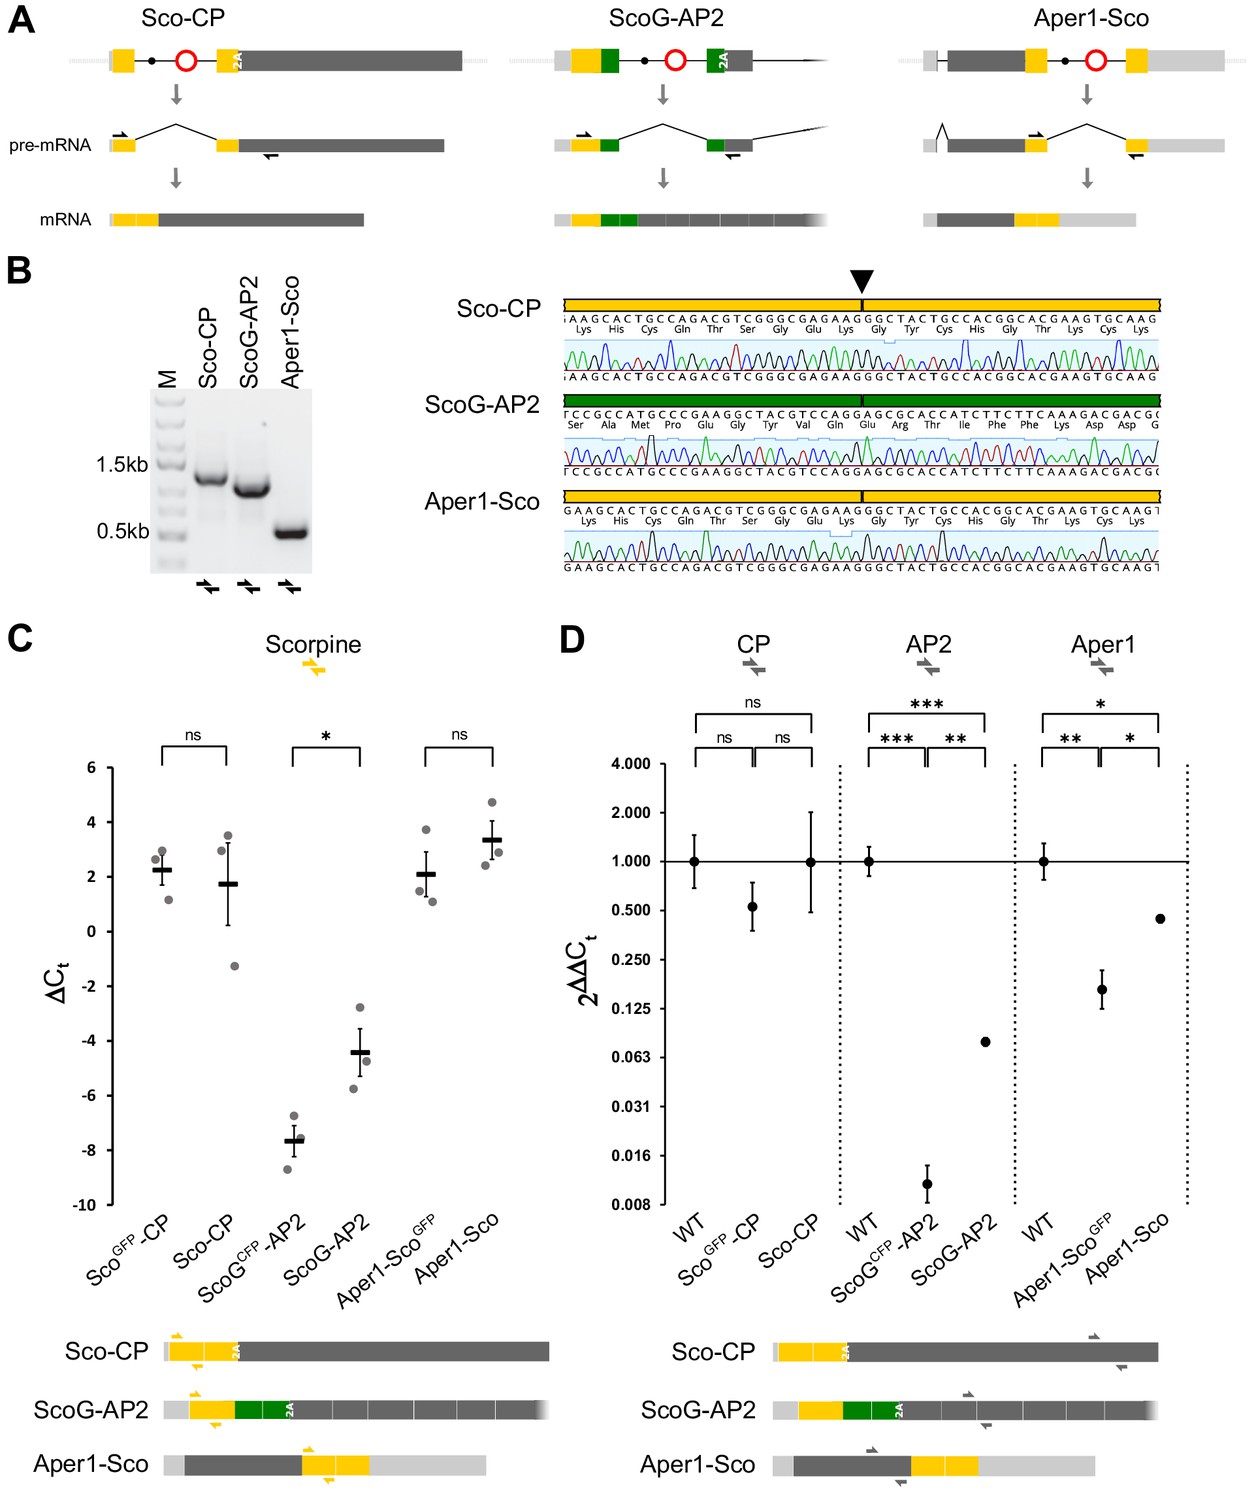
Splicing of the artificial intron and expression analysis.
(A) Schematic showing mRNA expression of the modified host genes of the three markerless strains assuming correct splicing of the artificial intron. Black arrows indicate RT-PCR primers used in B. (B) RT-PCR (left) and sequencing of the amplicons (right) indicate precise splicing of the three artificial introns. Midguts of homozygous strains Sco-CP, ScoG-AP2, and Aper1-Sco were dissected 3 hr after blood feeding and RNA was extracted for RT-PCR. (C) Relative mRNA expression of Scorpine in the transgenic strains with and without the marker cassette. (D) Expression of the host genes CP, AP2, and Aper1 in transgenic strains with and without the marker cassette relative to the wild type. RNA was extracted from 10 to 15 midguts 3 hr after the blood meal in the case of CP and Aper1, and non-blood-fed for AP2. qPCR with the primer pairs indicated as coloured half arrows in the schematic below was conducted on cDNA and expression was normalized to the S7 house-keeping reference gene. Data derive from three biological replicates with three technical replicates each. p-values were calculated on ΔCt values using the unpaired Student’s t-test. *p≤0.05, **p≤0.01, ***p≤0.001, ****p≤0.0001, and ns: not significant.
Figure 3—figure supplement 1
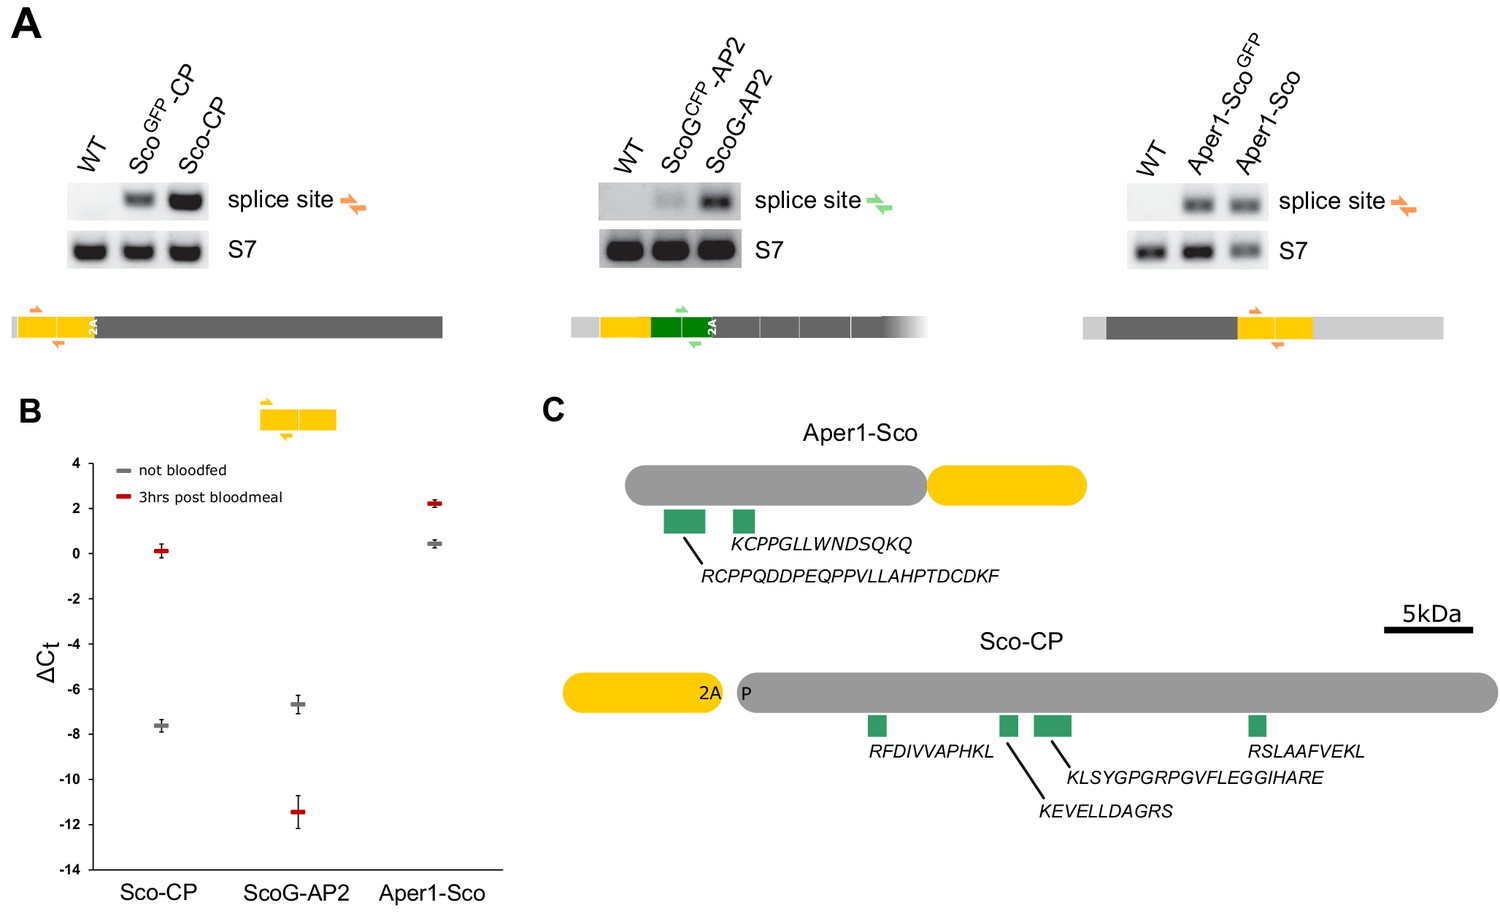
Scorpine expression levels and mass spectrometry of co-opted host genes.
(A) RT-PCR with primers spanning the splice site (indicated as half arrows in the schematic below) on 3 hr blood-fed guts. (B) qPCR for the integrated Scorpine sequence was performed on cDNA from both non-blood-fed guts and guts dissected 3 hr after blood-feed of all three markerless transgenic strains. The primer-pair binding to Scorpine is indicated as yellow half arrows in the inset. Error bars indicate standard deviation from three technical replicates normalized to the S7 reference gene. G3 wild-type controls (blood-fed and non-blood-fed) run in parallel were negative (Ct mean values above 35). (C) Peptides identified in mass-spectrometry that map to the endogenous host genes. Proteins were extracted from non-blood-fed guts of the homozygous transgenic lines Sco-CP and Aper1-Sco. Note that Sco-CP (but not Aper1-Sco) is expected to generate two protein products due to the presence of the 2A peptide. Green rectangles indicate high confidence peptides with amino acid sequences shown below.
Figure 4 with 1 supplement
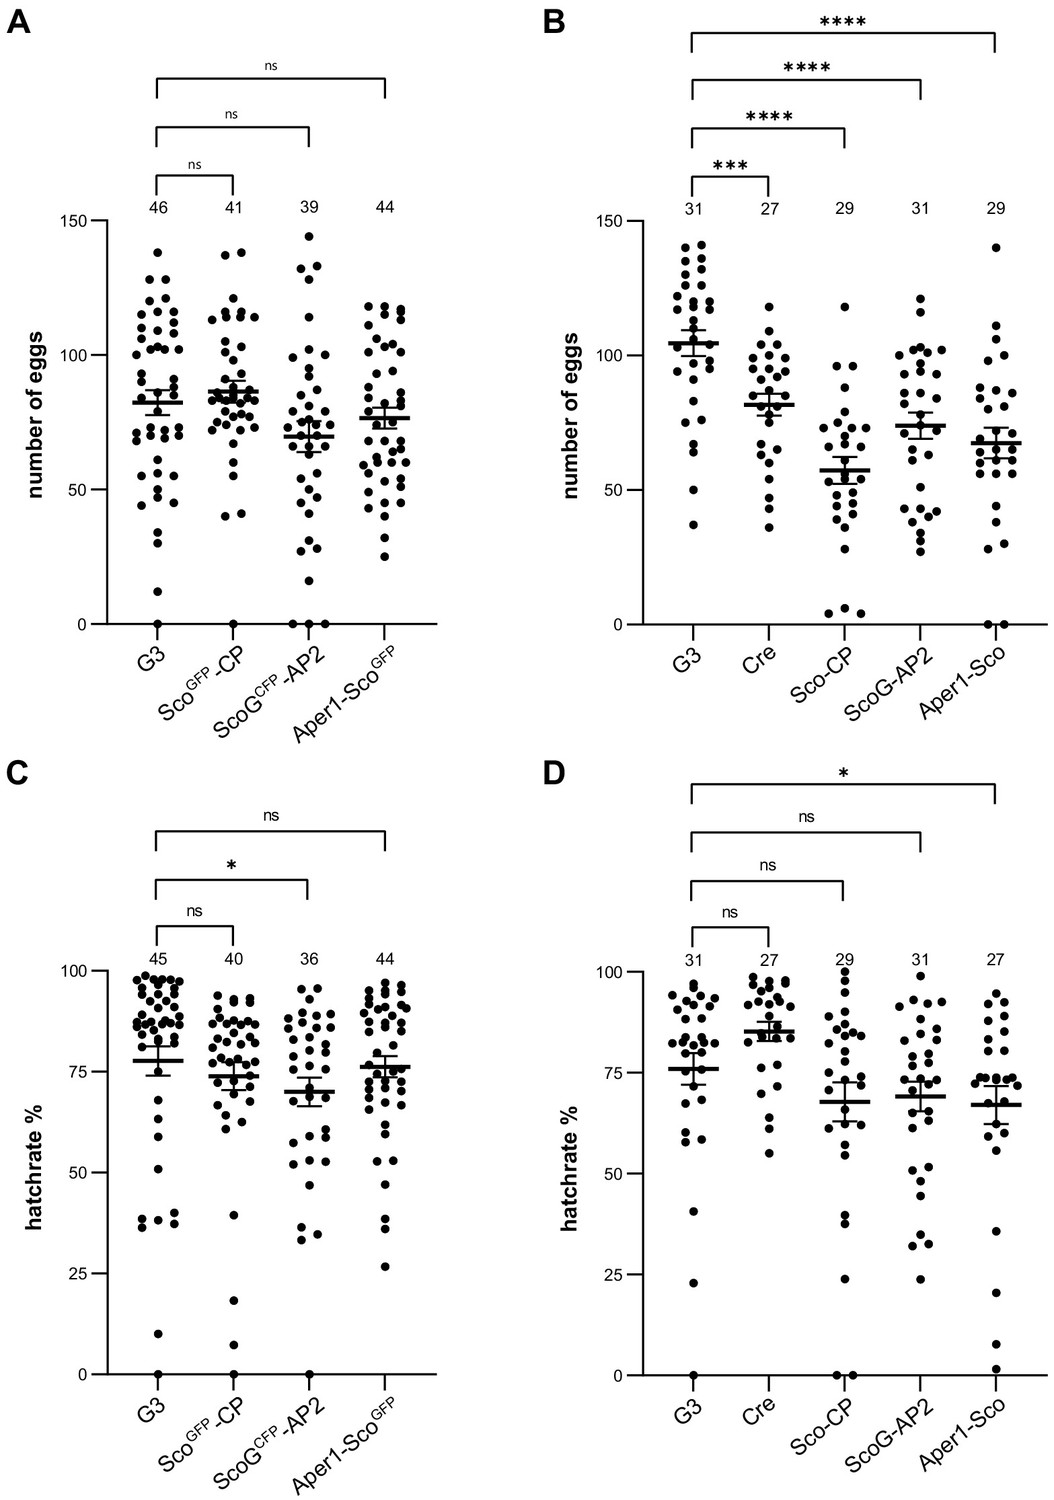
Fecundity and larval hatch rates of the transgenic strains.
Fecundity of single females of the homozygous strains ScoGFP-CP, ScoGCFP-AP2, and Aper1-ScoGFP(A) and the markerless strains Sco-CP, ScoG-AP2, and Aper1-Sco (B) compared to the G3 wild-type and the vasa-Cre strain (KIL background) used to remove the marker module. All data sets have a Gaussian distribution according to the Shapiro–Wilk test, except of ScoGFP-CP. p-values were calculated using the unpaired two-tailed Student’s t-test. Larval hatch rates of the transgenic strains with (C) and without (D) the marker, as well as the control strains, from the eggs above. None of the data sets showed a Gaussian distribution according to Shapiro–Wilk, and the p-values were calculated using the Kolmogorov–Smirnov test. Data from three biological replicates were pooled and the total number analysed is indicated on top. Mean with standard error (SEM) were plotted. *p≤0.05, **p≤0.01, ***p≤0.001, ****p≤0.0001, and ns: not significant.
Figure 4—figure supplement 1
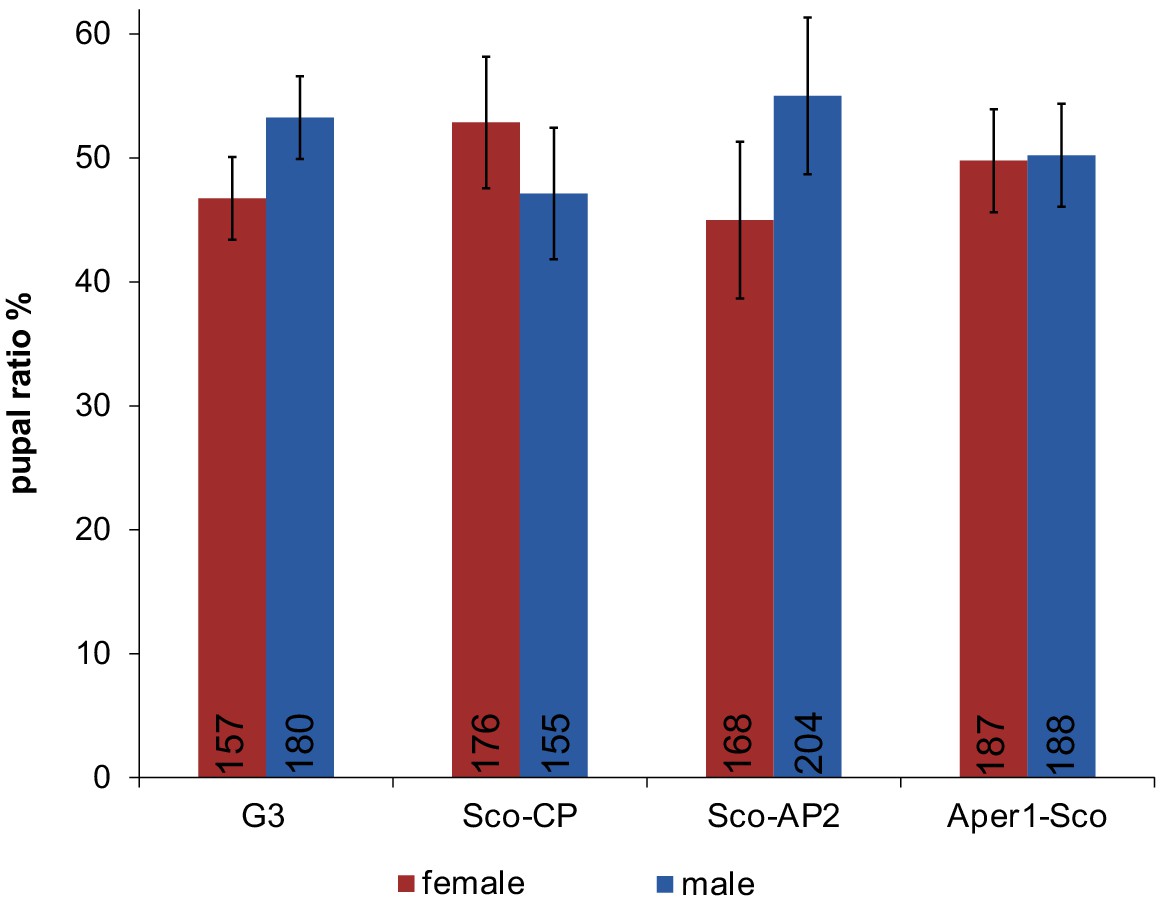
Pupal sex ratio.
Pupal sex ratio of the homozygous markerless transgenic strains Sco-CP, Sco-AP2, and Aper1-Sco compared to the G3 wild-type control. No statistically significant deviation from an expected 1:1 sex ratio was detected (chi-squared test). Error bars represent standard deviation from three biological replicates and the number of counted individuals is indicated (n).
Figure 5
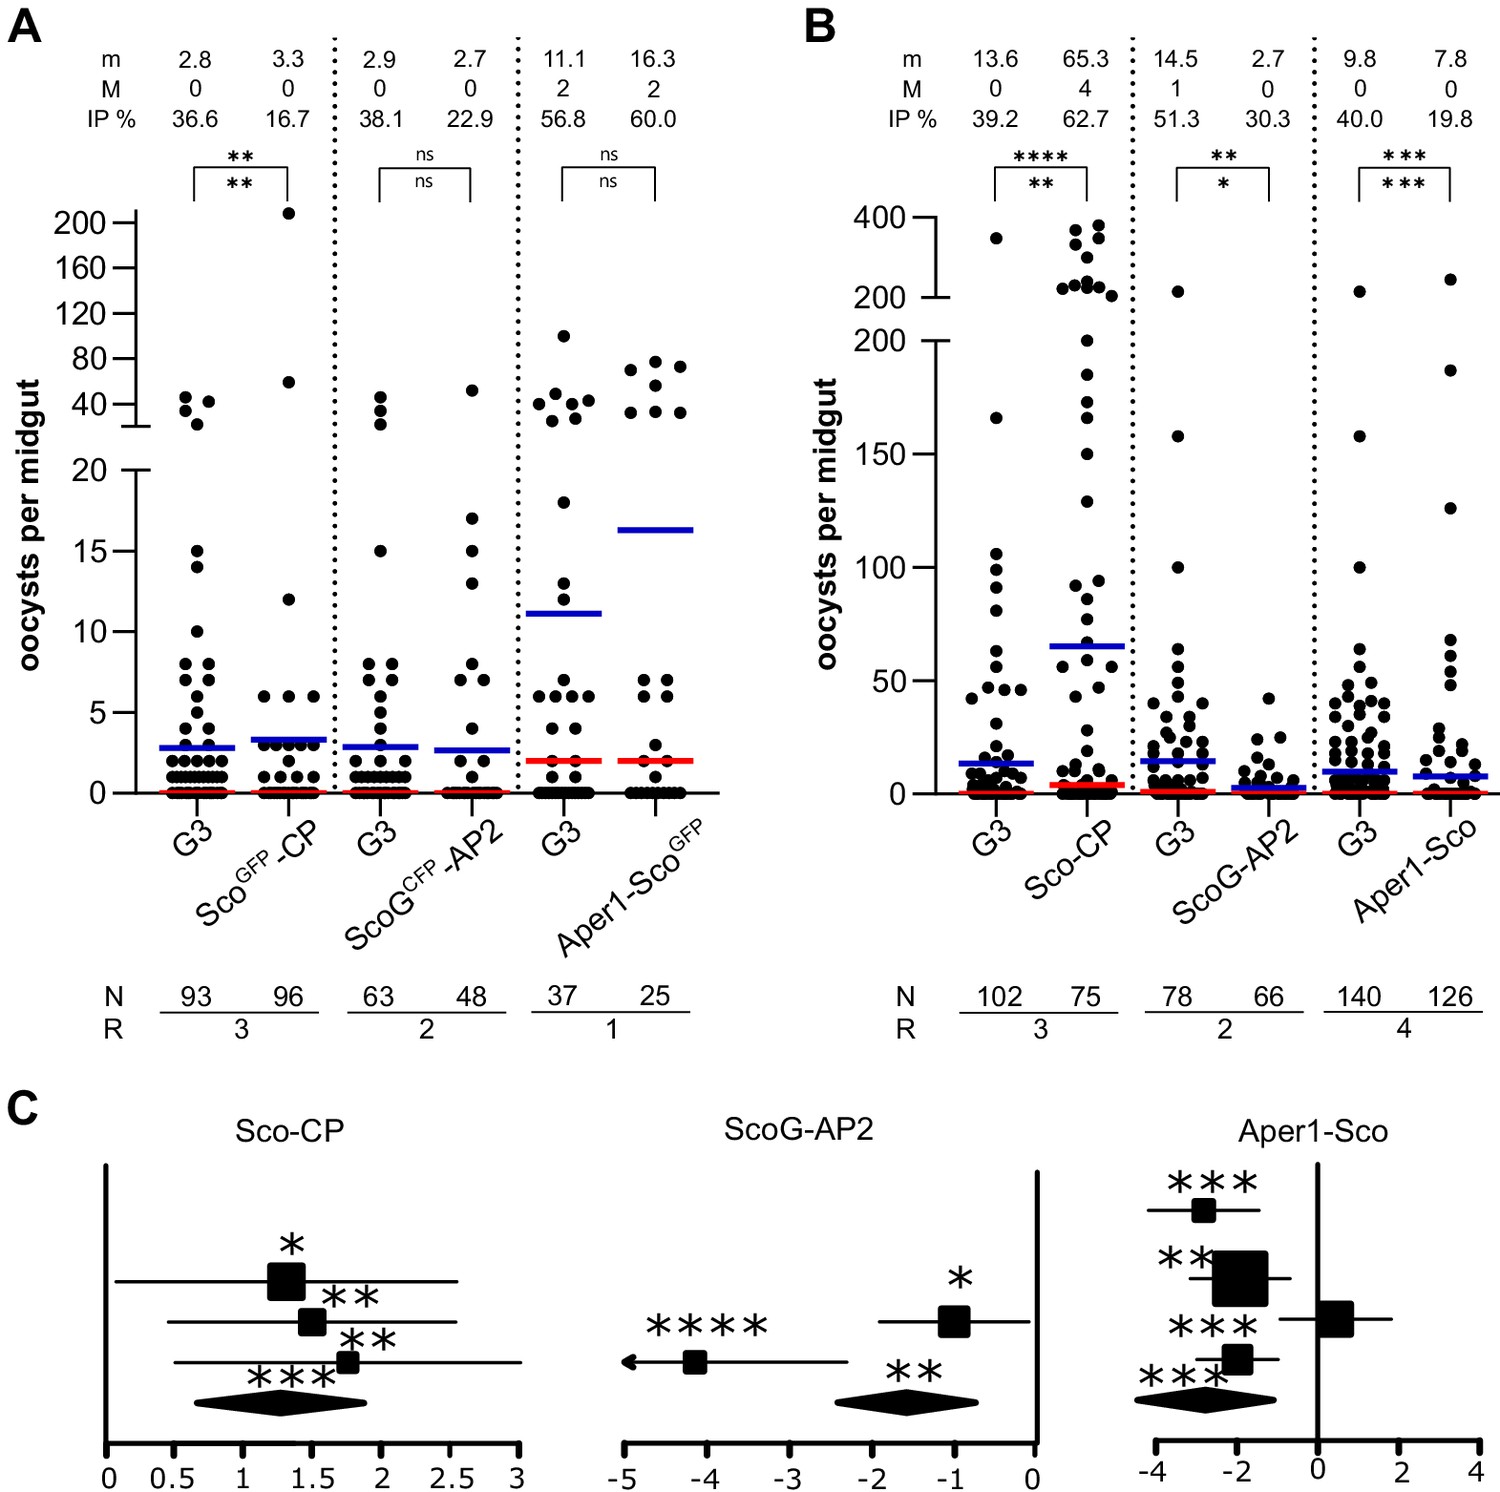
Transmission blocking assay.
Standard membrane feeding assay with P. falciparum using the homozygous transgenic strains with the marker-module (A) and the corresponding markerless strains (B). Infection intensity is measured by the number of oocysts in each gut and the mean (m, blue bar) and median (M, red bar) are shown on top, as well as the infection prevalence (IP). The statistical significance of the infection intensity (stars above the bar) and IP (below) were calculated with the Mann–Whitney test and the chi-squared test, respectively. N is the number of mosquitoes analysed and R is the number of replicates performed. (C) Analyses of data plotted in (B) via a generalized linear mixed model (GLMM). The variation in the fixed effect estimates for each replicate (squares) and all replicates (diamonds) are shown as forest plots (95% confidence interval, glmmADMB). The square size is proportional to the sum of midguts analysed in each replicate. *p≤0.05, **p≤0.01, ***p≤0.001, ****p≤0.0001, and ns: not significant.
Figure 6 with 3 supplements
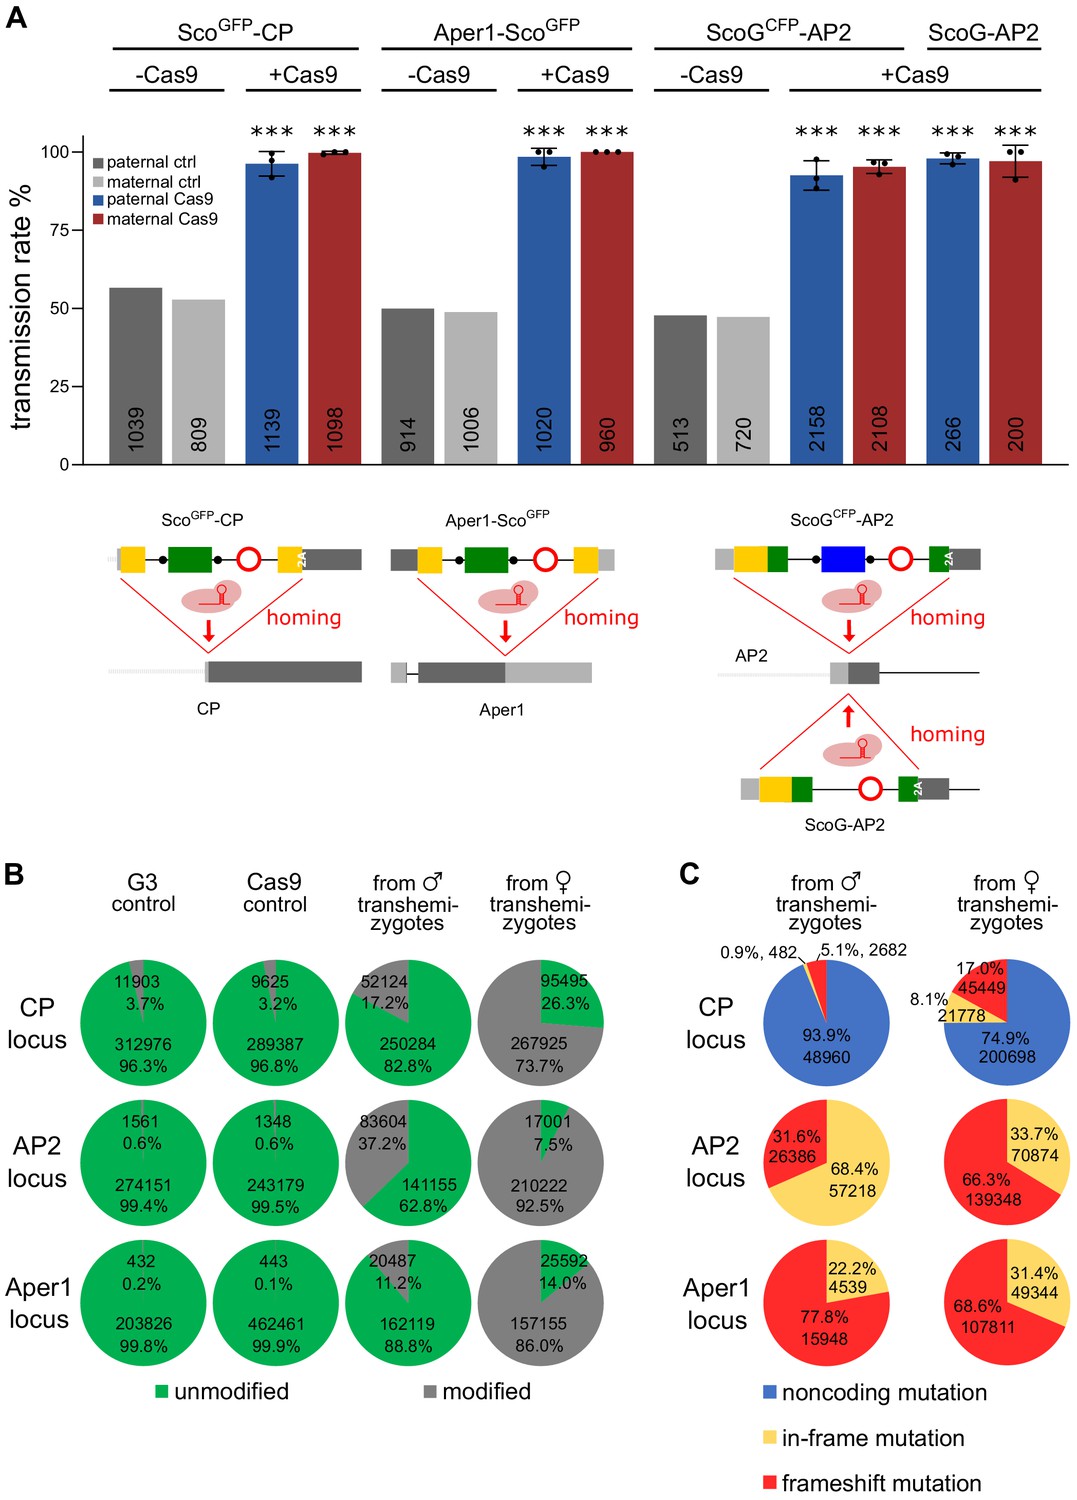
Assessment of non-autonomous gene drive of the modified host genes.
(A) Homozygous individuals of strains ScoGFP-CP, ScoGCFP-AP2, and Aper1-ScoGFP or the markerless strain ScoG-AP2 were crossed to the vasa-Cas9 strain to assess the homing potential induced by the intronic guide RNAs. As a control, hemizygous individuals lacking Cas9 were crossed to WT. In each case homing was measured by the rate of fluorescent larvae recorded in the progeny with the exception of the markerless strain ScoG-AP2 where it was assessed via PCR genotyping of the progeny. Mean and standard deviation from three biological replicates are plotted and the number n is indicated at the base of the column. All comparisons to the control crosses were significant (p<0.0001, chi-squared test). The data is found in Supplementary file 1 - Supplementary Tables 4 and 5. (B) Amplicons from PCRs over the predicted cut site within the three loci performed on pooled progeny from transhemizygotes were subjected to next generation sequencing. G3 and Cas9 served as controls. Overall number of reads and the percentage of reads with modifications in the quantification window are shown. (C) Predicted classes of modifications represented within the set of modified alleles for each locus.
Figure 6—figure supplement 1
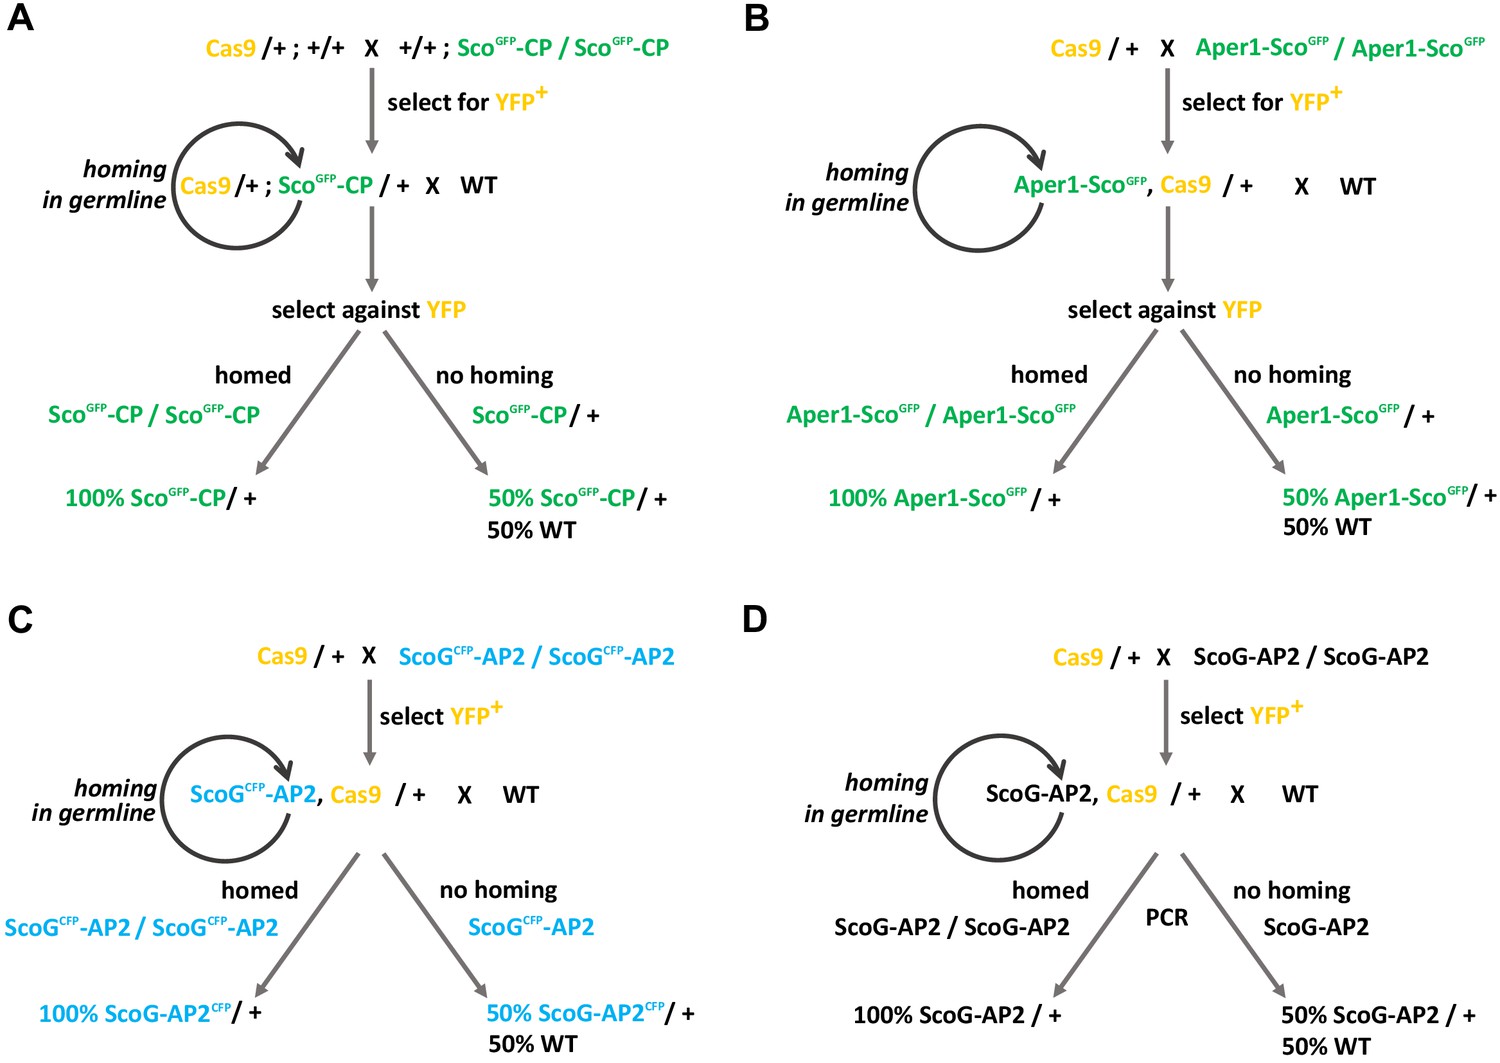
Crossing schemes for assessing the homing rate.
The non-homing vasa-Cas9-line carrying a 3xP3-YFP marker was crossed to the transgenics. If homing in the germline occurs, all progeny from the cross to WT will be heterozygotes. In the case of ScoGFP-CP (A) and Aper1-ScoGFP (B), only the larvae without the Cas9 transgene can be considered for the assessment due to an overlap of fluorescent markers in the GFP channel, whereas for ScoGCFP-AP2 (C) there was no overlap. ScoG-AP2 (D) was screened via PCR.
Figure 6—figure supplement 2
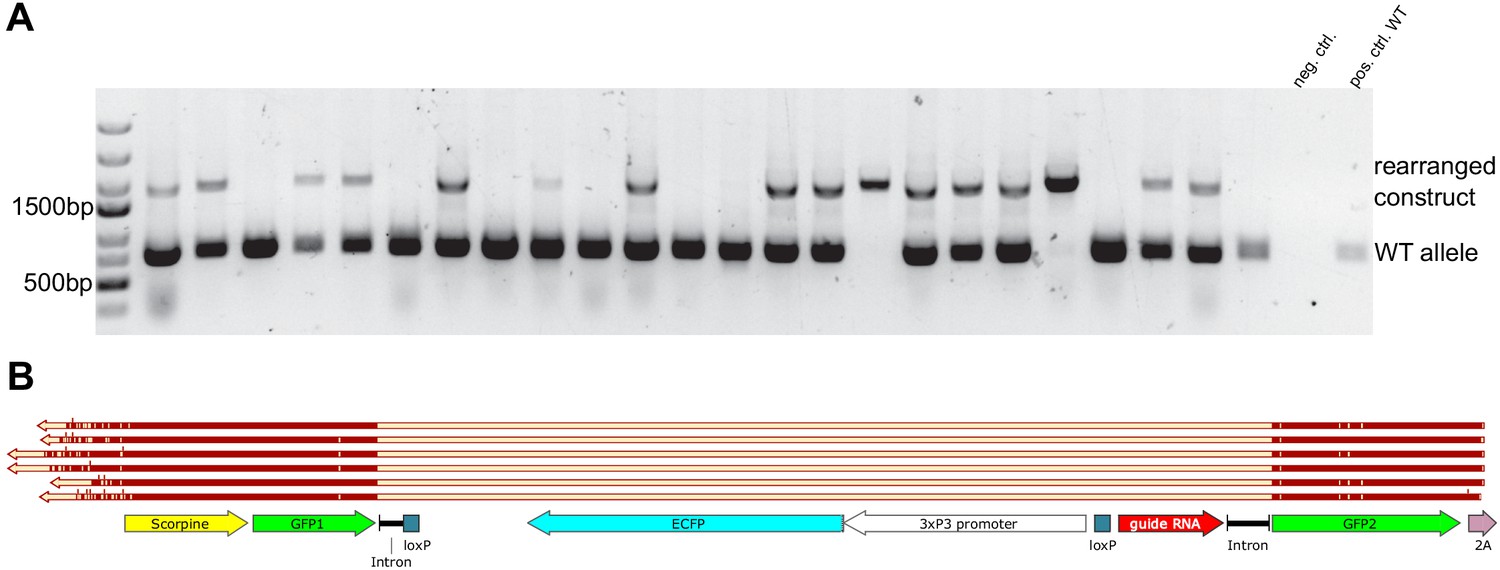
Analysis of rearrangements in ScoGCFP-AP2 following Cas9 cleavage.
(A) PCR analysis of non-fluorescent offspring from the cross of ScoGCFP-AP2/Cas9 to WT with primers spanning the locus showed that the majority of individuals carries an insertion but of reduced size. (B) Sequencing result of the upper band identified in the PCR suggests the loss of the intron cassette as well as a recombination and sequence exchange between the GFP and CFP coding sequences.
Figure 6—figure supplement 3
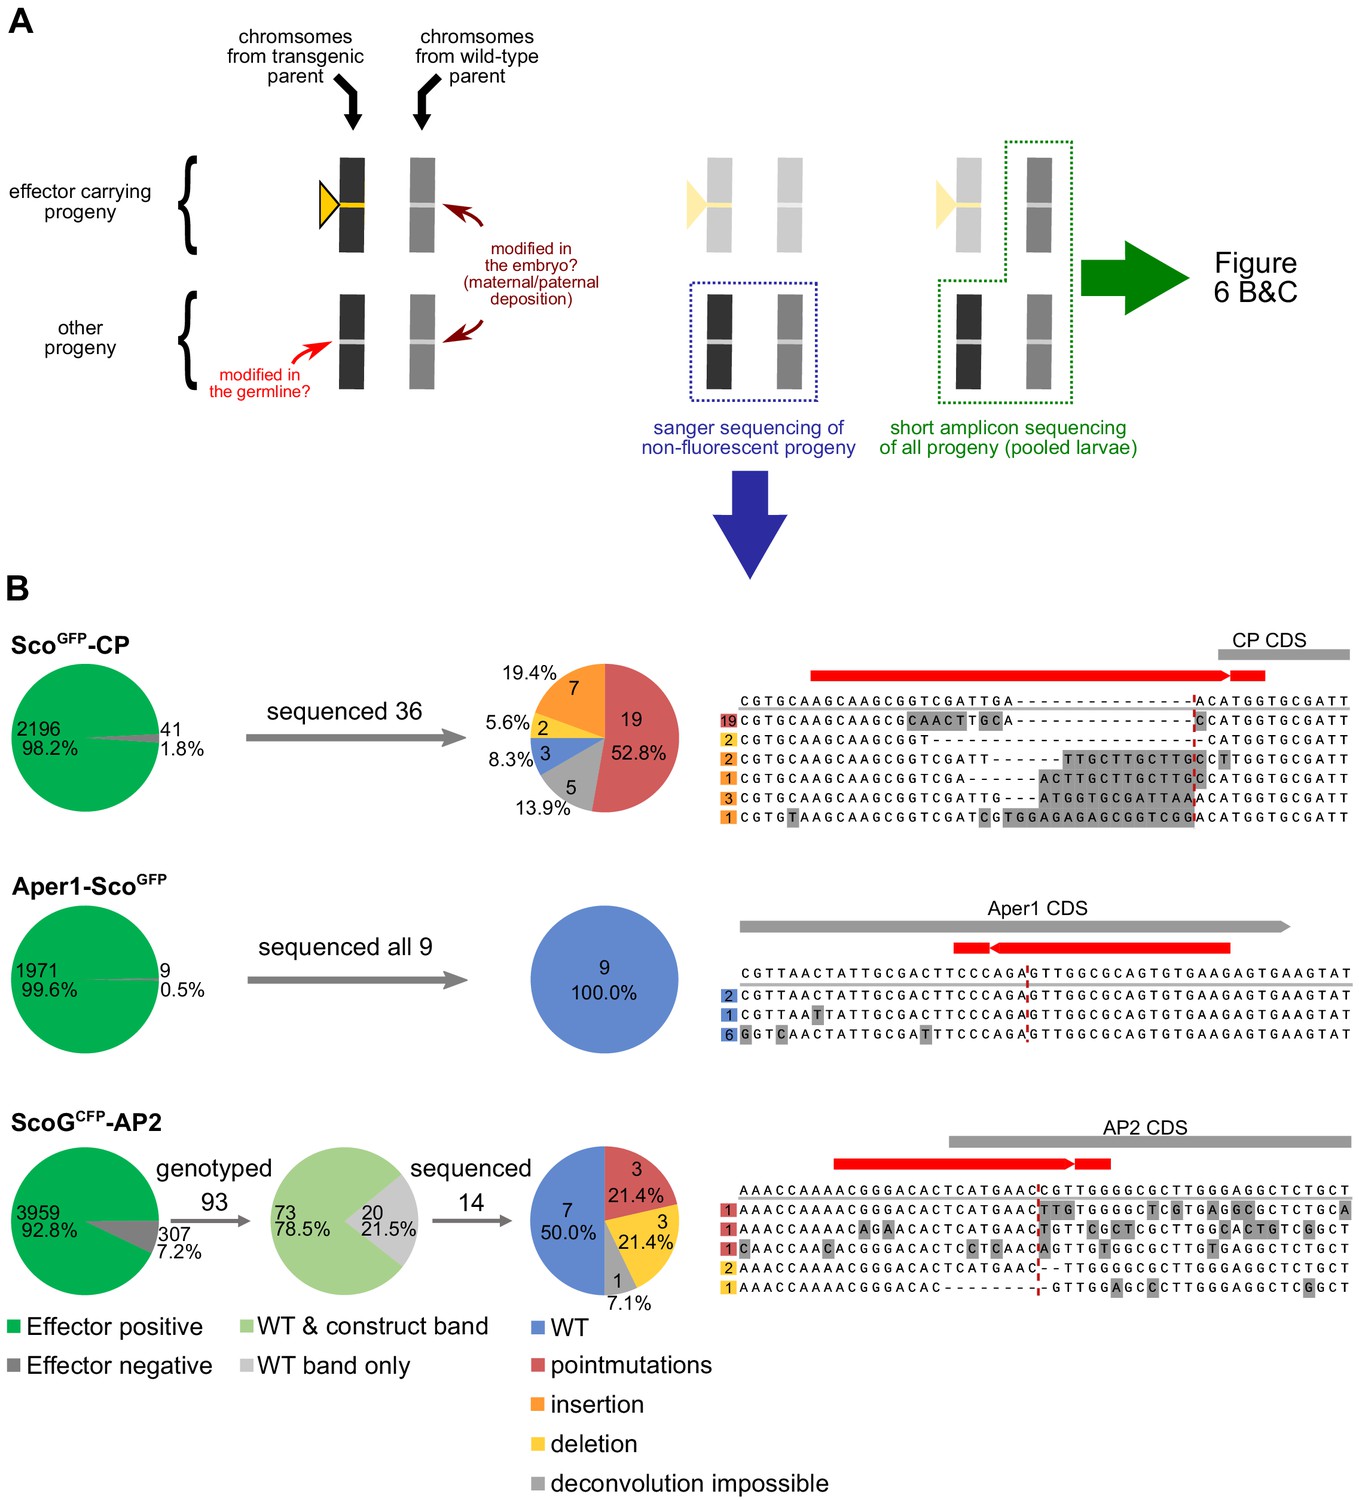
Sanger sequencing of non-fluorescent individuals.
(A) Schematic explaining the difference between the sets of chromosomes subjected to Sanger and amplicon sequencing. (B) Non-fluorescent individuals identified in the homing assay (shown in grey in the first pie chart) were subjected to PCR over the gRNA target side, the products were Sanger sequenced, and the results were categorized (shown in the final pie chart). The corresponding alignments are shown to the right, with the number of occurrences of each particular sequence indicated in the coloured square before the sequence. Only few non-fluorescent individuals were found for ScoGFP-CP and Aper1-ScoGFP and they were not genotyped further for the construct. ScoGCFP-AP2 had to be genotyped by multiplex PCR first, which either gave bands for the WT and the construct or for the WT only. Subsequently only individuals that solely gave the WT band were sequenced. SNPs are indicated with a grey background, deletions are represented by a dash, and the red dashed line indicates the cleavage site.
Additional files
-
Supplementary file 1
Supplementary Tables S1–S7.
Table S1. Guide RNA and target site characteristics. The start codon of the target gene is indicated within the gRNA sequence (bold) and the protospacer adjacent motif (PAM) separated via a hyphen. All predicted off-target cleavage sites were found to be located in non-coding (NC) regions and the number of mismatches (MM) is indicated. The number of SNPs within the 24 individuals of the G3 strain and within the Ag1000G is indicated. The SNPs observed for CP in the Ag1000G did not pass the quality control. Table S2. Primers used in this study. Table S3. Plasmids used in this study. Table S4. Transmission rate of control-crosses without Cas9. Table S5. Transmission rates and homing rates. Epos and Eneg refer to individuals with or without the effector construct, respectively. The homing rate e was calculated as follows: e = (n*0.5–Eneg)/(n*0.5)*100. Table S6. Modified sequences identified in the Amplicon sequencing. Table S7. Raw data of the transmission blocking assay.
- https://cdn.elifesciences.org/articles/58791/elife-58791-supp1-v1.xlsx
-
Supplementary file 2
GenBank-DNA-files of donor plasmids pD-Sco-CP, pD-ScoG-AP2, and pD-Aper1-Sco.
- https://cdn.elifesciences.org/articles/58791/elife-58791-supp2-v1.zip
-
Transparent reporting form
- https://cdn.elifesciences.org/articles/58791/elife-58791-transrepform-v1.docx
Download links
A two-part list of links to download the article, or parts of the article, in various formats.
Downloads (link to download the article as PDF)
Open citations (links to open the citations from this article in various online reference manager services)
Cite this article (links to download the citations from this article in formats compatible with various reference manager tools)
Converting endogenous genes of the malaria mosquito into simple non-autonomous gene drives for population replacement
eLife 10:e58791.
https://doi.org/10.7554/eLife.58791


