Cell-cycle-gated feedback control mediates desensitization to interferon stimulation
- Section of Molecular Biology, Division of Biological Sciences, University of California, San Diego, United States
- Department of Bioengineering, University of California, San Diego, United States
- Department of Chemistry and Biochemistry, University of California, San Diego, United States
- Department of Pathology, Moores UCSD Cancer Center, University of California, San Diego, United States
Figures
Figure 1 with 4 supplements
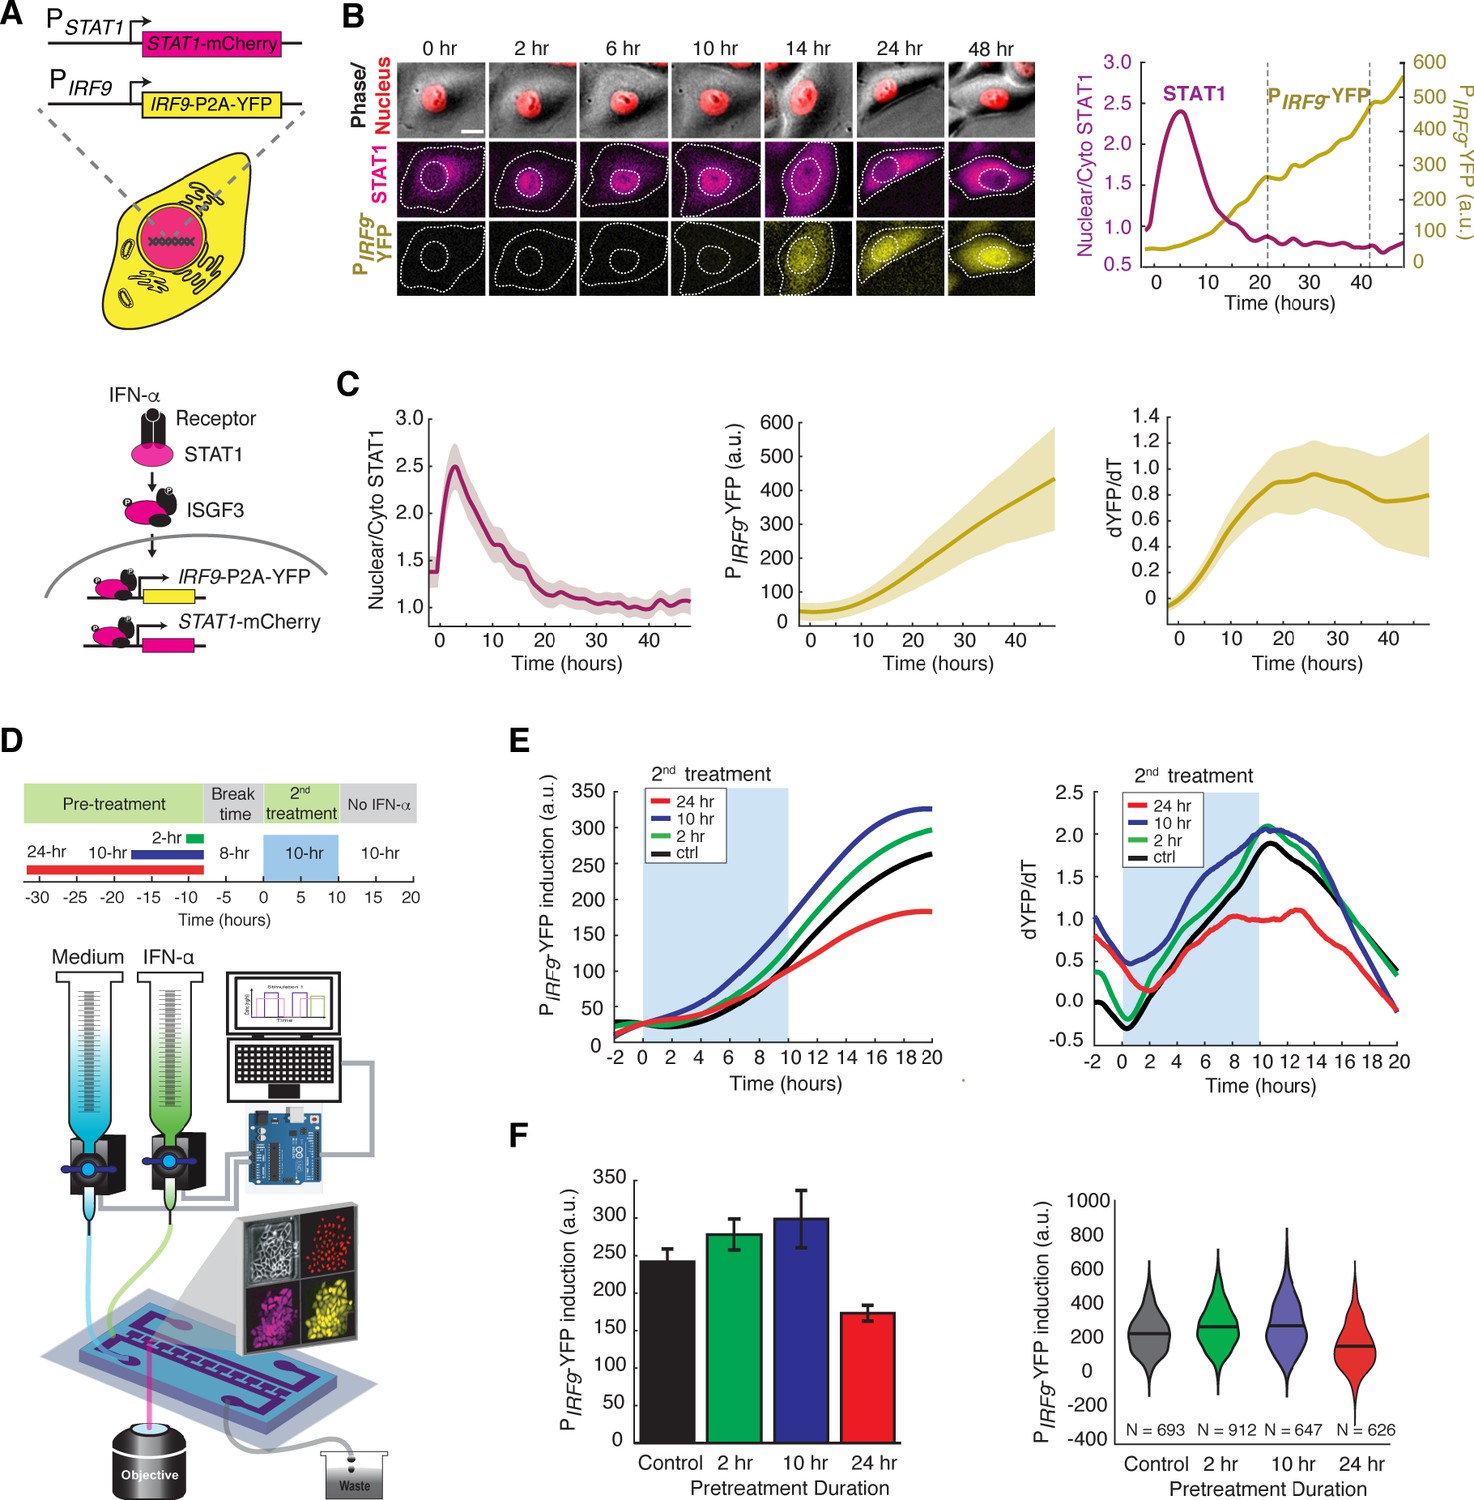
IFN-α pretreatments with different durations lead to opposite effects to the second stimulation.
(A) Schematic of HeLa reporter cell line engineered using CRISPR/Cas9 (top). STAT1 was tagged with mCherry at C-terminus to monitor the translocation and expression. The coding sequence for P2A-YFP was inserted at the C-terminus of IRF9 coding sequence to generate a transcription reporter (PIRF9). A simplified diagram of the IFN-α pathway components that can be monitored using the reporter cell line (bottom). (B) Time lapse images of a representative cell treated with 100 ng/ml IFN-α for 48 hrs. Scale bar: 20 μm. The time traces of nuclear/cytoplasmic STAT1-mCherry and PIRF9-YFP signals of the cell are shown on the right. Vertical dashed lines represent cell divisions. (C) Averaged time traces of nuclear/cytoplasmic STAT1-mCherry, PIRF9-YFP, and the time derivative of PIRF9-YFP (dYFP/dt) (n = 257 cells). Data are represented as the mean (solid lines) and + standard deviation (SD) (shaded areas). (D) Schematic of IFN-α pretreatment experiments (top). Cells were pretreated with 100 ng/ml IFN-α for 0, 2, 10 and 24 hrs followed by 8 hrs of break time and re-stimulated with 100 ng/ml IFN-α for an additional 10 hrs. Bottom: A diagram of the microfluidic set-up. Two syringes filled with culture medium with or without IFN-α were connected to programmable Arduino-controlled valves that control the duration of IFN-α treatments. Images were captured every 5 min throughout the entire experiment that lasted for a total of 52 hr. (E) Averaged time traces of PIRF9-driven YFP induction (left) and the rate of induction (dYFP/dt, right) in response to the second IFN-α treatment under different pretreatment conditions. For PIRF9-YFP induction, the baselines at the beginning of the second stimulation were normalized to the same level for the comparison of induction levels under different pretreatment conditions. Results were from at least three independent experiments. (F) Amounts of PIRF9-YFP induction by the second IFN-α stimulation under different pretreatment conditions were shown in bar graph (left) and violin plot (right). The bar showed the averages from three independent experiments, represented as mean + standard error of the mean (SEM). The differences between the pretreatment conditions and the control are all statistically significant (p<0.001). The violin plots showed the distributions of single-cell responses under different pretreatment conditions. The violin plots cover single-cell data from three independent experiments.
Figure 1—figure supplement 1

Cell line construction and validation.
(A) Illustration of cell line construction steps. Full detail was described in Materials and methods. Fluorescent reporters introduced and the targeted genes are shown. In each step, homogenous clones grew from single cells were carefully validated with PCR and sequencing to determine correct integration and homozygosity. Only one positive clone was selected to proceed with the next step. (B) Schematics of the ACTB (top), STAT1 (middle) and IRF9 (bottom) tagged loci. Sequences of the gRNA along with the recognition direction and the synonymous substitutions to avoid Cas9 recognition are shown. Targeted integration loci and the design of the donor DNA with indicated homology arms along with the inserts are also shown. (C) Representative images of the reporter cell line in response to IFN-α. Cells were treated without or with 100 ng/ml IFN-α for 48 hrs. Scale bar: 20 μm. (D) Time course western blots showing the dynamics of phosphorylation (pY701) and expression of STAT1, and the dynamics of IRF9 expression in the reporter cell line. Cells were treated with 100 ng/ml IFN-α for indicated times, harvested and lysed for immunoblotting with indicated antibodies. The dynamics of the endogenous protein phosphorylation and expression, measured using immunoblotting, are similar to those measured using fluorescence microscopy (compare with Figure 1C).
Figure 1—figure supplement 2
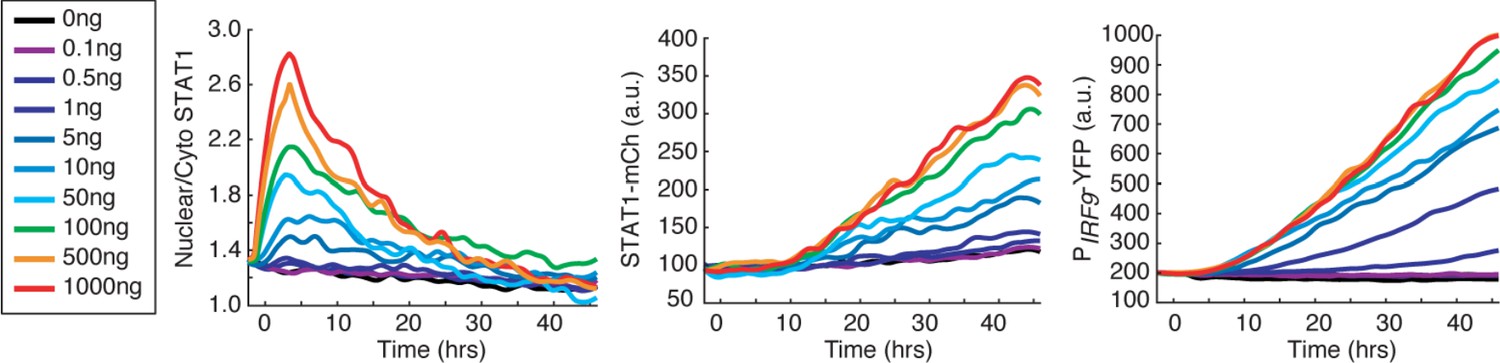
Dose-dependent responses to IFN-α treatment.
Time traces of nuclear to cytoplasmic ratio for STAT1-mCherry, STAT1-mCherry fluorescence, and PIRF9-YFP fluorescence in response to different concentrations (ng/ml) of IFN-α, as indicated. Averages of single-cell traces were shown.
Figure 1—figure supplement 3
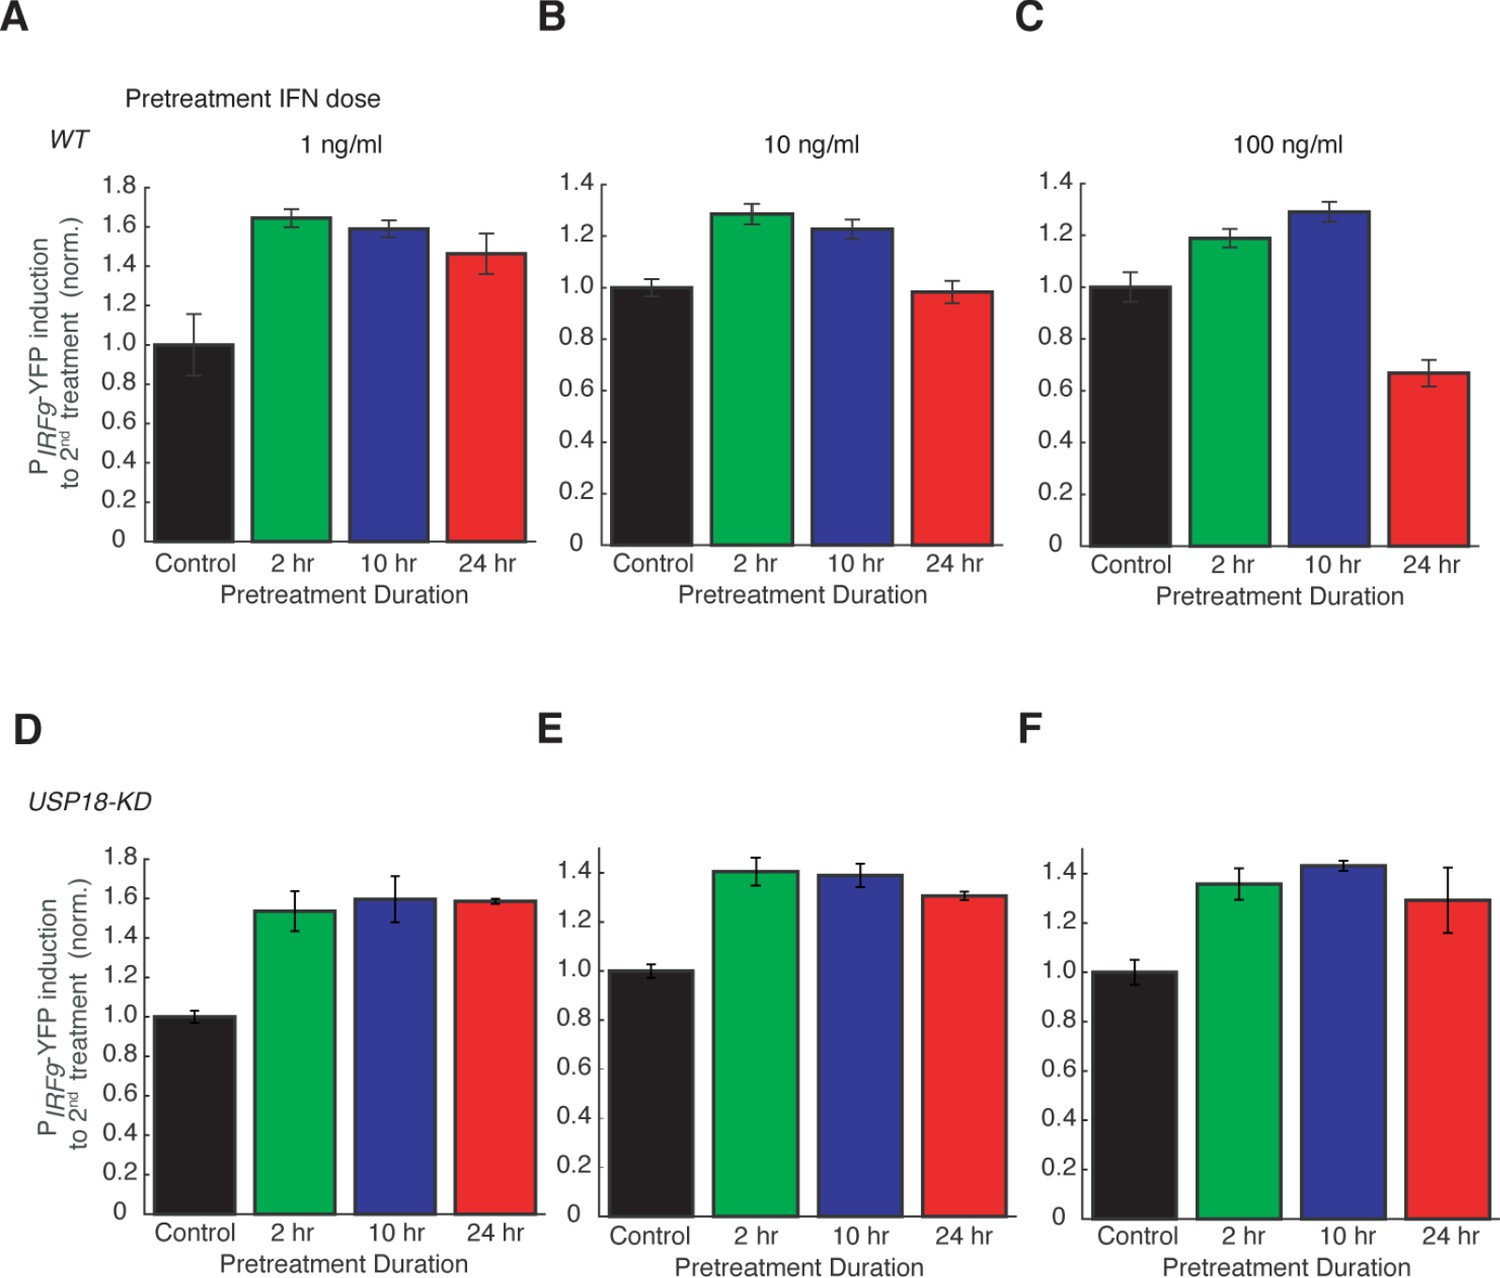
Dose dependence of desensitization to IFN-α treatment.
Bar graphs showing the amounts of PIRF9-YFP induction to the second IFN input (100 ng/ml) in WT (A - C) and USP18-KD (D – F), pretreated with different concentrations of IFN-α for different durations, as indicated. The results were normalized to the non-pretreatment condition (control). Error bars represent standard deviations of single cells.
Figure 1—figure supplement 4
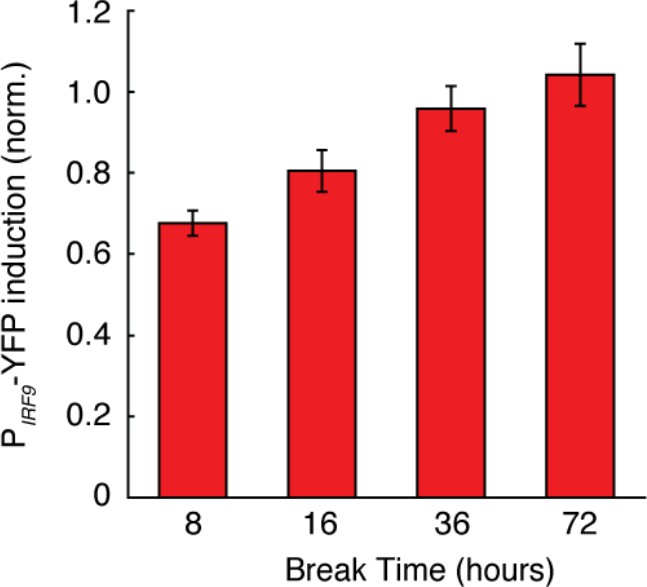
Dependence of desensitization effects on the break time.
Bar graphs showing the amounts of PIRF9-YFP induction to the second IFN input followed by different break time durations. Cells were pretreated with 100 ng/ml IFN-α for 24 hrs or not pretreated (control), washed with PBS three times and stimulated with 100 ng/ml IFN-α. The average PIRF9-YFP induction was normalized to the non-pretreatment control. Error bars represent standard deviations of single cells.
Figure 2 with 4 supplements

USP18 mediates desensitization induced by the prolonged IFN-α pretreatment.
(A) Representative time-lapse images of STAT1 nuclear translocation in response to the second IFN-α treatment under different pretreatment conditions in WT cells (top) and USP18-KD (bottom). (B) Averaged time traces of PIRF9-driven YFP induction (left) and the rate of induction (dYFP/dt, right) in USP18-KD cells in response to the second IFN-α treatment under different pretreatment conditions. (C) Amounts of PIRF9-YFP induction in USP18-KD cells by the second IFN-α stimulation under different pretreatment conditions were shown in bar graph (left) and violin plot (right). The bar showed the averages from three independent experiments, represented as mean + standard error of the mean (SEM). The differences between the pretreatment conditions and the control are all statistically significant (p<0.001). The violin plots showed the distributions of single-cell responses under different pretreatment conditions. The violin plots cover single-cell data from three independent experiments.
Figure 2—figure supplement 1
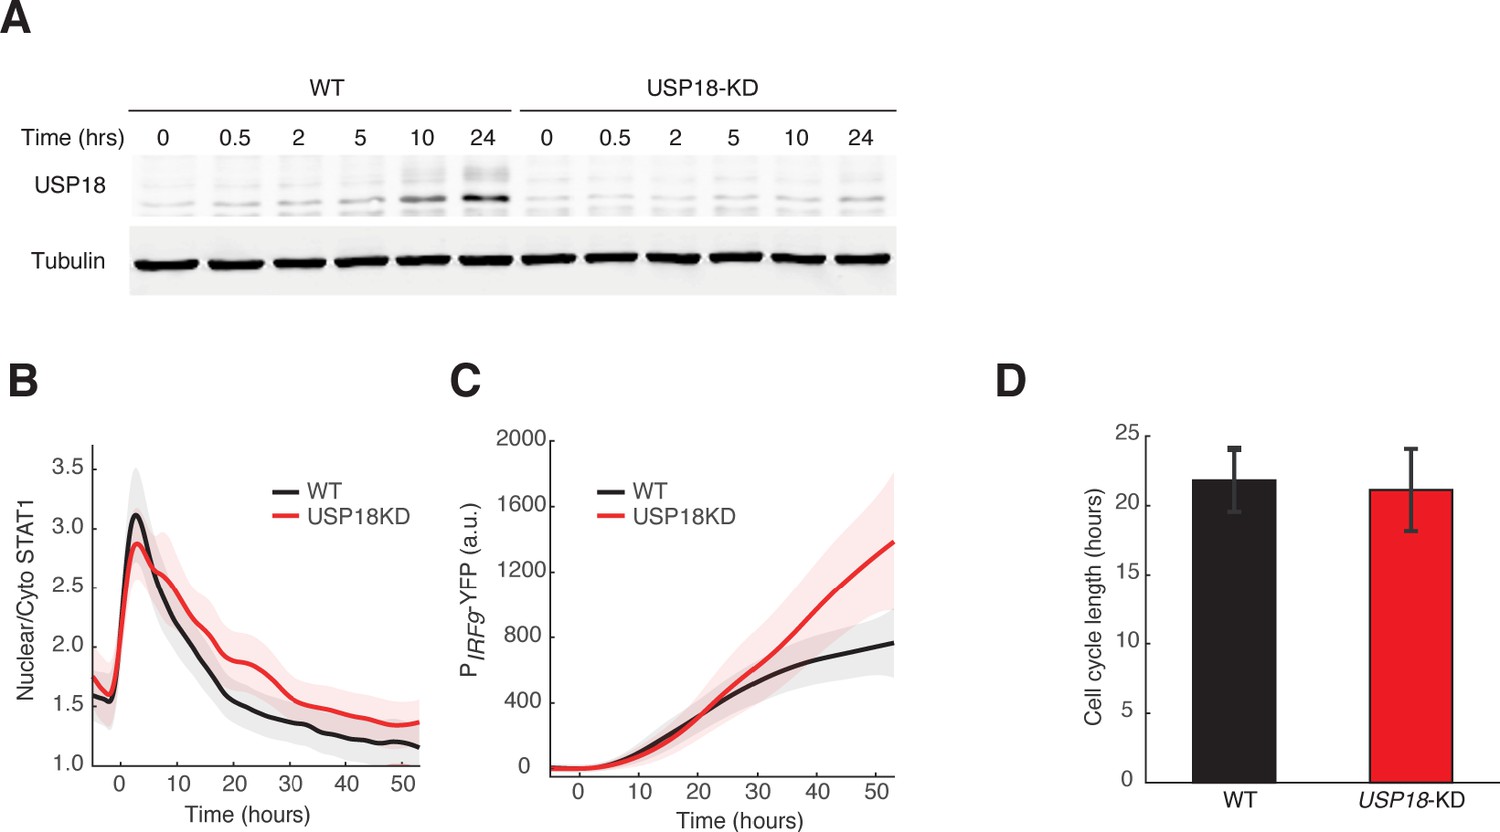
Validation of the USP18-KD cell line.
(A) Western blots of USP18 expression in WT and USP18-KD cells. Cells were treated with 100 ng/ml IFN-α for indicated times, harvested and lysed for immunoblotting with the USP18 antibody. Time traces of nuclear to cytoplasmic ratio for STAT1-mCherry (B) and PIRF9-YFP fluorescence (C) in WT (black) and USP18-KD (red) in response to IFN-α. Averages of single cell traces were shown. The shaded area represents ± SD. (D) Averaged cell cycle lengths of WT and USP18-KD. Cell divisions were identified in individual cells and the lengths between cell divisions were quantified. Error bars represent standard deviations of single cells.
Figure 2—figure supplement 2
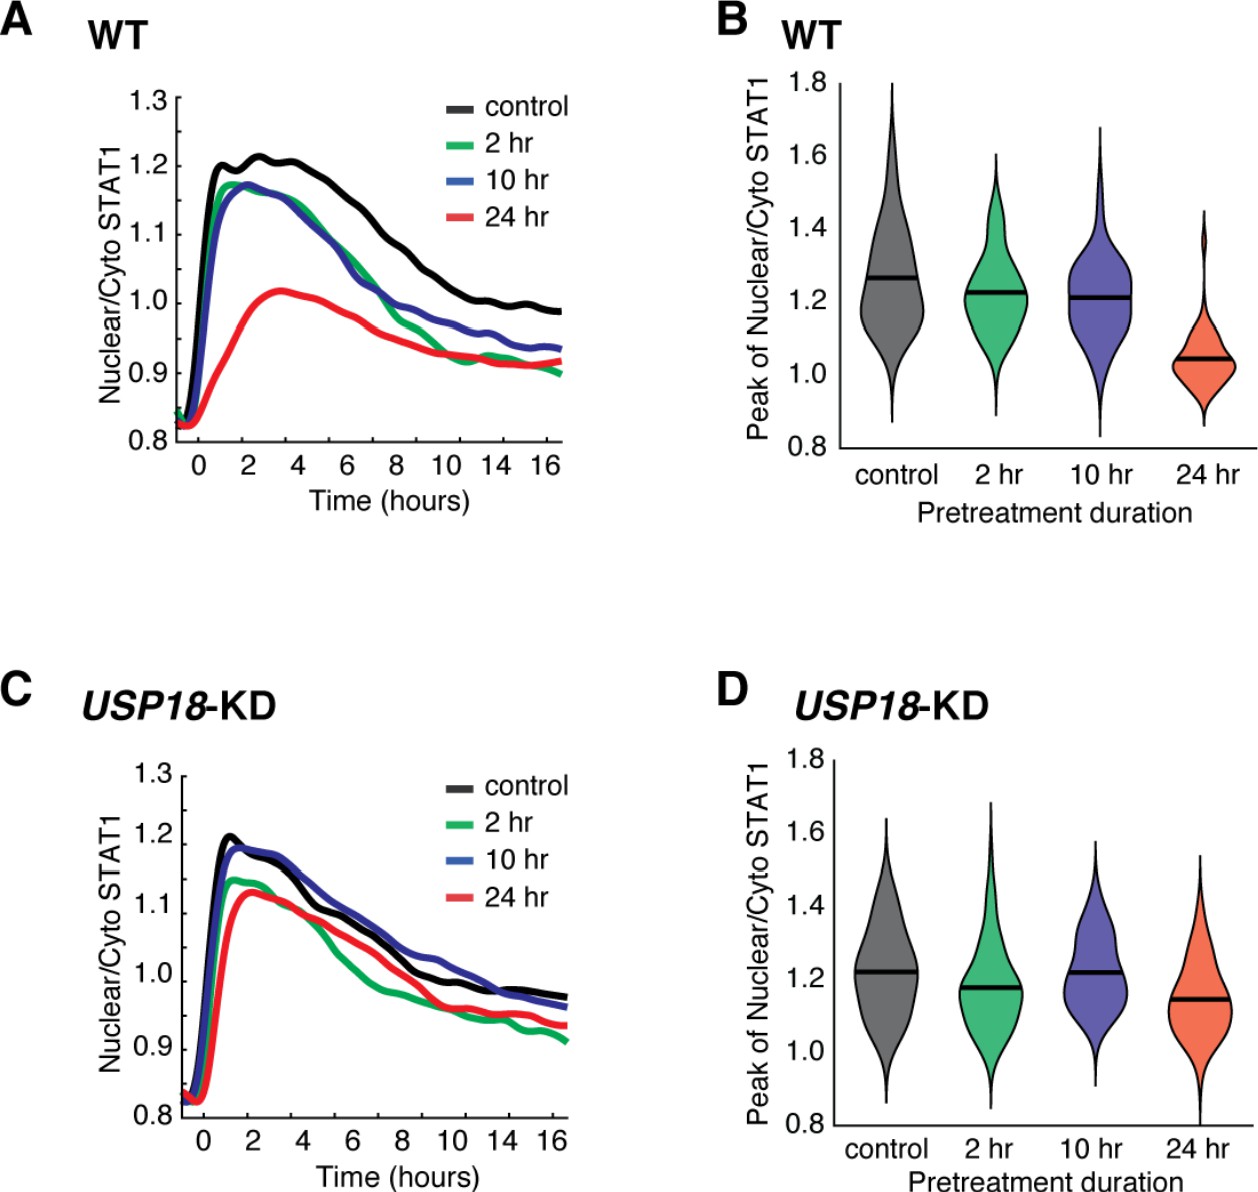
Quantification of USP18-mediated desensitization in STAT1 nuclear translocation.
(A) Averaged time traces of nuclear/cytoplasmic STAT1-mCherry in WT in response to the second IFN-α treatment under different pretreatment conditions (depicted in Figure 1D). (B) Violin plot shows the single-cell distributions of the peak values of nuclear/cytoplasmic STAT1-mCherry traces in WT under different pretreatment conditions. Black line represents the mean value of single-cell responses. (C) Averaged time traces of nuclear/cytoplasmic STAT1-mCherry in USP18-KD in response to the second IFN-α treatment under different pretreatment conditions. (D) Violin plot shows the single-cell distributions of the peak values of nuclear/cytoplasmic STAT1-mCherry traces in USP18-KD under different pretreatment conditions.
Figure 2—figure supplement 3
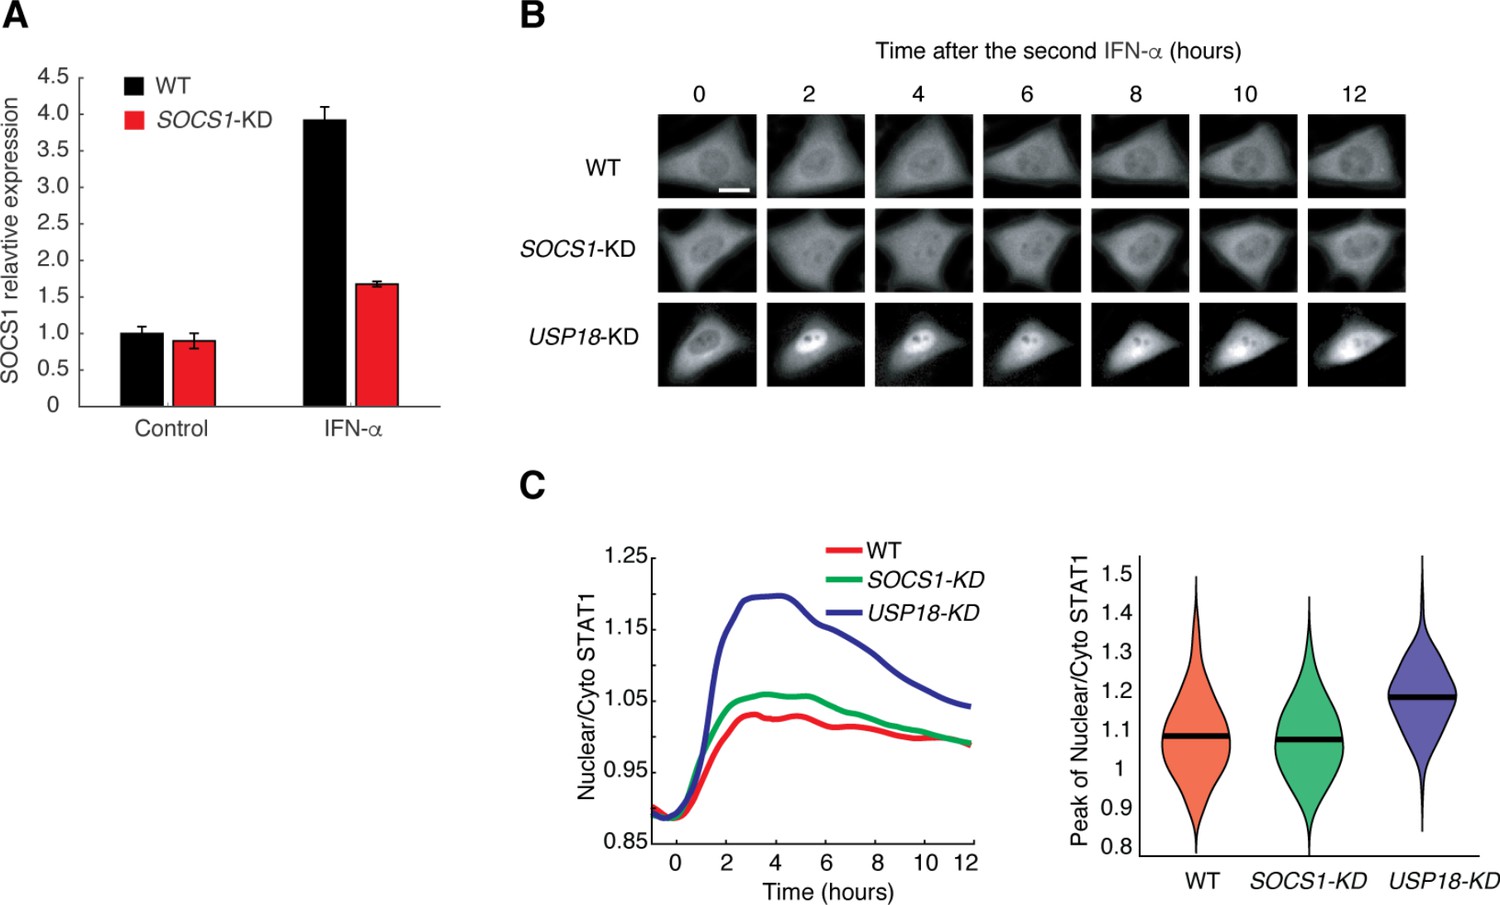
SOCS1 does not mediate the desensitization of STAT1 nuclear translocation upon IFN stimulation.
(A) Quantitative PCR results comparing SOCS1 expression in WT (back) and SOCS1-KD (red). The data was normalized to WT without IFN-α treatment. The knockdown efficiency (73.71%) was calculated as the relative SOCS1 induction upon IFN-α treatment in SOCS1-KD and WT. Error bars represent ± SEM from three replicates. (B) Representative time-lapse images of STAT1 nuclear translocation upon the second IFN-α treatment in WT cells (top), SOCS1-KD (middle) and USP18-KD (bottom) cells. Cells were pretreated with 100 ng/ml IFN-α for 24 hrs followed by 8 hrs of break time and re-stimulated for 12 hrs. Scale bar: 20 μm. (C) Right: Averaged time traces of nuclear/cytoplasmic STAT1-mCherry in WT cells (red), SOCS1-KD (green) and USP18-KD (blue) cells in response to the second IFN-α treatment. Left: Violin plot shows the single-cell distributions of the peak values of nuclear/cytoplasmic STAT1-mCherry traces in WT cells (red), SOCS1-KD (green) and USP18-KD (blue) cells. Results were quantified from the experiments in panel B.
Figure 2—figure supplement 4
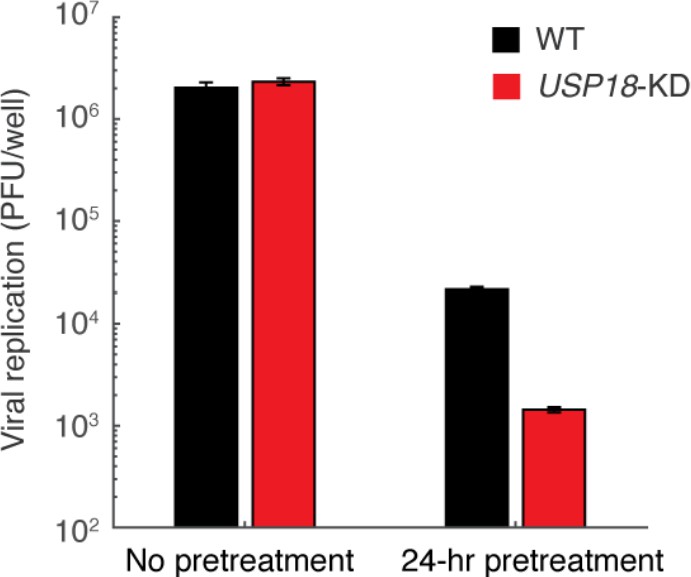
Vesicular stomatitis virus (VSV) replication in WT and USP18-KD cells with and without 24-hr IFN-α pretreatment.
Cells with or without a 24-hr pretreatment of 100 ng/ml IFN-α and an 8-hr break time were infected with 2500 PFU (plaque forming units) of VSV. After 18 hrs, viral supernatant was collected and titered. Error bars represent ± SEM, n = 3. Note that the y-axis starts with 100 PFU/well as it is the limit of detection of our method.
Figure 3 with 2 supplements
A kinetic model suggests a delayed negative feedback loop through USP18.
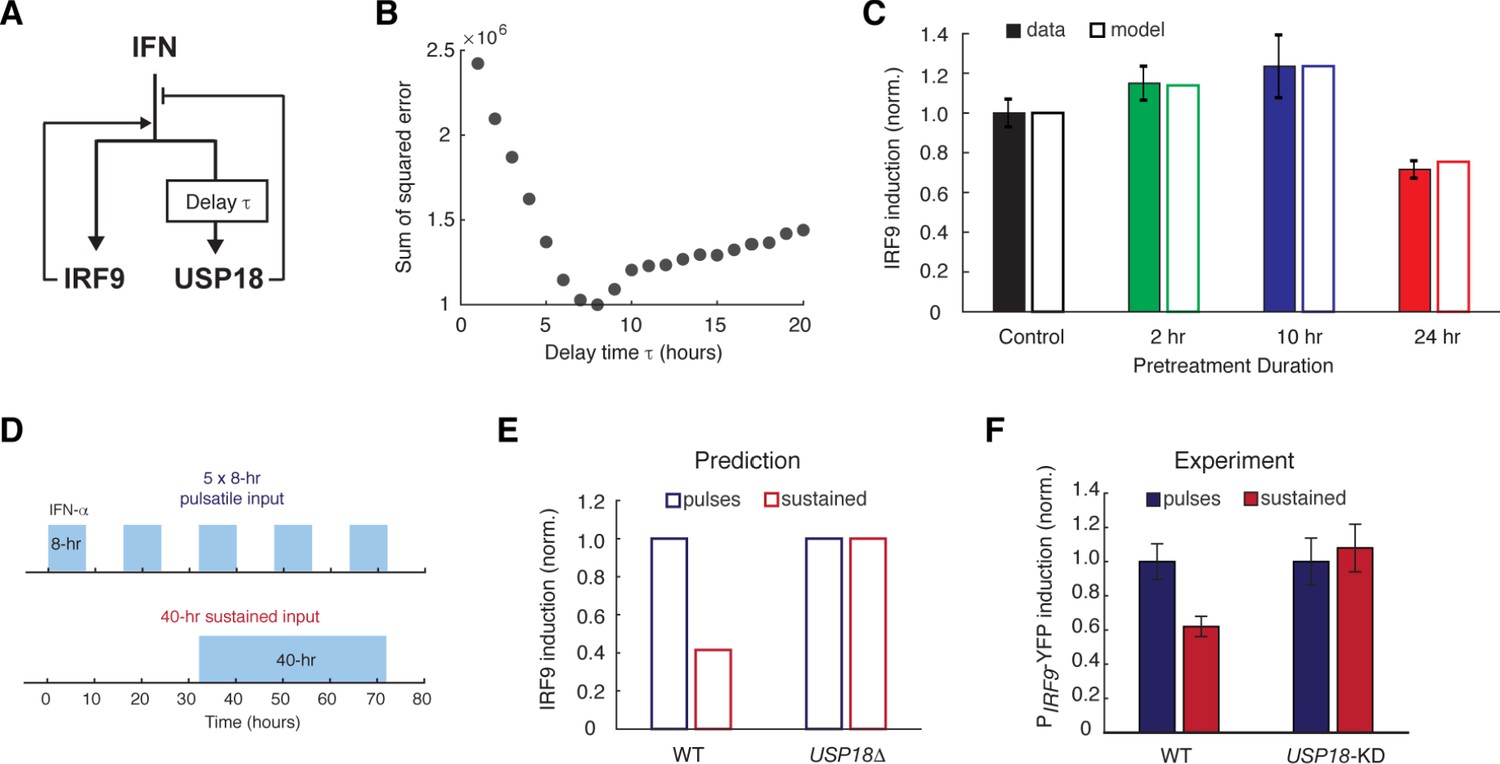
(A) A diagram for the simple kinetic model of the IFN-driven gene regulatory network. (B) Fitting errors between simulations and the data with different assigned values of the delay time in USP18 upregulation. (C) Amounts of PIRF9-YFP induction by the second IFN-α stimulation under different pretreatment conditions, from experimental data (solid bars) and model simulations with the best-fit parameters (open bars). Data were from Figure 1F and were normalized to the non-pretreatment condition (control). (D) Schematic of experimental design with repetitive IFN pulses versus a sustained IFN input. (E) Model prediction of the responses to pulsatile versus sustained IFN inputs in the presence and absence of USP18. Results were normalized to the amount of induction to the pulsatile IFN input in WT. (F) Experimental data of the responses to pulsatile versus sustained IFN inputs in WT and USP18-KD cells. The error bars represent standard deviations of single-cell data.
Figure 3—figure supplement 1
Model fitting results and the parameter analysis.
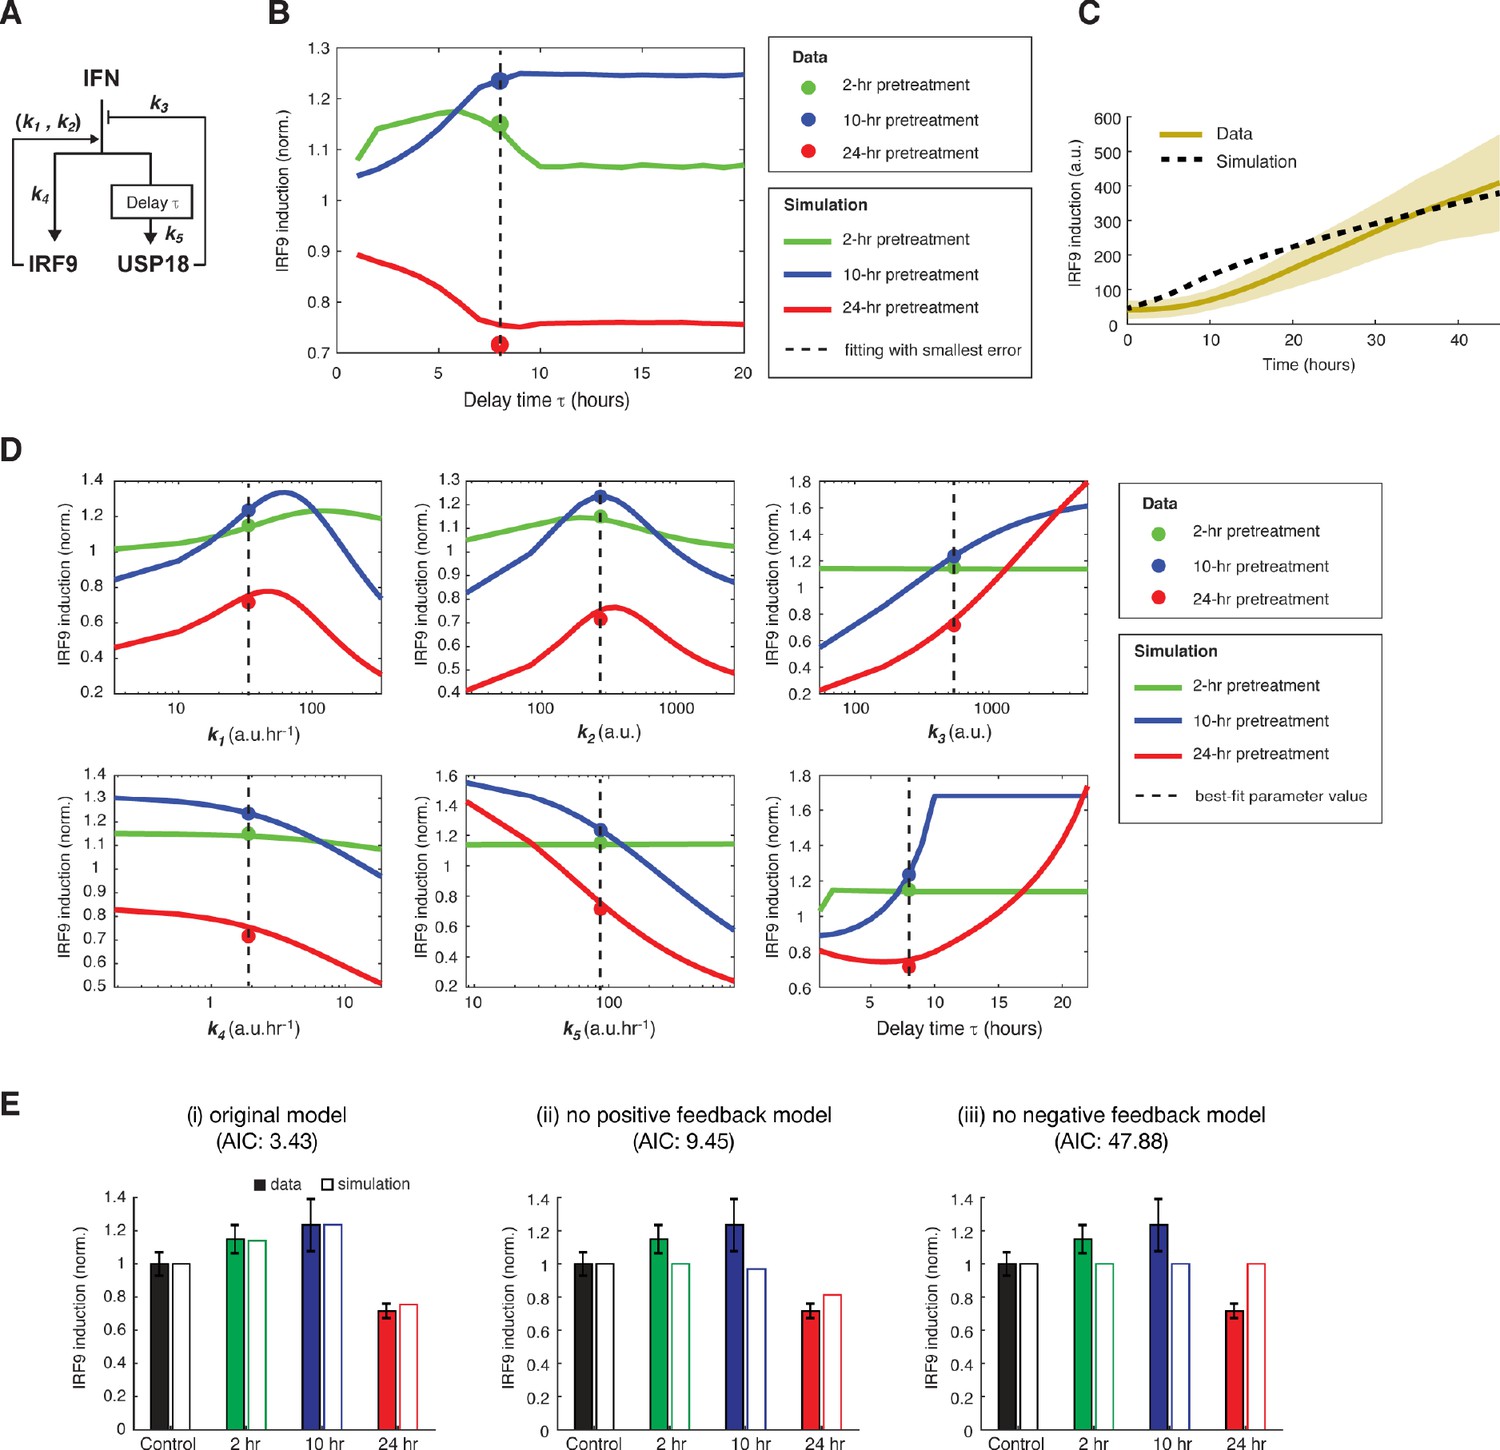
(A) A diagram for the simple kinetic model of the IFN-driven gene regulatory network with reaction parameters labeled. (B) Fitting results with different delay times. The model fitting results (solid lines) were shown for delay times from 1 to 20 hrs while keeping all the other parameters free (Figure 3B) and were compared with experimental data (solid circles) under different pretreatment conditions. The delay time of 8 hrs gave smallest error between simulation and data (dashed line). (C) Model simulation of the time trace of IRF9 induction in response to 100 ng/ml IFN-α. The model was fit to the end point data from pretreatment experiments with different durations, as well as the time trace data of IRF induction to IFN stimulation. The simulated time trace from the best-fit parameters were shown as the dashed line. The data were from Figure 1C and were represented as the mean (yellow solid lines) and + / - standard deviation (SD) of single cells (shaded areas). (D) Sensitivity analysis of the parameter values. For each parameter, its value was changed across a wide range, while all the other parameters remained at the best-fit values. The simulated results (solid lines) were shown and compared with experimental data (solid circles) under different pretreatment conditions. The dashed line represents the best-fit value. (E) Roles of the positive and feedback loops on model performance. (i) Original model with both positive and negative feedback loops, (ii) model without positive feedback loop, and (iii) model without negative feedback loop were compared and Akaike information criterion (AIC) was computed using the best-fit parameter set for each model and was shown in the figure. Experimental data (solid bars) and model simulations with the best-fit parameters (open bars) for PIRF9-YFP induction by the second IFN-α stimulation under different pretreatment conditions were shown for each model. Data were from Figure 1F and were normalized to the non-pretreatment condition (control).
Figure 3—figure supplement 2
Pulsatile IFN-α treatment induces higher ISG expression in single cells.
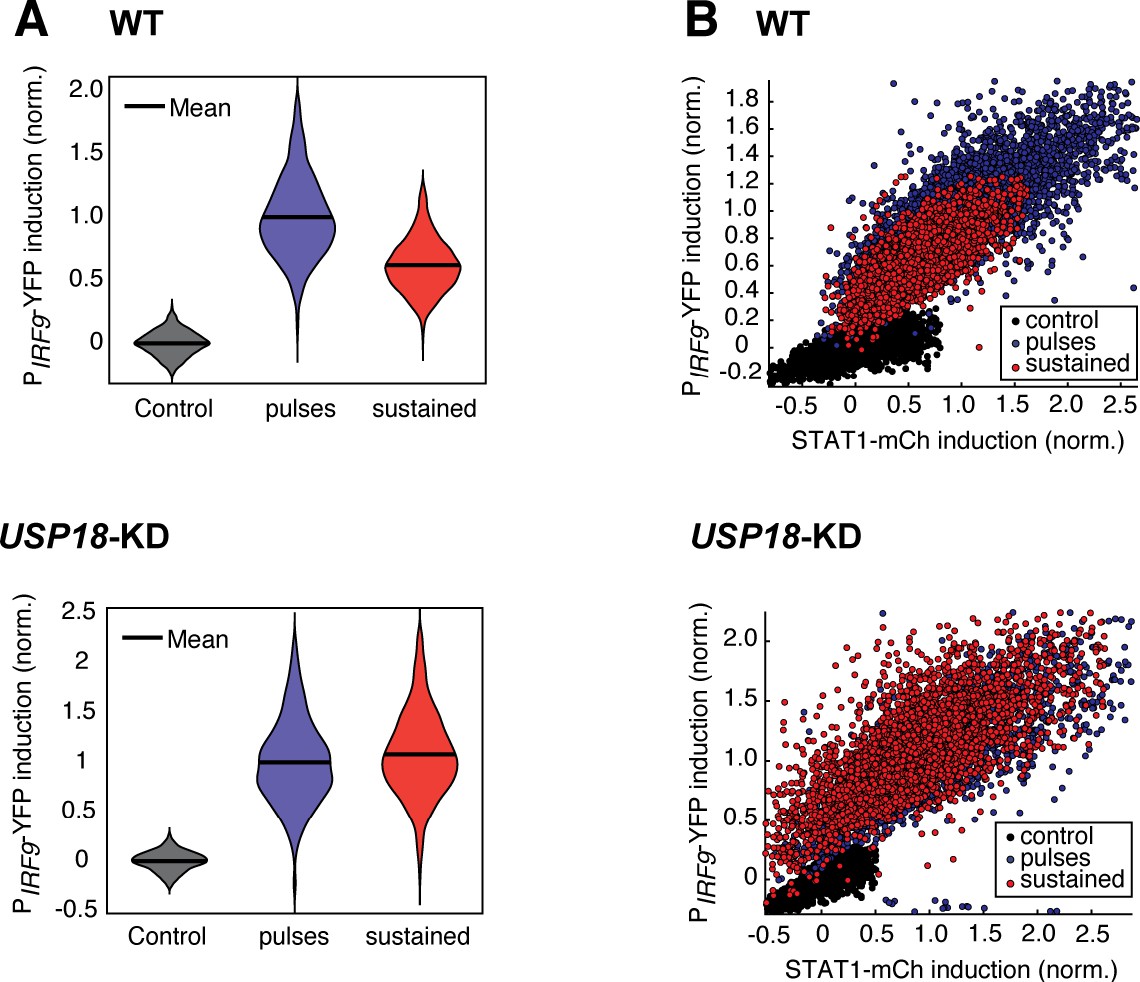
(A) The violin plots showing single-cell distributions of PIRF9-YFP induction upon 5 × 8-hr pulsatile (blue) or 40-hr sustained (red) IFN-α treatments in WT (top) and USP18-KD (bottom) cells. The normalized mean levels of PIRF9-YFP induction were 1 (WT, pulsatile), 0.6204 (WT, sustained), 1 (USP18-KD, pulsatile), and 1.0796 (USP18-KD, sustained), respectively. The coefficients of variance (CVs) for IRF9 induction were 0.1846, 0.1953, 0.2419, and 0.2273, respectively. (B) Scatterplots showing STAT1-mCherry versus PIRF9-YFP induction in single cells in response to 5 × 8 hr pulsatile or 40-hr sustained IFN-α treatments in WT (top) and USP18-KD (bottom) cells. Fluorescent signals without IFN-α treatment were used as control.
Figure 4 with 3 supplements
Heterogeneous delays in USP18 upregulation by IFN were observed in single cells.
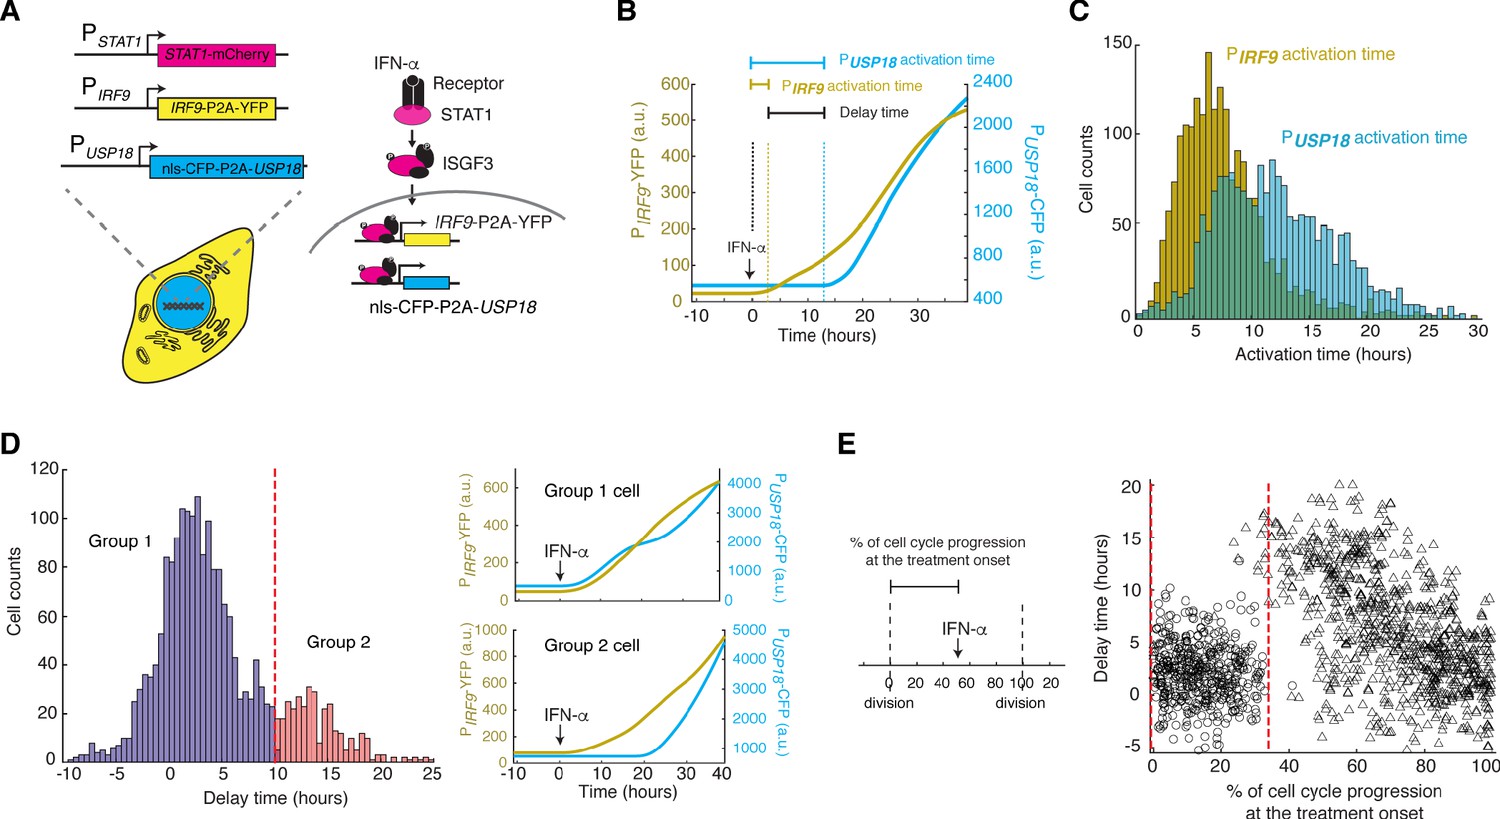
(A) Schematic of the dual reporter cell line. A coding sequence for NLS-CFP-P2A was inserted endogenously into the N-terminus of USP18 coding sequence of the previous cell line. IFN-α induces nuclear translocation of STAT1 and upregulation of IRF9 (PIRF9-YFP) and USP18 (PUSP18-CFP). (B) Representative time traces of PIRF9-YFP and PUSP18-CFP of a single cell in response to IFN-α. Activation time is defined as the time required to initiate the upregulation of the reporters after IFN-α treatment onset. Delay time is defined as the time difference between PUSP18 and PIRF9 activation times. (C) Distributions of PIRF9 and PUSP18 activation times in single cells (n = 2021 cells). The mean activation times (with 95% confidence interval) of IRF9 and USP18 are 7.9008 ± 0.1914 and 12.1620 ± 0.2349 hrs, respectively. The coefficients of variation (CVs) for activation times of IRF9 and USP18 are 0.5558 and 0.4429, respectively. (D) Distributions of delay times in single cells, quantified from the activation times in C. Cells are classified into two groups based on the delay times. Representative time traces of PIRF9 and PUSP18 in a single cell from each group are shown (right). Proportion of Group 2 cells (with a delay longer than 10 hrs) is 16.48%. (E) Single-cell delay times as a function of the percentages of cell cycle progression upon IFN treatment onset. Left: Diagram illustrating the quantification of the percentage of cell cycle progression at the treatment onset in a single cell. The time between two cell divisions (dashed lines) was considered as the length of one cell cycle. % of cell cycle progression is calculated as the ratio of the time in a cell cycle before IFN-α addition versus the full cell cycle length (100%) (See Figure 4—figure supplement 3 for details). Right: Scatterplot of delay time in each single cell versus % of cell cycle progression upon treatment onset. Open circles represent cells in which PUSP18-CFP upregulation occurred within the same cell cycle as the IFN-α addition. Open triangles represent cells in which PUSP18-CFP upregulation occurred in the next cell cycle. Red dashed lines indicate the time window for immediate PUSP18 induction. A two-sample t-test was performed for the two populations within and beyond the time window and obtained a p-value<0.001, indicating a significant difference in delay times.
Figure 4—figure supplement 1
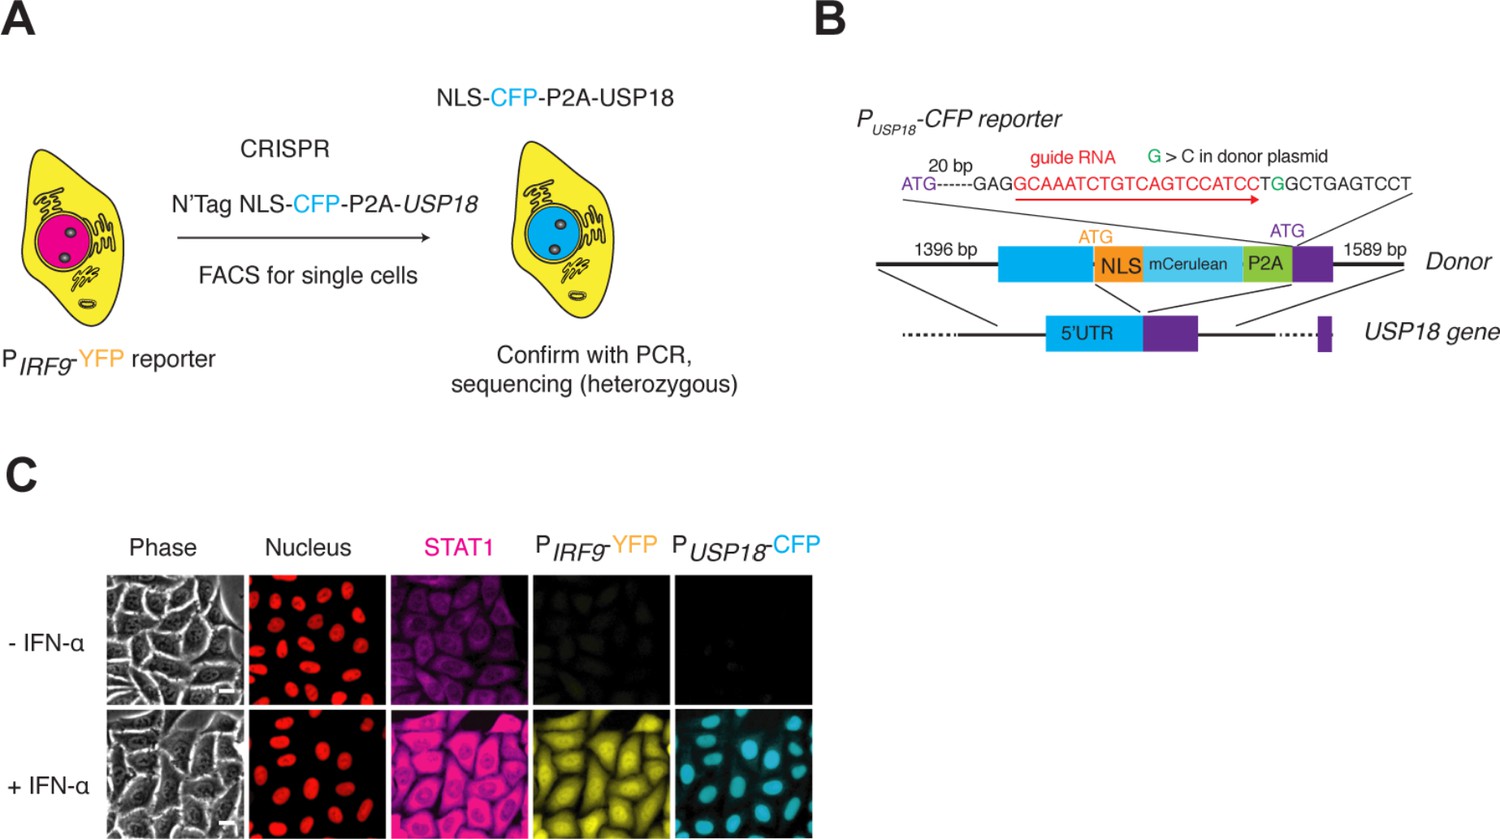
Construction of the cell line with PUSP18-CFP reporter.
(A) Illustration showing the introduction of PUSP18-CFP into the dual reporter cell line in Figure 1A. NLS-CFP-P2A coding sequence was inserted between the promoter and coding sequence of the USP18 gene to generate a transcriptional reporter. (B) Schematic of USP18 tagged locus. The sequence of the gRNA along with the recognition direction and the synonymous substitutions to avoid Cas9 recognition are shown. The design of the donor DNA with indicated homology arms along with the inserts are shown. (C) Representative images of the reporter cell line in response to IFN-α. Cells were treated without or with 100 ng/ml IFN-α for 48 hrs. Scale bar: 20 μm.
Figure 4—figure supplement 2
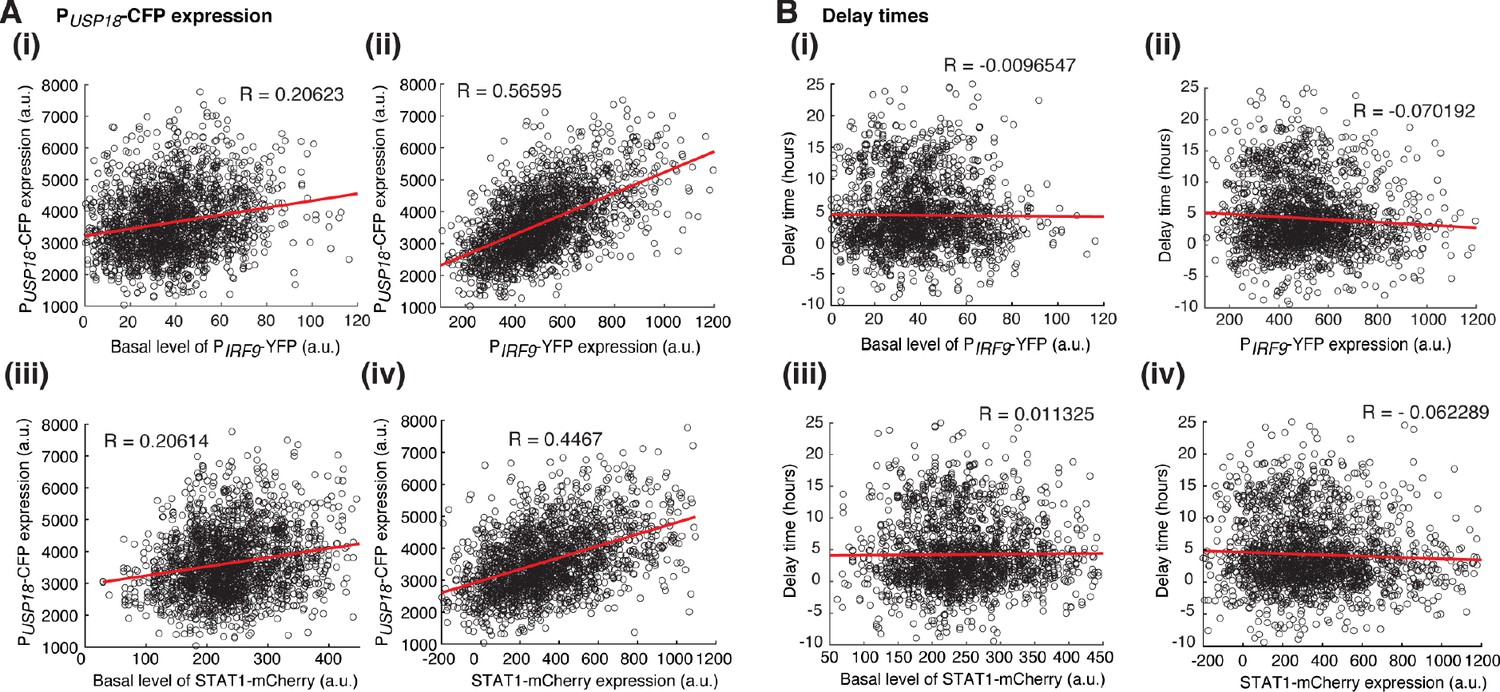
Relationships between variations in USP18 upregulation and the heterogeneity in ISGF3 components.
(A) Scatterplots showing the relationship of PUSP18-CFP expression upon IFN-α treatment with (i) the basal level of PIRF9-YFP, (ii) PIRF9-YFP expression upon IFN-α treatment, (iii) the basal level of STAT1-mCherry, (iv) STAT1-mCherry expression upon IFN-α treatment. (B) Scatterplots showing the relationship of PUSP18-CFP delay times with (i) the basal level of PIRF9-YFP, (ii) PIRF9-YFP expression upon IFN-α treatment, (iii) the basal level of STAT1-mCherry, (iv) STAT1-mCherry expression upon IFN-α treatment. Each dot represents a single cell. Correlation coefficients were calculated and shown in each panel. The single-cell data were from Figure 4.
Figure 4—figure supplement 3
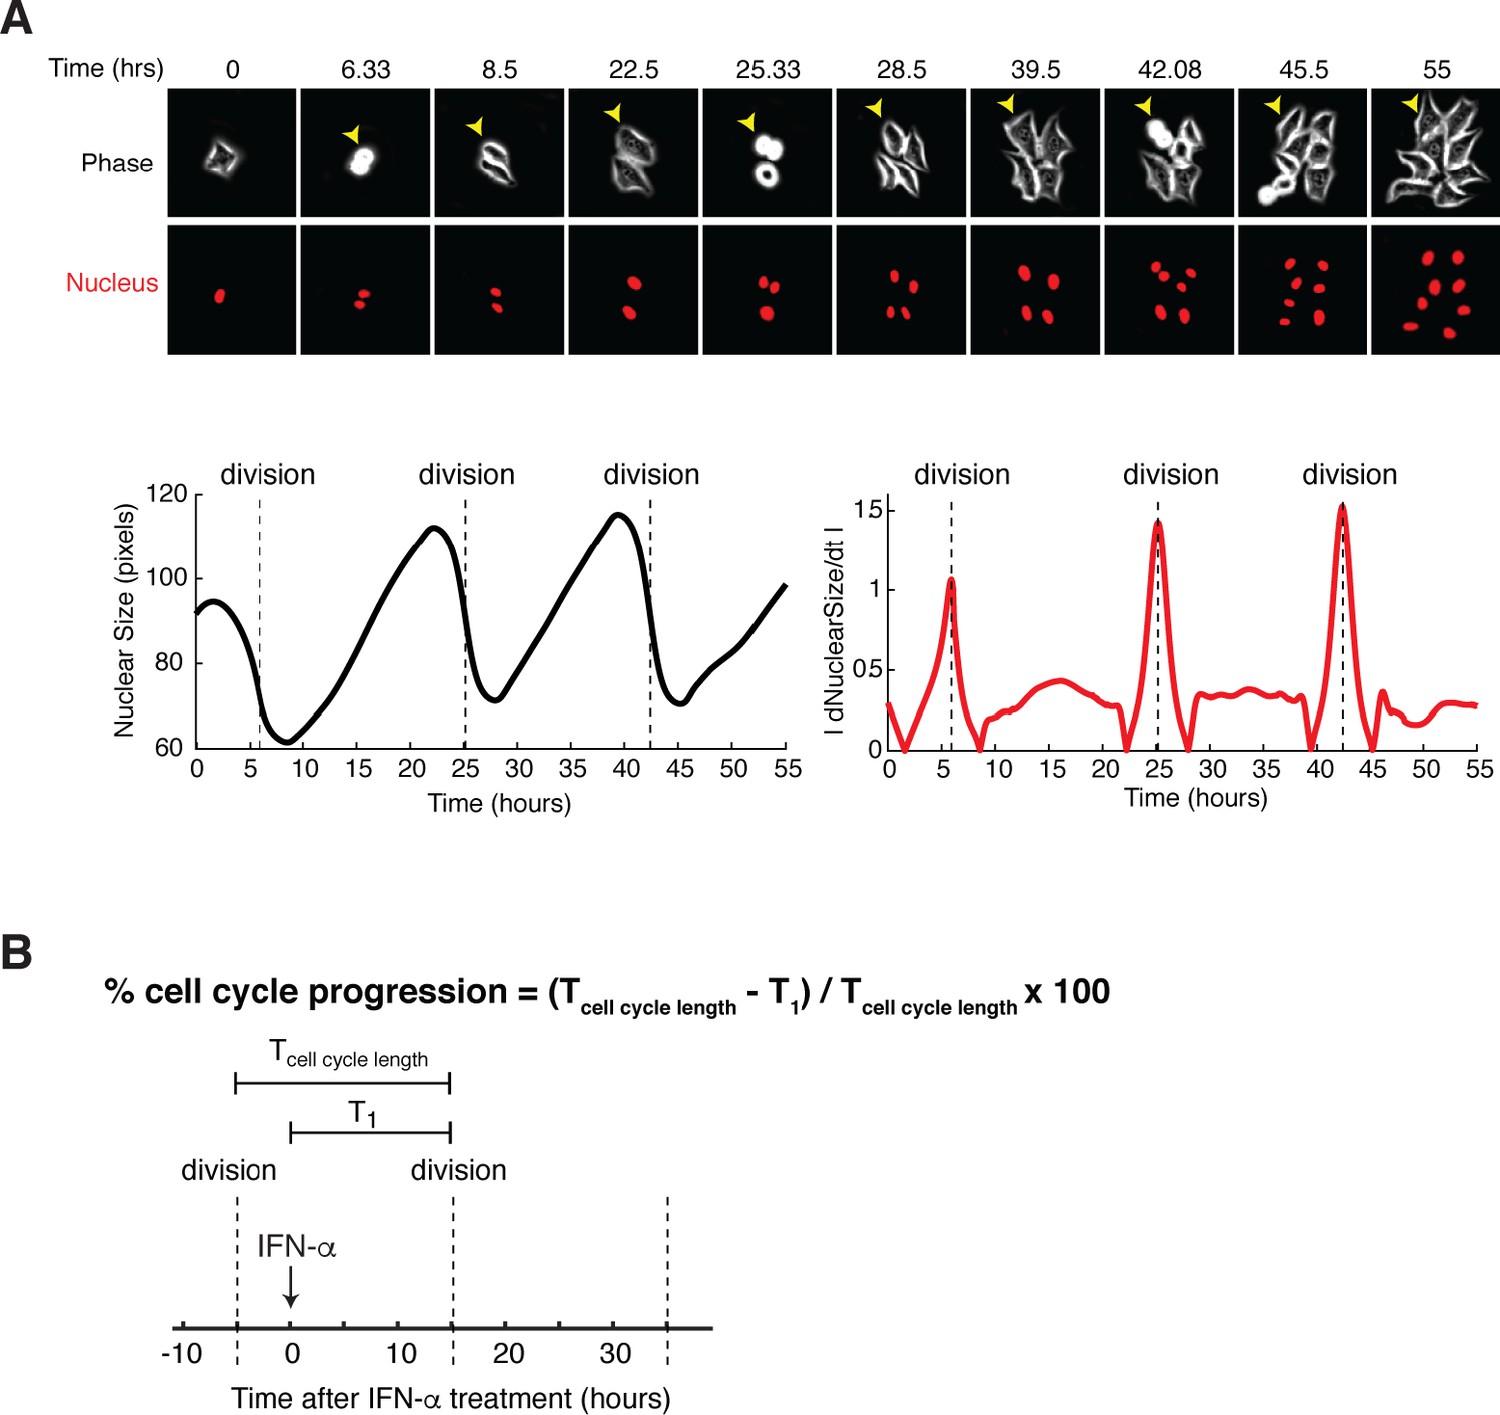
Quantifying the percentage of cell cycle progression upon IFN treatment onset in single cells.
(A) Illustration of measurement of cell mitosis times from time-lapse images. (Top) Representative time-lapse images of cells over multiple cell divisions. (Bottom) The size of nucleus (left) and its absolute time derivatives (right) were plotted for a representative cell (pointed by the yellow arrow) as a function of time. Cell division times (dashed lines) were determined by the peaks in the derivative time trace, which correspond to cytokinesis during mitosis. (B) Diagram illustrating the quantification of the percentage of cell cycle progression at the treatment onset in a single cell. The time between two cell divisions (dashed lines) was defined as cell cycle length (T cell cycle length). The time between IFN treatment onset time and the next cell division was defined as T1. The percentage of cell cycle progression upon IFN treatment onset can be quantified using T cell cycle length and T1, as shown in the listed formula.
Figure 5 with 5 supplements
USP18 expression was differentially regulated by cell cycle phases.
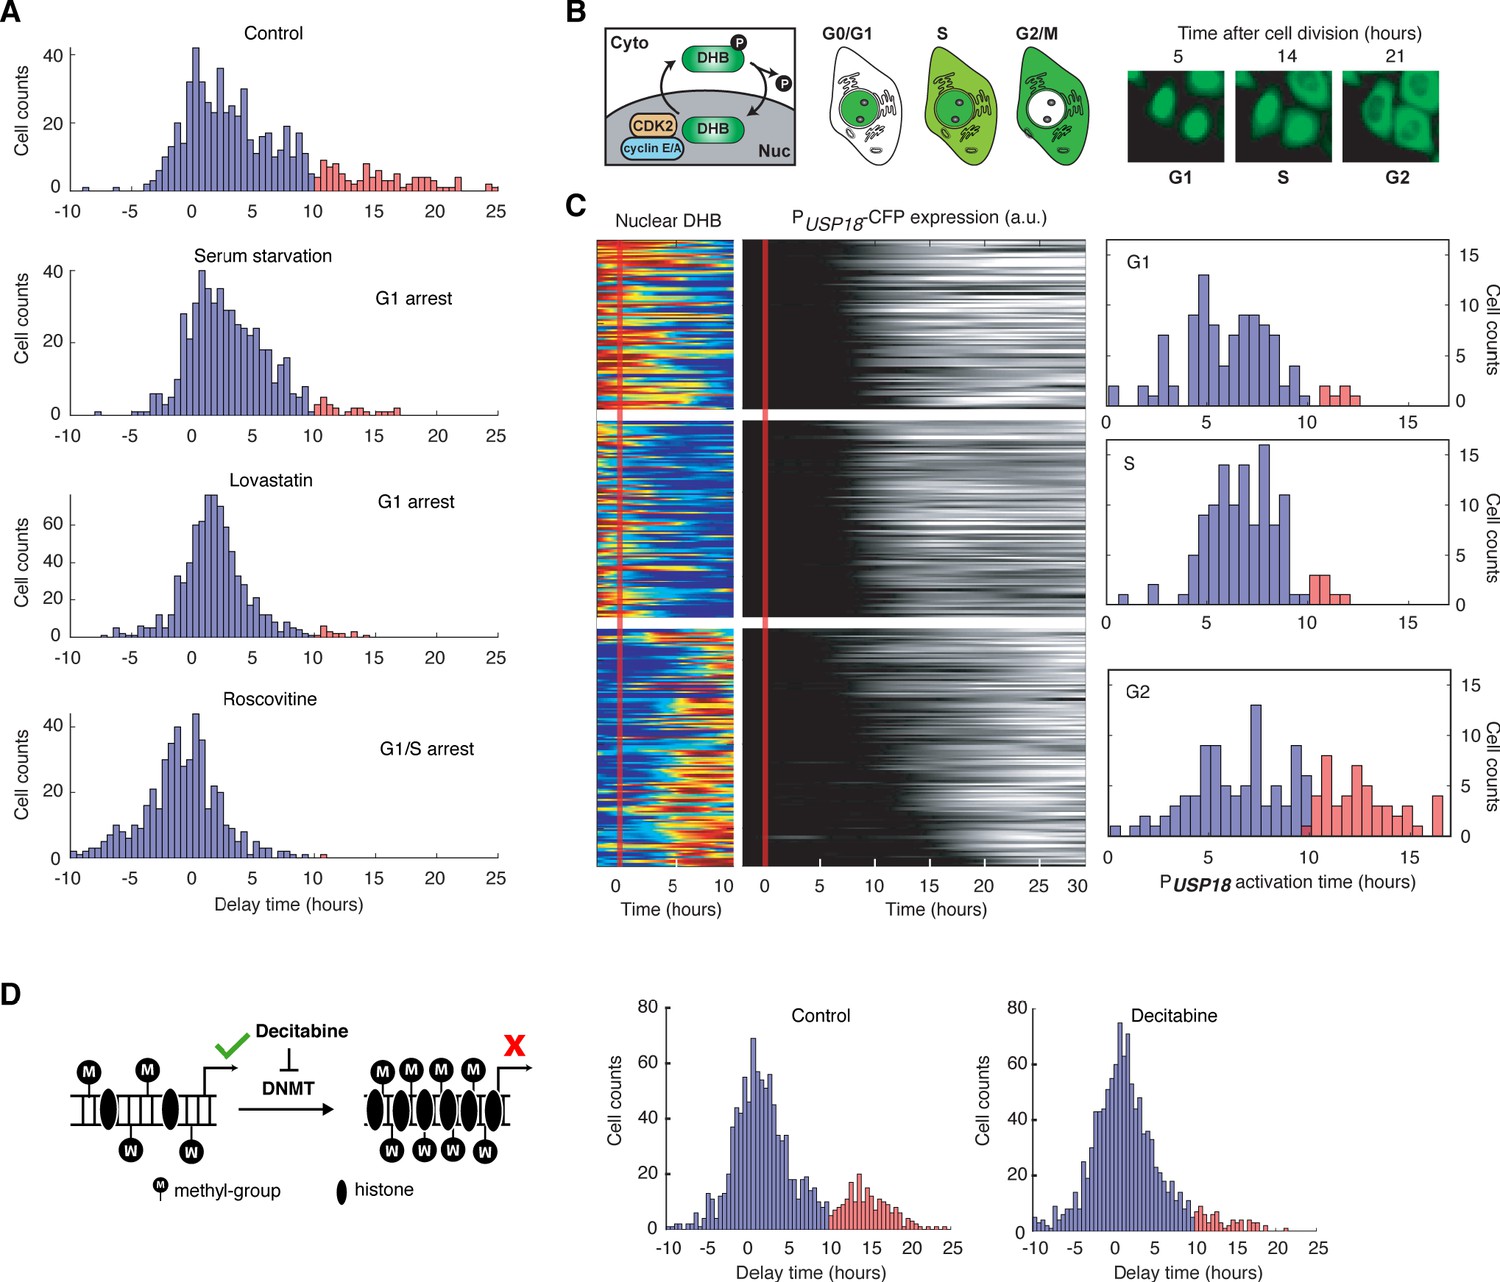
(A) Distributions of delay times in cells treated with different cell cycle perturbations. Cells were serum-starved or treated with lovastatin (5 μM), or with roscovitine (5 μM) for 36 hrs prior to IFN-α treatment. Proportions of Group 2 cells (with a delay longer than 10 hrs) are 16.28% (control), 4.55% (serum starvation), 2.31% (lovastatin), and 0.21% (roscovitine), respectively. (B) Schematic of CDK2 activity reporter. Amino acids 994–1087 of human DNA helicase B (DHB) was fused with mCherry. The construct was stably integrated into PUSP18 cell line using lentivirus. The dynamics of nuclear translocation of DHB-mCherry can be used to infer the cell cycle phase. Representative time-lapse images of DHB-mCherry illustrate the inference of cell cycle phases. (C) Color maps showing nuclear DHB and PUSP18-driven gene expression in the same single cells. Each row represents the time trace of a single cell. Cells were grouped into G1 (n = 104), S (n = 124) and G2 (n = 144) based on the nuclear DHB signals (left) at the time of IFN-α addition. For each group, cells were sorted based on PUSP18-CFP activation time (middle). Right: Distributions of PUSP18-CFP activation times for each group. (D) Distributions of delay times in cells treated with decitabine, a DNA methyltransferase (DMNT) inhibitor. Left: Schematic of the effect of decitabine on DNA methylation and nucleosome occupancy. Right: Distribution of delay times upon decitabine treatment. Cells were cultured with medium in the absence (control) or presence of 100 μM decitabine for 48 hrs prior to 100 ng/ml IFN-α treatment. Cells with delay times longer than 10 hrs are shown in red. Proportions of Group 2 cells (with a delay longer than 10 hrs) are 17.89% (control) and 5.92% (decitabine treated).
Figure 5—figure supplement 1
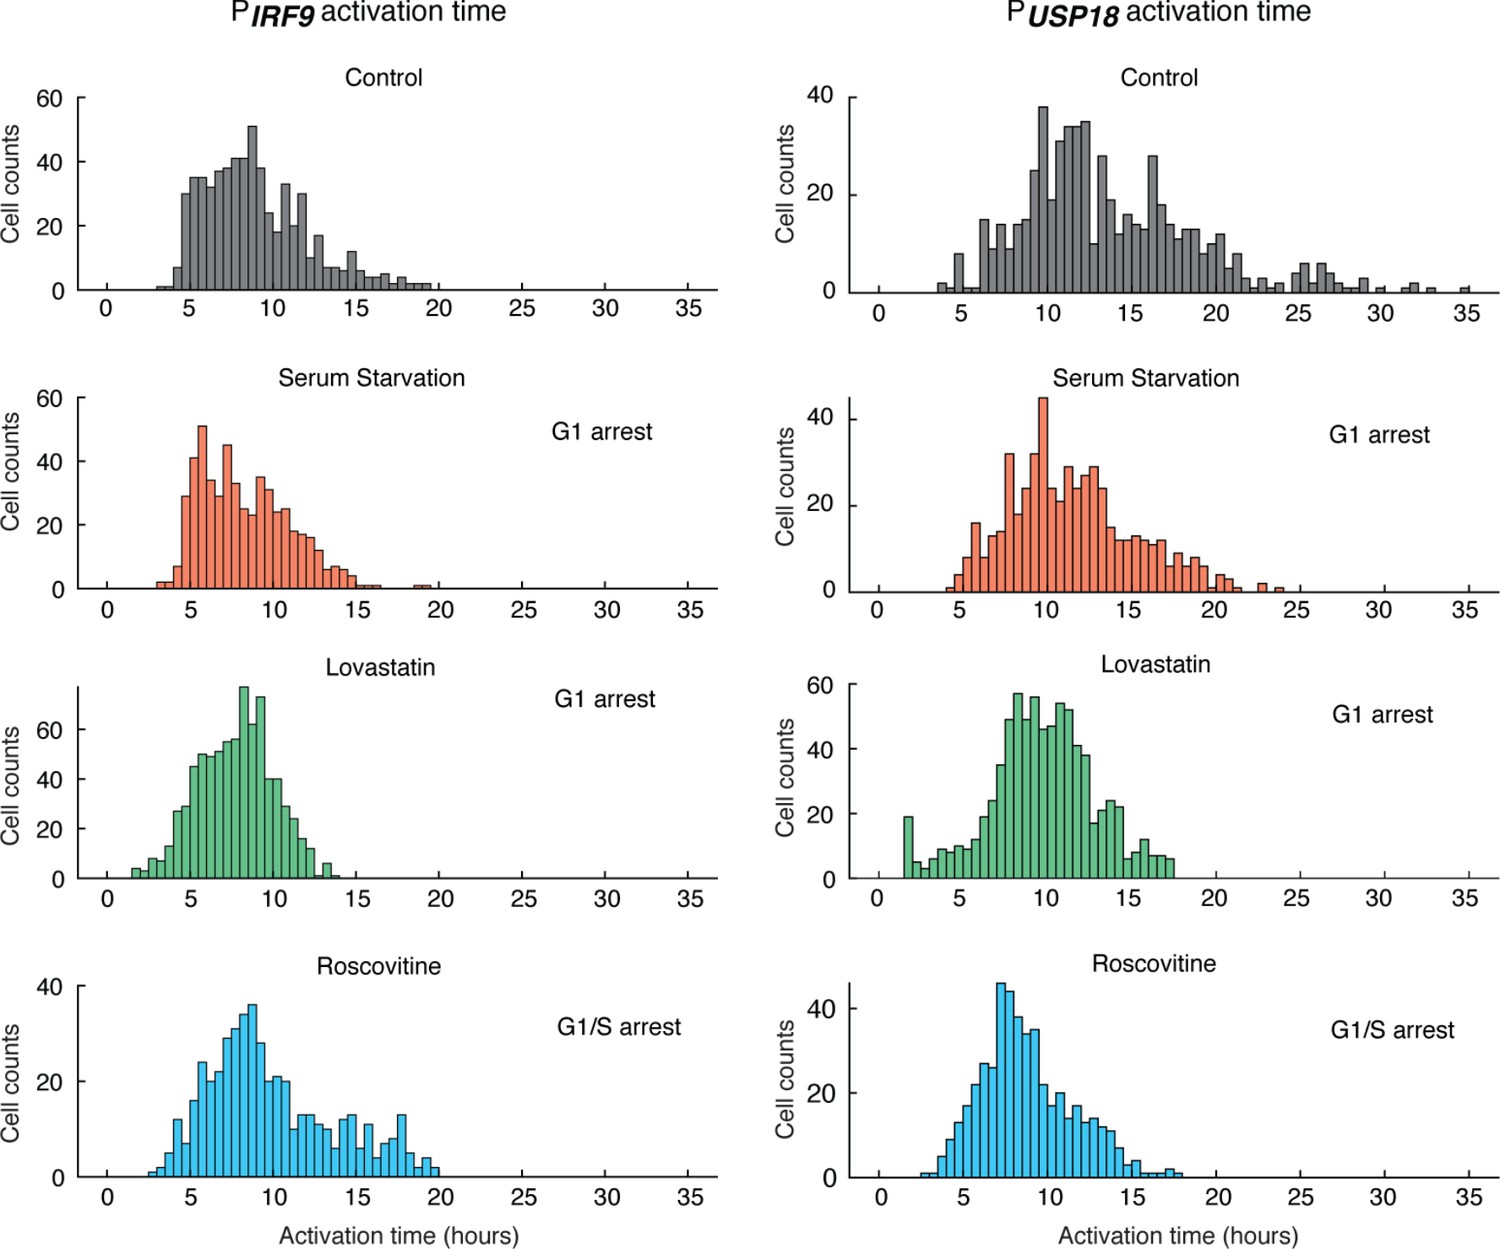
Distributions of PIRF9 and PUSP18 activation times in cells treated with different cell cycle perturbations.
Cells were serum-starved or treated with lovastatin (5 μM), or with roscovitine (5 μM) for 36 hrs prior to IFN-α treatment. The mean activation times (with 95% confidence interval) of IRF9 were 8.9482 ± 0.249 hrs (control), 8.2770 ± 0.2310 hrs (serum-starvation), 7.7281 ± 0.1588 hrs (lovastatin), and 9.8733 ± 0.3424 hrs (roscovitine), respectively. The coefficients of variance (CVs) for activation times of IRF9 were 0.3484, 0.3268, 0.2924, and 0.3868, respectively. The mean activation times (with 95% confidence interval) of USP18 were 13.7266 ± 0.4215 hrs (control), 11.4415 ± 0.3146 hrs (serum-starvation), 9.6591 ± 0.2210 hrs (lovastatin), and 8.7585 ± 0.2450 hrs (roscovitine), respectively. The CVs for activation times of USP18 were 0.3844, 0.3220, 0.3257, and 0.3121, respectively. For serum starvation, the mean IRF9 activation time was decreased by 0.67 hr (−7.5%) and the mean USP18 activation time was decreased by 2.29 hrs (−16.6%); For lovastatin, the mean IRF9 activation time was decreased by 1.22 hrs (−13.6%) and the mean USP18 activation time was decreased by 4.07 hrs (−29.6%); For roscovitine, the mean IRF9 activation time was increased by 0.93 hr (+10.3%) and the mean USP18 activation time was decreased by 4.97 hrs (−36.2%). For serum starvation and lovastatin, while both IRF9 and USP18 activation times were decreased, USP18 activation times were decreased to greater extents, resulting in shorter delay times. For roscovitine, IRF9 activation time was increased and USP18 activation time was decreased, both of which contribute to the decrease in the delay time. But the change in USP18 activation time is five times more dramatic than the change in IRF9 activation time (−4.97 hrs vs +0.93 hr), in agreement with the decrease in USP18 activation time being a major contributor to the change in the delay time under this condition.
Figure 5—figure supplement 2

Cell cycle-dependent USP18 upregulation determined by the FUCCI reporter.
(A) Illustration of how the FUCCI reporter works. The fluorescent signals of chromatin licensing and DNA replication factor 1(Cdt1) and Geminin (Gem) proteins oscillate throughout a cell cycle to infer cell cycle phases. Middle: Images of a representative cell showing the Cdt1 and Gem level at different cell phases. Dynamics of Cdt1 and Gem signals in a single cell are shown along with the cell cycle phase inference. Dashed lines represent cell divisions. (B) Color maps of Cdt1, Gem and PUSP18-CFP expression in the same single cells. Each row represents the time trace of a single cell. Cells were grouped into G1 (n = 451), S (n = 388) and G2 (n = 325) based on Cdt1 and Gem signals (left) at the time of IFN-α addition. For each group, cells were sorted based on PUSP18-CFP activation time (middle). Right: Distributions of PUSP18-CFP activation times for each group.
Figure 5—figure supplement 3
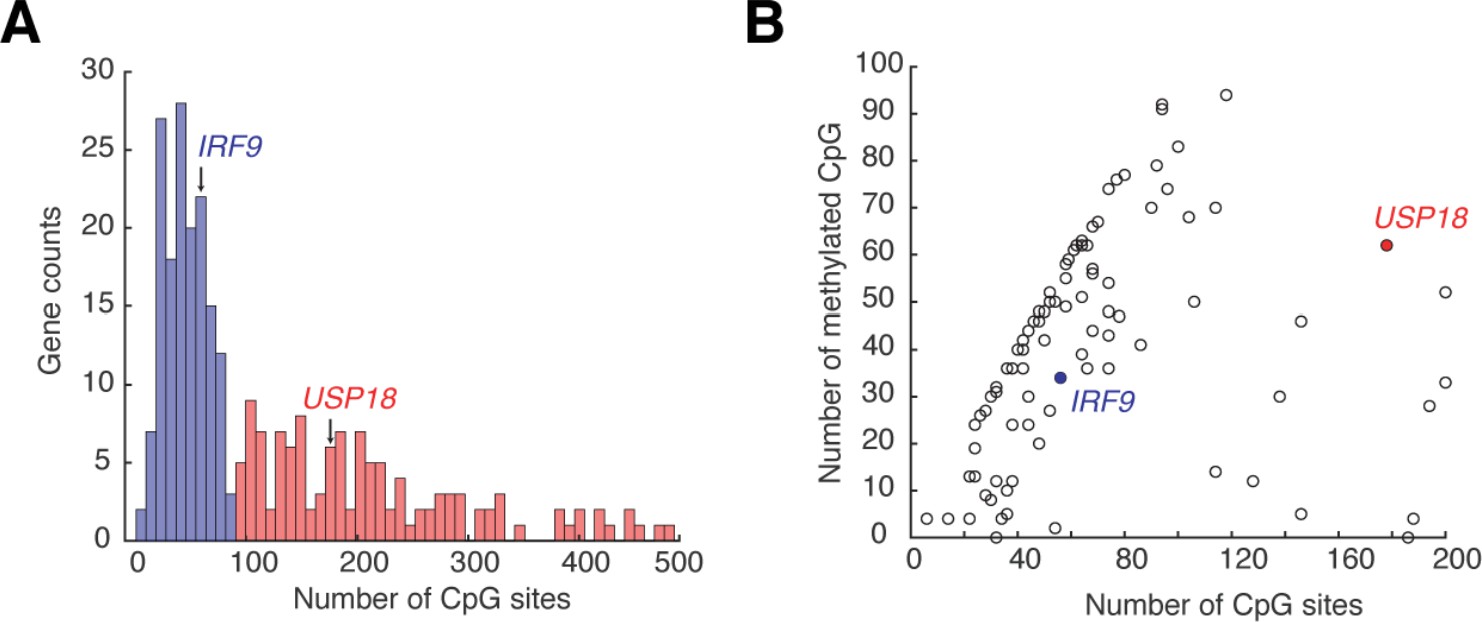
ISG promoters contain a wide range of CpG site numbers and methylation levels.
(A) Histogram showing the numbers of CpG sites at ISG promoters. The promoter region is defined as 1000 bp upstream of the transcription start site. The data are collected from ENCODE database and the list of the 278 ISGs is from Interferome Database. Blue bars: ISG promoters with less than 100 CpG sites; red bars: ISG promoters with more than 100 CpG sites. (B) Scatterplot showing the numbers of methylated CpG versus of the numbers of CpG sites for ISG promoters. A CpG site is considered methylated if the methylation level is greater than 50% according to the bisulfide sequencing. Data are from ENCODE database for HeLa cells.
Figure 5—figure supplement 4
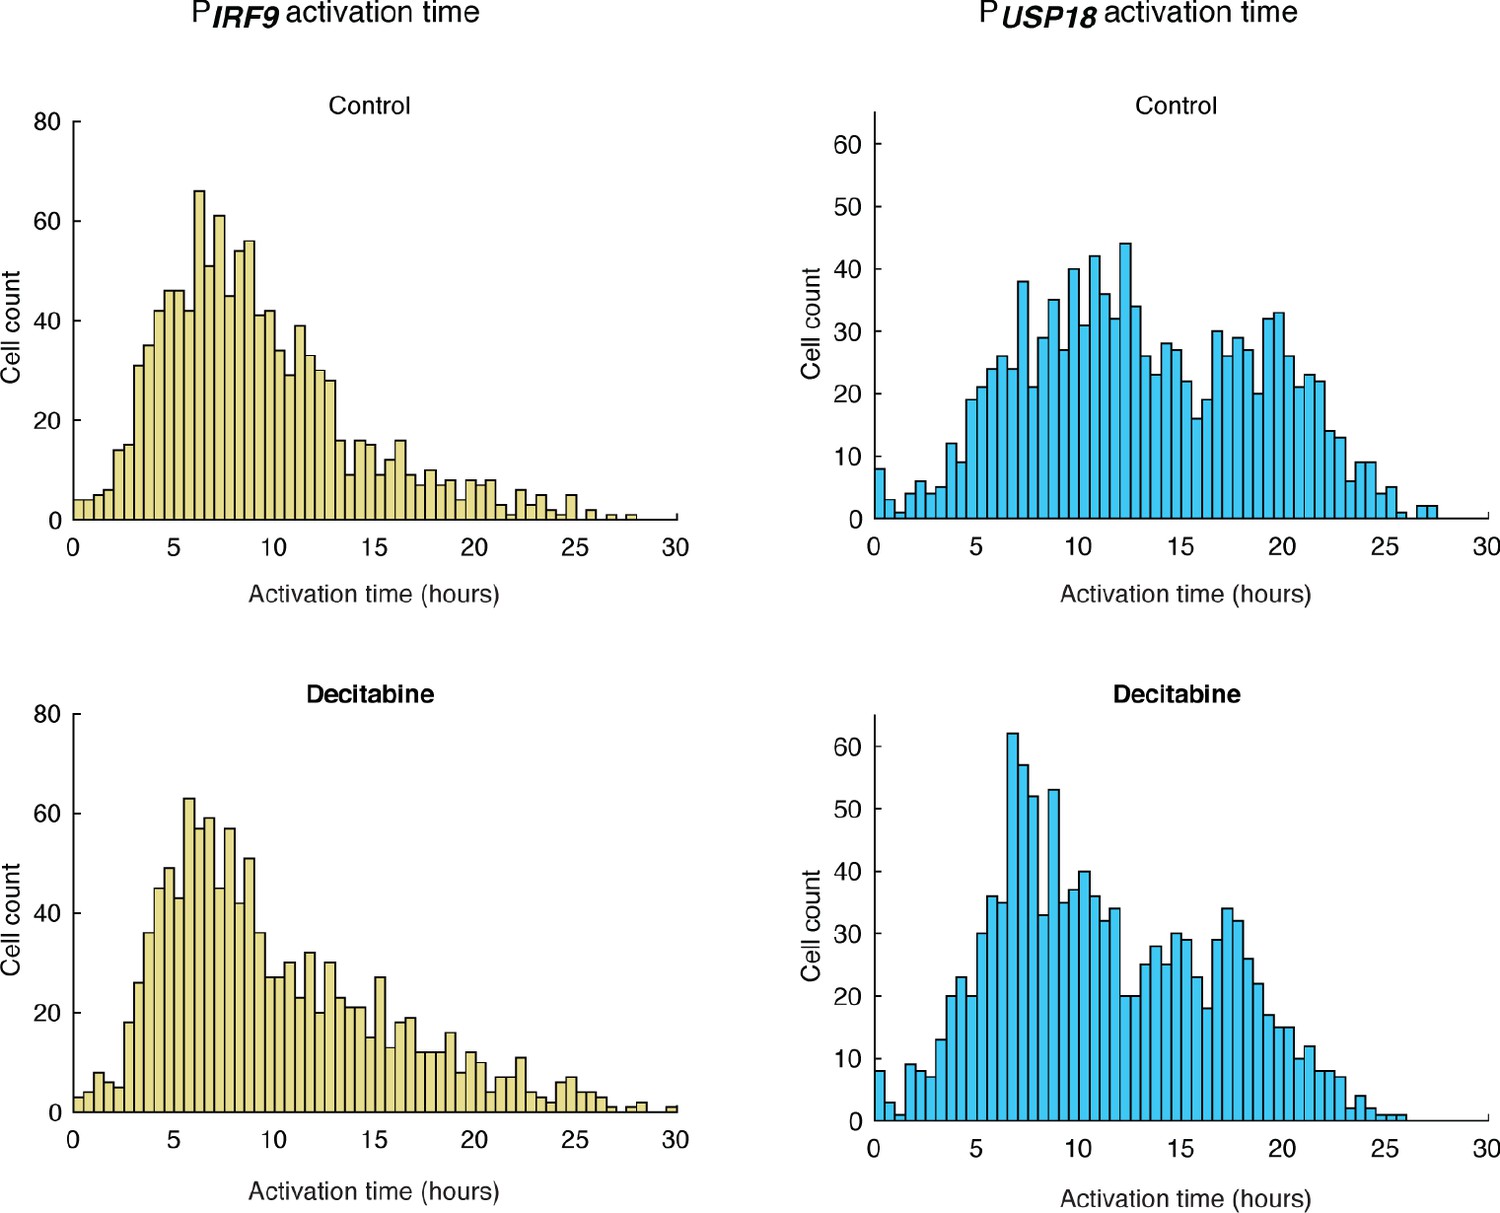
Distributions of PIRF9 and PUSP18 activation times in cells treated with decitabine.
Cells were cultured with medium in the absence (control) or presence of 100 μM decitabine for 48 hrs prior to 100 ng/ml IFN-α treatment. The mean activation times (with 95% confidence interval) of IRF9 were 9.1632 ± 0.2877 hrs (control) and 10.0063 ± 0.3244 hrs (decitabine), respectively. The coefficients of variance (CVs) for activation times of IRF9 were 0.5289 and 0.5604, respectively. The mean activation times (with 95% confidence interval) of USP18 were 13.1356 ± 0.3409 hrs (control) and 11.2538 ± 0.3071 hrs (decitabine), respectively. The CVs for activation times of USP18 were 0.4372 and 0.4718, respectively. The decitabine treatment increased the mean IRF9 activation time by 0.84 hr (+9.2%) and decreased the mean USP18 activation time by 1.88 hrs (−14.3%), both of which contribute to the decreased delay time.
Figure 5—figure supplement 5
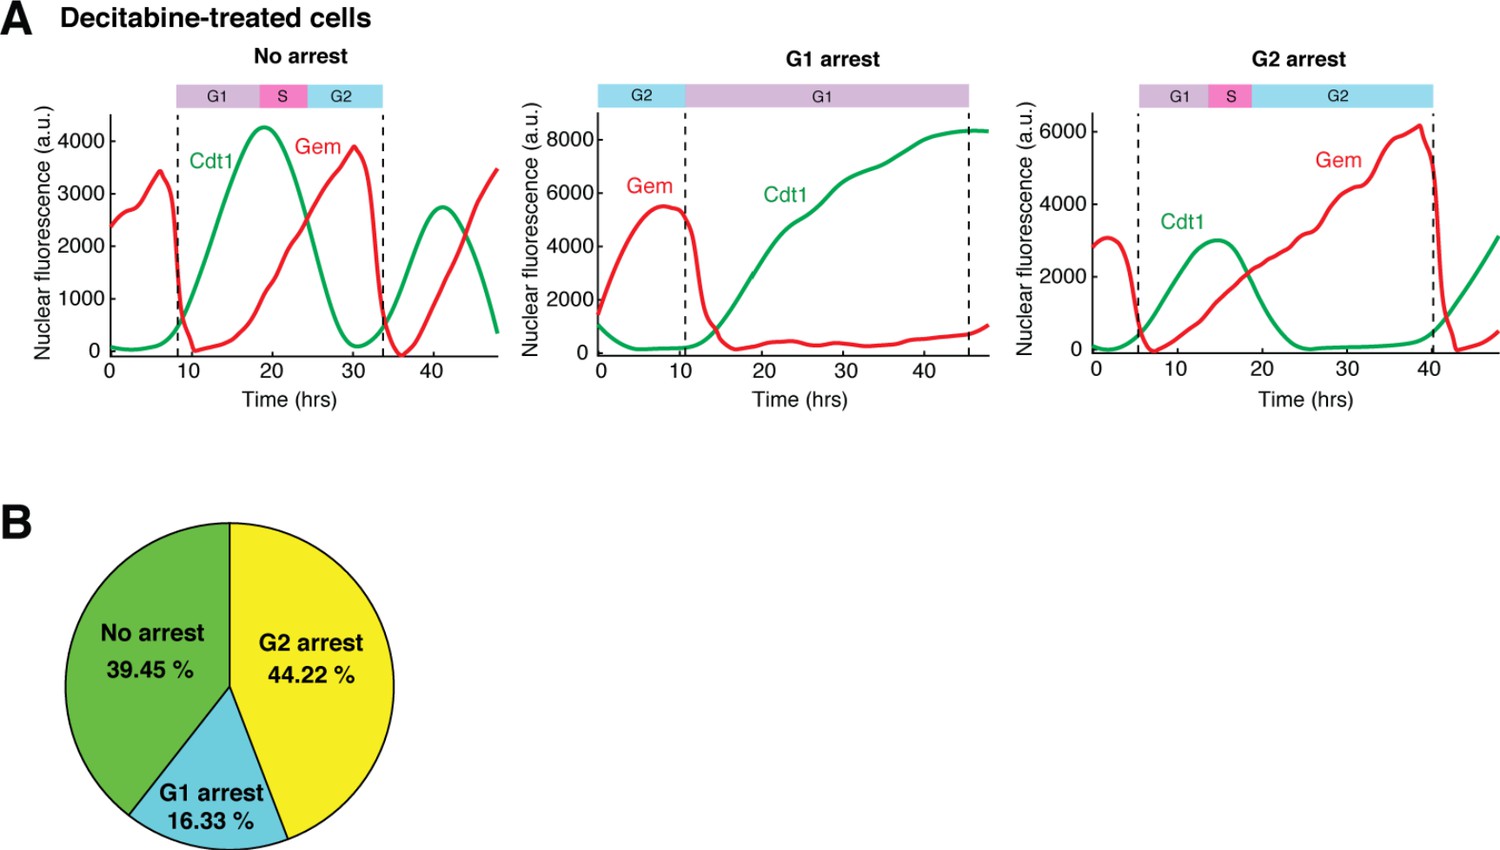
The effect of decitabine on cell cycle.
(A) Representative single-cell time traces from decitabine-treated cells. Cells were treated with 100 μM decitabine for 36 hrs prior to being imaged and kept in decitabine throughout the experiment. The FUCCI reporter dynamics (nuclear Cdt1 and Geminin) was tracked in single cells to determine their cell cycle phases and the type of cell cycle arrest. Decitabine-treated cells can be classified into three subgroups: cells with no arrest, cells in G1 arrest, and cells in G2 arrest. (B) Pie chart showing the proportions of cells with no arrest, arrested in G1, or arrested in G2 in a population of decitabine-treated cells.
Figure 6
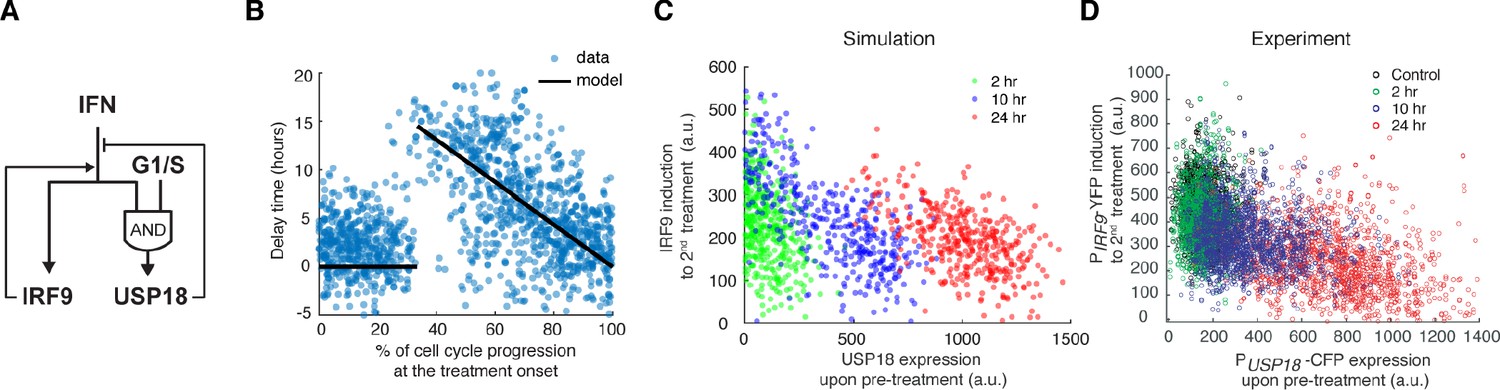
Stochastic simulations with the cell-cycle gated feedback control reproduced single-cell responses to IFN pretreatments with different durations.
(A) A diagram for the simple model of the IFN-driven gene regulatory network that incorporates the cell cycle gating of USP18 upregulation. (B) Cell-cycle-dependent delay times in the model determined by experimental data from Figure 4E. (C) Scatterplot showing the simulated responses under different pretreatment conditions. Stochastic simulations were performed for 400 times for each condition. In the scatterplot, each circle represents a single run with IRF9 induction in response to the second IFN-α treatment versus USP18 expression by the pretreatment. (D) Scatterplot showing the single-cell responses under different pretreatment conditions, from experimental data. PUSP18-CFP expression was measured at the end of the breaktime and the induction of PIRF9-YFP was measured 34 hrs after the second IFN-α input was added.
Videos
Video 1
Response of the dual reporter cell line to 100 ng/ml IFN-α treatment.
The image sequence was acquired for 50 hrs in which the first 2 hr were before the addition of IFN-α. The NLS-2xiRFP nuclear marker is shown in red and is merged with phase images of the cells. STAT1-mCherry and PIRF9-YFP in the same cells are also shown. Movie is shown at 50 frames/second.
Tables
Key resources table
| Reagent type (species) or resource | Designation | Source or reference | Identifiers | Additional information |
|---|---|---|---|---|
| Cell line (Homo sapiens) | HeLa PACTB-NLS-2iRFP-P2A-ACTB | This paper | NHM003 | Available upon request from Hao lab |
| Cell line (Homo sapiens) | HeLa PACTB-NLS-2iRFP-P2A-ACTB, PSTAT1-STAT1-mCherry | This paper | NHM008 | Available upon request from Hao lab |
| Cell line (Homo sapiens) | HeLa PACTB-NLS-2iRFP-P2A-ACTB, PSTAT1-STAT1-mCherry, PIRF9-IRF9-P2A-mCitrine | This paper | NHM025 | Available upon request from Hao lab |
| Cell line (Homo sapiens) | HeLa PACTB-NLS-2iRFP-P2A-ACTB, PSTAT1-STAT1-mCherry, PIRF9-IRF9-P2A-mCitrine, shRNA USP18 | This paper | NHM026 | Available upon request from Hao lab |
| Cell line (Homo sapiens) | HeLa PACTB-NLS-2iRFP-P2A-ACTB, PSTAT1-STAT1-mCherry, PIRF9-IRF9-P2A-mCitrine, shRNA USP18 negative control | This paper | NHM027 | Available upon request from Hao lab |
| Cell line (Homo sapiens) | HeLa PACTB-NLS-2iRFP-P2A-ACTB, PSTAT1-STAT1-mCherry, PIRF9-IRF9-P2A-mCitrine, shRNA SOCS1 | This paper | NHM031 | Available upon request from Hao lab |
| Cell line (Homo sapiens) | HeLa PACTB-NLS-2iRFP-P2A-ACTB, PSTAT1-STAT1-mCherry, PIRF9-IRF9-P2A-mCitrine, PUSP18-NLS-mCerulean-USP18 | This paper | NHM032 | Available upon request from Hao lab |
| Cell line (Homo sapiens) | HeLa PACTB-NLS-2iRFP-P2A-ACTB, PUSP18-NLS-mCerulean-USP18, PCMV-DHB-mCherry | This paper | NHM035 | Available upon request from Hao lab |
| Cell line (Homo sapiens) | HeLa PACTB-NLS-2iRFP-P2A-ACTB, PUSP18-NLS-mCerulean-USP18, PCMV-mCh-Gem1-P2A-CFP-Cdt1 | This paper | NHM036 | Available upon request from Hao lab |
Additional files
-
Supplementary file 1
Primers used in this study.
- https://cdn.elifesciences.org/articles/58825/elife-58825-supp1-v1.docx
-
Supplementary file 2
Plasmids constructed in this study.
- https://cdn.elifesciences.org/articles/58825/elife-58825-supp2-v1.docx
-
Supplementary file 3
Best-fit parameter values of the model.
- https://cdn.elifesciences.org/articles/58825/elife-58825-supp3-v1.docx
-
Transparent reporting form
- https://cdn.elifesciences.org/articles/58825/elife-58825-transrepform-v1.docx
Download links
A two-part list of links to download the article, or parts of the article, in various formats.
Downloads (link to download the article as PDF)
Open citations (links to open the citations from this article in various online reference manager services)
Cite this article (links to download the citations from this article in formats compatible with various reference manager tools)
Cell-cycle-gated feedback control mediates desensitization to interferon stimulation
eLife 9:e58825.
https://doi.org/10.7554/eLife.58825


