Belief updating in bipolar disorder predicts time of recurrence
- Psychiatry Unit, Department of Medicine and Surgery, Università di Parma, Italy
- Department of Experimental Psychology, University of Oxford, United Kingdom
- Affective Brain Lab, Department of Experimental Psychology, University College London, United Kingdom
Figures
Figure 1
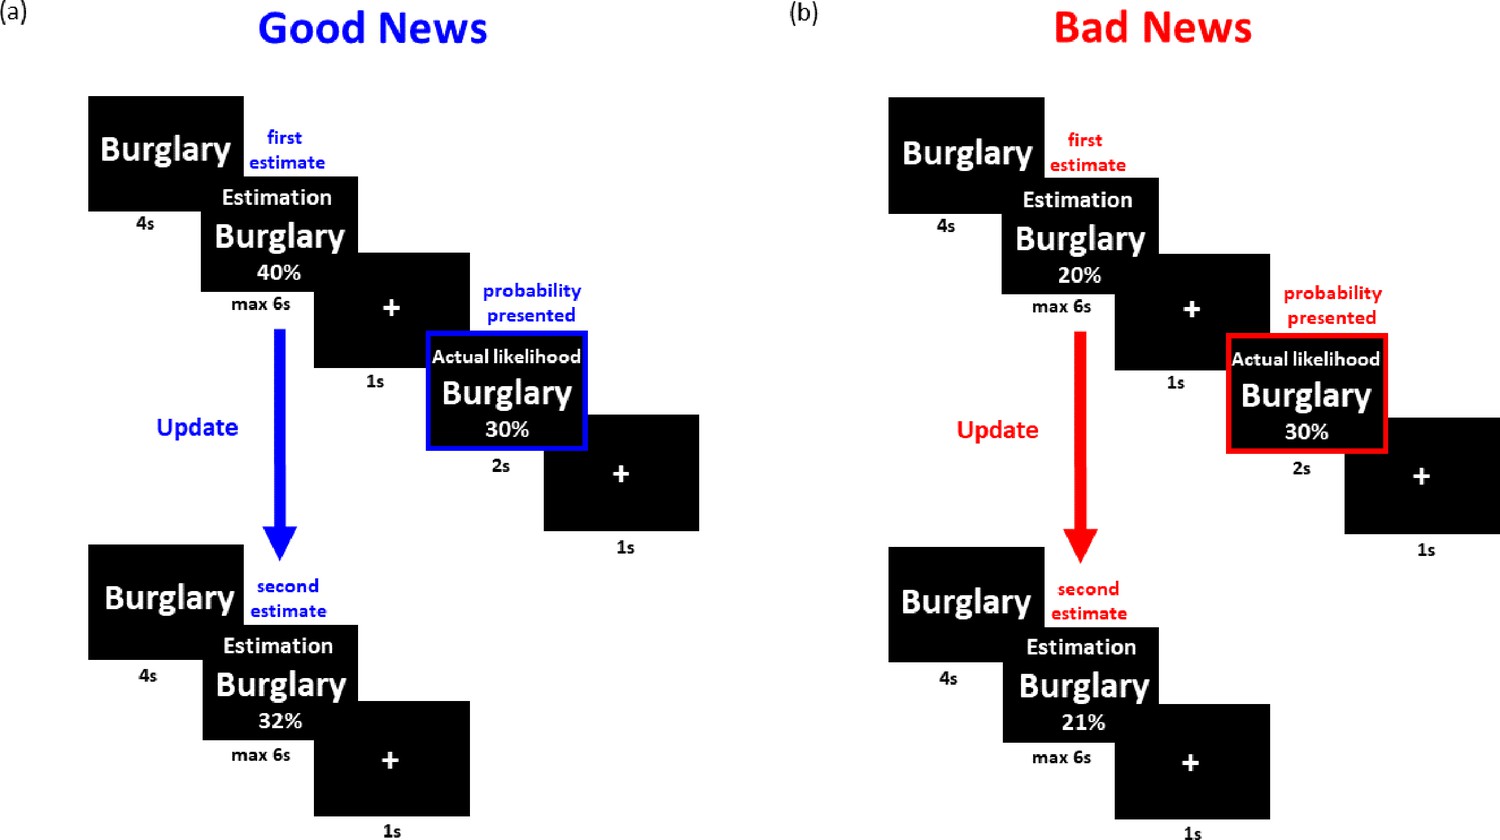
Belief update task.
In the first session (top row), on each trial, participants were presented with a short description of an adverse life event and asked to estimate how likely this event was to occur to them in the future. They were then presented with the probability of that event occurring to someone from the same age, location, and socio-economic background as them. After completing 40 such trials they then completed the second session (bottom row). This was the same as the first except that the average probability of the event to occur was not presented. Shown are examples of trials for which the participant’s estimate was higher or lower than the statistical information provided leading to receipt of (a) good news and (b) bad news, respectively. Update is calculated as the difference between participants estimates in the two sessions (i.e. pre- and post-information). The blue and red boxes are here to illustrated good and bad news, and did not appear in the actual experiment.
Figure 2
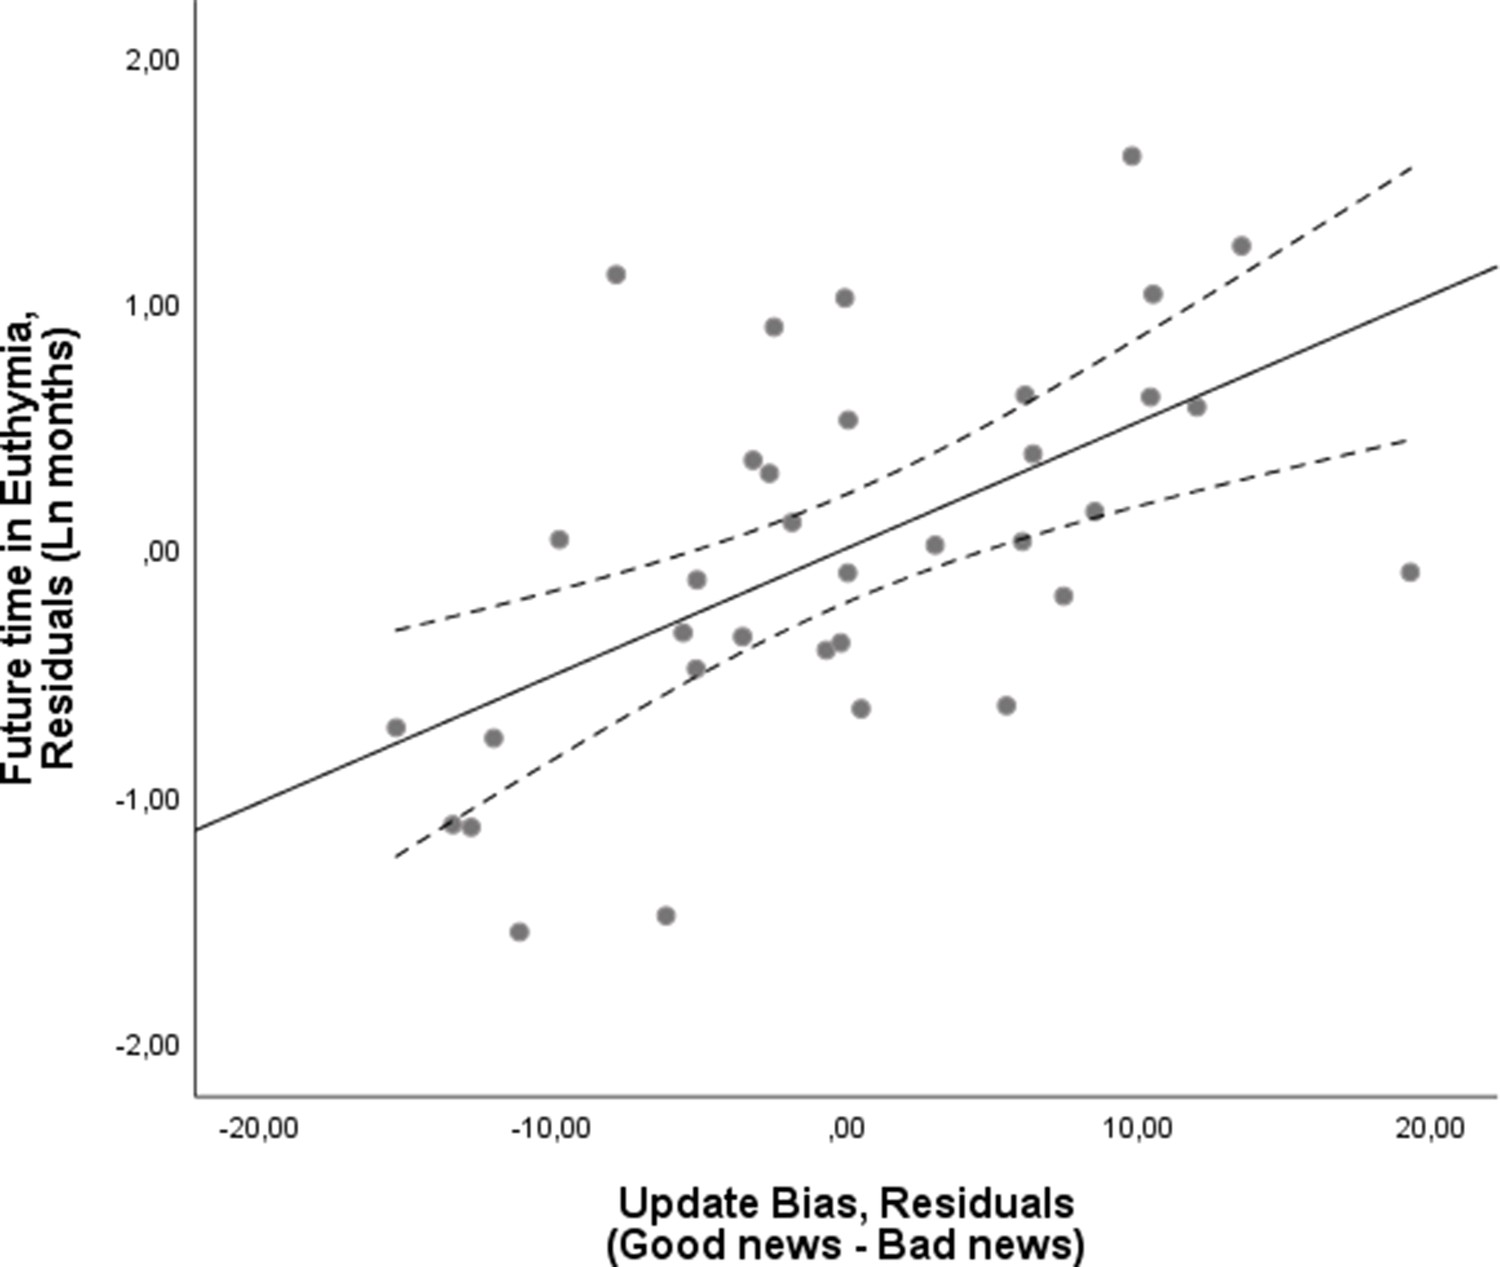
Larger update bias is associated with longer future time in euthymia.
Larger optimistic update bias at test is associated with future time in euthymia. The X-axis represents the residuals in predicting the update bias from all the independent variables included in the model as a control. These are the subjects’ prior beliefs represented by their mean first estimate and the difference between good news trials and bad news trials on estimation errors, memory error, number of trials, reaction times at the first and second estimates and all the subjective ratings. The Y-axis represents the residuals from predicting time in euthymia (logarithmic transformed to account for skewedness) from the same independent variables, that is the full model without the Update Bias. The dotted lines represent 95% confidence intervals.
Figure 3
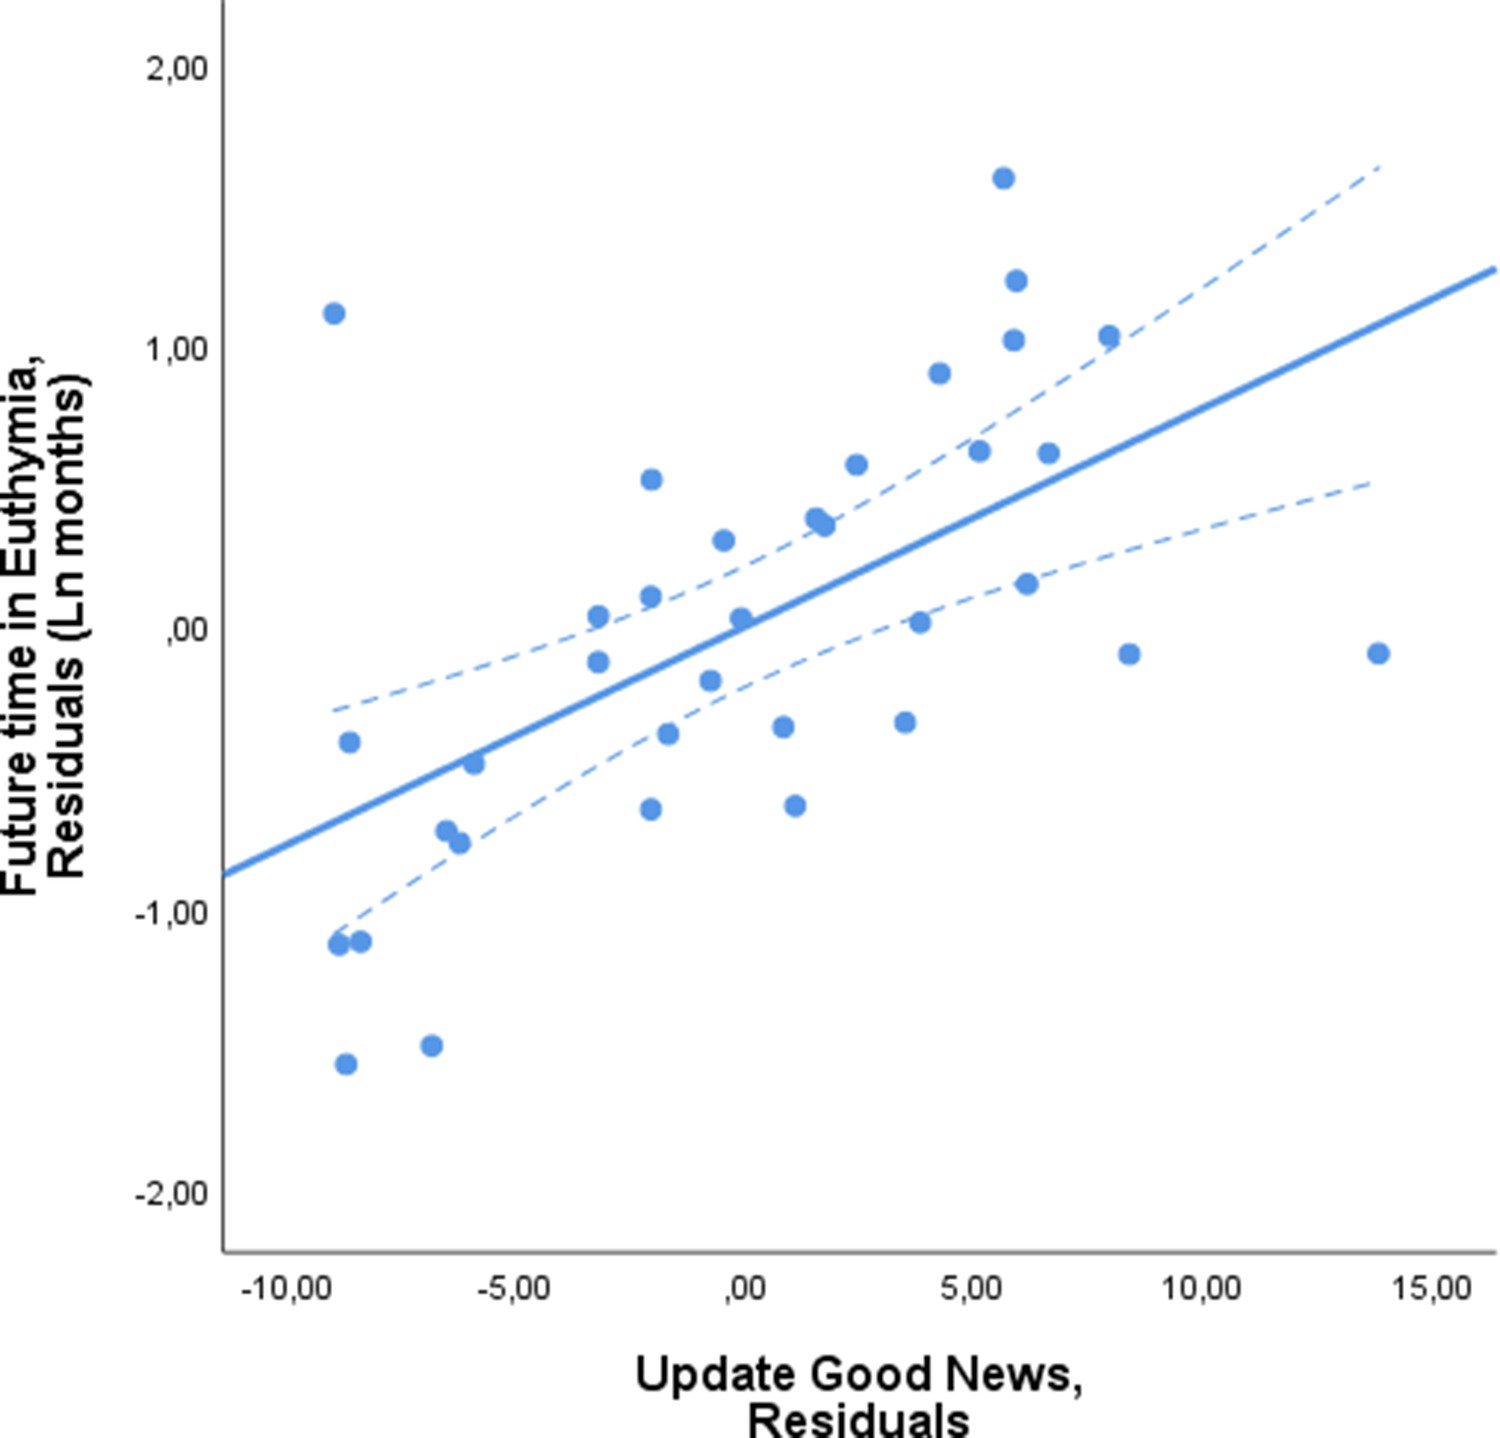
Future time in euthymia is related to greater belief updating in response to good news.
Future time in euthymia was positively related to updating in response to good news. The X-axis represents the residuals in predicting the Update in response to good news from all the independent variables included in the model as a control. These are the subjects’ prior beliefs represented by their mean first estimate and the difference between good news trials and bad news trials on estimation errors, memory error, number of trials, reaction times at the first and second estimate and all the subjective ratings. The Y-axis represents the residuals from predicting time in euthymia (logarithmic transformed to account for skewedness) from the same independent variables. The dotted lines represent 95% confidence intervals.
Figure 4
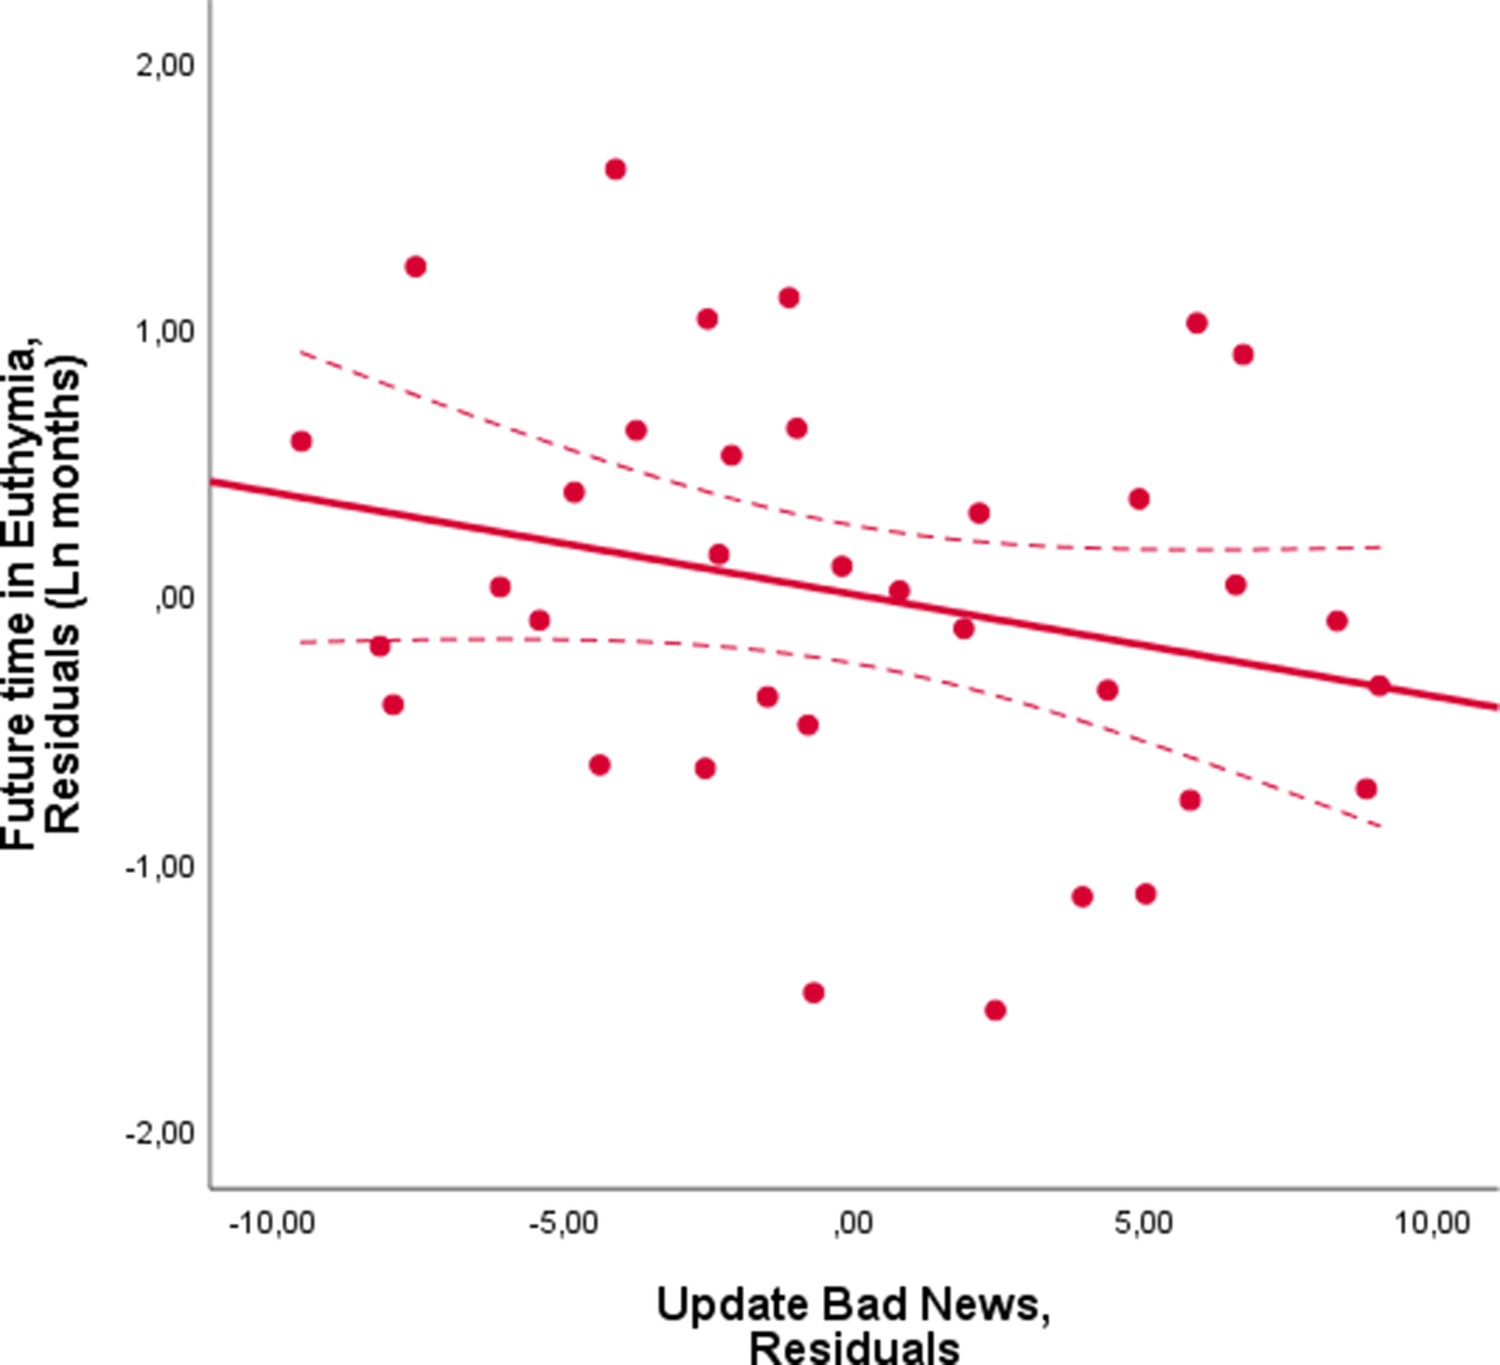
Future time in euthymia is related to smaller belief updating in response to bad news.
Future time in euthymia showed a negative, non-significant, association with updating in response to bad news. The X-axis represents the residuals in predicting the Update score in response to bad news from all the independent variables included in the model as a control. These are the subjects’ prior beliefs represented by their mean first estimate and the difference between good news trials and bad news trials on estimation errors, memory error, number of trials, reaction times at the first and second estimate and all the subjective ratings. The Y-axis represents the residuals from predicting time in euthymia (logarithmic transformed to account for skewedness) from the same independent variables. The dotted lines represent 95% confidence intervals.
Additional files
-
Supplementary file 1
Sample descriptive (a) and task-related variables (b).
- https://cdn.elifesciences.org/articles/58891/elife-58891-supp1-v1.doc
-
Supplementary file 2
Regression coefficients for Model 1 when the predictor of interest are the update bias (a), update from good news (b) and update from bad news (c), and for Model 2 (d).
- https://cdn.elifesciences.org/articles/58891/elife-58891-supp2-v1.doc
-
Supplementary file 3
Correlations among the independent variables included in the Models.
- https://cdn.elifesciences.org/articles/58891/elife-58891-supp3-v1.docx
-
Transparent reporting form
- https://cdn.elifesciences.org/articles/58891/elife-58891-transrepform-v1.docx
Download links
A two-part list of links to download the article, or parts of the article, in various formats.
Downloads (link to download the article as PDF)
Open citations (links to open the citations from this article in various online reference manager services)
Cite this article (links to download the citations from this article in formats compatible with various reference manager tools)
Belief updating in bipolar disorder predicts time of recurrence
eLife 9:e58891.
https://doi.org/10.7554/eLife.58891


