Cellular taxonomy and spatial organization of the murine ventral posterior hypothalamus
- Department of Physiology and Neurobiology, University of Connecticut, United States
- Connecticut Institute for the Brain and Cognitive Sciences, United States
- The Jackson Laboratory for Genomic Medicine, United States
- Department of Genetics and Genome Sciences, University of Connecticut Health Center, United States
- Institute for Systems Genomics, University of Connecticut, United States
Figures
Figure 1 with 5 supplements
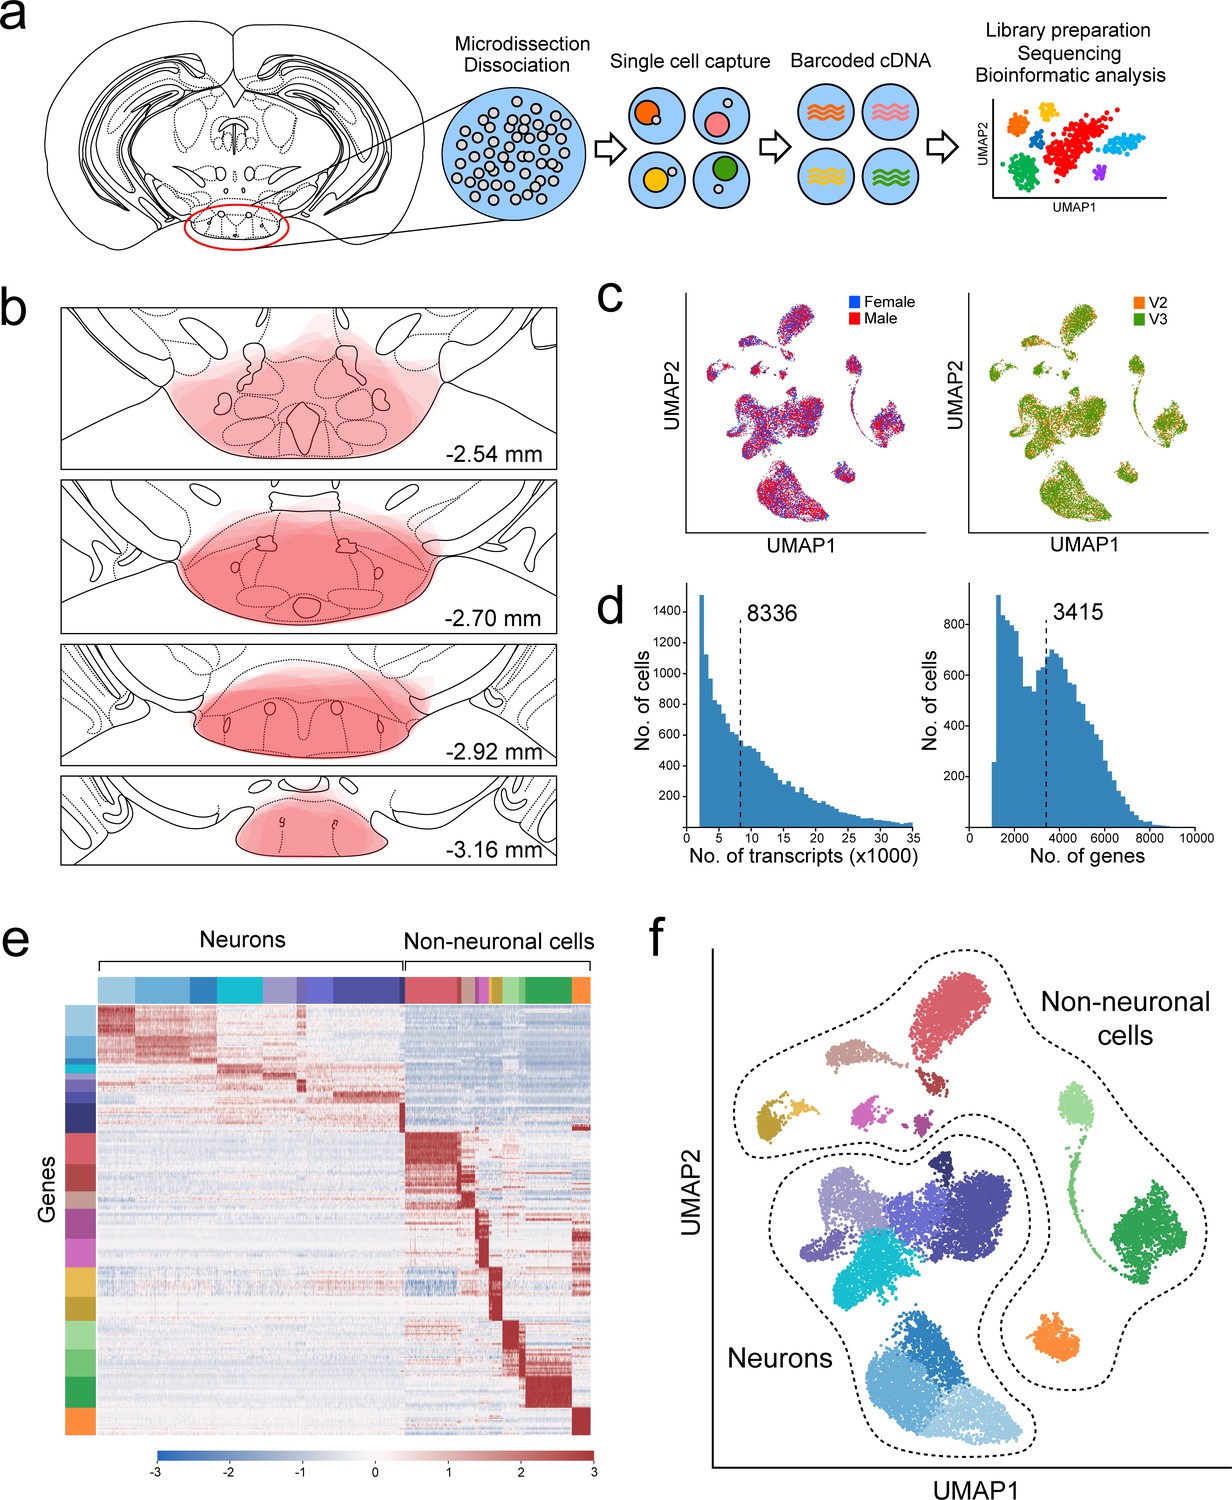
Overview of VPH microdissection, single-cell isolation, batch correction, and clustering.
(a) Workflow schematic representing the VPH microdissection from coronal mouse brain slices, single-cell dissociation, sequencing library preparation, and bioinformatic analysis (Mickelsen et al., 2019). (b) Location of VPH microdissections mapped onto the coronal mouse brain atlas at distances from bregma of −2.54, –2.70, −2.92, and –3.16 mm. Atlas images were modified from Paxinos, 2012. (c) Two-dimensional UMAP plots representing 16,991 single cells from four sequencing libraries color-coded by mouse sex (left) and the 10x Genomics chemistry version (right) following batch correction. (d) Histograms of unique transcripts (left) and genes (right) were detected in 16,991 single cells after quality control. Dashed vertical lines represent the median transcripts and genes per cell, respectively. (e) Heatmap and (f) UMAP plot showing the first iteration of unsupervised clustering revealing 20 unique clusters. Neuronal populations are disjoint from non-neuronal populations.
Figure 1—figure supplement 1
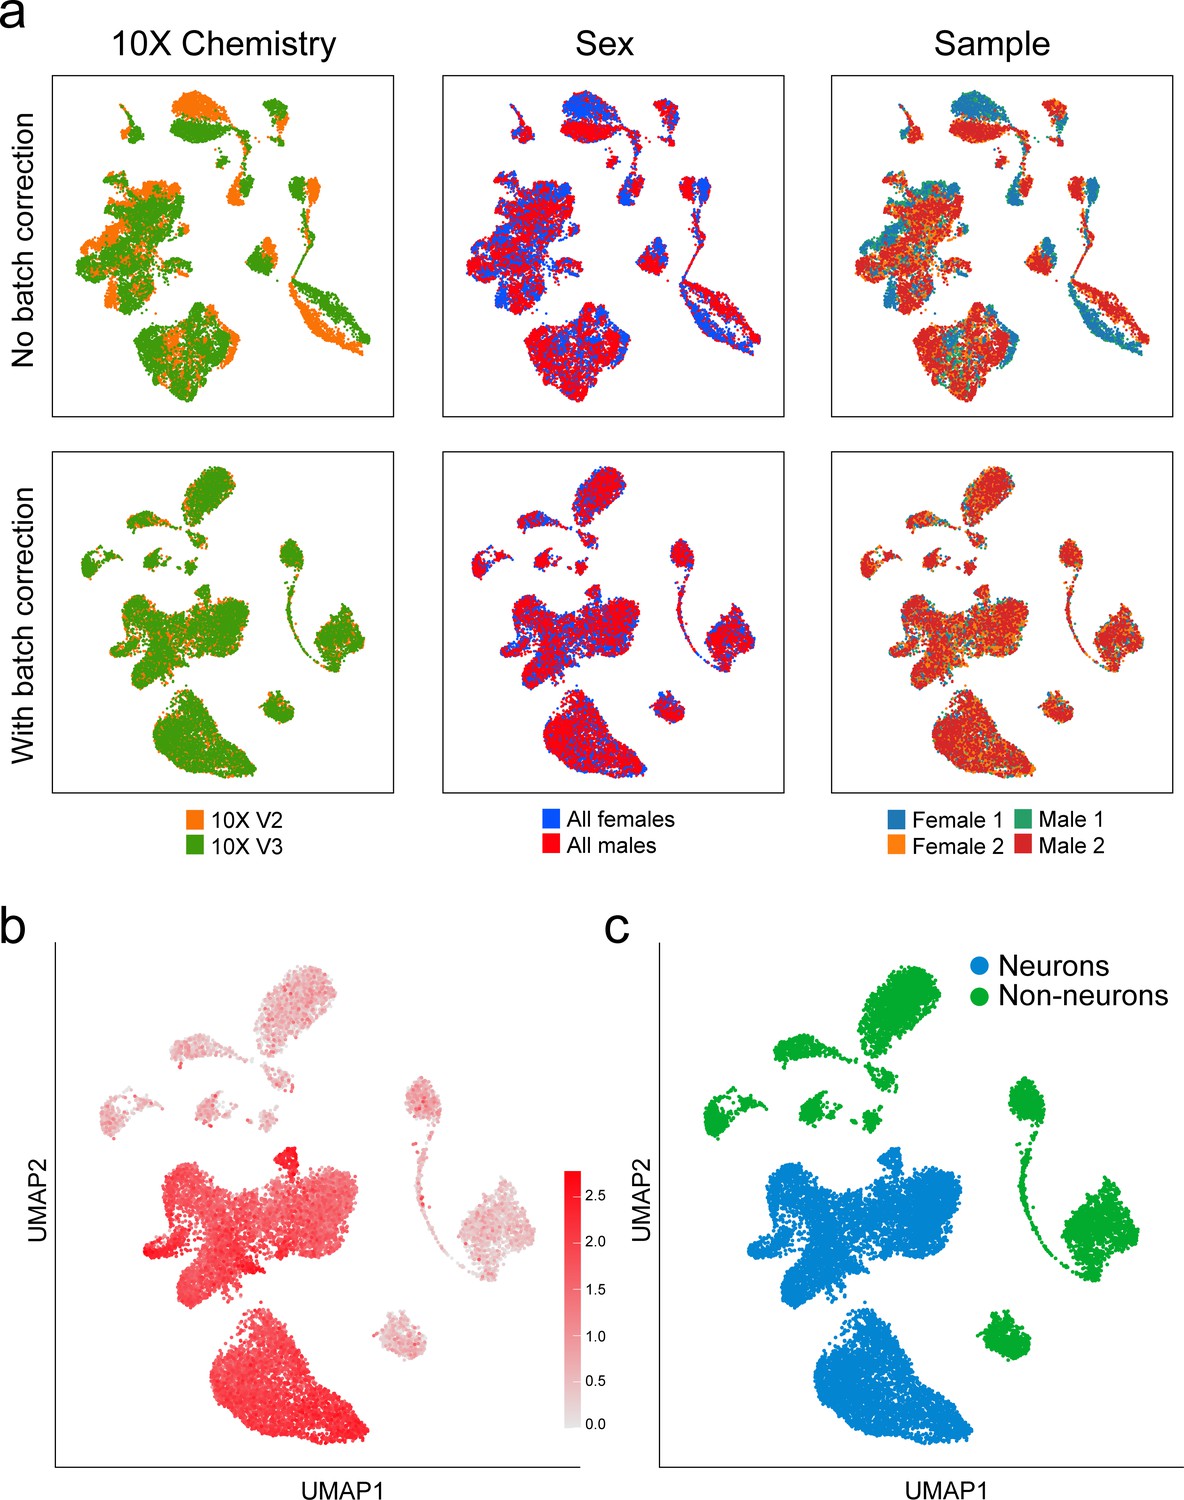
Batch correction for sex and 10x Genomics chemistry versions.
(a) When libraries were combined bioinformatically, we assessed the need for batch correction by visualizing the libraries with (lower) and without (upper) Harmony batch correction (Korsunsky et al., 2019). Batch effects correlated with 10x Genomics chemistry version were observed but no batch effects were associated with mouse sex. (b) UMAP plot of average normalized expression of pan-neuronal markers Snap25, Syp, Tubb3, and Elavl2 across all cells before the first iteration of unsupervised clustering. (c) A two-class Gaussian mixture model was trained using the expression of these four genes to segregate neuronal cells (blue) from non-neuronal cells (green).
Figure 1—figure supplement 2
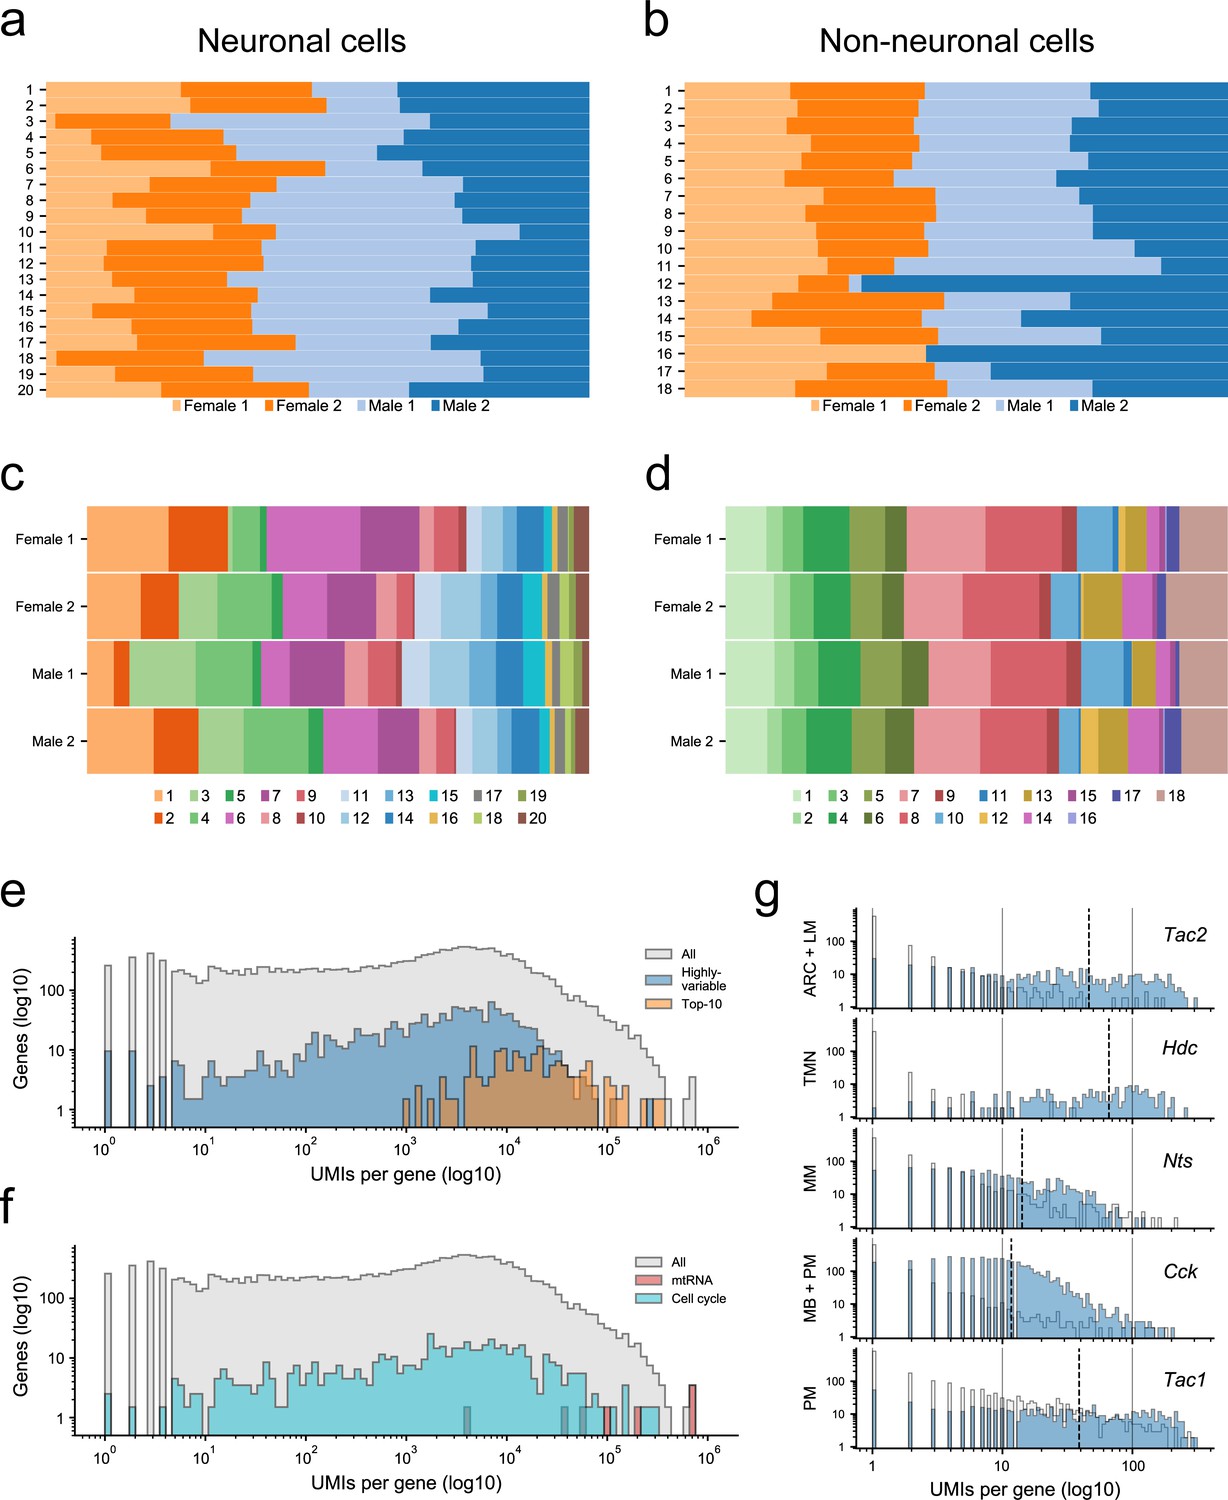
Proportion of cells derived from each sample and identification of discriminatory marker genes.
(a) Proportion of cells from each sample (female 1 and 2; male 1 and 2) contributing to each neuronal cluster (1-20); (b) and to each non-neuronal cluster (1-18). (c) Proportion of cells contributing to each neuronal cluster within each sample, and (d) contributing to each non-neuronal cluster within each sample. (e) Histogram of the number of unique transcripts (UMIs) per gene in the set of all genes (all, gray), in the set genes used to guide dimensionality reduction and clustering (highly-variable, blue), and in the set of genes used as marker genes (Top10, orange). Both the x-axis (UMIs per gene) and y-axis (number of genes) are represented on a log10-scale. (f) Same as (a) but shows the distribution of UMIs per gene in the set mitochondrial genes (mtRNA, red), and set of cell-cycle related genes (cell cycle, cyan). (g) The number of unique transcripts per cell for five representative marker genes. Each subpanel shows two distributions of UMIs/cell for a specific gene (shown in the top right corner): the distribution of UMIs/cell in cells of the population(s) for which this gene is a marker (blue), and the distribution of UMIs/cell in all other cells (gray). The population(s), which each gene identifies, is shown on the y-axis.
Figure 1—figure supplement 3

Testing marker gene specificity with a classification model.
(a) A schematic of the cluster classification scheme used to demonstrate the number of marker genes needed to discriminate transcriptional clusters. (b) Class-balanced accuracy showing the overall performance of a random forest classifier trained on k = 2, 3, 5, 10, 15, 20 marker genes per cluster. (c) The per-anatomical-region and (d) per-cluster sensitivity of the cluster classifier. For regions with multiple clusters, a 95% confidence interval is shown as transparent bands around the mean (thick line). (e) Confusion matrix of the k = 10 classifier which shows how the classifier labeled cells from each cluster. The shade of each box represents the fraction of cells in a row assigned to that cluster by the classifier. The ground truth (original cluster labeling) is shown on the y-axis and the predicted clusters are shown on the x-axis. For example, the box with coordinates (GLUT7, GLUT10) shows the fraction of GLUT10 cells assigned to GLUT7 by the classifier. (f) The total number of cells in each cluster. Clusters with few cells dominate the misclassifications shown in panel (e). (g) For each value of k = 2, 3, 5, 10, 15, 20, k marker genes are selected from each of the 20 neuronal clusters and the combined set of marker genes is used to build the classifier model. This table lists the total number of genes corresponding to each value of k. The gene set sizes are strictly less than 20*k because some marker genes mark multiple populations and are only included once.
Figure 1—figure supplement 4
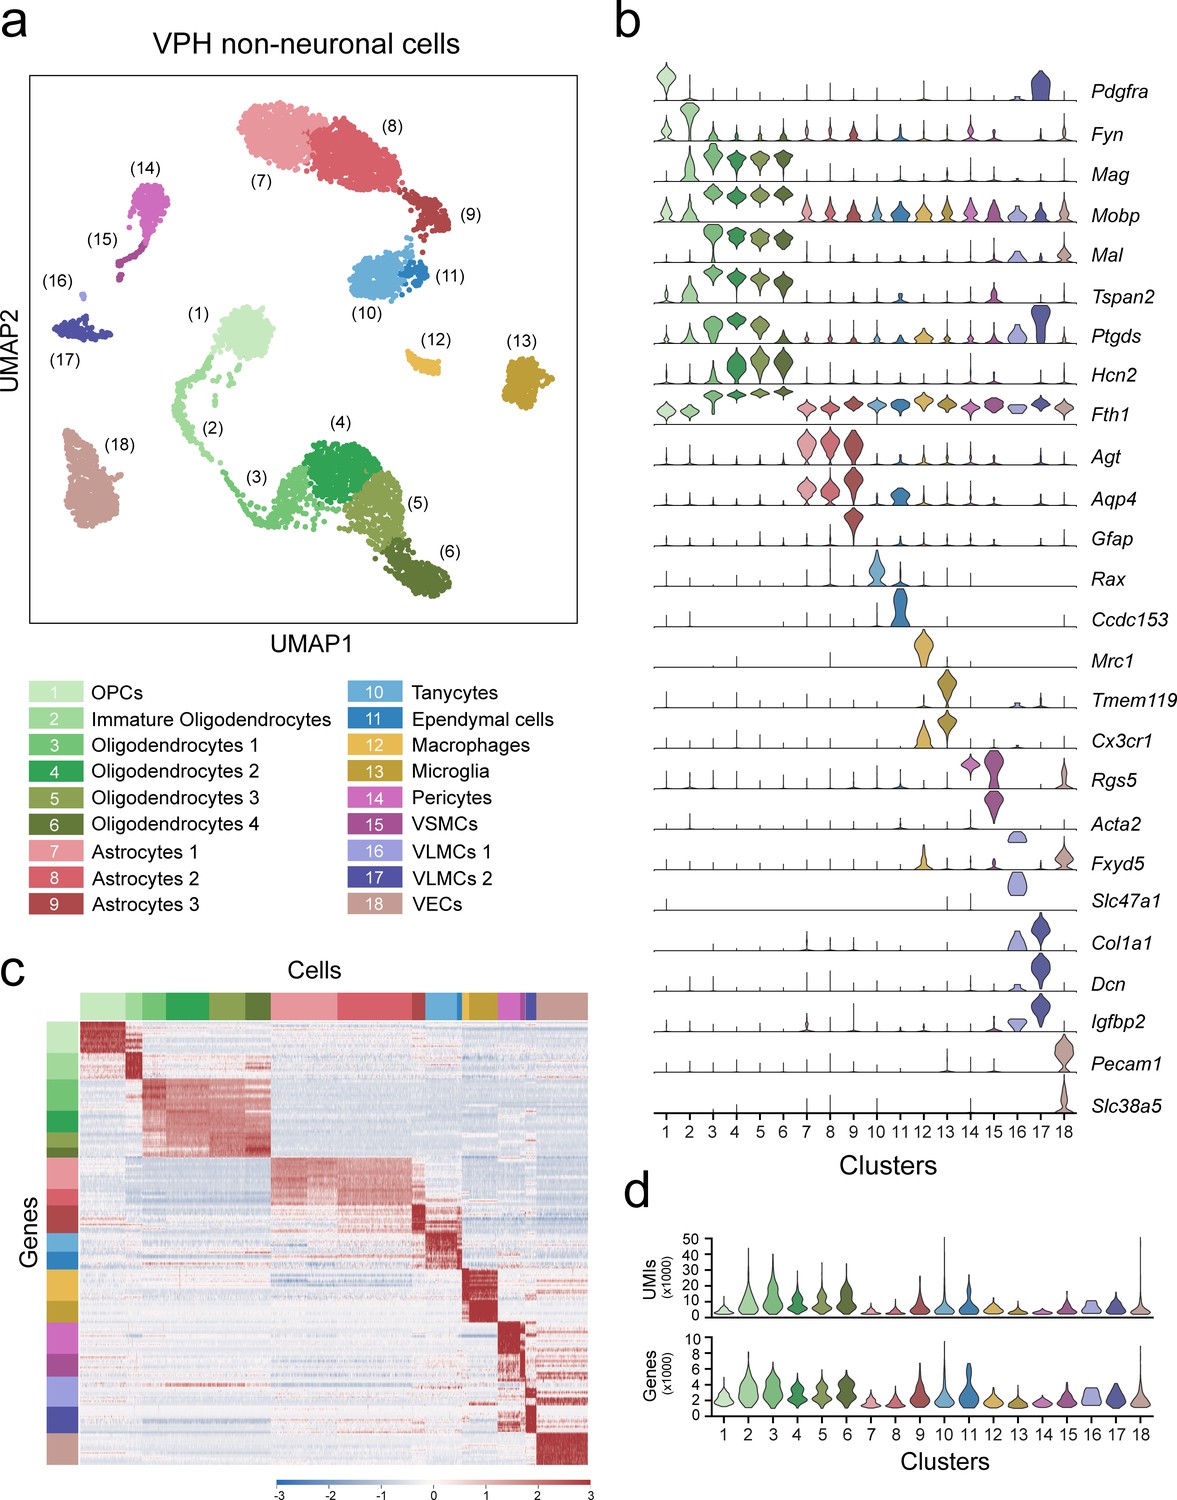
Classification of VPH non-neuronal populations.
(a) UMAP plot showing unsupervised clustering of 18 VPH non-neuronal cells. (b) Violin plot showing the distribution of normalized expression of discriminatory marker genes in each cluster. Abbreviations: OPCs, oligodendrocyte precursor cells; VSMCs, vascular smooth muscle cells; VLMCs, vascular leptomeningeal cells; and VECs, vascular endothelial cells. (c) Heatmap showing scaled expression of discriminatory genes across all 18 non-neuronal clusters. (d) Violin plots showing the distribution of the number of unique transcripts (upper) and the number of genes in each non-neuronal cluster.
Figure 1—figure supplement 5
Key discriminatory marker genes of oligodendrocyte-lineage cells, astrocytes, tanycytes, and ependymal cells.
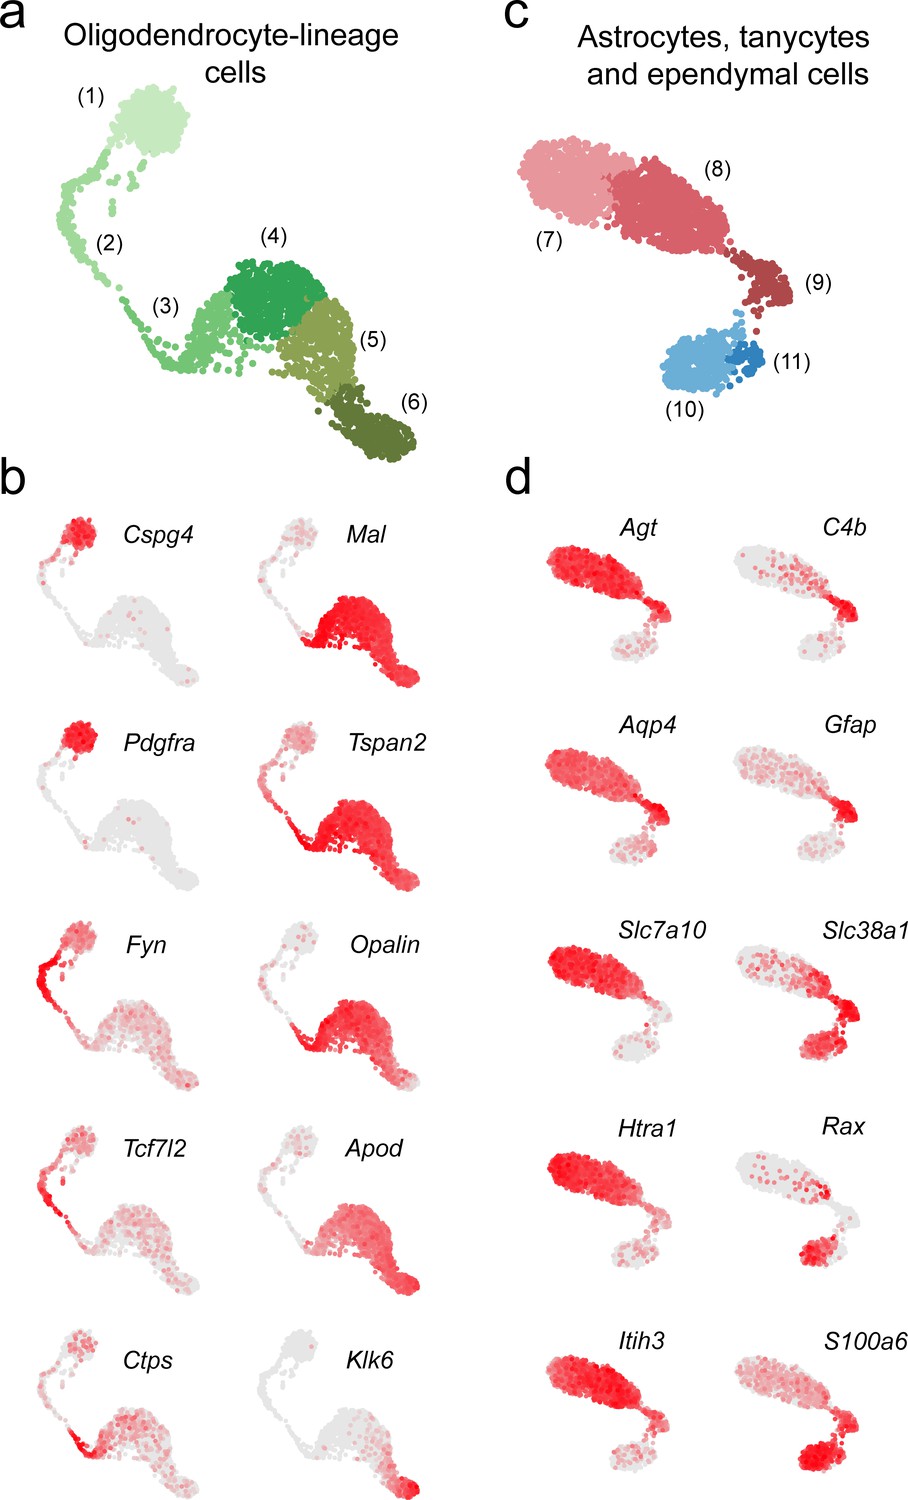
(a) UMAP plot showing just non-neuronal clusters 1–6 (detail of Figure 1—figure supplement 4a). (b) Series of UMAP plots showing normalized expression of 10 key discriminatory marker genes for subpopulations of oligodendrocyte lineage cells. (c) UMAP plot showing just non-neuronal clusters 7–11 (detail of Figure 1—figure supplement 4a). (d) Series of UMAP plots showing normalized expression of 10 key discriminatory marker genes for astrocyte subpopulations, tanycytes, and ependymal cells.
Figure 2
Classification of VPH neuronal populations.
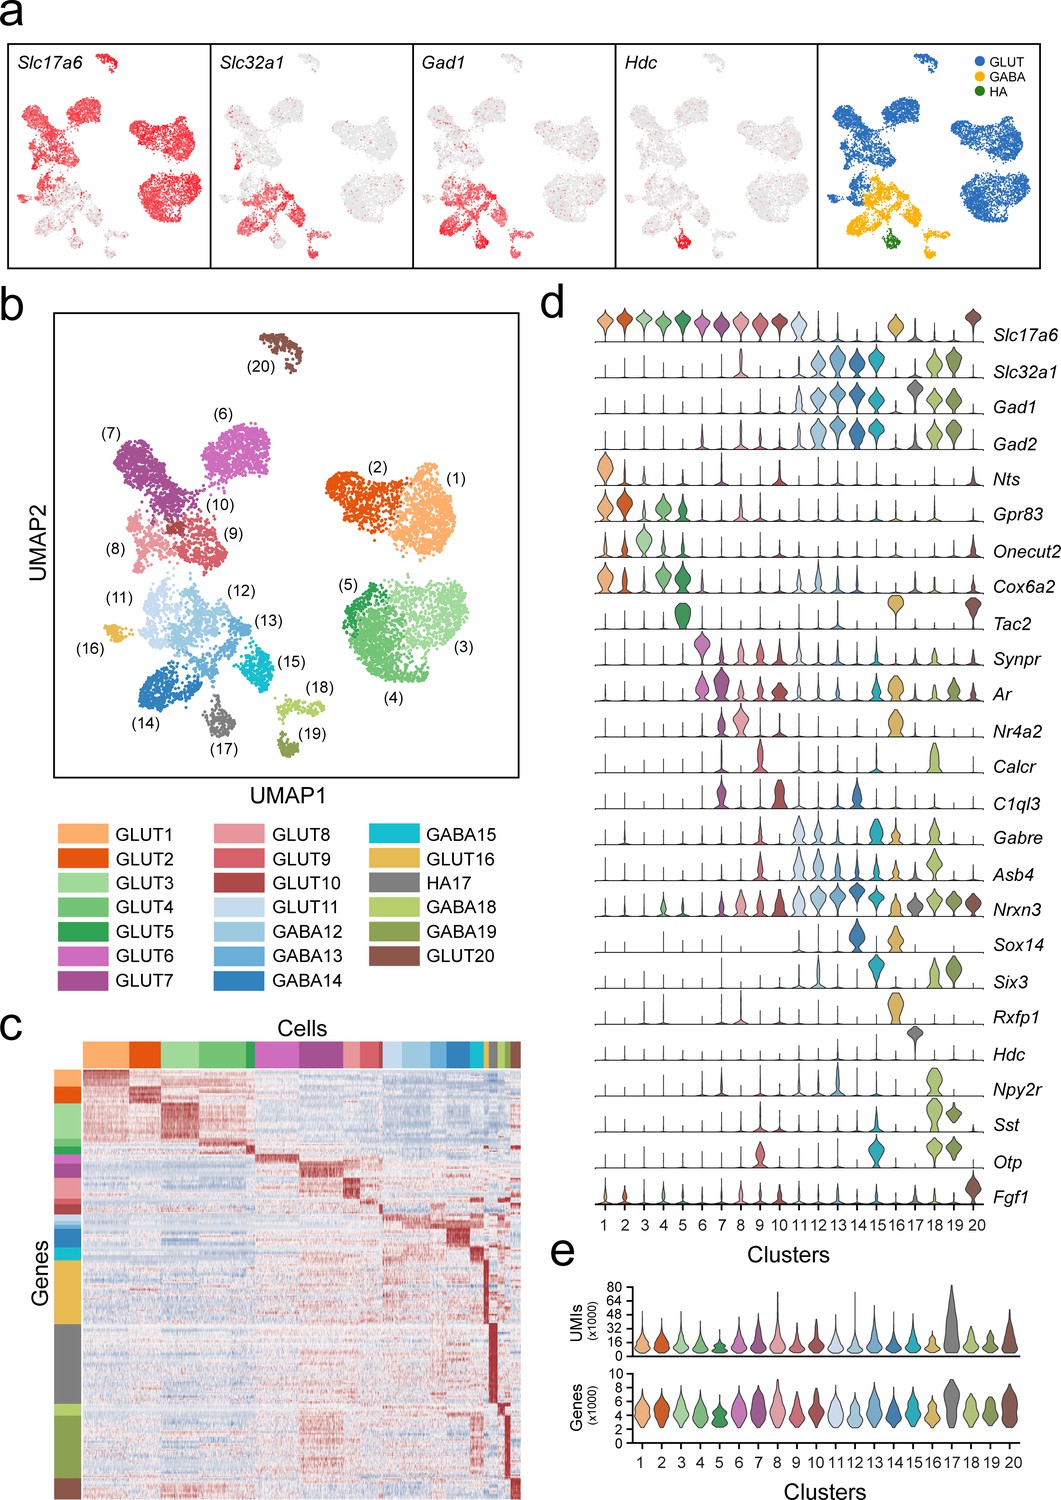
(a) UMAP plots showing normalized expression of Slc17a6, Slc32a1, Gad1, and Hdc after the second iteration of unsupervised clustering on just neuronal cells. Using these four genes, neurons were classified by a three-class Gaussian mixture model as glutamatergic (GLUT, blue), GABAergic (GABA, yellow), or histaminergic (HA, green). (b) Unsupervised clustering of 20 VPH neuronal cell types shown in a UMAP embedding. (c) Heatmap showing scaled expression of discriminatory genes across all 20 neuronal clusters. (d) Violin plot showing the distribution of normalized expression in each cluster of neurotransmitters (Slc17a6, Slc32a1, Gad1, Gad2) (upper) and discriminatory marker genes (lower). (e) Violin plots showing the distribution of the number of unique transcripts (upper) and the number of genes (lower) in each neuronal cluster.
Figure 3 with 1 supplement
Identification of a population of putative PMv neurons and a catecholaminergic PMv subpopulation.
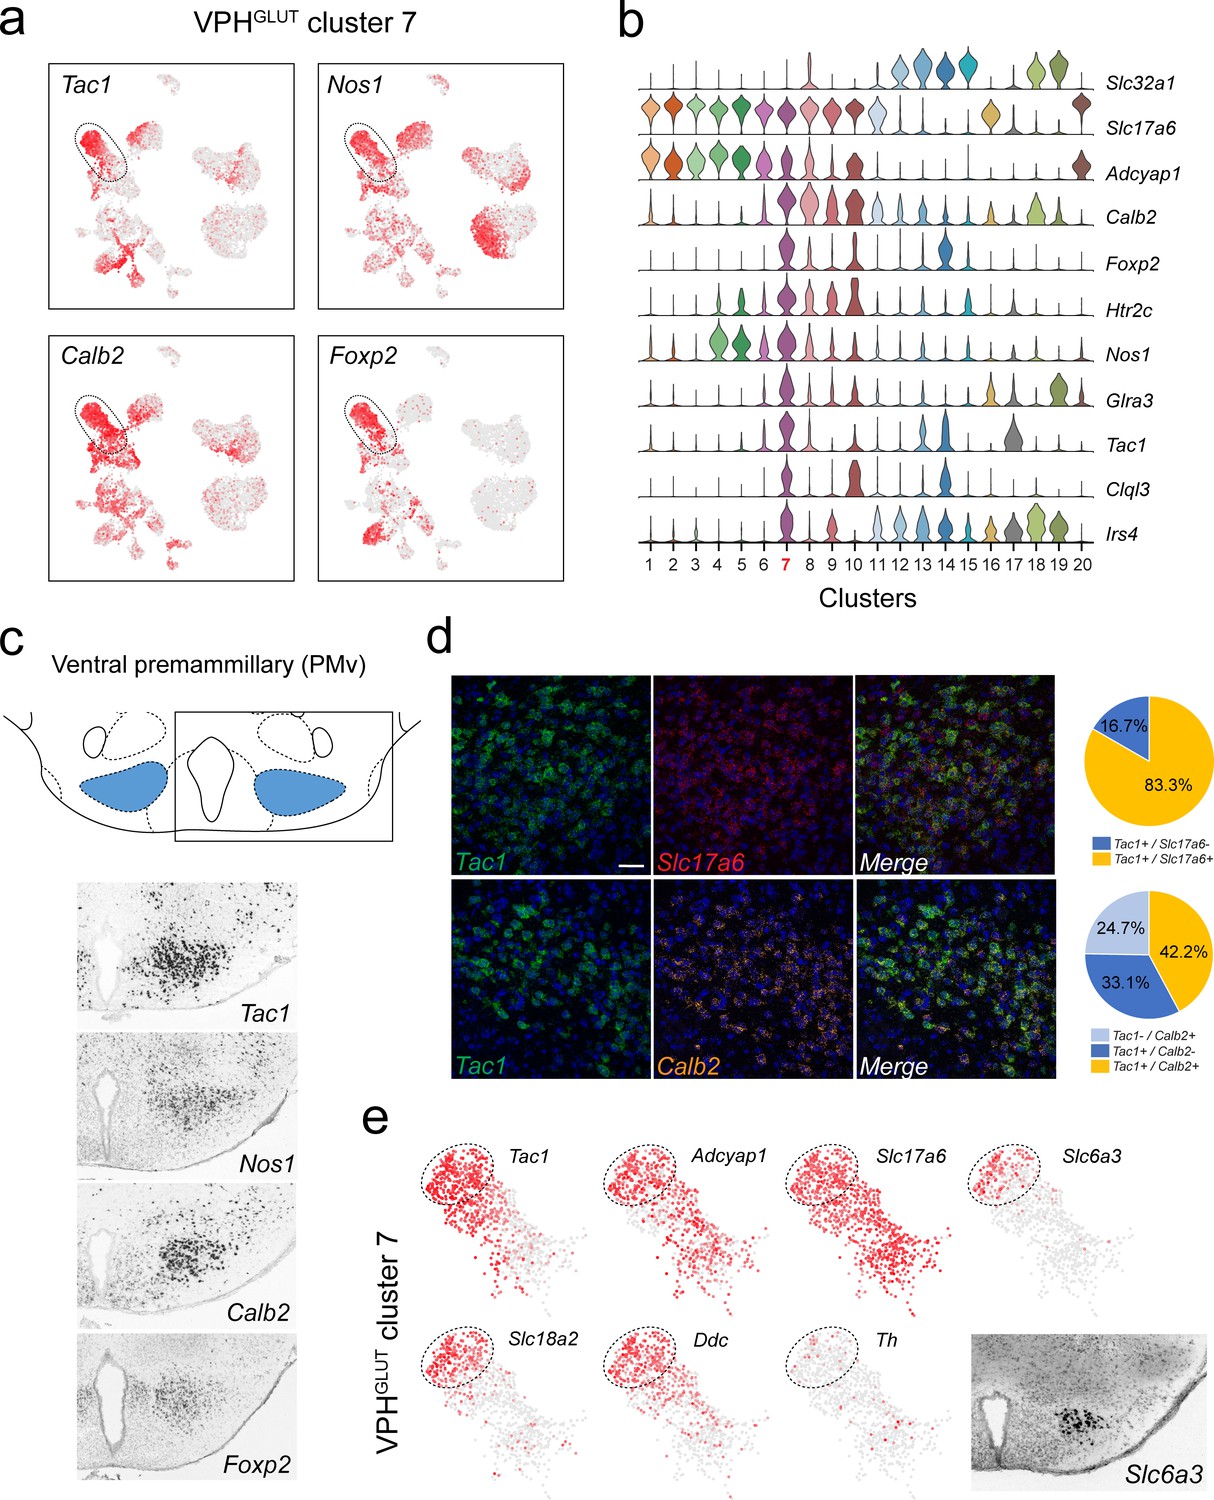
(a) UMAP plots showing normalized expression of Tac1, Nos1, Calb2, and Foxp2 enriched in VPHGLUT cluster 7 following Slc32a1 and Slc17a6 (top). (b) Violin plot showing discriminatory marker genes enriched in cluster 7. (c) Mouse brain atlas schematic, modified from Paxinos, 2012, showing the PMv in a coronal section at distance from bregma of −2.46 mm (top). ISH images for Tac1, Nos1, Calb2, and Foxp2 from the ABA (Lein et al., 2007; bottom). (d) Confocal micrographs (40×) of FISH in coronal sections of wild type mice and corresponding pie charts representing co-expression of mRNA for Tac1 and Slc17a6 (n = 678 cells, three mice; upper) and Tac1 and Calb2 (n = 963 cells, three mice; lower). Scale bar (applicable to all micrographs) 50 μm. (e) UMAP plots showing normalized expression of markers in VPHGLUT cluster 7 only, including cell type markers for reference (Tac1, Adcyap1, and Slc17a6) and markers that define a subpopulation of putative catecholaminergic neurons (Slc6a3, Slc18a2 and Ddc, but with very low Th). ISH image from the ABA (Lein et al., 2007) showing Slc6a3 expression in the PMv (inset).
Figure 3—figure supplement 1
Subclustering of PMv neurons (VPHGLUT cluster 7).
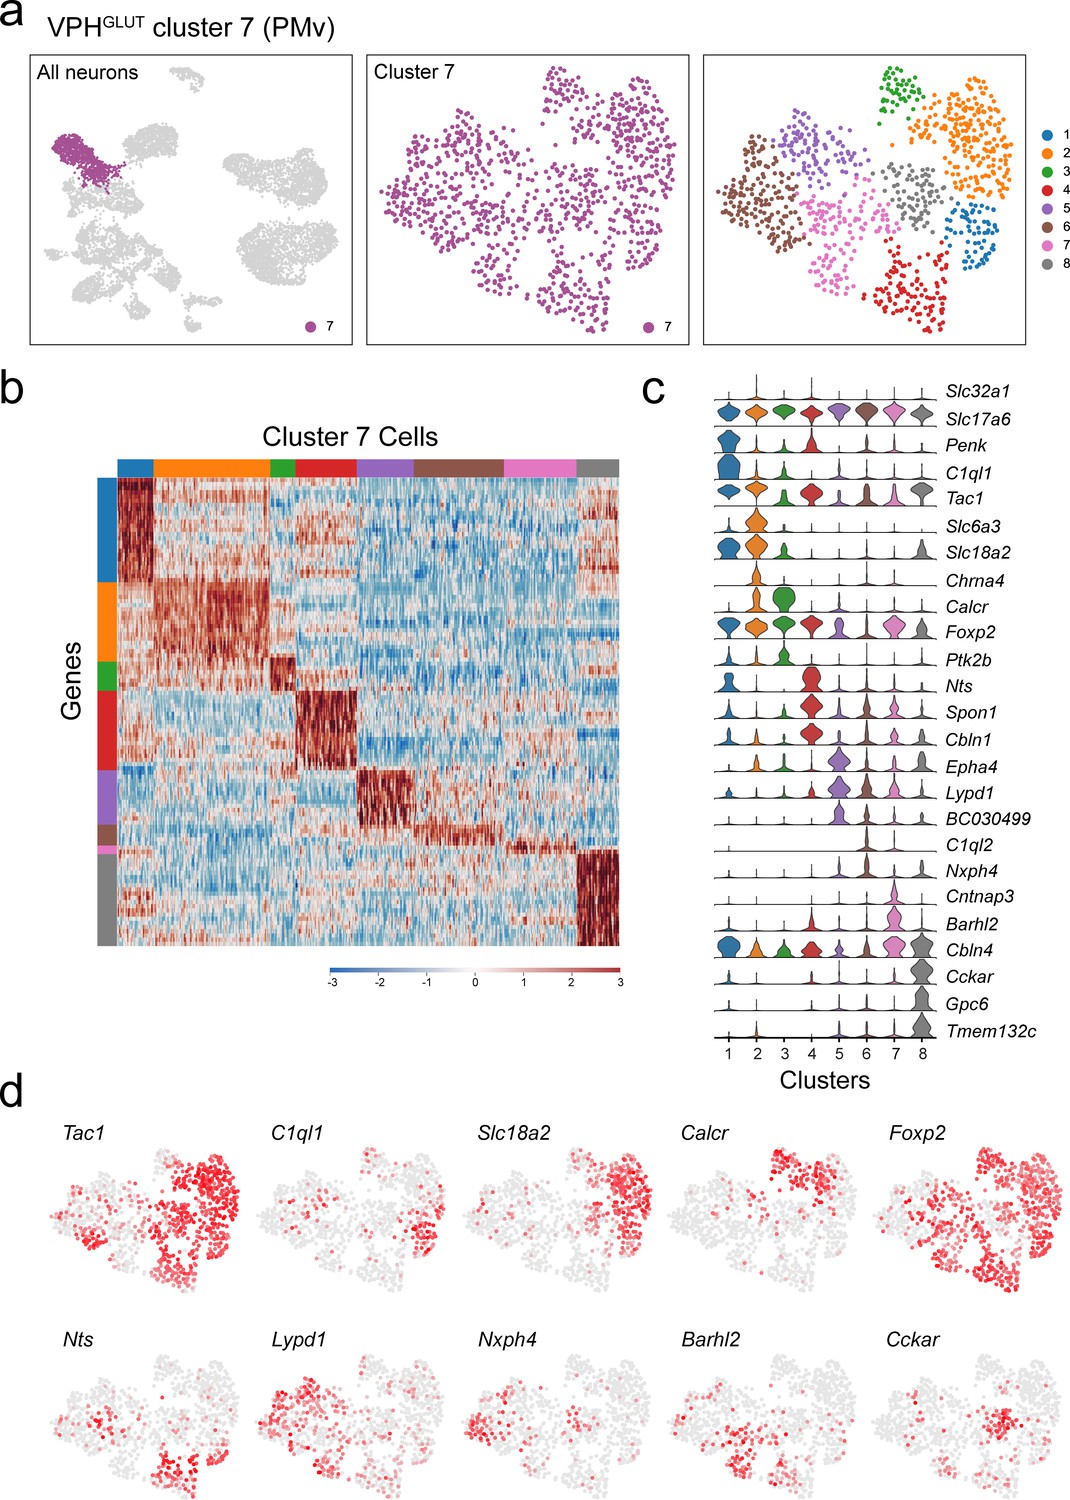
(a) UMAP plots showing cluster7 neurons among all neuronal populations (left), cluster 7 alone (middle) and following another iteration of clustering (right) revealing eight subclusters. (b) Heatmap showing scaled expression of discriminatory genes across all eight VPHGLUT cluster 7 subclusters. (c) Violin plot showing discriminatory marker genes enriched in each subcluster following Slc32a1 and Slc17a6 (top). (d) Series of UMAP plots of VPHGLUT cluster 7 alone showing normalized expression of 10 key discriminatory marker genes that define distinct subpopulations and demonstrate heterogeneity among cluster 7 neurons.
Figure 4 with 3 supplements
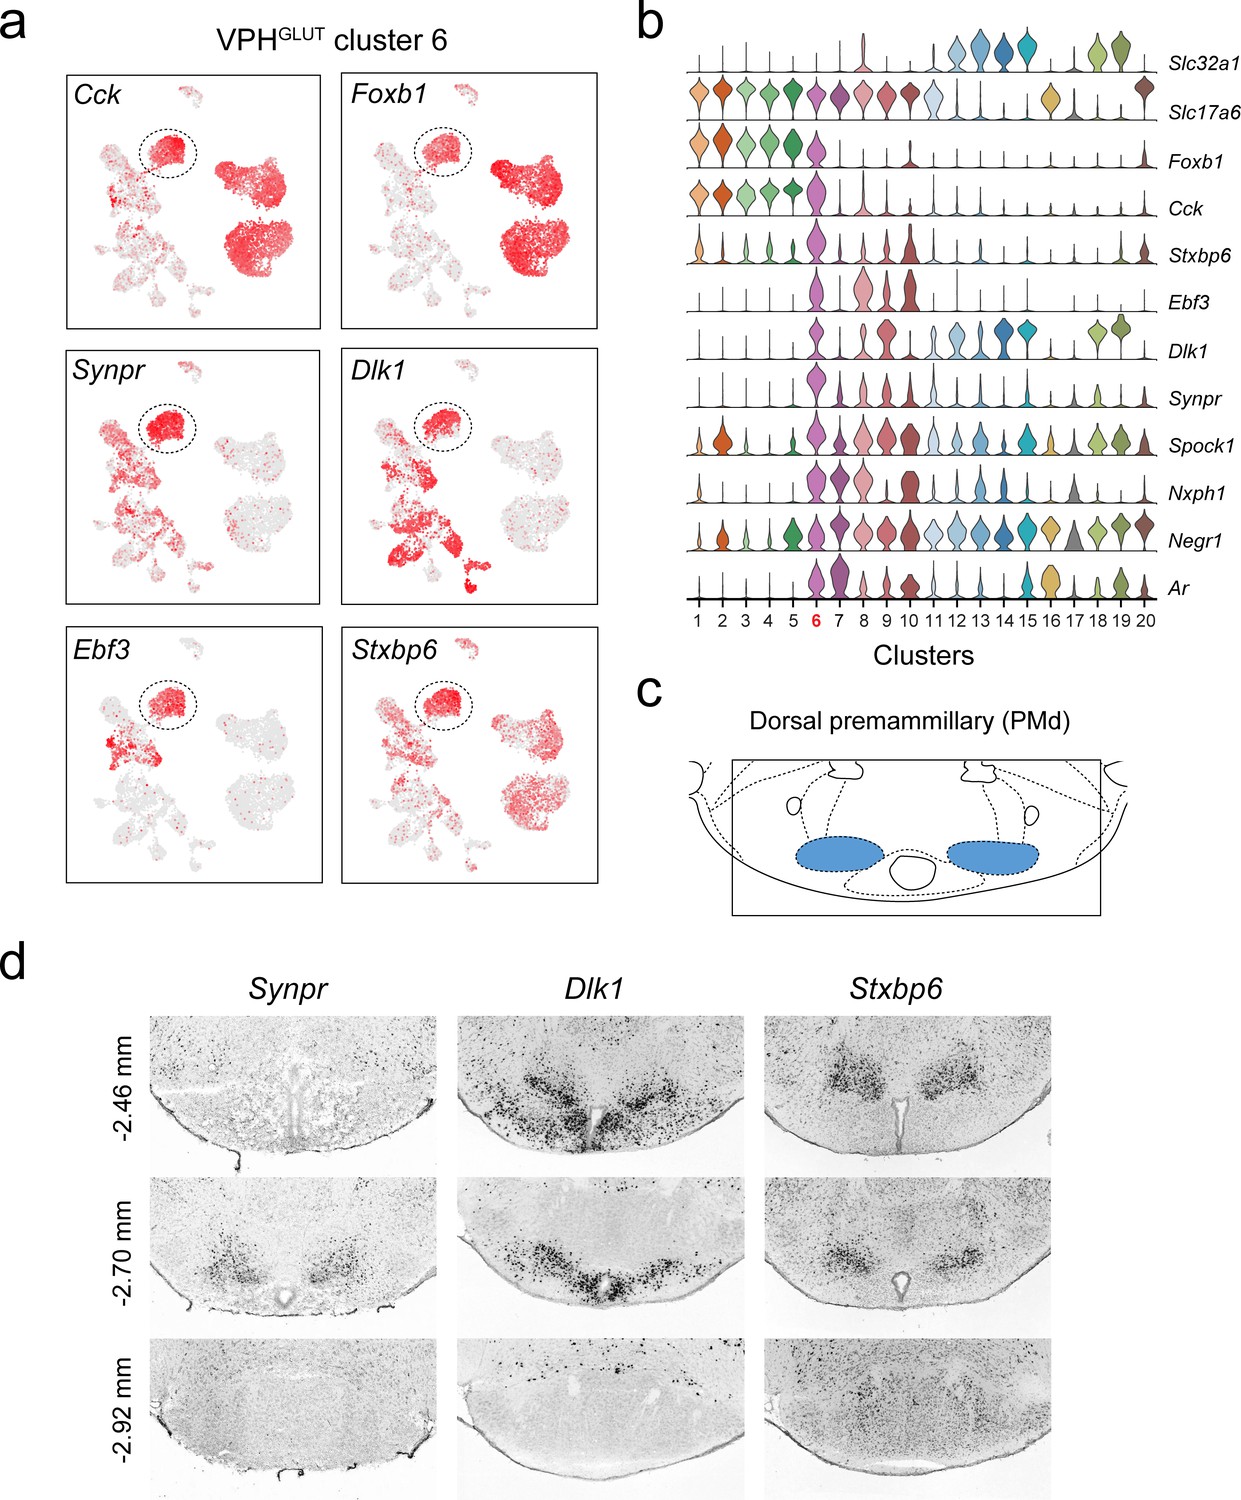
Identification of a population of putative PMd neurons (VPHGLUT cluster 6).
(a) UMAP plots showing normalized expression of Cck, Foxb1 (shared with VPHGLUT clusters 1–5), Synpr, Dlk1, Ebf3, and Stxbp6 (enriched in VPHGLUT cluster 6). (b) Violin plot showing discriminatory marker genes enriched in VPHGLUT cluster 6 following Slc32a1 and Slc17a6 (top). (c) Mouse brain atlas schematic (Paxinos, 2012) showing the PMd in a coronal section at distance from bregma of −2.70 mm (top). (d) ISH images for three anterior to posterior coronal sections (approximate distance from bregma −2.46,–2.80, and −2.92 mm) for Synpr (left), Dlk1 (middle), and Stxbp6 (right) from the ABA (Lein et al., 2007; bottom). In each case, expression appears to be enriched in the PMd in anterior sections and largely absent in the MB in the posterior section.
Figure 4—figure supplement 1

Subclustering of putative SUM neurons (VPHGLUT cluster 8).
(a) UMAP plots showing cluster 8 neurons among all neuronal populations (left), cluster 8 alone (middle) and following another iteration of clustering (right) revealing six subclusters. (b) Heatmap showing scaled expression of discriminatory genes across all six VPHGLUT cluster 8 subclusters. (c) Violin plot showing discriminatory marker genes enriched in each subcluster following Slc32a1 and Slc17a6 (top). (d) Mouse brain atlas schematic (Paxinos, 2012), showing the SUM (or retromammillary nucleus/RM) in a coronal section at distance from bregma of −3.08 mm. (e) UMAP plots showing cluster 8, showing normalized expression of Slc17a6, Slc32a1, Gad1, and Gad2. A region of cluster 8 (circled), corresponding to subcluster 3 (green) was enriched in cells that were Slc17a6+, Slc32a1+, Gad2+ but Gad1-. (f) UMAP plots of Sema3c, Inhba, and Rxfp1 expression (left) relative to corresponding ISH images from the ABA (Lein et al., 2007; right) showing localization to the posterior SUM.
Figure 4—figure supplement 2
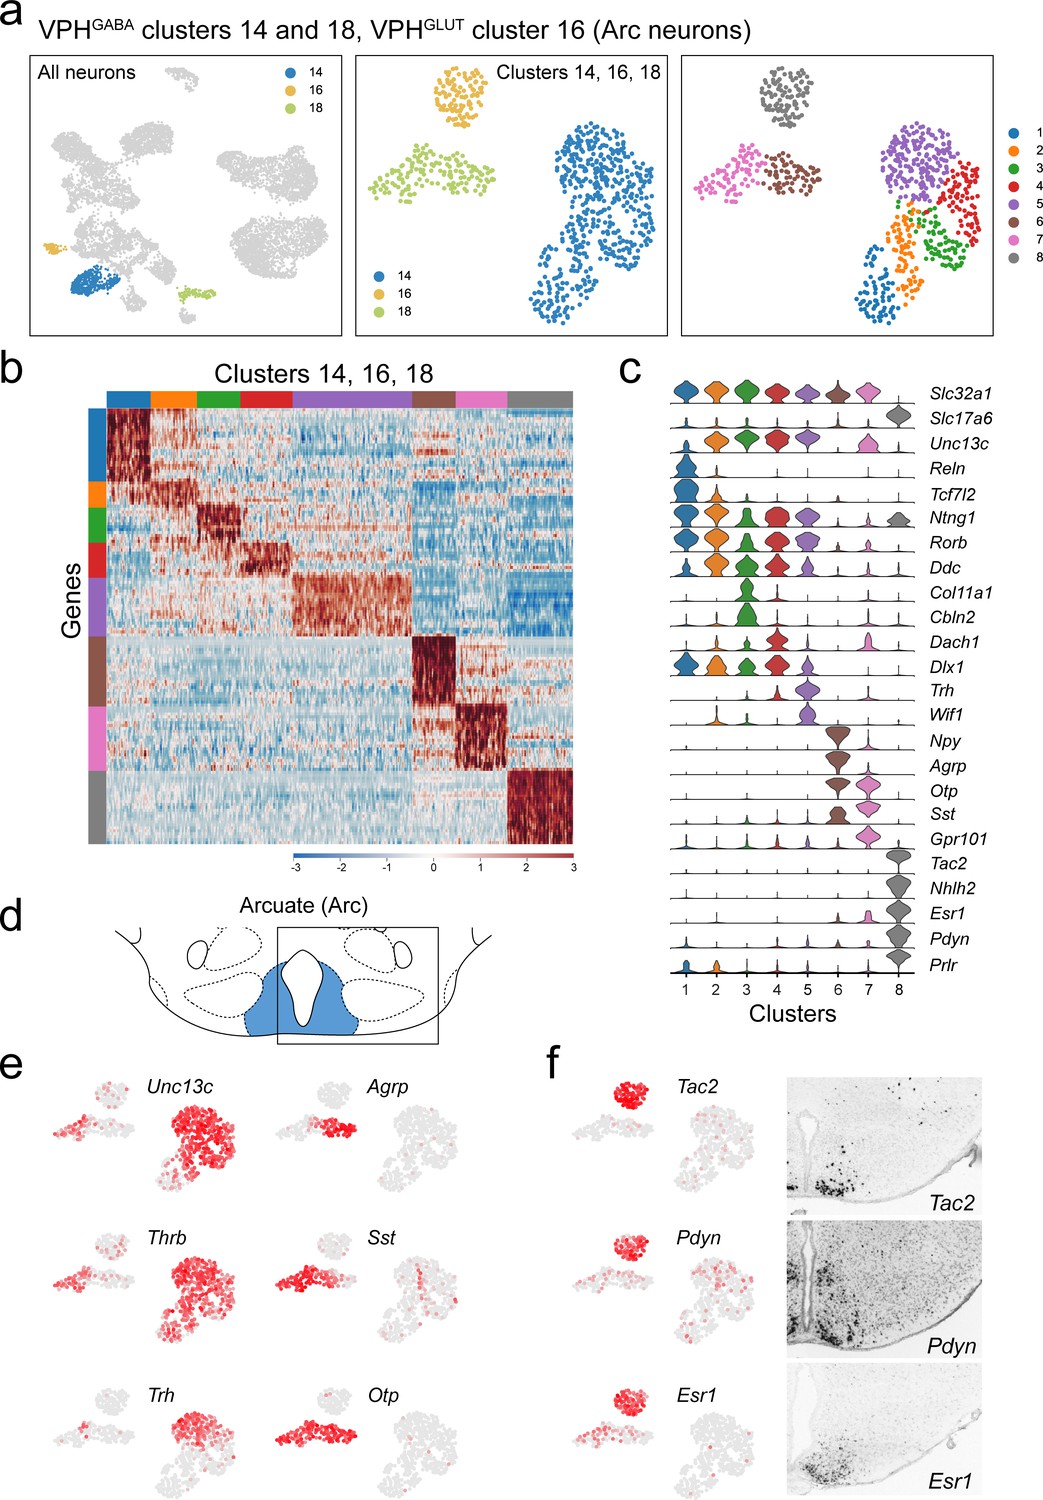
Identification of multiple populations of putative Arc neurons (VPHGABA clusters 14, 18, and VPHGLUT cluster 16).
(a) UMAP plots showing clusters 14, 16, and 18 neurons among all neuronal populations (left), clustering of all three alone (middle) and following another iteration of clustering (right) showing eight subclusters. (b) Heatmap showing scaled expression of discriminatory genes across all eight subclusters. (c) Violin plot showing discriminatory marker genes enriched in each subcluster following Slc32a1 and Slc17a6 (top). (d) Mouse brain atlas schematic (Paxinos, 2012) showing the Arc in a coronal section at distance from bregma of −2.45 mm. (e) UMAP plots showing discriminatory genes that define a selection of Arc cell types. (f) UMAP plots of key markers that identify VPHGLUT cluster 16 (also subcluster 8) as Arc KNDy neurons including Tac2, Pdyn, and Esr1 (left) and corresponding ISH images from the ABA (Lein et al., 2007; right) showing localization to the posterior Arc.
Figure 4—figure supplement 3
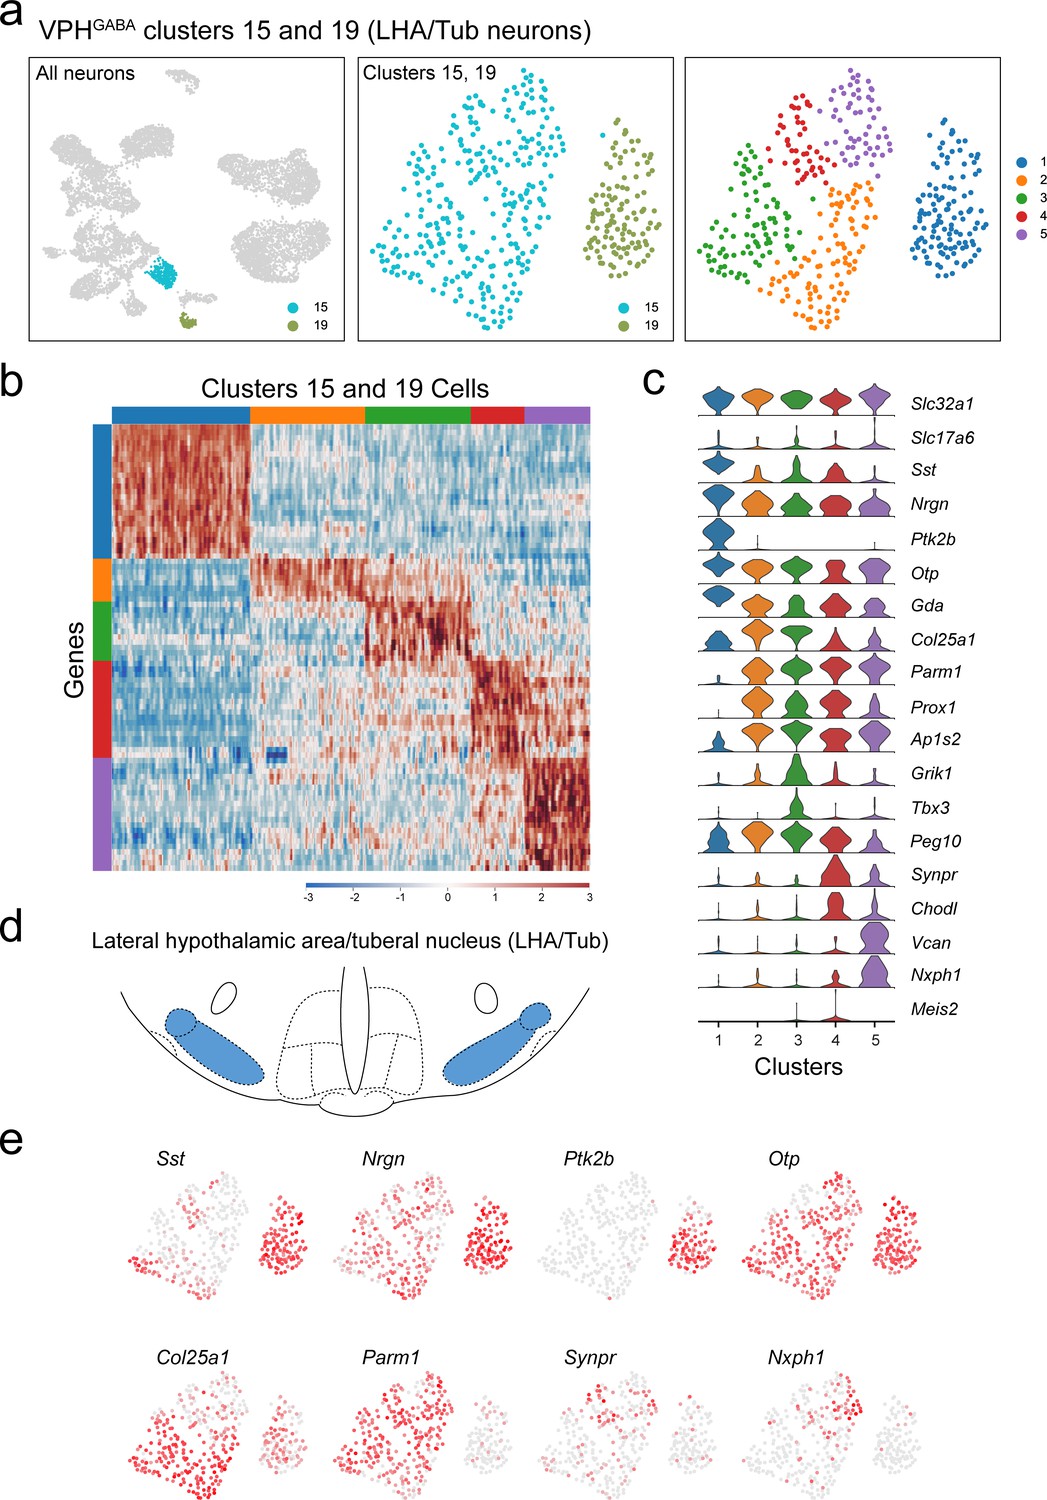
Identification and subclustering of multiple populations of putative LHA/Tub neurons (VPHGABA clusters 15 and 19).
(a) UMAP plots showing clusters 15 and 19 neurons among all neuronal populations (left), clustering of both alone (middle) and following another iteration of clustering (right) showing five subclusters. (b) Heatmap showing scaled expression of discriminatory genes across all five subclusters. (c) Violin plot showing discriminatory marker genes enriched in each subcluster following Slc32a1 and Slc17a6 (top). (d) Mouse brain atlas schematic (Paxinos, 2012) showing the LHA/Tub (also referred to as medial tuberal nucleus and terete hypothalamic nucleus) in a coronal section at distance from bregma of −2.15 mm. (e) UMAP plots showing discriminatory genes that define a selection of previously identified LHA/Tub neuronal cell populations (Mickelsen et al., 2019).
Figure 5 with 1 supplement
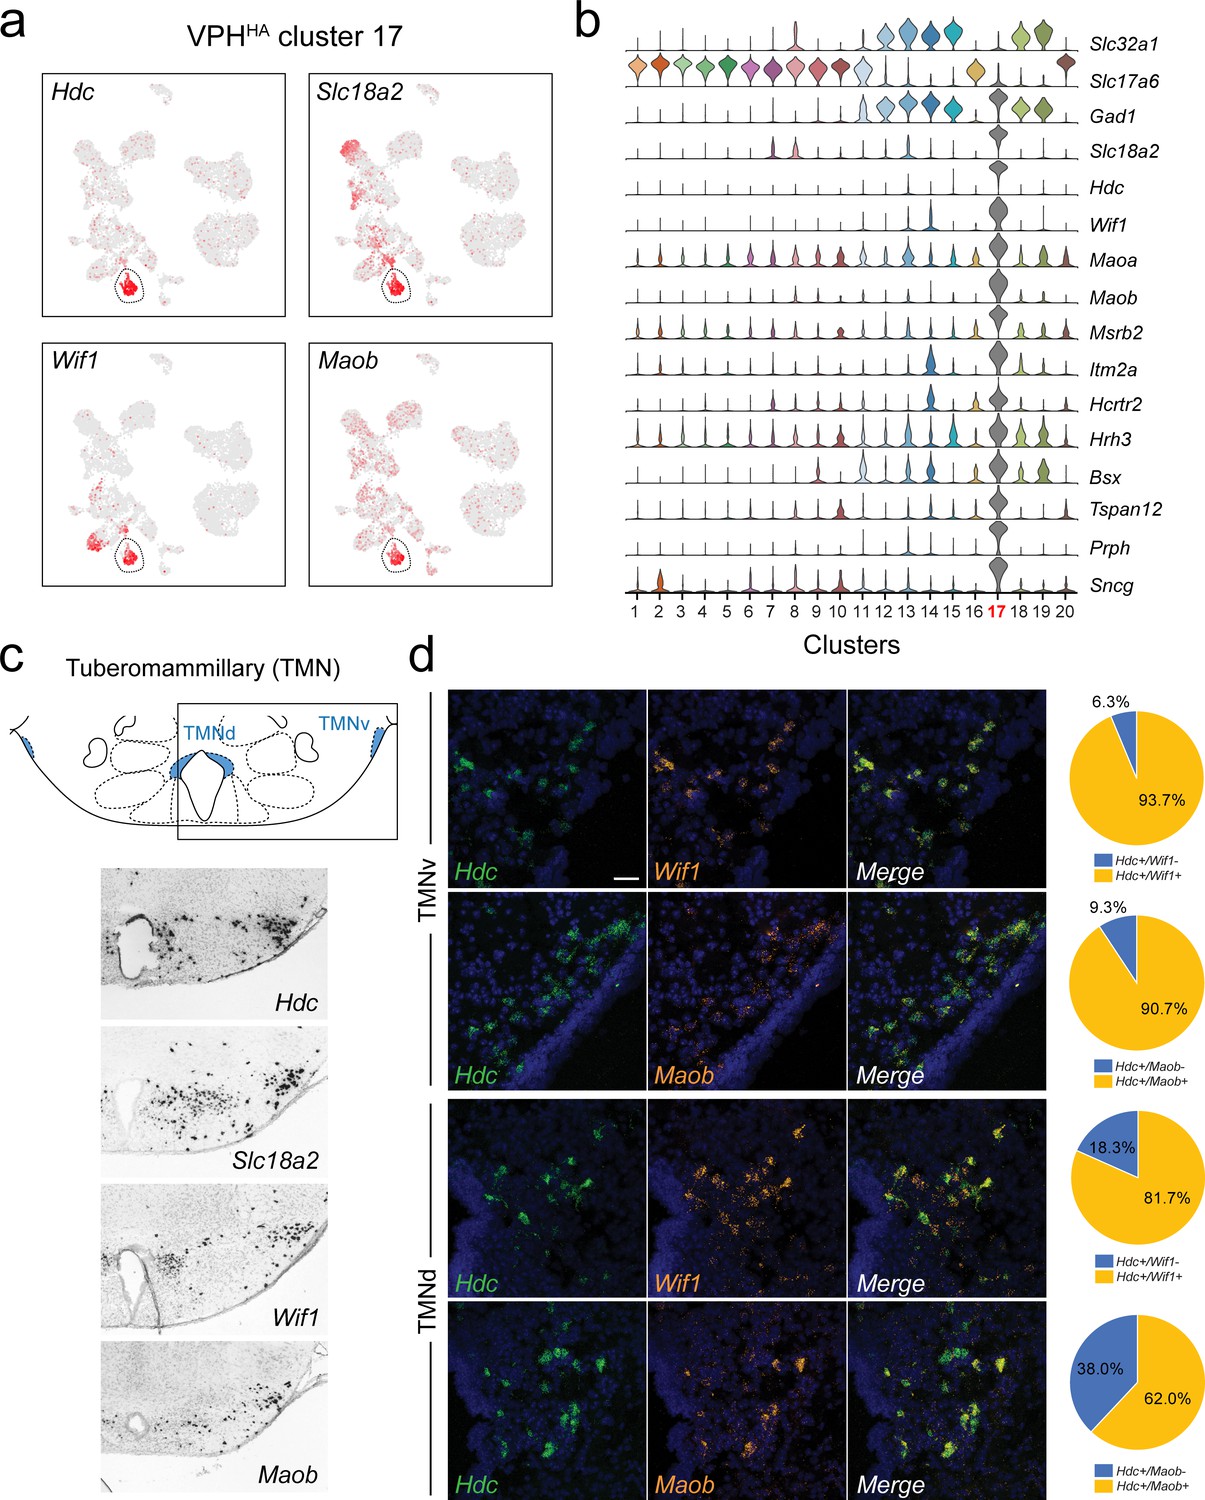
Identification of histaminergic (HA) neurons in the TMN.
(a) UMAP plots showing normalized expression of Hdc, Slc18a2, Wif1, and Maob enriched in VPHHA cluster 17 (circled). (b) Violin plot showing discriminatory marker genes enriched in VPHHA cluster 17 following Slc32a1 and Slc17a6 (top). (c) Mouse brain atlas schematic, modified from Paxinos, 2012, showing the dorsal TMN (TMNd) and ventral TMN (TMNv) in a coronal section at distance from bregma of −2.54 mm (top). ISH images for Hdc, Slc18a2, Wif1, and Maob from the ABA (Lein et al., 2007; bottom). (d) Confocal micrographs (40×) of FISH in coronal sections of wild type mice and corresponding pie charts representing co-expression of mRNA in the TMNv (top) for Hdc and Wif1 (n = 415 cells, three mice; upper) and Hdc and Maob (n = 570 cells, three mice; lower) and in the TMNd (bottom) for Hdc and Wif1 (n = 109 cells, three mice; upper) and Hdc and Maob (n = 192 cells, three mice; lower). Scale bar (applicable to all micrographs) 50 μm.
Figure 5—figure supplement 1
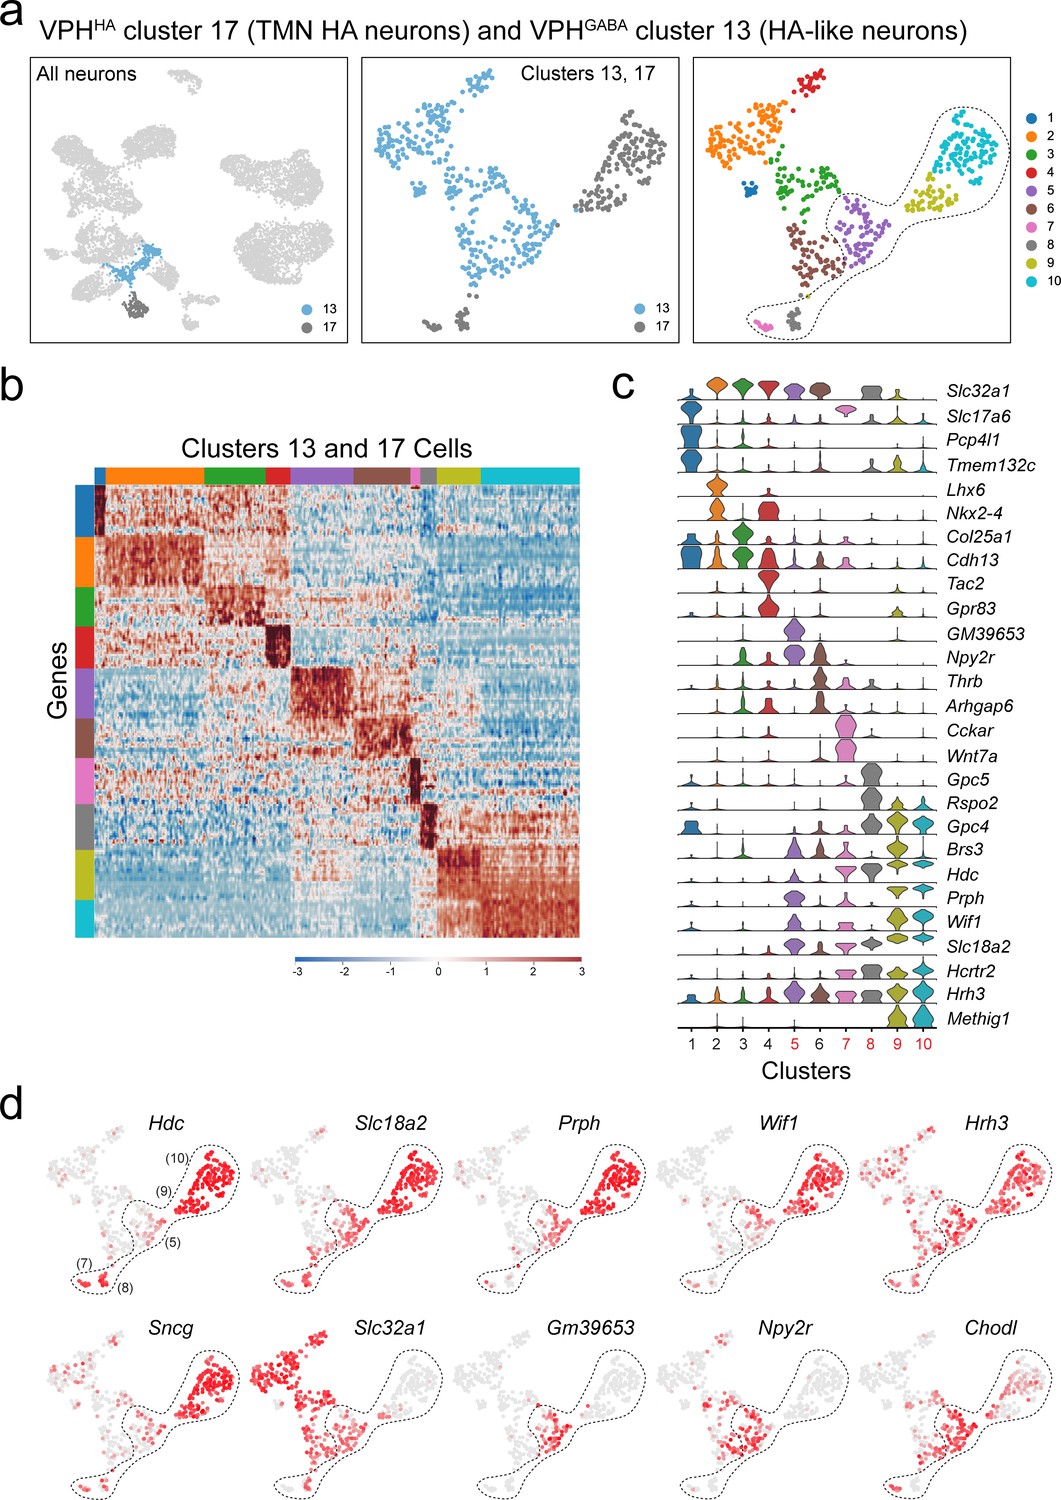
Subclustering of TMN HA neurons (VPHHA cluster 17) and a population of HA-like neurons (subcluster of VPHGABA cluster 13).
(a) UMAP plots showing clusters 13 and 17 neurons among all neuronal populations (left), clustering of both alone (middle) and following another iteration of clustering (right) showing 10 subclusters. (b) Heatmap showing scaled expression of discriminatory genes across all ten subclusters. (c) Violin plot showing discriminatory marker genes enriched in each subcluster following Slc32a1 and Slc17a6 (top). (d) UMAP plots showing discriminatory genes that define putative HA subclusters (7, 8, 9, and 10) and an HA-like subcluster (5), all defined by the perforated line. Subcluster five exhibits expression of several key HA markers including Slc18a2, Prph, Wif1, and Hrh3 (but limited Hdc) as well as Slc32a1 and several unique markers (Gm39653, Npy2r, and Chodl).
Figure 6 with 1 supplement
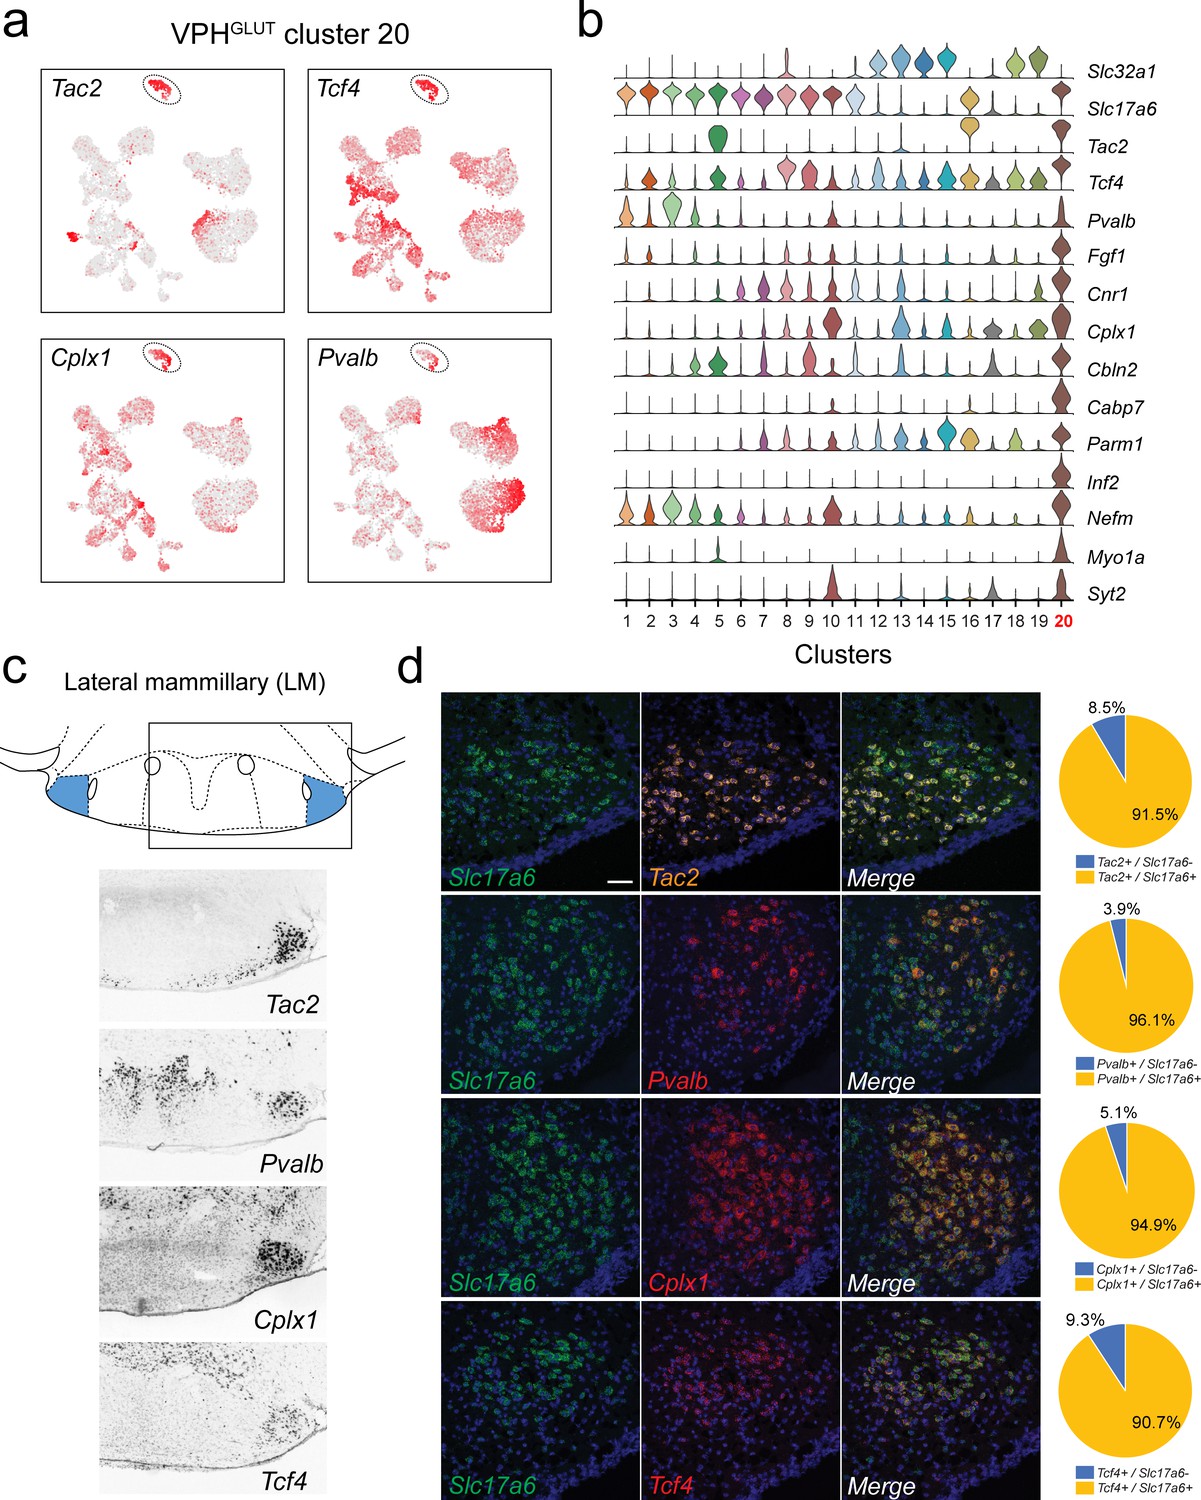
Identification of lateral mammillary (LM) neurons.
(a) UMAP plots showing normalized expression of Tac2, Tcf4, Cplx1, and Pvalb enriched in VPHGLUT cluster 20 (circled). (b) Violin plot showing discriminatory marker genes enriched in VPHGLUT cluster 20 following Slc32a1 and Slc17a6 (top). (c) Mouse brain atlas schematic, modified from Paxinos, 2012, showing the LM in a coronal section at distance from bregma of −2.92 mm (top). ISH images for Tac2, Tcf4, Cplx1, and Pvalb from the ABA (Lein et al., 2007; bottom). (d) Confocal micrographs (40×) of FISH in coronal sections of wild type mice and corresponding pie charts representing co-expression of mRNA for Slc17a6 and Tac2 (n = 1210 cells, three mice; upper), Slc17a6 and Pvalb (n = 1057 cells, three mice, upper middle), Slc17a6 and Cplx1 (n = 1269 cells, three mice; lower middle), and Slc17a6 and Tcf4 (n = 1642 cells, three mice; lower), Scale bar (applicable to all micrographs) 50 μm.
Figure 6—figure supplement 1
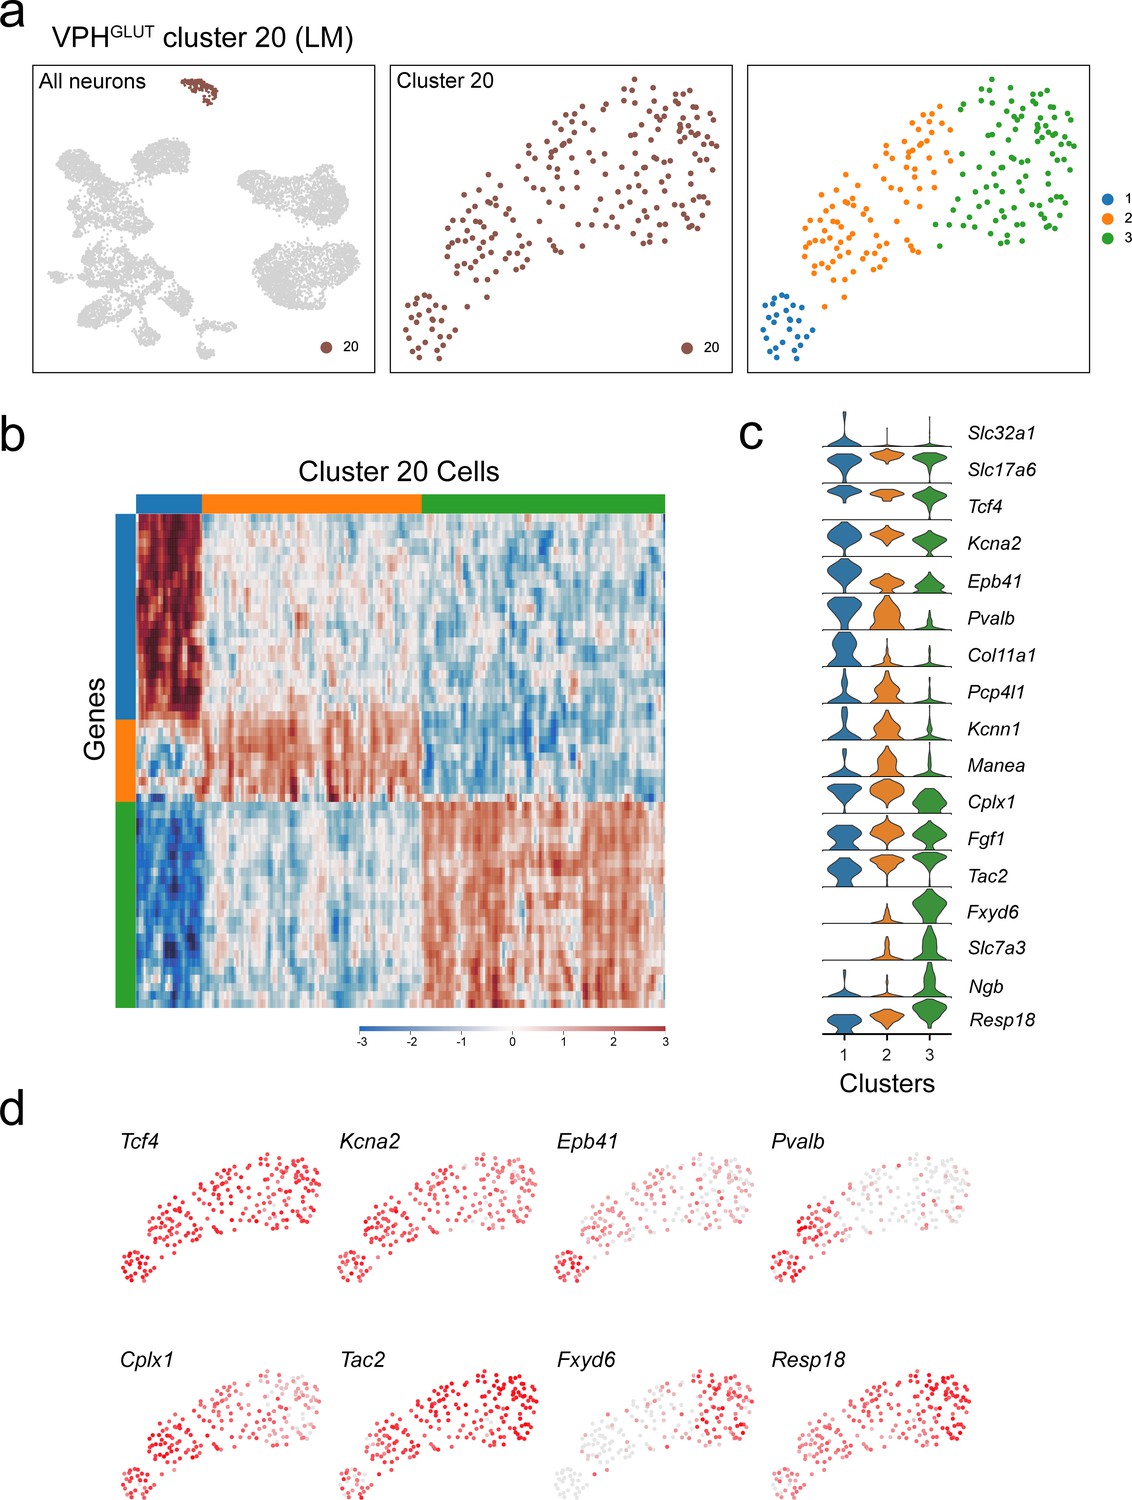
Subclustering of LM neurons (VPHGLUT cluster 20).
(a) UMAP plots showing cluster 20 neurons among all neuronal populations (left), clustering of cluster 20 alone (middle) and following another iteration of clustering (right) revealing three subclusters. (b) Heatmap showing scaled expression of discriminatory genes across all three subclusters. (c) Violin plot showing discriminatory marker genes enriched in each subcluster following Slc32a1 and Slc17a6 (top). (d) UMAP plots showing discriminatory genes that define putative LM subclusters.
Figure 7 with 1 supplement
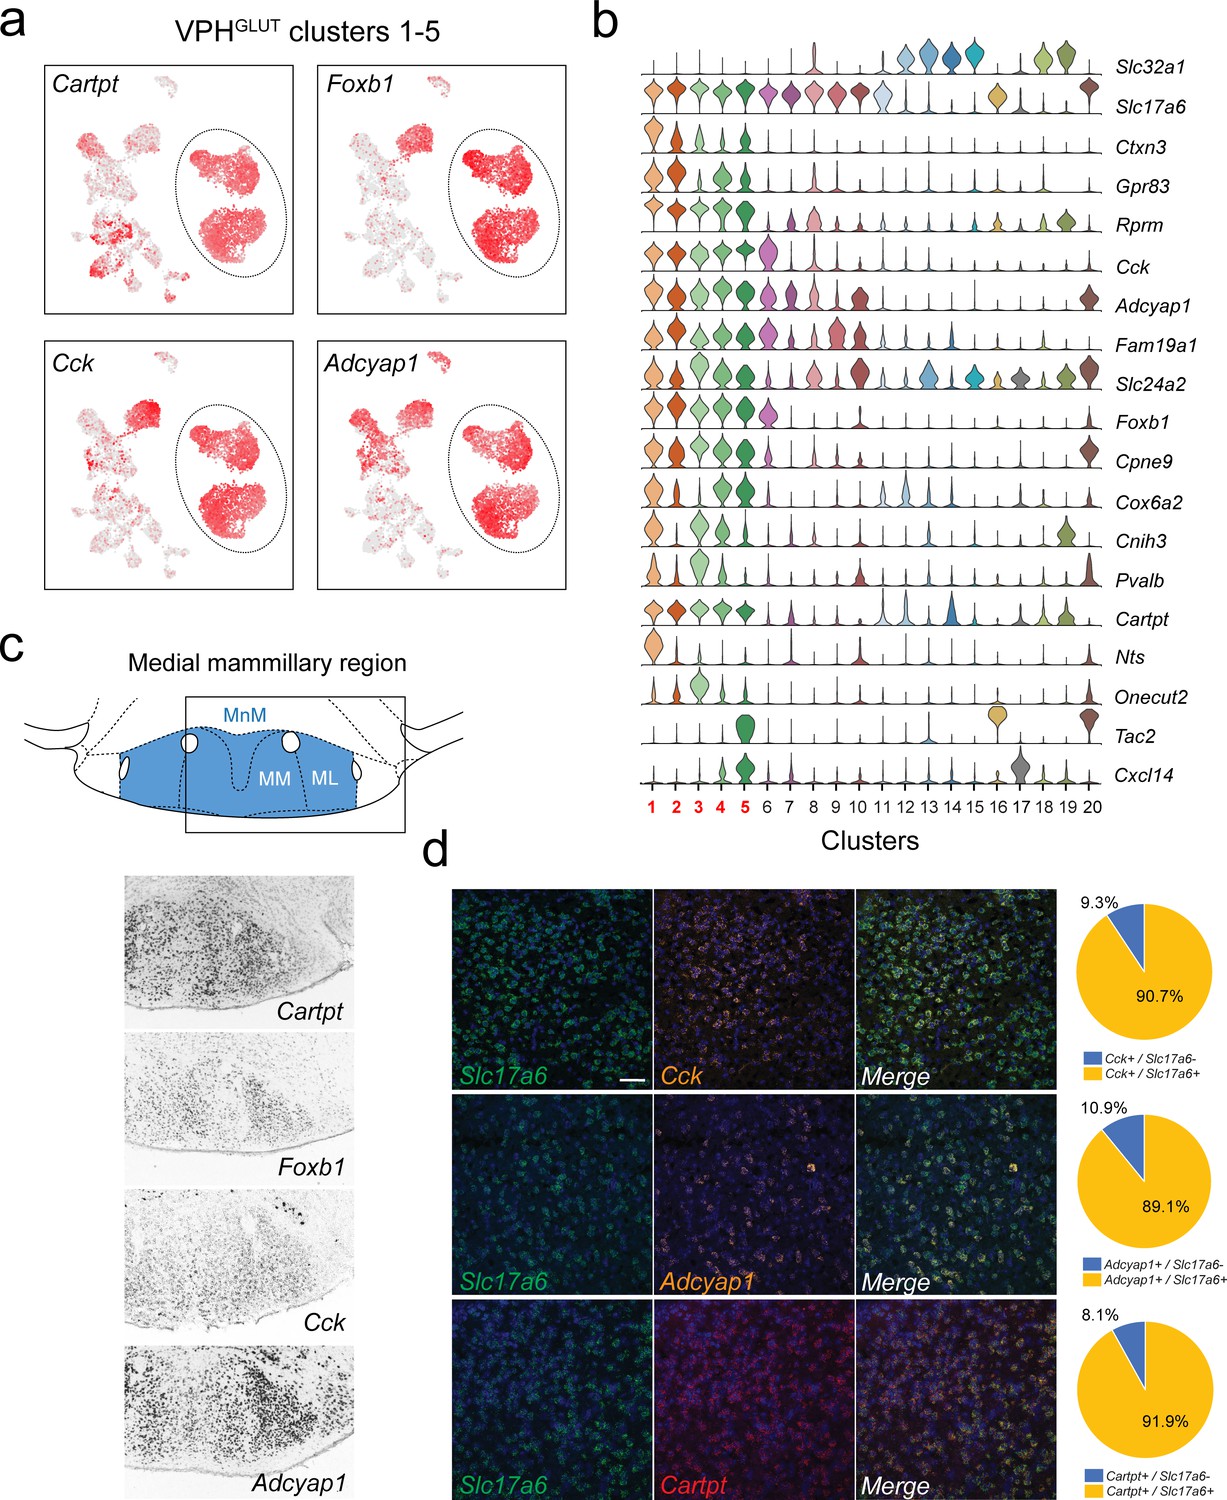
Identification of global markers for neurons in the medial mammillary region.
(a) UMAP plots showing normalized expression of Tac2, Tcf4, Cplx1, and Pvalb enriched in VPHGLUT clusters 1–5 (circled). (b) Violin plot showing discriminatory marker genes enriched in VPHGLUT clusters 1–5 following Slc32a1 and Slc17a6 (top). (c) Mouse brain atlas schematic, modified from Paxinos, 2012, showing the medial mammillary, and its anatomical subdivisions (MnM, MM, and ML) in a coronal section at distance from bregma of −2.92 mm (top). ISH images for Cartpt, Foxb1, Cck, and Adcyap1 from the ABA (Lein et al., 2007; bottom) showing widespread expression throughout the medial mammillary. (d) Confocal micrographs (40×) of FISH in coronal sections of wild type mice and corresponding pie charts representing co-expression of mRNA for Slc17a6 and Cck (n = 2787 cells, three mice; upper), Slc17a6 and Adcyap1 (n = 1805 cells, three mice; middle) and Slc17a6 and Cartpt (n = 2582 cells, three mice; lower). Scale bar (applicable to all micrographs) 50 μm.
Figure 7—figure supplement 1
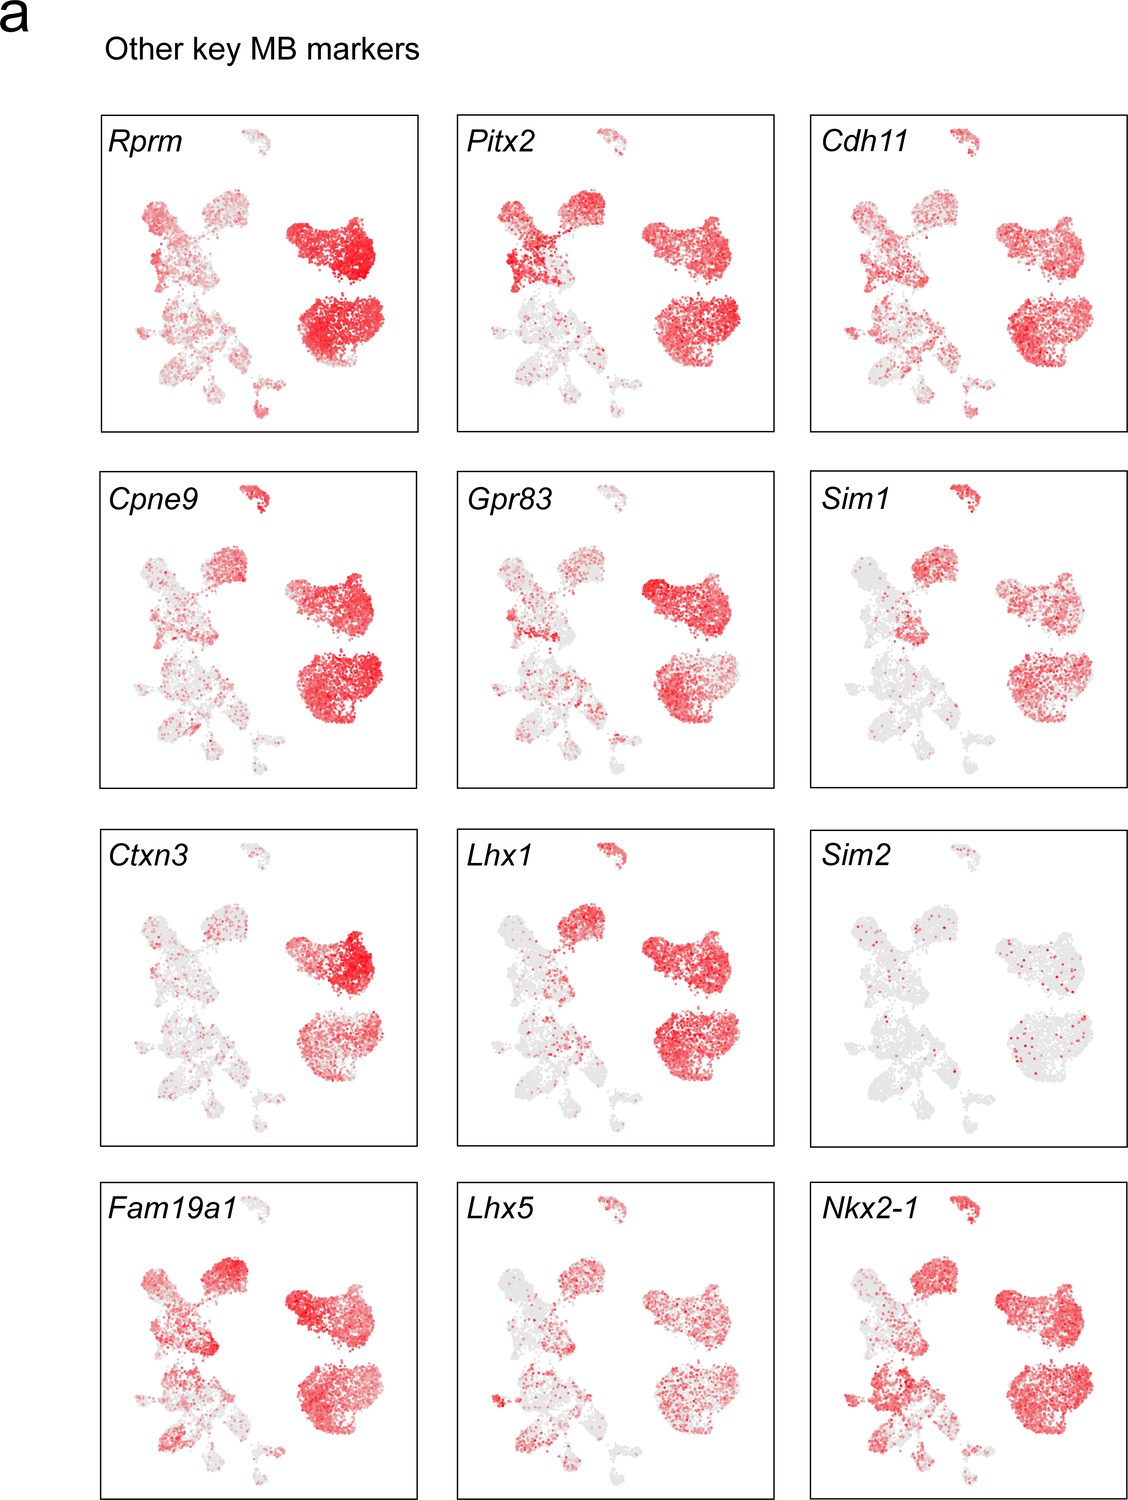
Other key discriminatory markers enriched in the MB.
(a) UMAP plots showing normalized expression of discriminatory markers either identified in the current analysis or known to have a role in the development of the MB (VPHGLUT cluster 1–5 and 20) and PMd (VPHGLUT cluster 6).
Figure 8 with 1 supplement
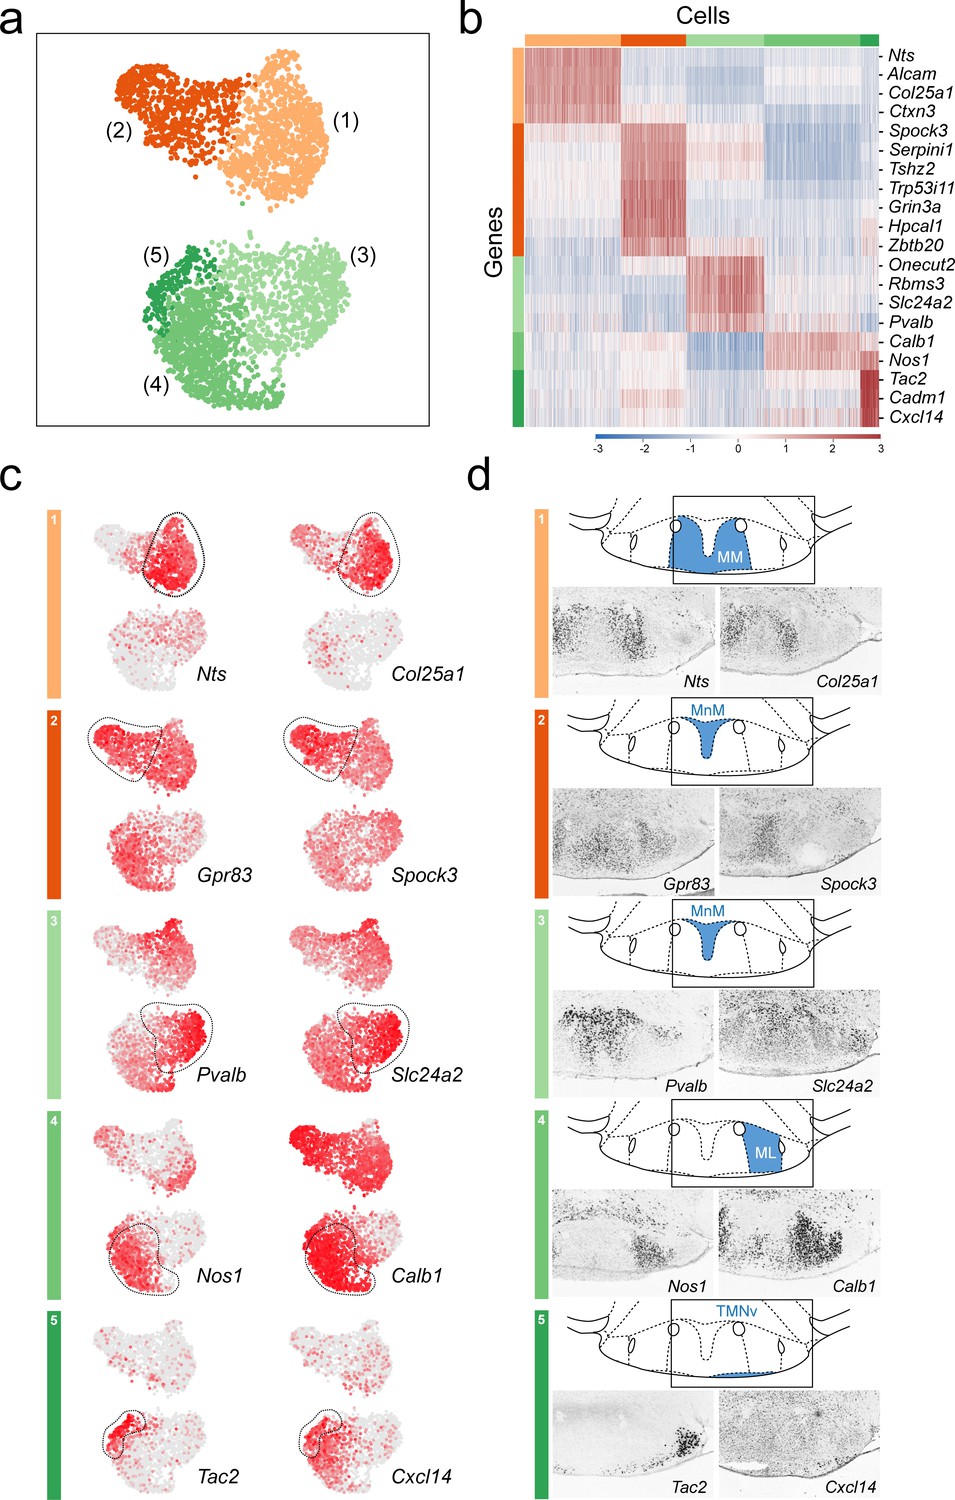
Anatomical compartmentalization of transcriptionally-distinct medial mammillary subpopulations.
(a) UMAP plot showing just VPHGLUT clusters 1–5 (detail of Figure 2b). (b) Heatmap showing scaled expression of discriminatory genes across only VPHGLUT clusters 1–5. (c) Pairs of UMAP plots showing normalized expression of two discriminatory marker genes for each of VPHGLUT clusters 1–5 (top to bottom): cluster 1 (Nts, Col25a1), cluster 2 (Gpr83, Spock3), cluster 3 (Pvalb, Slc24a2), cluster 4 (Nos1, Calb1), and cluster 5 (Tac2, Cxcl14). (d) Mouse brain atlas schematics, modified from Paxinos, 2012, showing subregions of the medial mammillary in a coronal section at distance from bregma of −2.92 mm (top). ISH images for each of the two markers shown in (c) from the ABA (Lein et al., 2007; bottom).
Figure 8—figure supplement 1
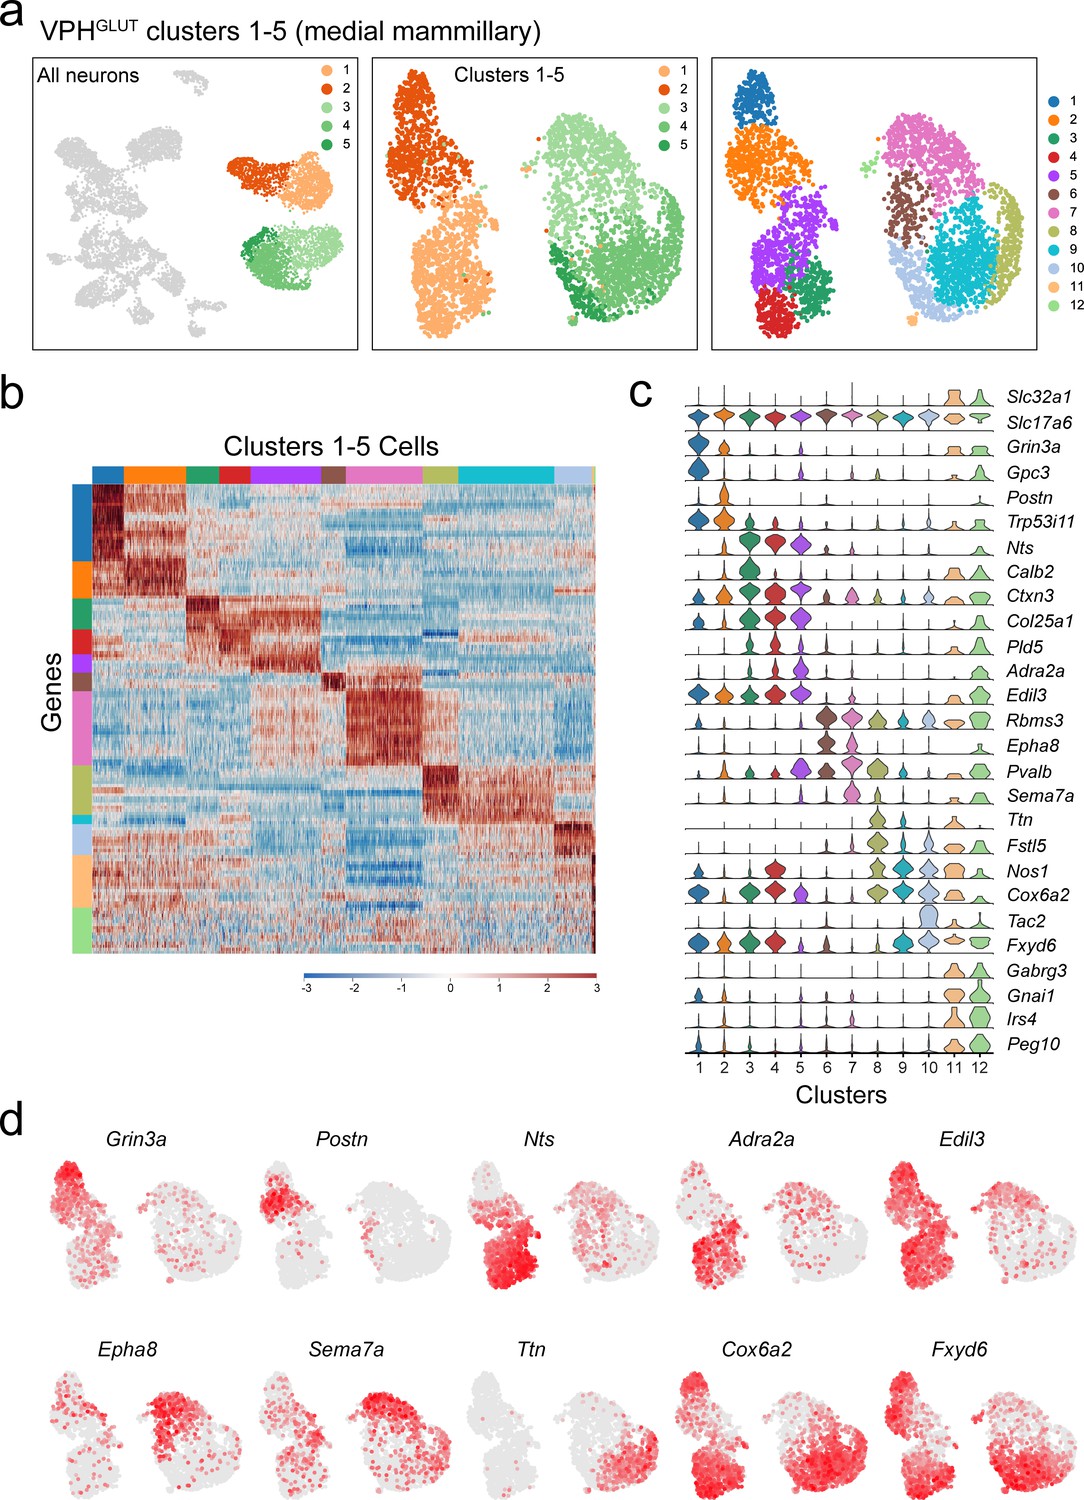
Subclustering of MM neurons (VPHGLUT clusters 1–5).
(a) UMAP plots showing clusters 1–5 neurons among all neuronal populations (left), clustering of all five alone (middle) and following another iteration of clustering (right) revealing 12 subclusters. (b) Heatmap showing scaled expression of discriminatory genes across all 12 subclusters. (c) Violin plot showing discriminatory marker genes enriched in each subcluster following Slc32a1 and Slc17a6 (top). (d) UMAP plots showing discriminatory genes that define putative MM subclusters.
Figure 9
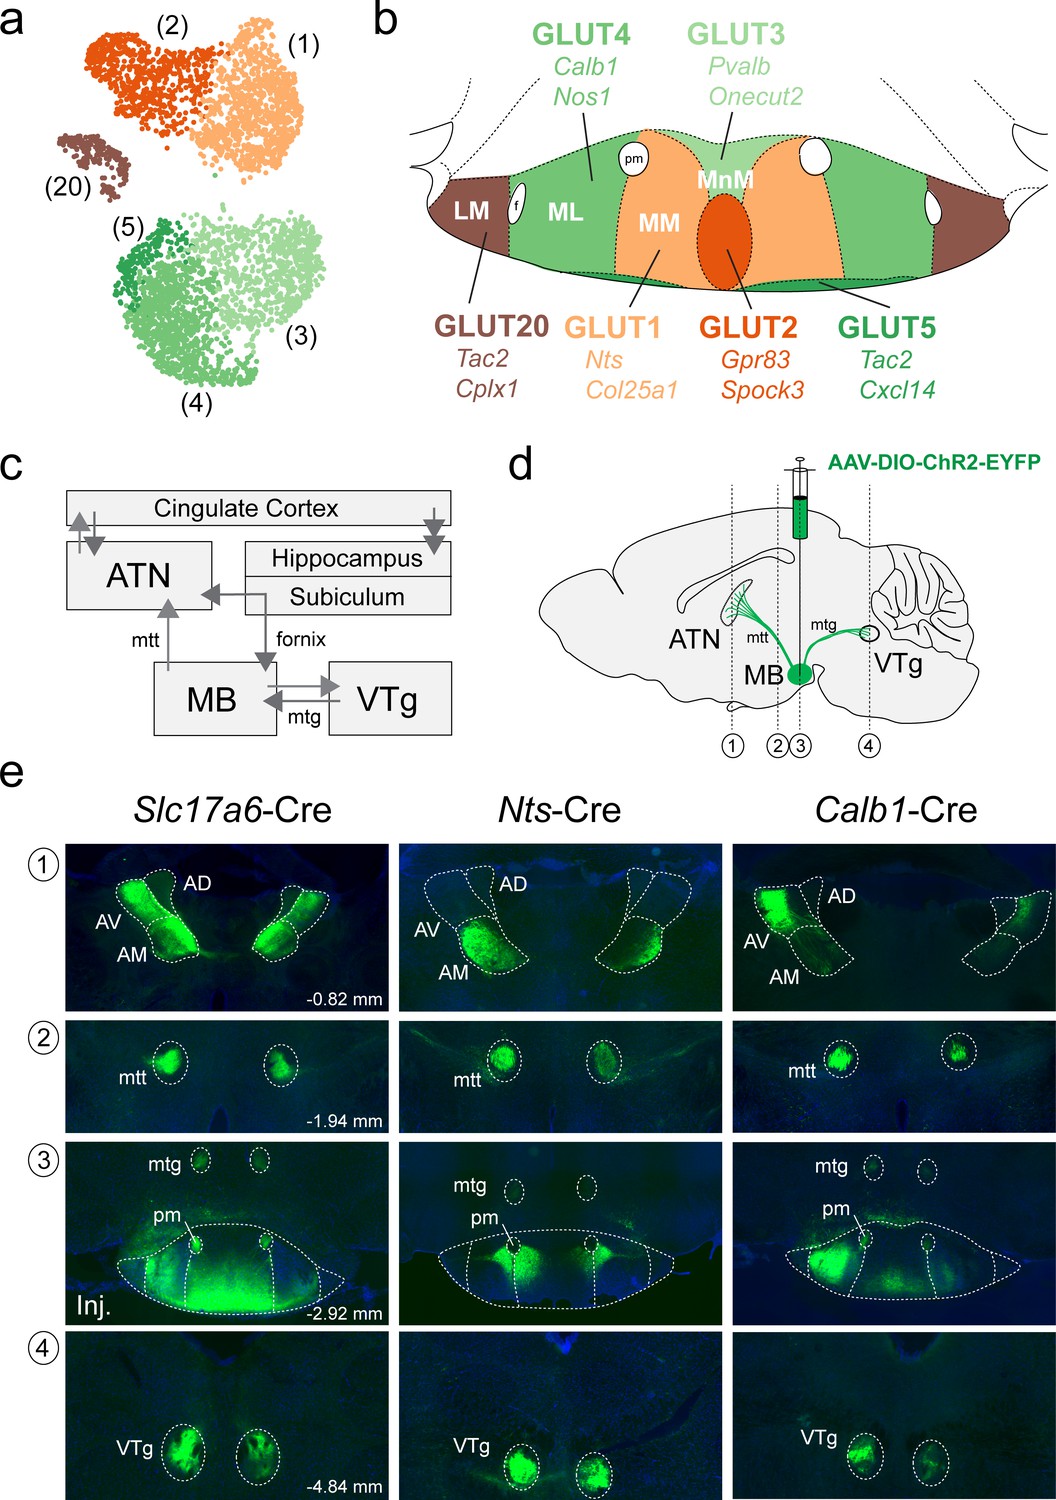
Anterograde projections of transcriptionally-distinct medial mammillary subpopulations to the anterior thalamus and midbrain.
(a) UMAP plot showing just VPHGLUT clusters 1–5 and 20 (details from Figure 2b). (b) Mouse brain atlas schematic modified from Paxinos, 2012, showing subregions of the MB in a coronal section at distance from bregma of −2.92 mm. Color-coding of subdivisions indicate correlations between transcriptionally distinct subpopulations in (a) and anatomical subdivisions within the MB: cluster 1 (MM, light orange), cluster 2 (ventromedial MnM, dark orange), cluster 3 (dorsomedial MnM, light green), cluster 4 (ML, medium green), cluster 5 (TMNv or ventrobasal MM/ML, dark green) and cluster 20 (LM, brown). (c) Schematic of connections between the MB, hippocampal formation, ATN and VTg comprising the Papez circuit. (d) Schematic parasagittal section illustrating anterograde viral tracing using AAV-DIO-ChR2-EYFP injection in the MB of three cre driver lines (Slc17a6-Cre, Nts-Cre, and Calb1-Cre). Number labels indicate imaged coronal sections. (e) Representative fluorescence images of coronal sections for anterograde tracing in Slc17a6-Cre (n = 3 mice; left), Nts-Cre (n = 3 mice; middle) and Calb1-Cre (n = 2; right) mice at the following approximate distances from bregma: (1) ATN, −0.82 mm; (2) mtt, −1.94 mm; (3) MB injection site, −2.92 mm; and (4) VTg, −4.84 mm. All sections were counterstained with DAPI (blue). Abbreviations: AV (anteroventral), AM (anteromedial), AD (anterodorsal), mtt (mammilothalamic tract), mtg (mammillotegmental tract), and pm (principle mammillary tract).
Figure 10
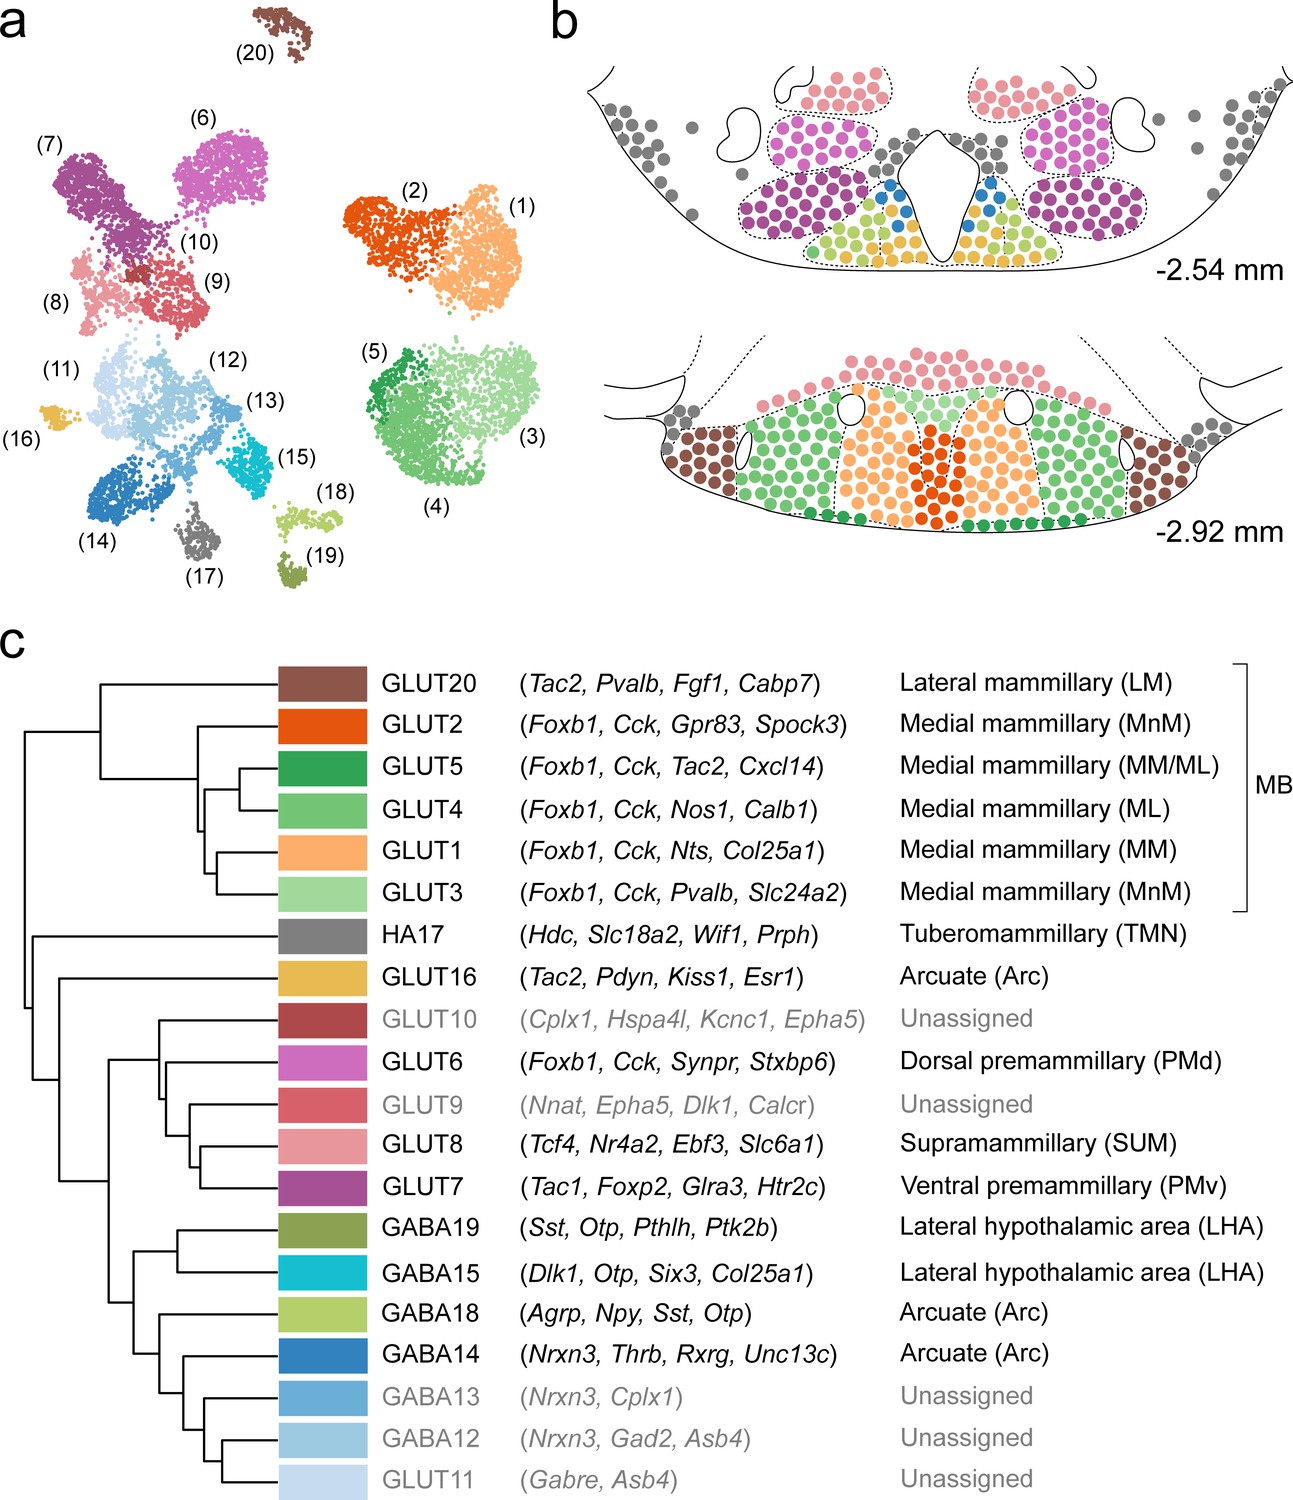
Summary of the relationship between transcriptionally distinct VPH cell clusters and anatomical parcellation of the VPH.
(a) UMAP of all VPH neuronal clusters. (b) Mouse brain atlas schematic (Paxinos, 2012) showing two representative VPH coronal sections at distances from bregma of −2.54 and −2.92 mm. Neuronal cell types identified in scRNA-seq analysis that can be assigned to specific anatomical subregions of the VPH are indicated. (c) Hierarchical clustering of single-cell clusters (left), discriminatory markers (middle), and the anatomical region they correspond to (right) are listed.
Tables
Key resources table
| Reagent type (species) or resource | Designation | Source or reference | Identifiers | Additional information |
|---|---|---|---|---|
| Strain (Mus musculus) | C57Bl/6 | The Jackson Laboratory | Cat# JAX:000664 RRID:IMSR_JAX:000664 | - |
| Genetic reagent (Mus musculus) | Slc17a6-Cre | The Jackson Laboratory | Cat# JAX:016963 RRID:IMSR_JAX:016963 | - |
| Genetic reagent (Mus musculus) | Nts-Cre | The Jackson Laboratory | Cat#: JAX:017525 RRID:IMSR_JAX:017525 | - |
| Genetic reagent (Mus musculus) | Calb1-Cre | The Jackson Laboratory | Cat#: JAX:028532 RRID:IMSR_JAX:028532 | - |
| Recombinant DNA reagent (Adeno -associated Virus) | AAV2-Ef1α-DIO-hChR2(H134R)-EYFP | UNC Viral Core | RRID:Addgene_55640 | Diesseroth Lab |
| Peptide, recombinant protein | Protease XXIII | Sigma | Cat# P4032 | 2.5 mg/mL |
| Peptide, recombinant protein | Trypsin inhibitor | Sigma | Cat# T9253 | 10 mg/mL |
| Commercial assay or kit | Chromium Single Cell 3’ Library and Gel Bead Kit | 10x Genomics | Cat# 1000075 | V2 and V3 |
| Commercial assay or kit | RNAScope fluorescent multiplex detection assay reagents | ACDBio | Cat# 320851 | V1 |
| Commercial assay or kit | RNAScope V1 fluorescent multiplex detection assay probes | ACDBio | Cat# 405911 Cat# 313641 Cat# 432001 Cat# 402271 Cat# 482531 Cat# 490471 Cat# 450291 Cat# 421931 Cat# 319171 Cat# 410351 Cat# 446391 Cat# 537191 Cat# 412361 | Adcyap1 Calb2 Cartpt Cck Cplx1 Hdc Maob Pvalb Slc17a6 Tac1 Tac2 Tcf4 Wif1 |
| Software, algorithm | Fiji | PMID:22743772 | RRID:SCR_002285 | https://imagej.net/Fiji |
| Software, algorithm | Photoshop | Adobe | RRID:SCR_014199 | - |
| Software, algorithm | Illustrator | Adobe | RRID:SCR_010279 | - |
| Software, algorithm | Scanpy | Python | RRID:SCR_018139 | v1.3.7 |
| Software, algorithm | Cell Ranger | 10x Genomics | RRID:SCR_017344 | v3.0.2 |
| Other | Vectashield Hardset Mounting Media w/DAPi | Vector Labs | Cat# H-1500 | - |
| Other | ProLong Gold Mounting Media w/DAPi | Thermofisher | Cat# P36965 | - |
Author response table 1
| Median Genes/neuron | Median UMIs/neuron | Brain region | Study |
| 4,335 | 12,035 | Hypothalamus (VPH) | Mickelsen et al., (this study) |
| 3,034 | 6,897 | Hypothalamus (preoptic) | Moffitt et al., Science, 2018 (doi: 10.1126/science.aau5324) |
| 3,442 | 8,791 | Hypothalamus (LHA) | Mickelsen et al., Nature Neuroscience, 2019 (doi: 10.1038/s41593-019-0349-8) |
| <4,000 | <8,000 | Hypothalamus (LHA) | Rossi et al. Science, 2019(doi: 10.1126/science.aax1184) |
| ~3,000 | ~6,000 | Hypothalamus (VMHvl) | Kim et al., Cell, 2019(doi: 10.1016/j.cell.2019.09.020) |
| <2,000 | <3,000 | Hypothalamus (SCN) | Wen et al. Nature Neuroscience, 2020(doi: 10.1038/s41593-020-0586-x) |
| 1,097 | 1,688 | Hypothalamus | Romanov et al. Nature, 2020(doi: 10.1038/s41586-020-2266-0) |
| 2,679 | 6,570 | E18 Cortex + Hippocampus | 10X Genomics 10k Neurons Dataset (https://support.10xgenomics.com/single-cell-gene-expression/datasets/3.0.0/neuron_10k_v3) |
| 1,927 | 4,226 | E18 Cortex + Hippocampus | 10X Genomics 1M Neurons Dataset (https://support.10xgenomics.com/single-cell-gene-expression/datasets/1.3.0/1M_neurons) |
Additional files
Download links
A two-part list of links to download the article, or parts of the article, in various formats.
Downloads (link to download the article as PDF)
Open citations (links to open the citations from this article in various online reference manager services)
Cite this article (links to download the citations from this article in formats compatible with various reference manager tools)
Cellular taxonomy and spatial organization of the murine ventral posterior hypothalamus
eLife 9:e58901.
https://doi.org/10.7554/eLife.58901


