Lipocalin-2 is an anorexigenic signal in primates
- Department of Physiology and Cellular Biophysics, Columbia University Medical Center, United States
- Department of Nutritional Sciences, Rutgers University, United States
- Department of Biochemistry and Molecular Biophysics, Columbia University, United States
- Department of Radiology, Columbia University Medical Center, United States
- Department of Psychiatry, Columbia University Medical Center, United States
- Molecular Imaging and Neuropathology Area, New York State Psychiatric Institute, United States
- Department of Pathology, Section on Comparative Medicine, Wake Forest School of Medicine, United States
- Department of Radiology, Wake Forest School of Medicine, United States
- INSERM UMR1033-Université de Lyon-Hospices Civils de Lyon, France
- Department of Medicine, Rutgers - RWJ Medical School, Rutgers University, United States
- New York Obesity Nutrition Research Center, Columbia University, United States
- Department of Medicine, Division of Endocrinology, Columbia University Irving Medical Center, United States
Figures
Figure 1 with 3 supplements
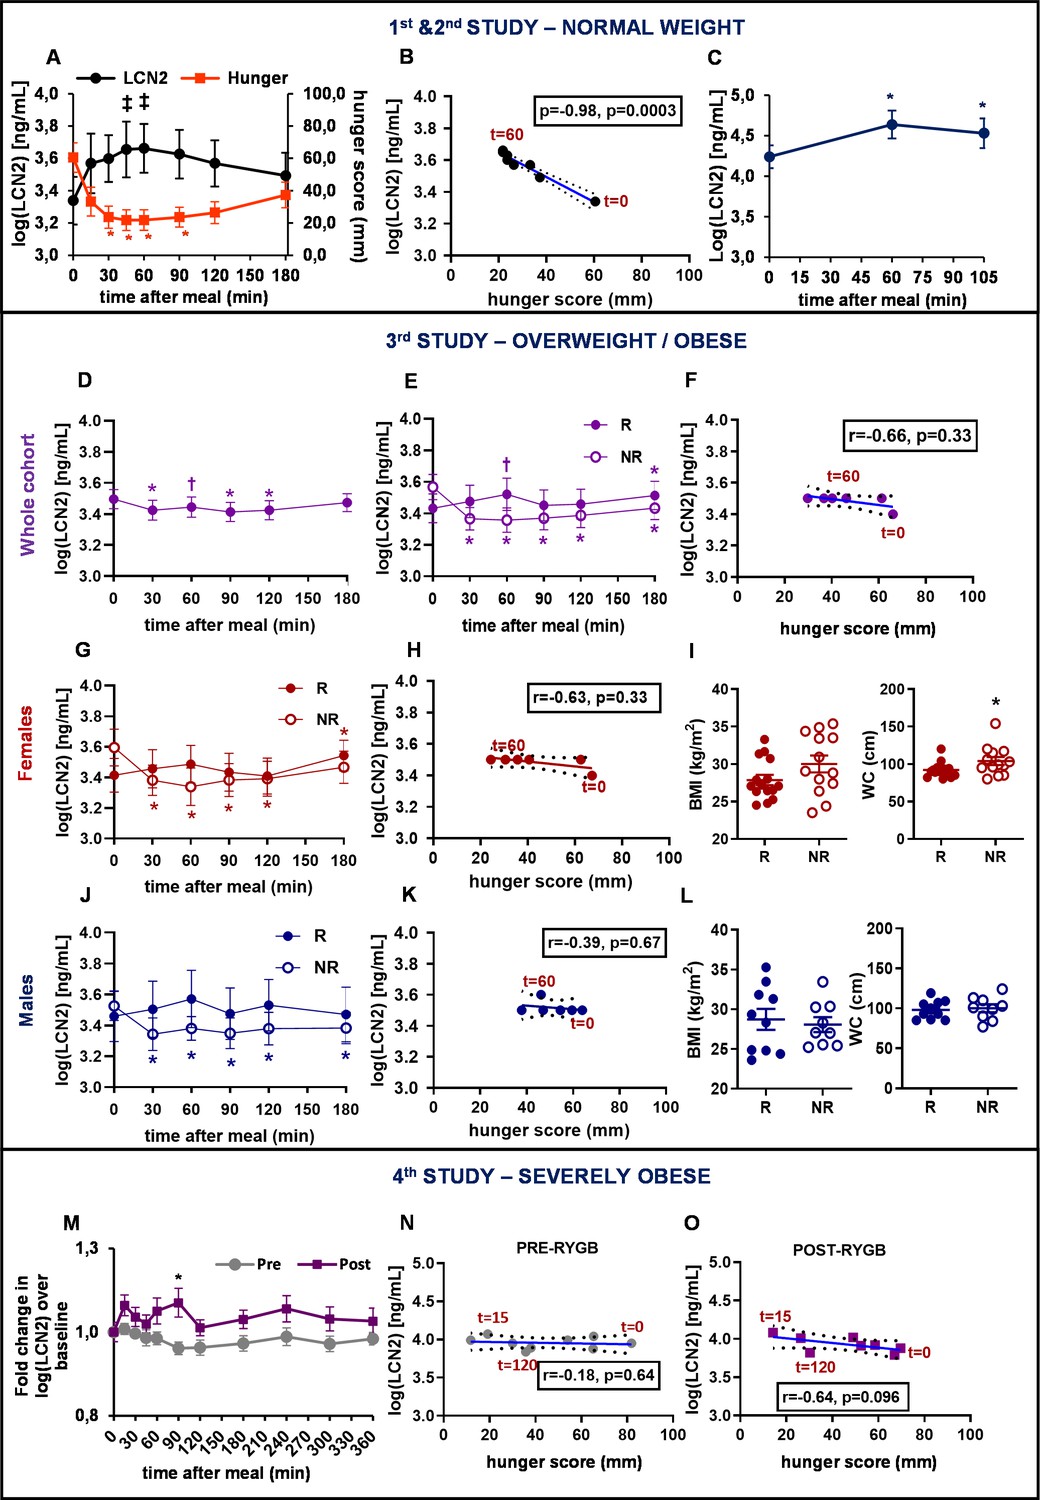
Serum LCN2 levels are postprandially increased in individuals with normal weight and overweight but not in individuals with obesity or with severe obesity.
(A–B) Study 1: (A) Serum LCN2 levels and hunger and (B) Spearman correlation between serum LCN2 levels and hunger in normal-weight women (n = 11). (C) Study 2: serum LCN2 levels in normal-weight women (n = 9). (D–L) Study 3: (D–E) serum LCN2 levels in (D) all subjects (n = 47) and (E) subcategories of the cohort classified according to their postprandial response in raising LCN2 (R [n = 25]; NR [n = 22]). (F) Spearman correlation between serum LCN2 levels and hunger in the responders of the mixed cohort. (G) Serum LCN2 levels, (H) Spearman correlation between serum LCN2 levels and hunger and (I) BMI and waist circumference in female R (n = 15) and NR (n = 13) individuals. (J) Serum LCN2 levels, (K) Spearman correlation between serum LCN2 levels and hunger and (L) BMI and waist circumference in male R (n = 10) and NR (n = 9) individuals. (M–O) Study 4: (M) Fold change in serum LCN2 levels in female and male individuals with obesity, before (pre) and after (post) gastric bypass (n = 12). The asterisk denotes the difference before and after surgery at the indicated timepoint. (N–O) Spearman correlation between serum LCN2 levels and hunger in individuals with severe obesity (N) before and (O) after bariatric surgery. Values represent mean ± SEM. * indicates p<0.05, ‡ indicates p<0.06, and † indicates p<0.1 of each timepoint versus baseline, unless otherwise stated. ‘Serum LCN2’ represents log-transformed postprandial levels and ‘hunger’ represents hunger scores BMI = basic metabolic Index, LCN2 = Lipocalin-2, R = responders (elevated LCN2 levels in multiple timepoints after the meal), NR = non-responders (reduced LCN2 levels after the meal), RYGB = Roux en-Y Gastric Bypass.
-
Figure 1—source data 1
Serum LCN2 levels are postprandially increased in individuals with normal weight and overweight but not in individuals with obesity or with severe obesity.
- https://cdn.elifesciences.org/articles/58949/elife-58949-fig1-data1-v1.xlsx
Figure 1—figure supplement 1
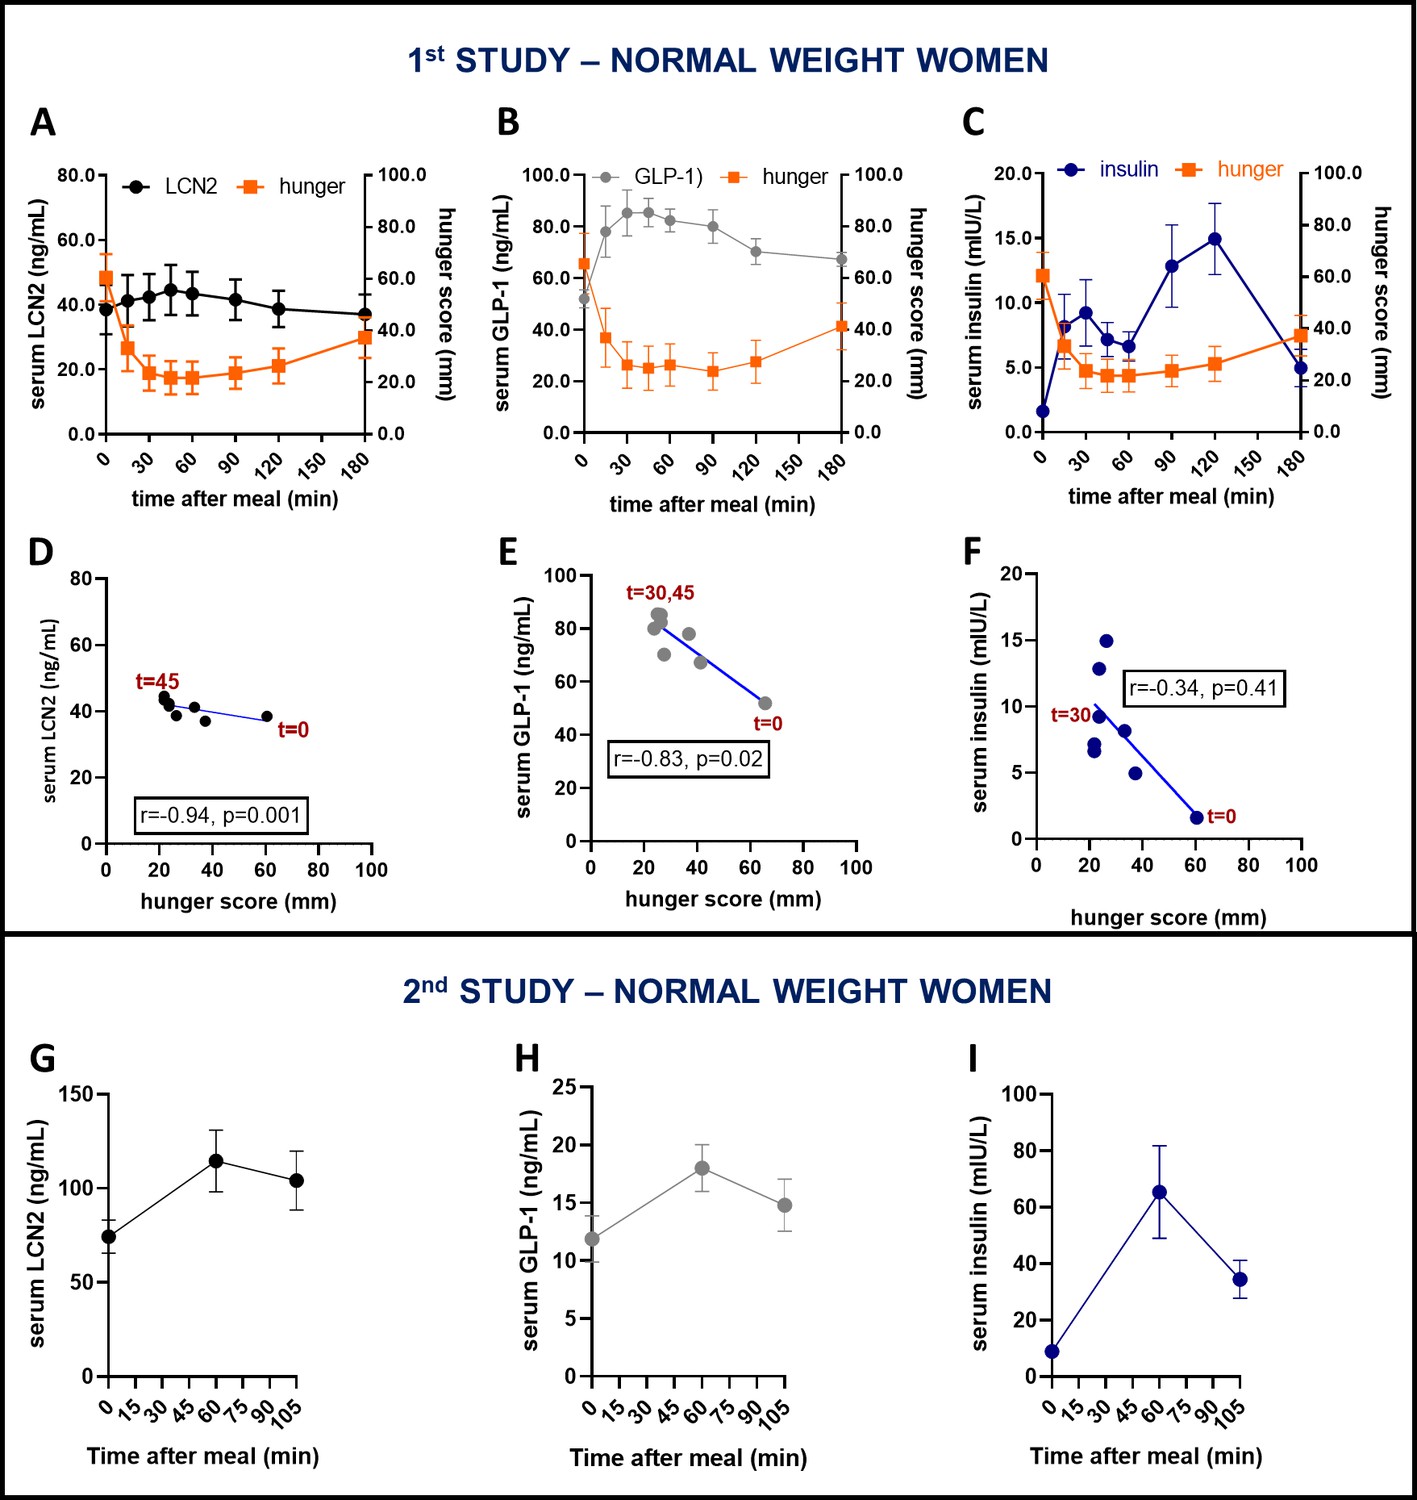
Postprandial LCN2, but not GLP-1 or insulin, is correlated with hunger in women with normal weight.
Postprandial serum (A) LCN2, (B) GLP-1, and (C) insulin levels and hunger score of n = 11 normal-weight women of Study 1. Spearman correlation between postprandial (D) LCN2, (E) GLP-1, and (F) insulin levels and hunger score of Study 1. Postprandial serum LCN2 (G), GLP-1 (H), insulin (I) levels of n = 9 normal-weight women of Study 2. Values represent mean ± SEM.
-
Figure 1—figure supplement 1—source data 1
Postprandial LCN2, but not GLP-1 or insulin, is correlated with hunger in women with normal weight.
- https://cdn.elifesciences.org/articles/58949/elife-58949-fig1-figsupp1-data1-v1.xlsx
Figure 1—figure supplement 2
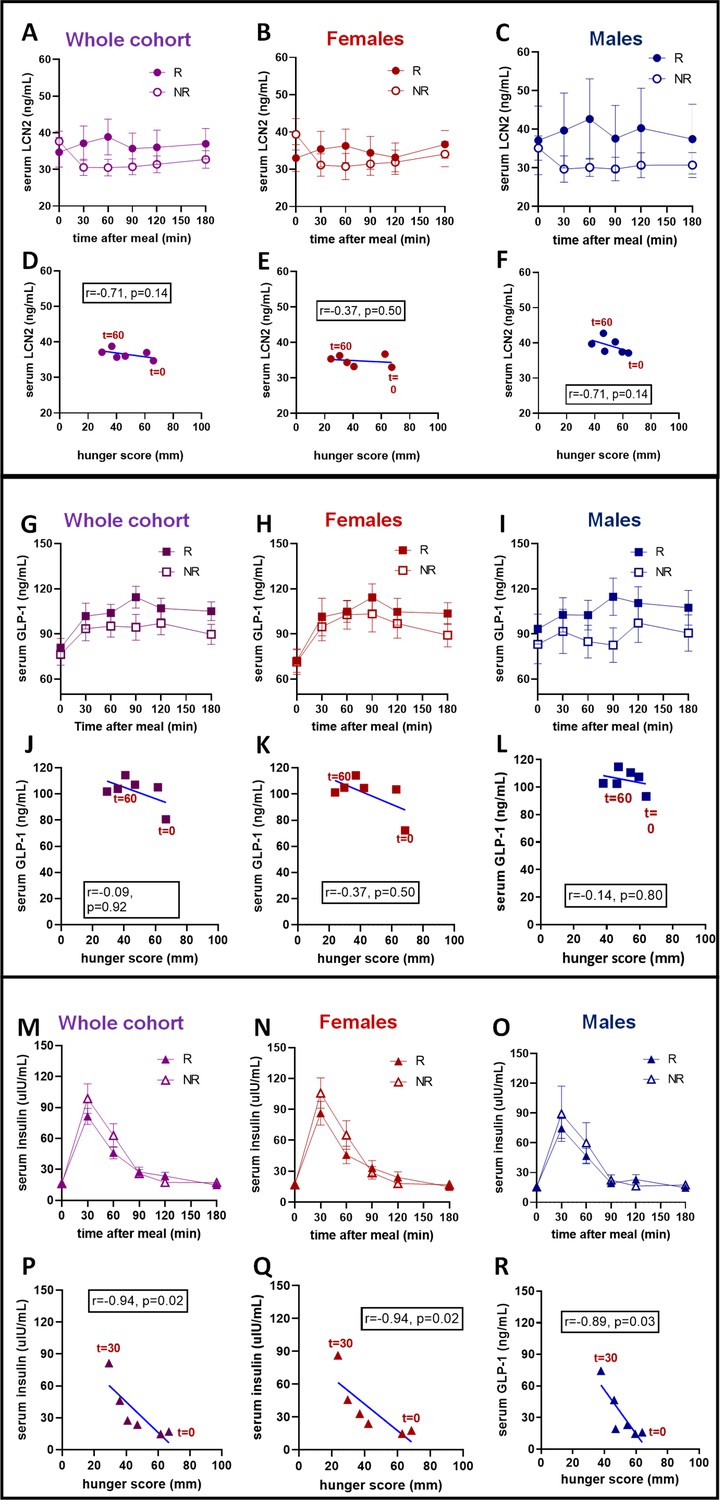
Postprandial LCN2, but not GLP-1 or insulin, is showing a decreased response in people with overweight.
Postprandial serum (A) LCN2, (G) GLP-1, and (M) insulin levels and hunger score of the whole, sex-mixed overweight/obese cohort (n = 47) of the study 3. Spearman correlation between postprandial (D) LCN2, (J) GLP-1, and (P) insulin levels and hunger score in the same 47 subjects. Postprandial serum (B, C) LCN2, (H, I) GLP-1, (N, O) insulin of n = 28 overweight/obese women and n = 19 men, respectively. Spearman correlation between postprandial (E, F) LCN2, (K, L) GLP-1, and (Q, R) insulin levels and hunger score in the same 28 women and 19 men, respectively. Filled symbols represent the responders- ‘R’ and open symbols represent the non-responders-NR’. Values represent mean ± SEM.
-
Figure 1—figure supplement 2—source data 1
Postprandial LCN2, but not GLP-1 or insulin, is showing a decreased response in people with overweight.
- https://cdn.elifesciences.org/articles/58949/elife-58949-fig1-figsupp2-data1-v1.xlsx
Figure 1—figure supplement 3
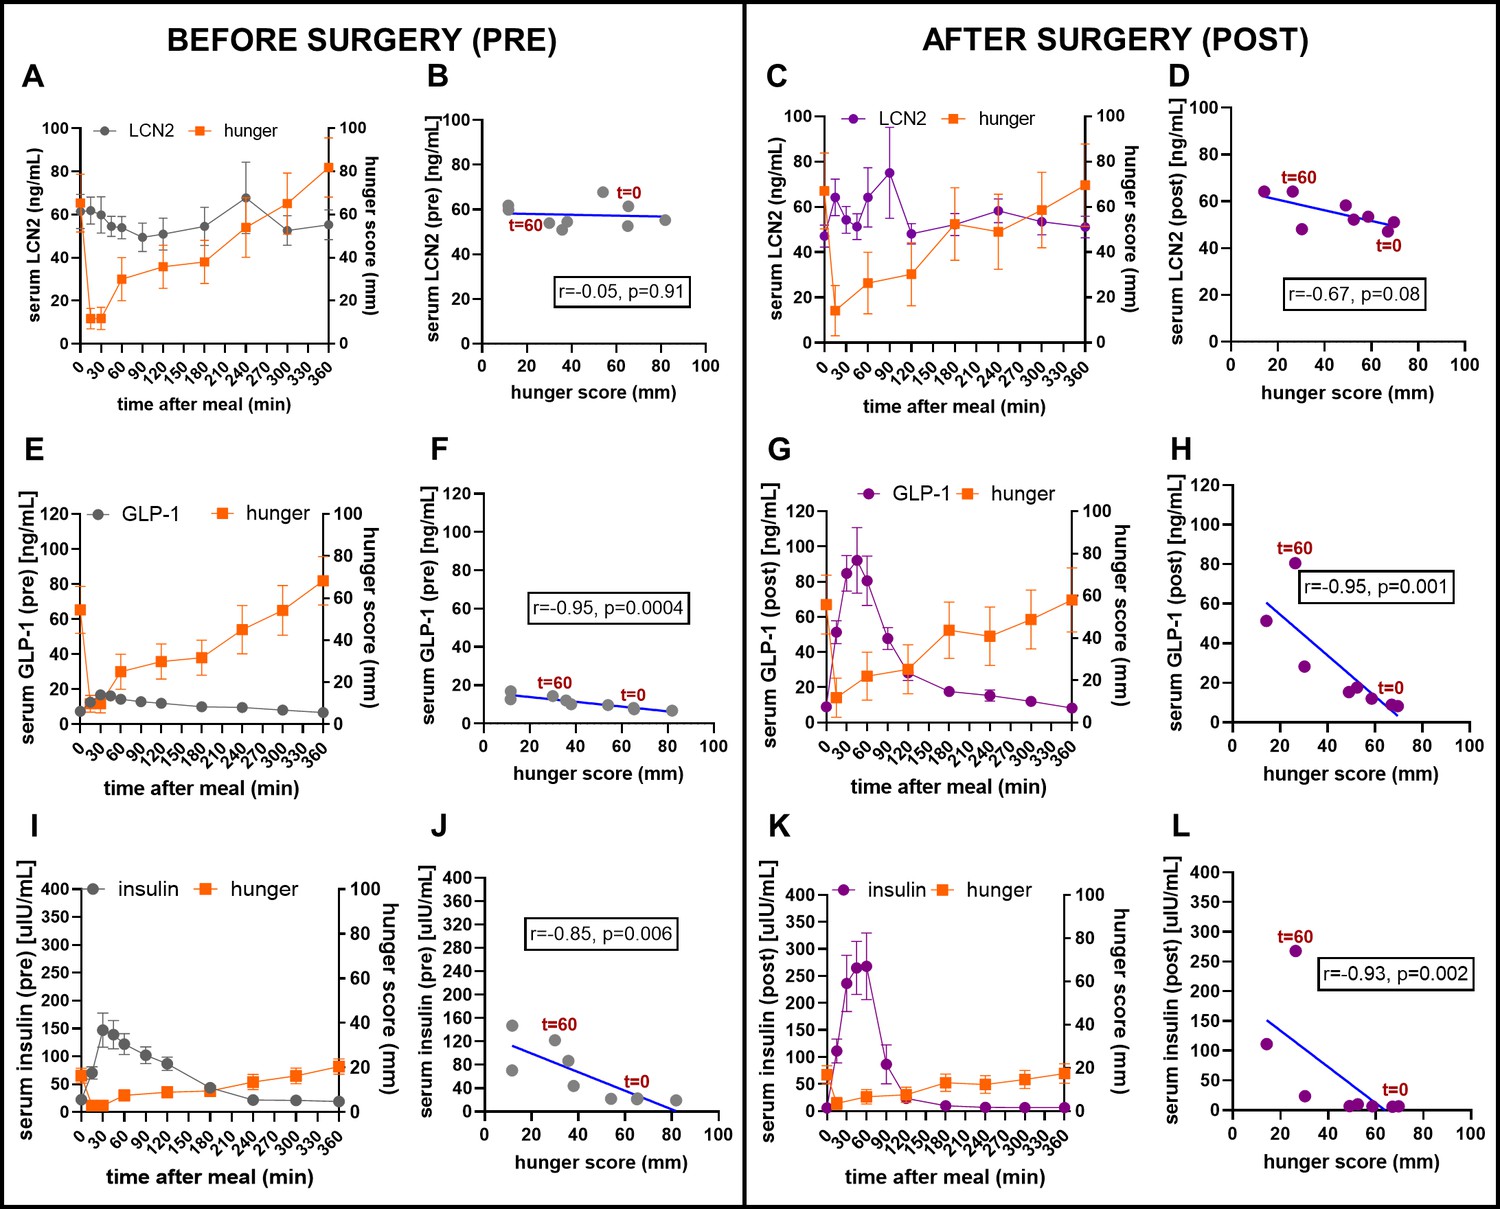
Correlation of postprandial LCN2 with hunger is ameliorated in individuals with normalized weight, only after bariatric surgery.
Pre-operative serum (A) LCN2, (E) GLP-1, and (I) insulin and hunger score of n = 12 individuals with severe obesity from Study 4. Spearman correlation between pre-operative postprandial (B) LCN2, (F) GLP-1, and (J) insulin levels and hunger score in the same individuals. Post-operative postprandial serum (C) LCN2, (G) GLP-1, (K) insulin levels of n = 12 individuals from Study 4 with normalized weight after bariatric Roux-en-Y surgery. Spearman correlation between post-operative postprandial (D) LCN2, (H) GLP-1, and (L) insulin levels and hunger score in the same individuals. Values represent mean ± SEM.
-
Figure 1—figure supplement 3—source data 1
Correlation of postprandial LCN2 with hunger is ameliorated in individuals with normalized weight, only after bariatric surgery.
- https://cdn.elifesciences.org/articles/58949/elife-58949-fig1-figsupp3-data1-v1.xlsx
Figure 2
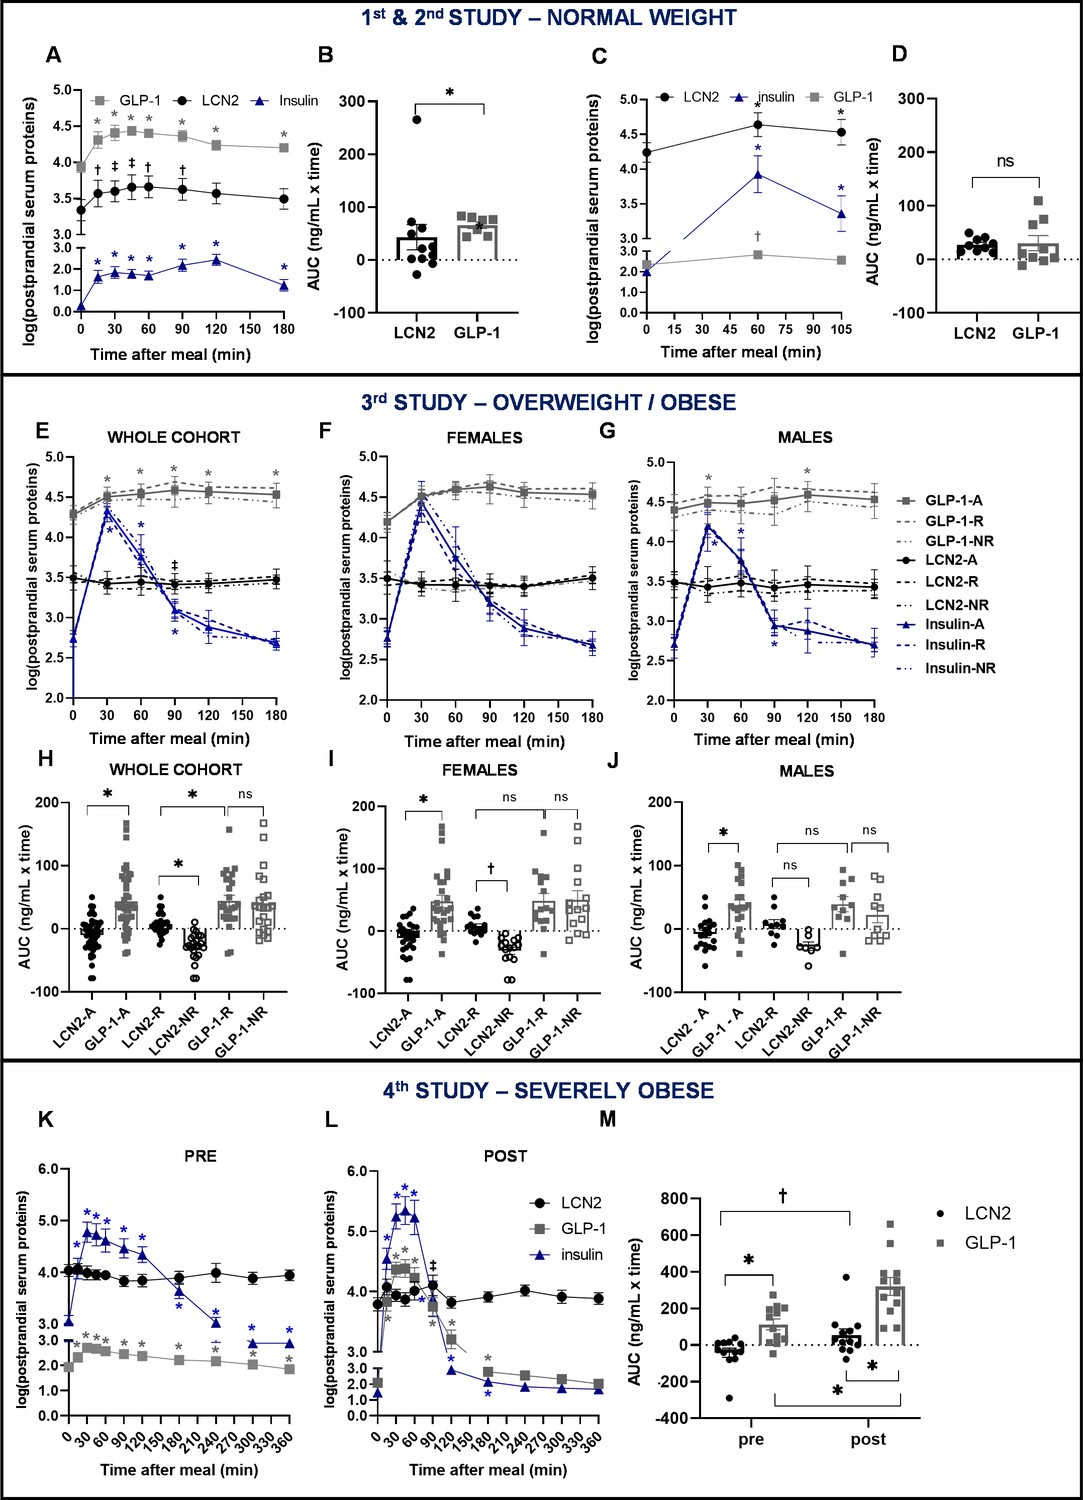
Similar postprandial regulation of serum LCN2 and GLP-1 levels in subjects with normal weight but not in subjects with overweight or obesity.
(A–B) Study 1: (A) serum LCN2, GLP-1, and insulin levels of n = 11 normal-weight women and (B) area under the curve comparison for LCN2 and GLP-1. (C–D) Study 2: (C) serum LCN2, GLP-1, and insulin levels of n = 9 normal-weight women and (D) area under the curve comparison for LCN2 and GLP-1. (E–J) Study 3: (E) serum LCN2, GLP-1, and insulin levels of n = 47 overweight and obese subjects (whole, sex-mixed cohort), (F) of n = 28 overweight and obese women and (G) of n = 19 overweight and obese men and subcategorization of the cohort to responders and non-responders. Continuous lines were used for the whole, sex-mixed cohort (-A), the dashed line for the responders (-R) and the dash-and-dots line for the non-responders (-NR). Symbols mark the significant differences between each timepoint and baseline. (H) Area under the curve comparison for LCN2 and GLP-1 of the sex-mixed cohort, (I) women and (J) men. (K–M) Study 4: serum LCN2, GLP-1, and insulin levels of n = 12 obese subjects before/pre and (L) after/post gastric bypass. (M) Area under the curve comparison for LCN2 and GLP-1 pre- and post-gastric bypass surgery. Values represent mean ± SEM. * indicates p<0.05, ‡ indicates p<0.06 and † indicates p<0.1 of each timepoint versus baseline. ‘Serum LCN2, GLP-1 and insulin’ represent log-transformed postprandial levels. The units for log LCN2 and GLP-1 concentrations are in ng/mL, whereas for insulin in mIU/mL. LCN2 = Lipocalin-2, GLP-1 = Glucagon like peptide 1, RYGB = Roux en-Y Gastric Bypass.
-
Figure 2—source data 1
Similar postprandial regulation of serum LCN2 and GLP-1 levels in subjects with normal weight but not in subjects with overweight or obesity.
- https://cdn.elifesciences.org/articles/58949/elife-58949-fig2-data1-v1.xlsx
Figure 3 with 1 supplement
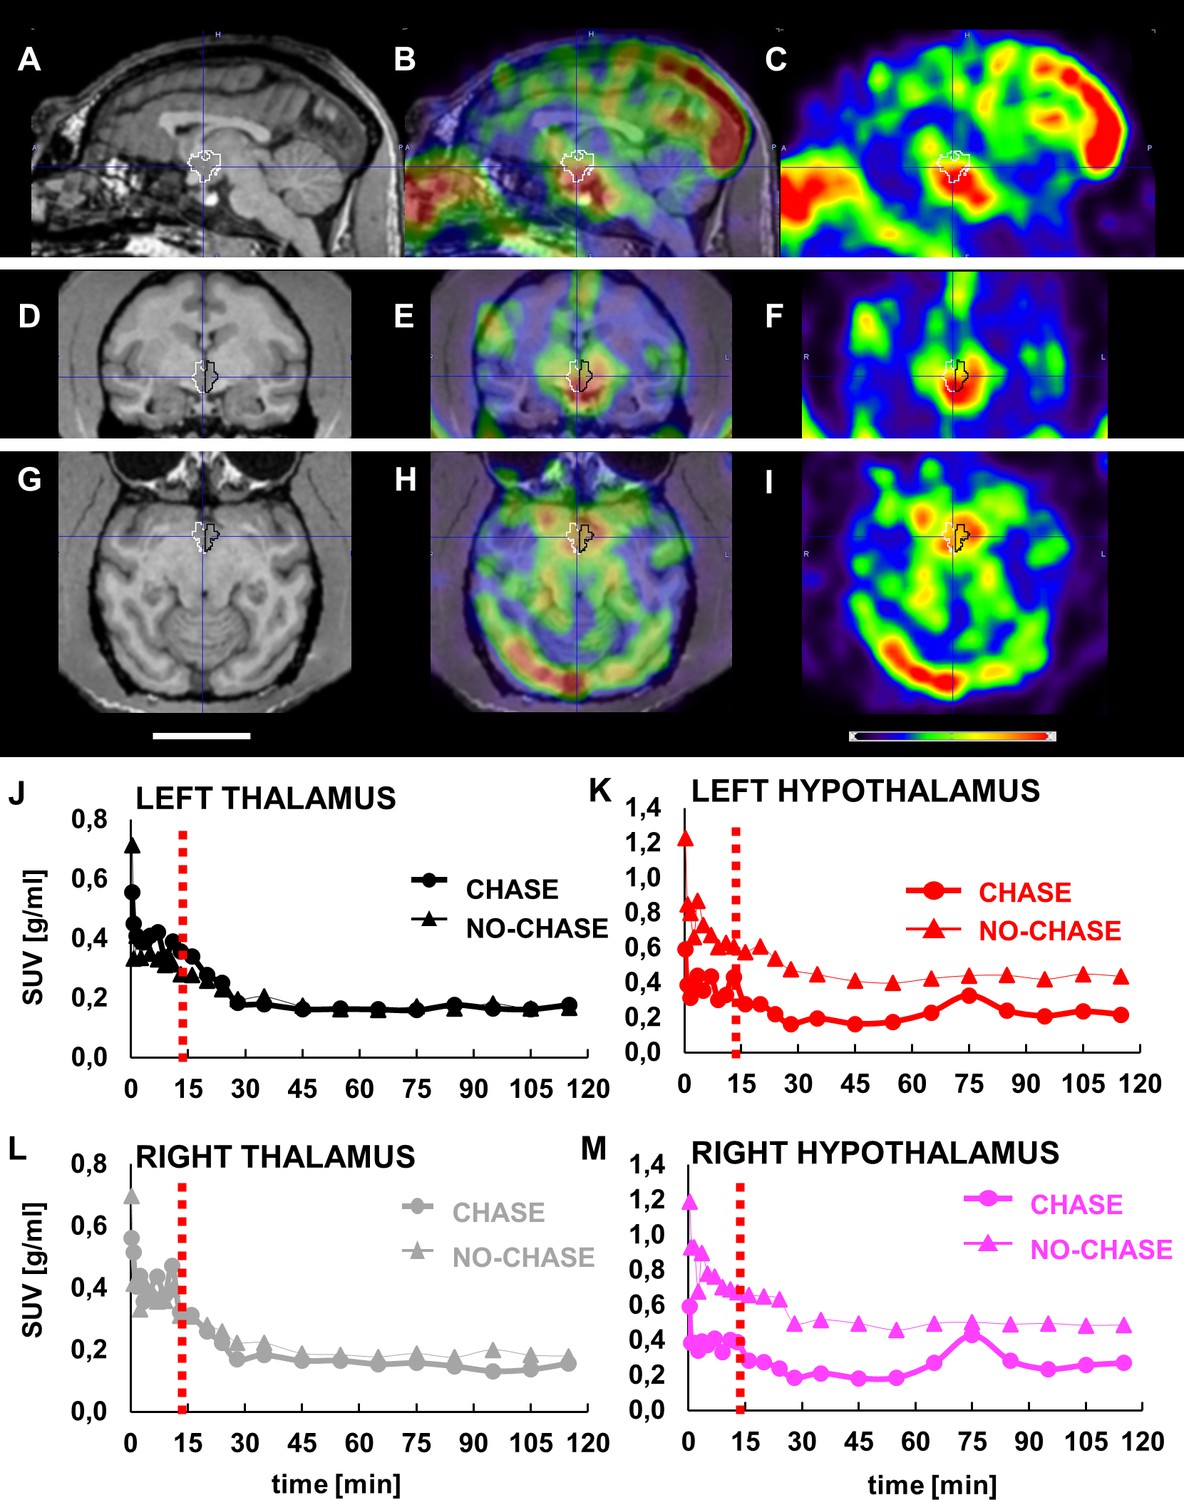
LCN2 crosses the blood-brain barrier of vervets.
(A, D, G) MRI, (B, E, H) PET/MRI and (C, F, I) PET representative images of monkey brain 30 s after infusion of [124I]-rh-LCN2. (A, B, C) Sagittal, (D, E, F) coronal, and (G, H, I) axial MRI T1-weighted template images (Invia19) demonstrate the volume of interest (VOI) and the anatomy of the hypothalamus (outlined with white and black line). (J–M) Time-activity curves (TACs) for the (J) left thalamus and (K) hypothalamus and (L) right thalamus, and (M) hypothalamus in a chase and a no-chase experiment in the same animal; TACs are reported in standard uptake value (SUV) units.
-
Figure 3—source data 1
LCN2 crosses the blood-brain barrier of vervet monkeys.
- https://cdn.elifesciences.org/articles/58949/elife-58949-fig3-data1-v1.xlsx
Figure 3—figure supplement 1
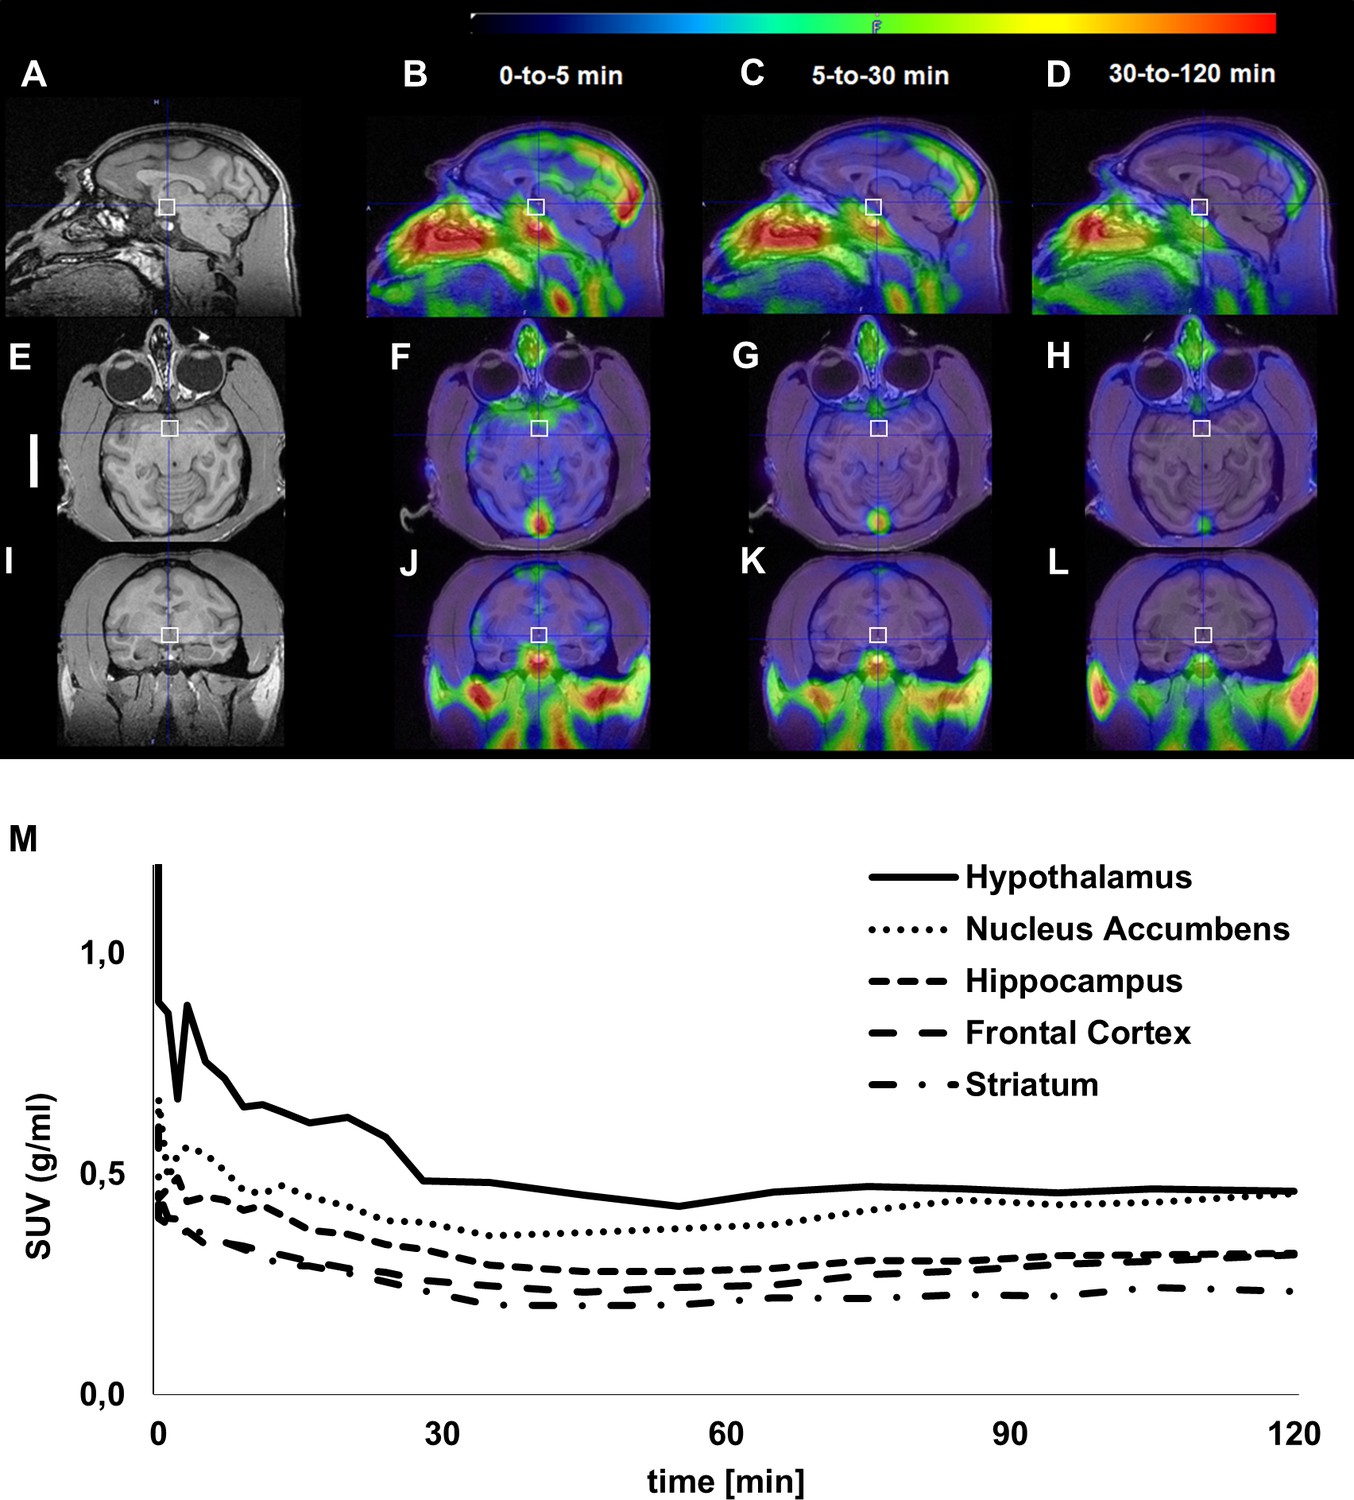
LCN2 crosses the blood-brain barrier of vervet monkeys.
(A, E, I) MRI, and PET representative images of vervet monkey brain (B, F, J) 5 min, (C, G, K) 30 min, and (D, H, L) 120 min after infusion of 124I-rh-LCN2: (A, B, C, D) Sagittal, (E, F, G, H) coronal, and (I, J, K, L) axial images demonstrate the volume of interest (VOI) and the anatomy of the hypothalamus (outlined with white square). (M) Time-activity curves for various brain areas and comparison to the hypothalamus in a no-chase experiment.
-
Figure 3—figure supplement 1—source data 1
LCN2 crosses the blood-brain barrier of vervet monkeys.
- https://cdn.elifesciences.org/articles/58949/elife-58949-fig3-figsupp1-data1-v1.xlsx
Figure 4 with 1 supplement
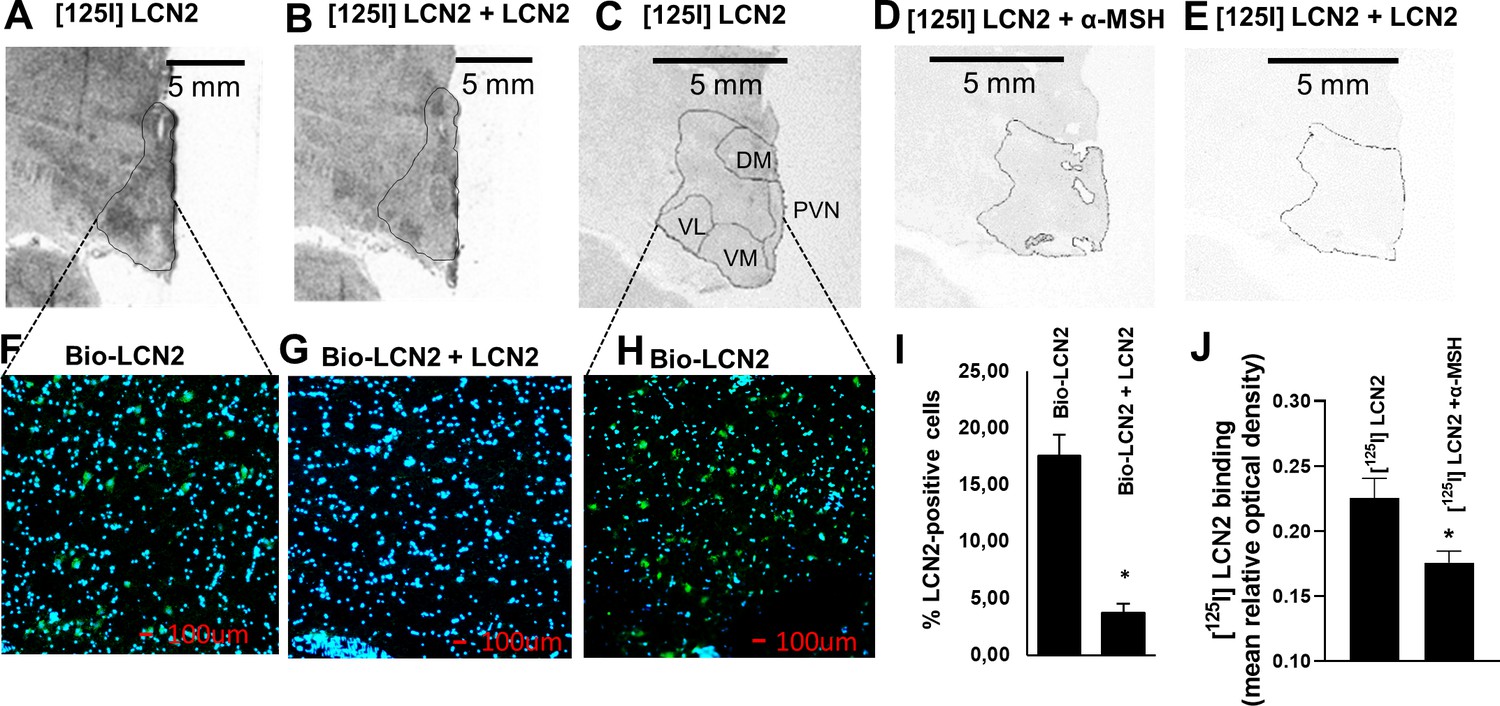
LCN2 binds to the hypothalamus of human, baboon, and rhesus macaque brain sections.
(A–B) Autoradiographic images showing (A) [125I] rh-LCN2 binding and (B) blocking of [125I] rh-LCN2 binding with not radiolabeled rh-LCN2 on the baboon hypothalamus; the hypothalamic area is outlined with a black line. (C–E) Autoradiographic images showing (C) [125I] rh-LCN2 binding, (D) blocking of [125I] rh-LCN2 binding with α-MSH, and (E) blocking of [125I] rh-LCN2 binding with not radiolabeled rh-LCN2 on the human hypothalamus. (F–G) Binding of biotinylated LCN2 to the hypothalamic area (outlined in A, B from baboon brain sections) in the (F) absence or (G) presence of hundred-fold excess of non-biotinylated LCN2 and (I) quantitation of LCN2-positive cells in both conditions (as percent of total cells in each field of view; n = 1 brain section and n = 4 fields of view for (F) and n = 2 for (G)). Bar graphs were obtained from a single brain section and therefore depict qualitative representations of binding. (H) Binding of biotinylated LCN2 to the hypothalamic area (outlined in C-E) from the human brain. (J) Quantification of specific [125I] rh-LCN2 binding to human brain sections (n = 3). Values are mean ± standard deviation of the mean. DM = dorsomedial, PVN = paraventricular nucleus of the hypothalamus, VM = ventromedial, VL = ventrolateral nucleus of the hypothalamus.
-
Figure 4—source data 1
LCN2 binds to the hypothalamus of primates.
- https://cdn.elifesciences.org/articles/58949/elife-58949-fig4-data1-v1.xlsx
Figure 4—figure supplement 1
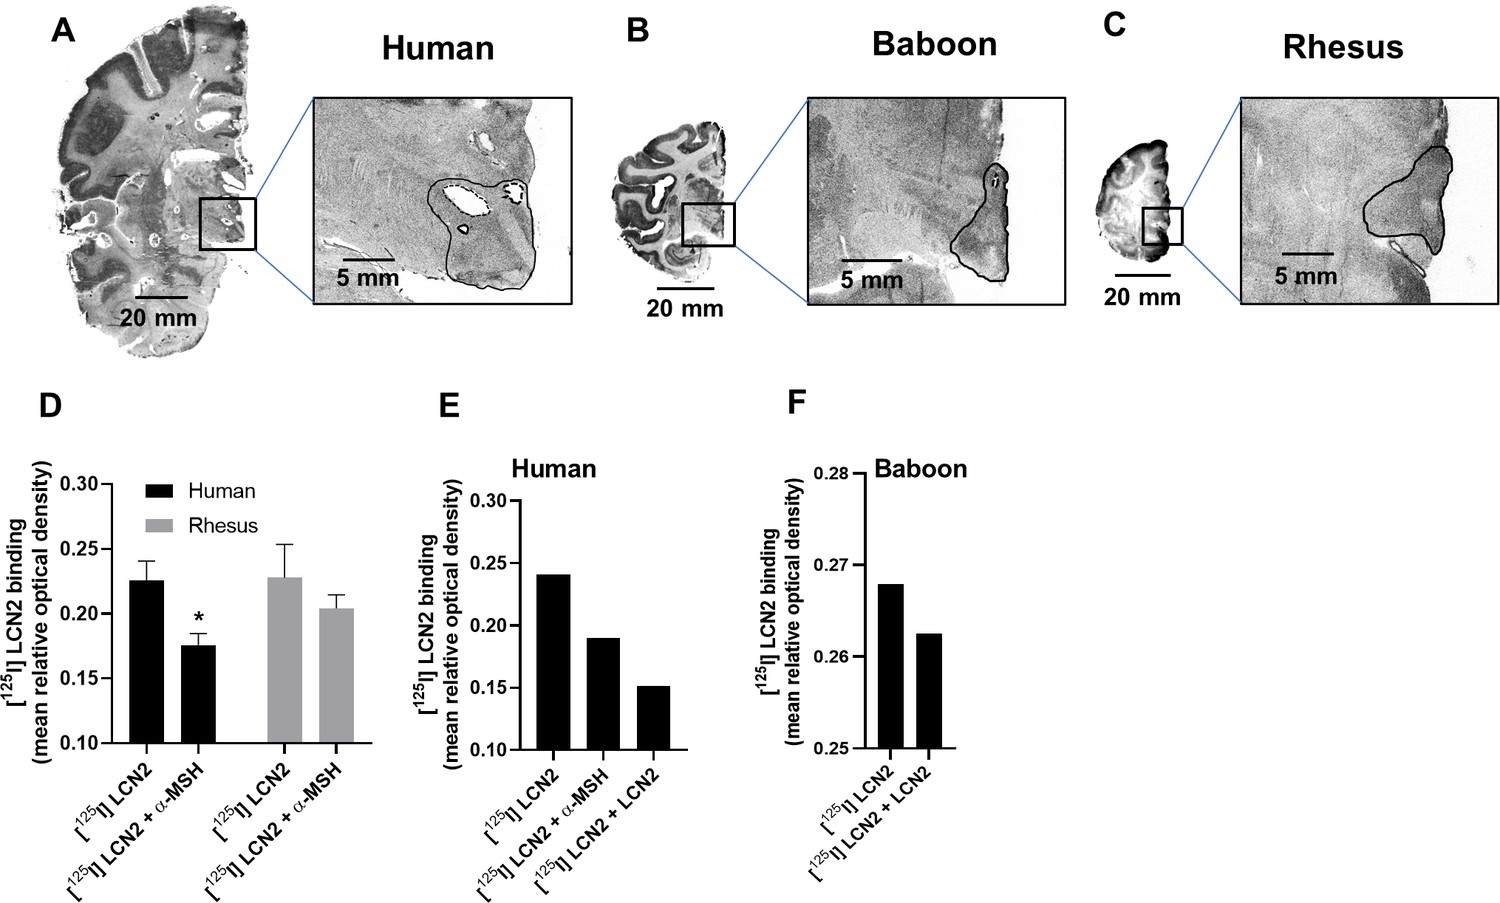
LCN2 binds to the hypothalamus of primates.
Rh-LCN2 binding in hemisphere tissue sections in the coronal plane from brains from a (A) human, (B) baboon, and a (C) rhesus macaque. (D) Quantification of [125I] rh-LCN2 binding in the human and rhesus hypothalamus, which was blocked with α-MSH. The human data of (D) are presented also in Figure 4J, but are included here for comparison with the rhesus macaque data. Values are mean ± SEM. (E) Quantification of [125I] rh-LCN2 binding from one experiment where α-MSH and LCN2 blocking were compared in brain sections from n = 1 human subject. (F) Quantification of binding [125I] rh-LCN2 binding in n = 1 baboon brain; bar graphs in E and F depict qualitative representations of binding. Rh-LCN2 = recombinant human Lipocalin-2.
-
Figure 4—figure supplement 1—source data 1
LCN2 binds to the hypothalamus of primates.
- https://cdn.elifesciences.org/articles/58949/elife-58949-fig4-figsupp1-data1-v1.xlsx
Figure 5 with 1 supplement
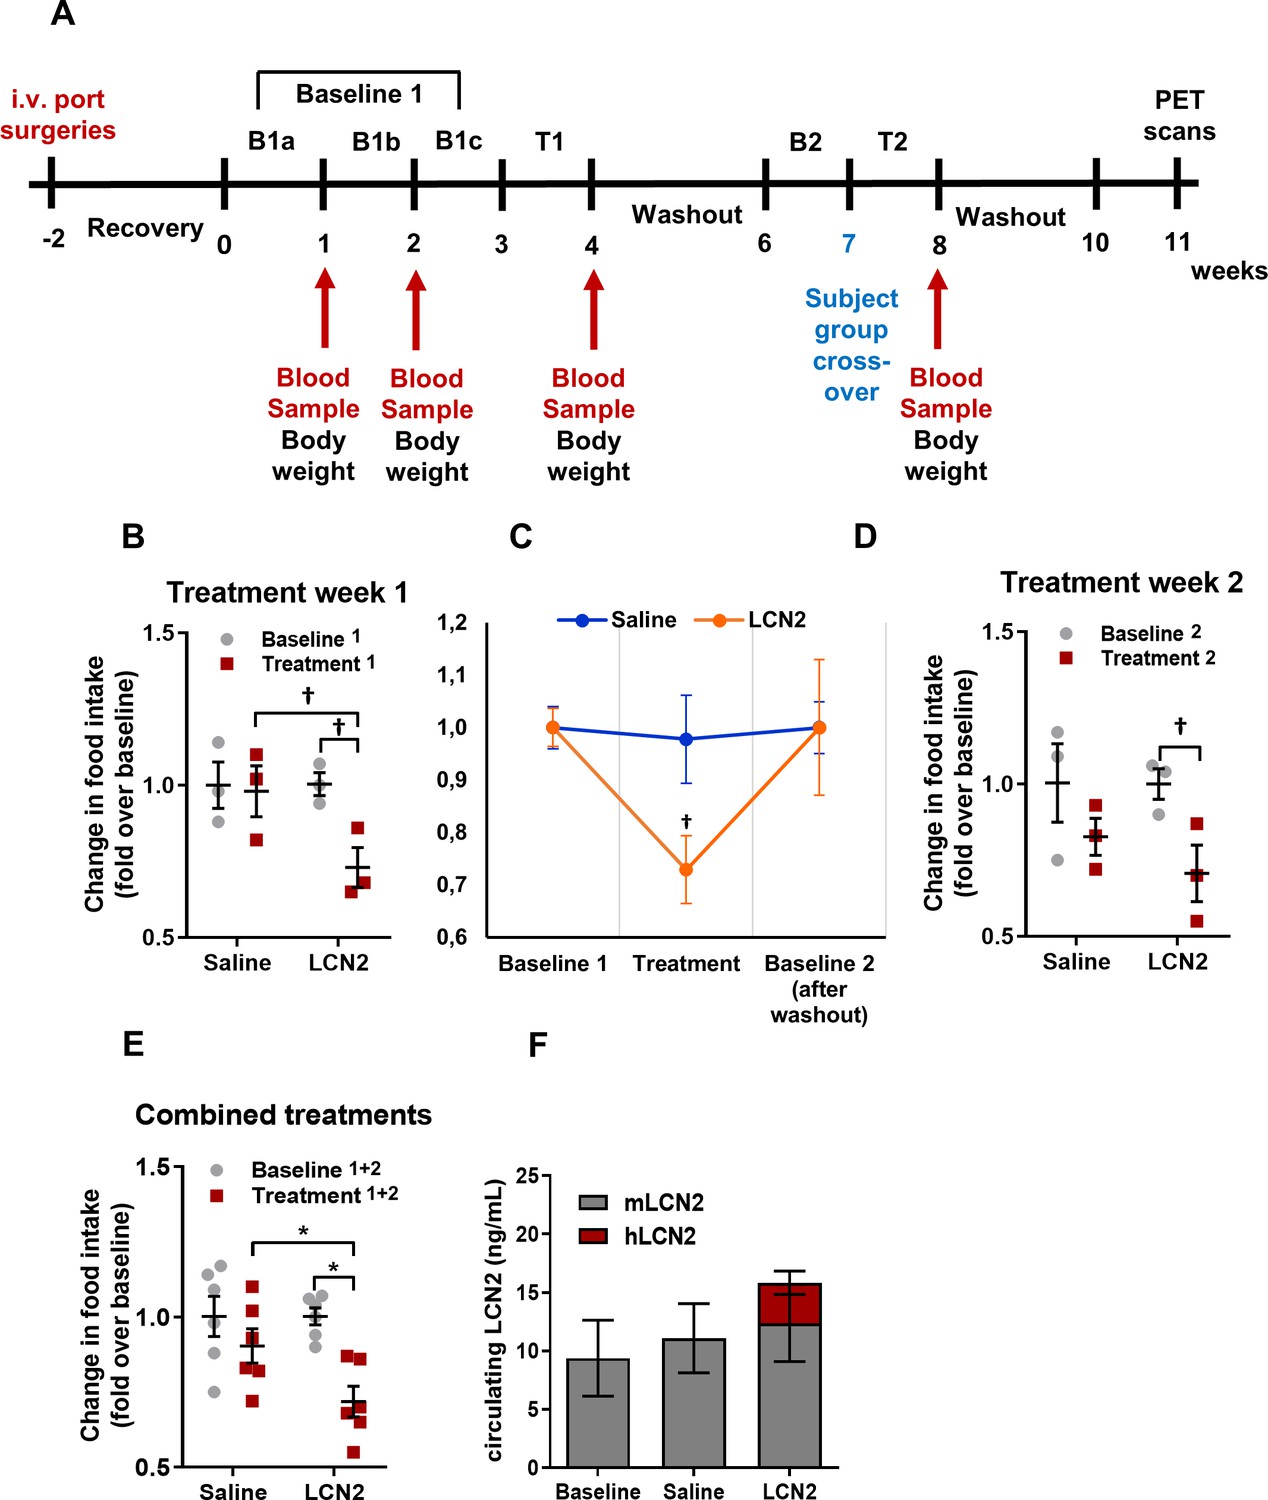
Rh-LCN2 administration suppresses food intake in vervets within 5 days of treatment.
(A) Timeline in weeks showing the design and major events of the non-human primate study. (B) Change in food intake of saline- and LCN2-treated vervets during the first week of treatment (n = 3 monkeys/treatment). (C) Change in food intake of saline- and LCN2-treated vervets during the baseline, the first week of treatment, and the subsequent washout period (n = 3 monkeys/treatment). (D–E) Change in food intake of saline- and LCN2-treated vervets during (D) the second week of treatment (n = 3 monkeys/treatment) and (E) when treatment weeks were combined and values were averaged (n = 6 monkeys/treatment). (F) Circulating levels of monkey and human LCN2 in the treated monkeys. Two different ELISA assays were used; one for human and one for monkey LCN2. Each ELISA has selective reactivity for the designated species. In G, gray bars indicate serum levels of monkey whereas red bars represent human LCN2 following its administration. Values represent mean ± SEM. * indicates p<0.05 and † indicates p<0.1. B = Baseline, T = Treatment, mLCN2 = monkey Lipocalin-2, hLCN2 = human Lipocalin-2.
-
Figure 5—source data 1
Rh-LCN2 administration suppresses food intake in vervets within 5 days of treatment.
- https://cdn.elifesciences.org/articles/58949/elife-58949-fig5-data1-v1.xlsx
Figure 5—figure supplement 1
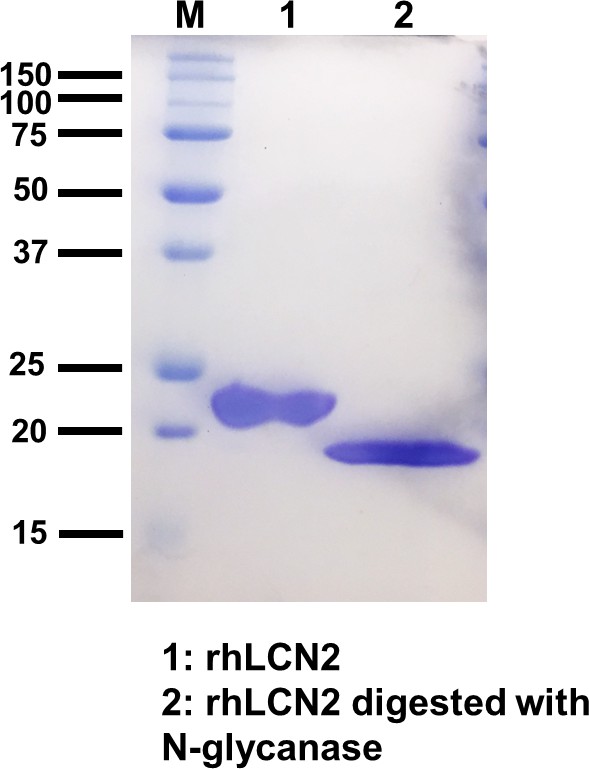
Rh-LCN2 is pure and N-glycosylated.
Coomassie blue staining of recombinant human LCN2 showing purity and N-glycosylation of the protein. Lane 1, recombinant human LCN2, Lane 2, recombinant human LCN2 digested with N-glycanase. M, molecular weight marker.
Figure 6
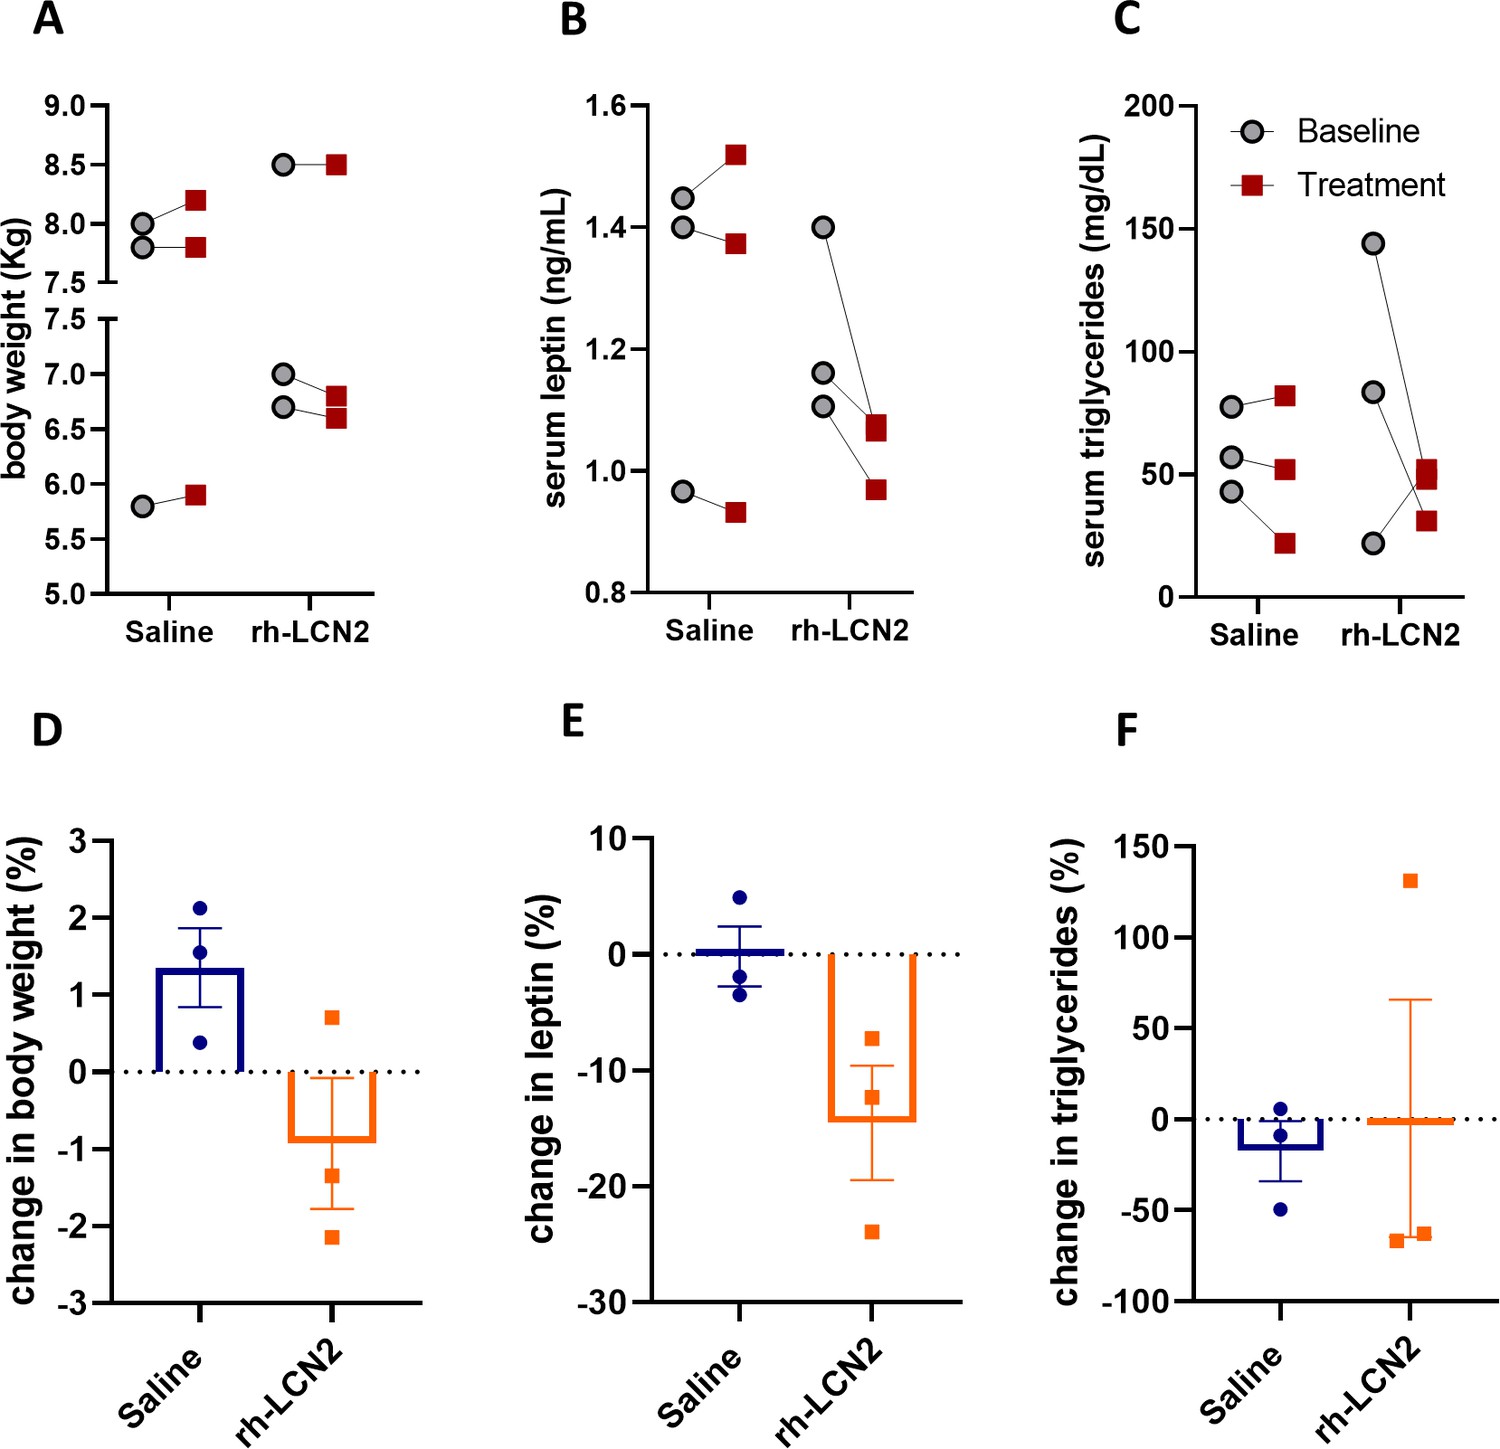
Body weight, leptin, and triglyceride show a tendency for decrease in vervet monkeys after rh-LCN2 treatment.
(A) Body weight, (B) serum leptin, and (C) serum triglycerides at baseline and after saline- and LCN2-treatment of vervets (n = 3 monkeys/treatment). Change in body weight (D), serum leptin (E), and serum triglycerides (F) at the end of treatment week 1. Values represent mean ± SEM. rh-LCN2 = recombinant human Lipocalin-2.
-
Figure 6—source data 1
Body weight, leptin, and triglyceride show a tendency for decrease in vervet monkeys after rh-LCN2 treatment.
- https://cdn.elifesciences.org/articles/58949/elife-58949-fig6-data1-v1.xlsx
Tables
Table 1
Acute-phase, toxicological, and metabolic markers in the treated vervets.
| Parameter | Baseline | Saline | LCN2 |
|---|---|---|---|
| Primate LCN2 (ng/mL) | 9.4 ± 3.2 | 11.1 ± 3.0 | 12.4 ± 3.3 |
| CRP (ng/mL) | 464.4 ± 253.4 | 453.1 ± 191.1 | 935.5 ± 618.7 |
| GGT (u/L) | 51.0 ± 4.5 | 52.2 ± 5.1 | 49.5 ± 4.0 |
| AST(SGOT) (u/L) | 52.8 ± 3.8 | 106.7 ± 14.8(*) | 131.3 ± 12.3(*) |
| ALT(SGPT) (u/L) | 91.7 ± 21.1 | 104.8 ± 29.3 | 93.3 ± 25.1 |
| ALP (u/L) | 100.3 ± 11.3 | 79.5 ± 14.6 | 82.5 ± 7.1 |
| BUN (mg/dL) | 13.8 ± 0.5 | 15.5 ± 0.8 | 16.3 ± 0.6(*) |
| Creatinine (mg/dL) | 0.7 ± 0.1 | 0.8 ± 0.0 | 0.8 ± 0.0(*) |
| BUN/Creatinine ratio | 19.9 ± 2.1 | 20.7 ± 0.9 | 20.5 ± 1.1 |
| Total protein (g/dL) | 6.6 ± 0.2 | 6.6 ± 0.4 | 6.7 ± 0.2 |
| Albumin (g/dL) | 4.0 ± 0.2 | 3.5 ± 0.5 | 4.1 ± 0.1 |
| Globulin (g/dL) | 2.5 ± 0.1 | 2.9 ± 0.2 | 2.6 ± 0.1 |
| Phosphorus (mg/dL) | 3.7 ± 0.2 | 4.6 ± 0.4 | 5.0 ± 0.5(*) |
| Calcium (mg/dL) | 8.6 ± 0.2 | 8.5 ± 0.3 | 8.8 ± 0.2 |
| Glucose (mg/dL) | 80.3 ± 3.3 | 64.7 ± 2.6(*) | 68.2 ± 4.4(*) |
| Insulin (mIU/mL) | 83.0 ± 16.0 | 61.5 ± 14.5 | 50.8 ± 11.8 |
| Cholesterol (mg/dL) | 141.4 ± 16.3 | 147.2 ± 20.1 | 143.8 ± 20.8 |
| Triglycerides (mg/dL) | 71.3 ± 17.2 | 51.2 ± 11.1 | 50.7 ± 11.4(†) |
| Leptin (ng/mL) | 1.3 ± 0.1 | 1.3 ± 0.1 | 1.2 ± 0.1 |
| Amylase (u/L) | 1336.8 ± 190.9 | 1699.8 ± 283.8 | 1744.5 ± 352.5 |
| Lipase (u/L) | 71.2 ± 7.2 | 85.0 ± 11.8 | 77.2 ± 11.6 |
-
Values represent mean ± SEM. * indicates p<0.05 and † indicates p<0.1 versus baseline, with two-tailed paired Student’s t-tests. LCN2 = Lipocalin-2, CRP = C reactive protein, GGT = Gamma glutamyl transferase, AST = Aspartate transaminase, SGOT = Serum glutamate-oxaloacetate transaminase, ALT = Alanine transaminase, SGPT = Serum glutamic pyruvic transaminase, ALP = Alkaline phosphatase, BUN = Blood urea nitrogen.
-
Table 1—source data 1
Acute-phase, toxicological, and metabolic markers in the treated vervets.
- https://cdn.elifesciences.org/articles/58949/elife-58949-table1-data1-v1.xlsx
Key resources table
| Reagent type (species) or resource | Designation | Source or reference | Identifiers | Additional information |
|---|---|---|---|---|
| Antibody | Rabbit anti-biotin antibody | Abcam | Cat# ab53494, RRID:AB_867860 | 10 ug/mL |
| Antibody | Donkey anti-rabbit Alexa Fluor 488 | Life technologies | Cat# A-21206, RRID:AB_2535792 | 1:200 |
| Biological sample (Homo sapiens) | RNA from human osteoblasts | Laboratory of Prof. Stavroula Kousteni | The coding sequence of human LCN2 was amplified and the amplified insert was cloned into the πα-SHP-H vector. Additional information can be found in section: ‘Production of recombinant human LCN2 (rh-LCN2)”. | |
| Biological sample (Homo sapiens, Female) | Study 1 serum samples | Columbia University Irving Medical Center | Additional information can be found in section: ‘Subjects, protocols and test meals’. | |
| Biological sample (Homo sapiens, Female) | Study 2 serum samples | University of Lyon - INSERM UMR 1033 institute | Additional information can be found in section: ‘Subjects, protocols and test meals’. | |
| Biological sample (Homo sapiens, Male and Female) | Study 3 serum samples | Rutgers University | Additional information can be found in section: ‘Subjects, protocols and test meals’. | |
| Biological sample (Homo sapiens, Male and Female) | Study 4 plasma samples | Columbia University Irving Medical Center | Additional information can be found in section: ‘Subjects, protocols and test meals’. | |
| Biological sample (Chlorocebus aethiops sabeus, Male) | African Green Monkeys serum samples | Wake Forest School of Medicine | Additional information can be found in section: ‘Non-human primate study’. | |
| Biological sample (Homo sapiens, Male) | Post-mortem human brain sections | Columbia University – New York State Psychiatric Institute | Additional information can be found in section: ‘Autoradiography and immunofluorescence on brain sections from primates’. | |
| Biological sample (Papio anubis, Male) | Baboon brain sections | Columbia University – New York State Psychiatric Institute | Additional information can be found in section: ‘Autoradiography and immunofluorescence on brain sections from primates’. | |
| Biological sample (Macaca fascicularis, Male) | Macaque brain sections | Columbia University – New York State Psychiatric Institute | Additional information can be found in section: ‘Autoradiography and immunofluorescence on brain sections from primates’. | |
| Chemical compound, drug | PEI max | Polysciences Inc | Cat# 24765–1 | |
| Chemical compound, drug | Radioactive sodium iodide (Na125I) | Perkin Elmer | Cat# NEZ033001MC | |
| Peptide, recombinant protein | Alpha MSH | Tocris | Cat# 2584 | |
| Peptide, recombinant protein | Recombinant Human LCN2 (rh-LCN2) | This paper | Additional information can be found in section ‘Production of recombinant human LCN2 (rh-LCN2)”. | |
| Peptide, recombinant protein | N-glycanase | Sigma-Aldrich | Cat# P9120 | 0.1 U |
| Peptide, recombinant protein | NHS Biotin | Thermo Fisher Scientific | Cat# 20217 | Additional information can be found in section: ‘Autoradiography and immunofluorescence on brain sections from primates’. |
| Commercial assay or kit | Human Lipocalin-2/NGAL DuoSet ELISA | R and D Systems | Cat# DY1757 | |
| Commercial assay or kit | Human Insulin ELISA | Crystal Chem | Cat# 90095 | |
| Commercial assay or kit | Human GLP-1 ELISA | Merck Millipore | Cat# EZGLP1T-36K | |
| Commercial assay or kit | Monkey Lipocalin-2 ELISA | LifeSpan BioSciences | Cat# LS-F38530 | |
| Commercial assay or kit | Monkey Insulin ELISA | LifeSpan BioSciences | Cat# LS-F10306 | |
| Commercial assay or kit | Primate CRP | Helica Biosystems | Cat# 911CRP01P-96 | |
| Commercial assay or kit | Monkey Leptin | Cusabio | Cat# CSB-E14936Mk | |
| Other | Raw data (Human studies 1–4) | This paper | Raw data can be found in the source data files‘Figure 1—source data 1’,‘Figure 1—figure supplement 1—source data 1’. | |
| Other | Raw data (Non-human primate study) | This paper | Raw data can be found in the source data files of Figures 3–6. | |
| Other | Raw data (Autoradiography studies) | This paper | Raw data can be found in the source data files‘Figure 4—source data 1’ and ‘Figure 4—figure supplement 1—source data 1’. | |
| Cell line (Homo-sapiens, Female) | HEK-293 | ATCC | Cat# CRL-1573, RRID:CVCL_0045 | |
| Cell line (Homo-sapiens, Female) | Expi293 | ThermoFisher Scientific | Cat# A14527 RRID:CVCL_D615 | |
| Recombinant DNA reagent | Plasmid: πα-SHP-H-LCN2 | This paper | Additional information can be found in section ‘Production of recombinant human LCN2 (rh-LCN2)”. | |
| Software, algorithm | GraphPad Prism v8 | GraphPad | RRID:SCR_002798 | https://www.graphpad.com/scientific-software/prism/ |
| Software, algorithm | SAS v9.4 | SAS | RRID:SCR_008567 | https://www.sas.com |
| Software, algorithm | Pmod software | Pmod Technologies | RRID:SCR_016547 | https://www.pmod.com/web/ |
Additional files
-
Source data 1
Demographics and serum metabolic parameter measurements in Human Studies 1-4.
- https://cdn.elifesciences.org/articles/58949/elife-58949-data1-v1.xlsx
-
Supplementary file 1
Tables containing characteristics of participants of the human studies.
(A) Characteristics of participants of the 1st and 2nd study. (B) Characteristics of study participants of the 3rd study. (C) Characteristics of participants of the 4th study.
- https://cdn.elifesciences.org/articles/58949/elife-58949-supp1-v1.docx
-
Transparent reporting form
- https://cdn.elifesciences.org/articles/58949/elife-58949-transrepform-v1.pdf
Download links
A two-part list of links to download the article, or parts of the article, in various formats.
Downloads (link to download the article as PDF)
Open citations (links to open the citations from this article in various online reference manager services)
Cite this article (links to download the citations from this article in formats compatible with various reference manager tools)
Lipocalin-2 is an anorexigenic signal in primates
eLife 9:e58949.
https://doi.org/10.7554/eLife.58949


