TrpML-mediated astrocyte microdomain Ca2+ transients regulate astrocyte–tracheal interactions
- Vollum Institute, Oregon Health and Science University, United States
Figures
Figure 1 with 3 supplements
Characterization of microdomain Ca2+ transients in Drosophila astrocytes.
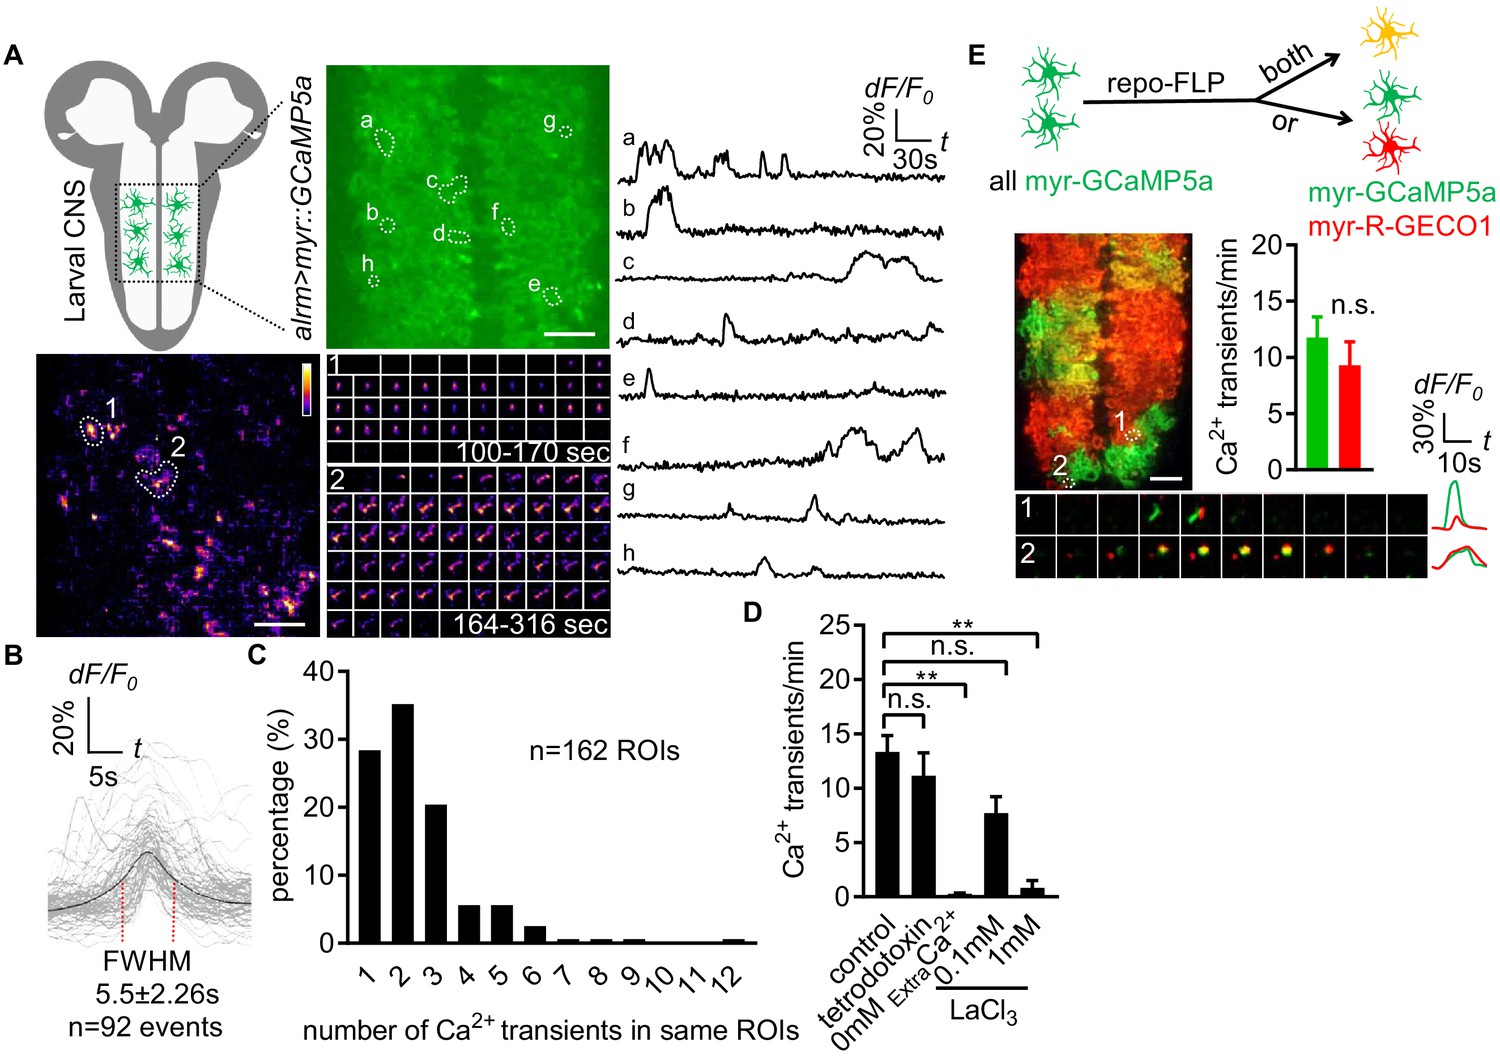
(A) Schematic of larval CNS (white area, neuropil; gray, cortex). An imaging area showing membrane tethered myr-GCaMP5a (green) in astrocytes, in which microdomain Ca2+ transients during 6 min were maximally projected. Traces of 8 individual ROIs microdomains (right, a–h) are shown over the entire 6 min window. Pseudocolor grayscale of Ca2+ signals (bottom left), grayscale values ranging from 0 to 255 (scale bars, 20 µm). Representative time-lapse images (bottom right) of two indicated microdomain Ca2+ transients in 2 ROIs (1, 2). (B) Superimposed traces of individual microdomain Ca2+ transients and an average with its full width at half maximum (FWHM, mean ± SD). (C) Histogram showing the distribution of recurrent microdomain Ca2+ transients at same ROIs. (D) Responses of microdomain Ca2+ transients to tetrodotoxin, 0 extracellular Ca2+ and LaCl3 (n = 6, mean ± SEM, one-way ANOVA). (E) 2-color Ca2+ imaging in neighboring astrocytes. In presence of the flippase repo-FLP, myr-GCaMP5a expressing astrocytes switch to express myr-R-GECO1, resulting in 3 types of astrocytes: myr-GCaMP5a+ (green), myr-R-GECO1+ (red), expressing both indicators (orange) (scale bar, 20 µm). Quantification is from Ca2+ imaging of myr-GCaMP5a and myr-R-GECO1 that were exclusively expressed in adjacent astrocytes (n = 3, unpaired t-test). Time-lapse images and superimposed traces of representative microdomain Ca2+ transients at two juxtaposed ROIs between myr-GCaMP5a and myr-R-GECO1 expressing astrocytes. See source data Figure 1—source data 1.
-
Figure 1—source data 1
Characterization of microdomain Ca2+ transients in Drosophila astrocytes.
- https://cdn.elifesciences.org/articles/58952/elife-58952-fig1-data1-v1.xlsx
Figure 1—figure supplement 1
Spontaneous astrocyte microdomain Ca2+ transients in larvae.
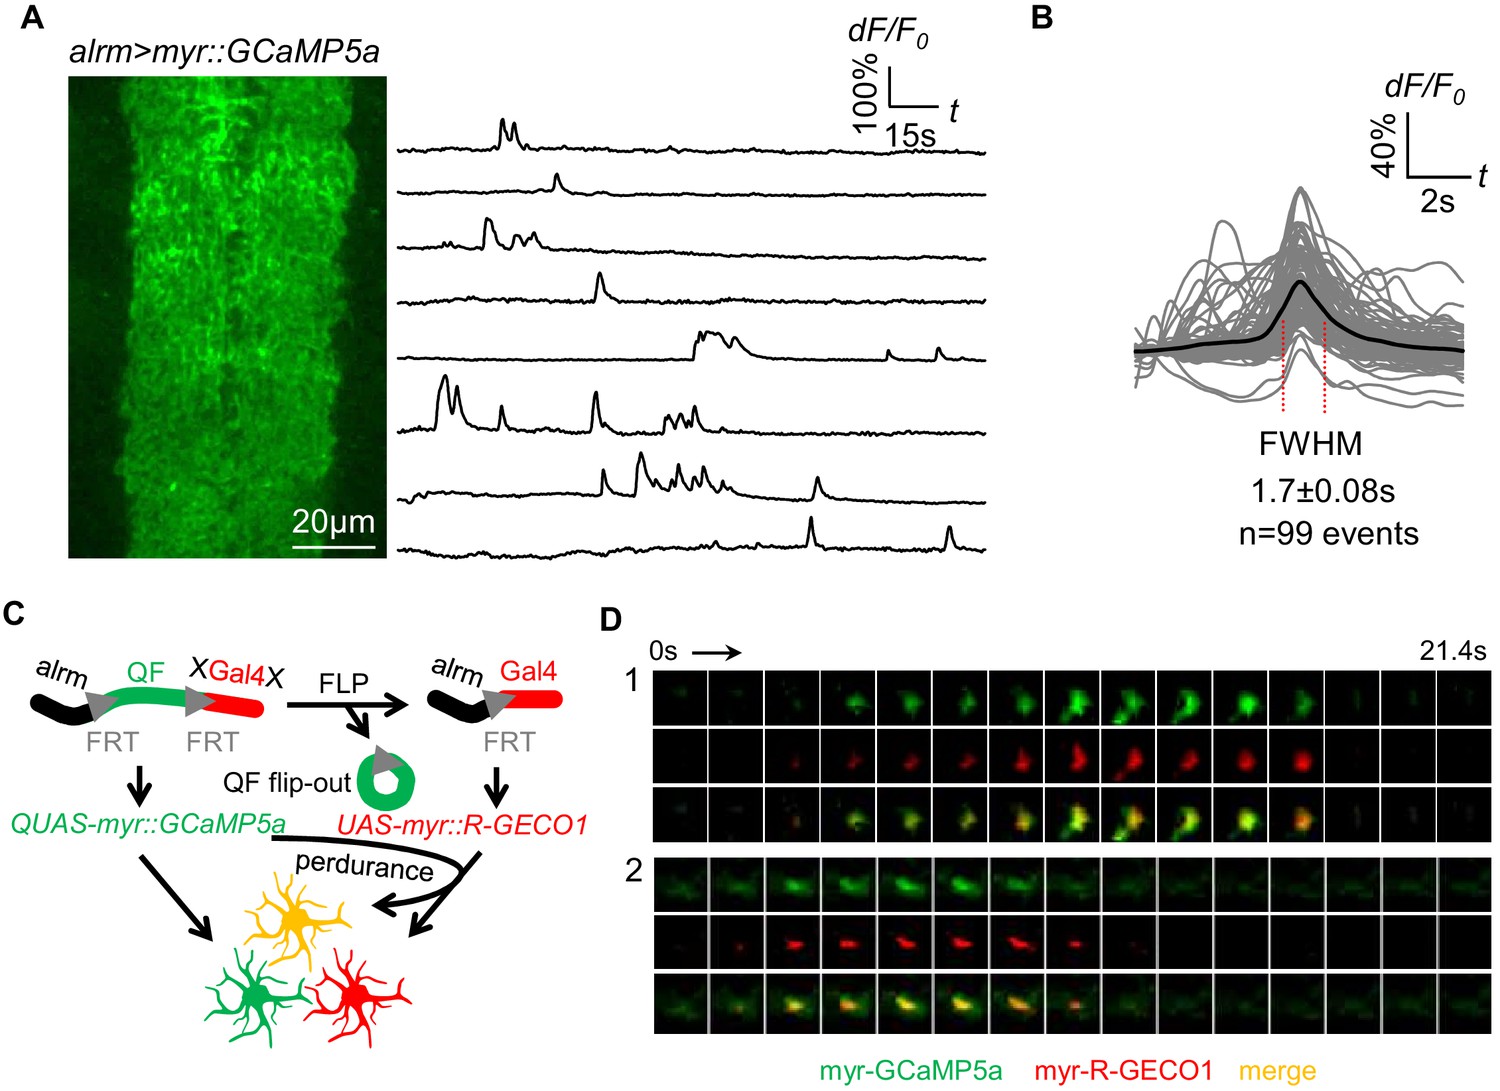
(A) Astrocytes expressing myr-GCaMP5a in the ventral nerve cord of 1st instar larvae. Traces of 8 representative microdomain Ca2+ transients. (B) Superimposed traces of individual microdomain Ca2+ transients and an average showing its full width at half maximum (FWHM, mean ± SD). (C) Schematic of inducing 2-color Ca2+ indicators mosaic expression in neighboring astrocytes (green, red, orange). (D) Two representative microdomain Ca2+ transients in dual-labeled myr-GCaMP5a/myr-R-GECO1 astrocytes. Note that both myr-GCaMP5a and myr-R-GECO1 exhibit similar dynamics in the same astrocyte.
Figure 1—video 1
Microdomain Ca2+ transients in acutely dissected CNS preparations from wildtype 3rd instar (L3) larva.
Figure 1—video 2
Microdomain Ca2+ transients in intact CNS preparation from wildtype 1st instar larva.
Figure 2 with 4 supplements
Astrocyte microdomain Ca2+ transients are genetically distinct from soma transients and require TrpML.
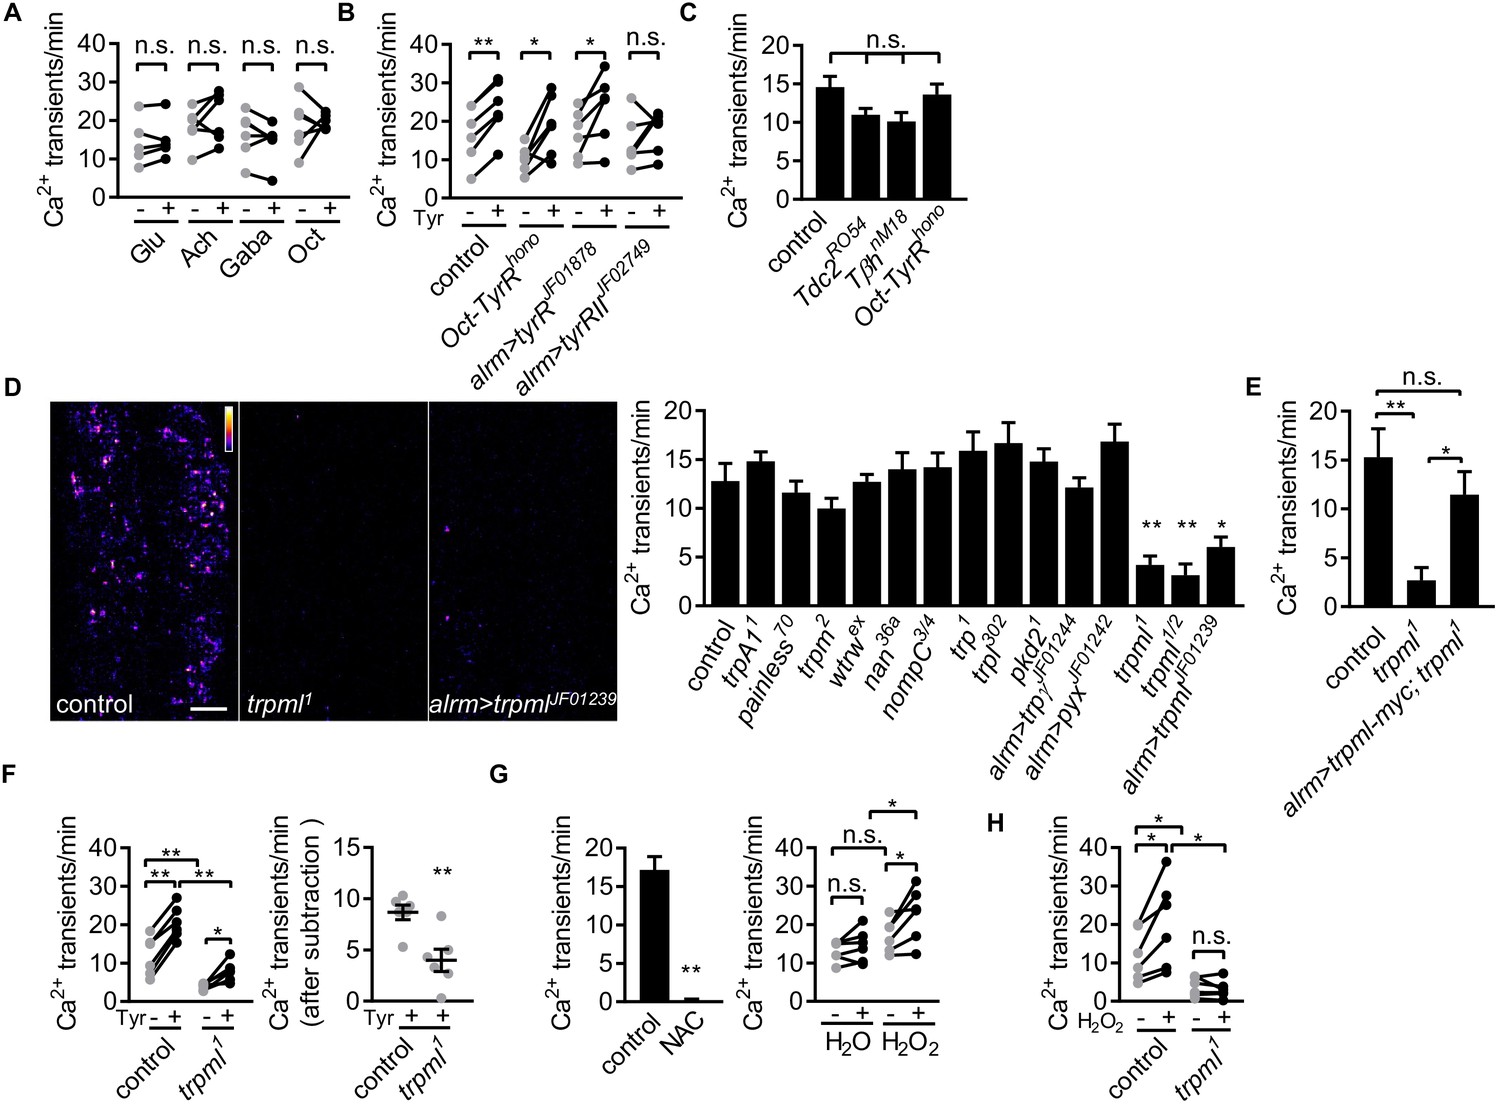
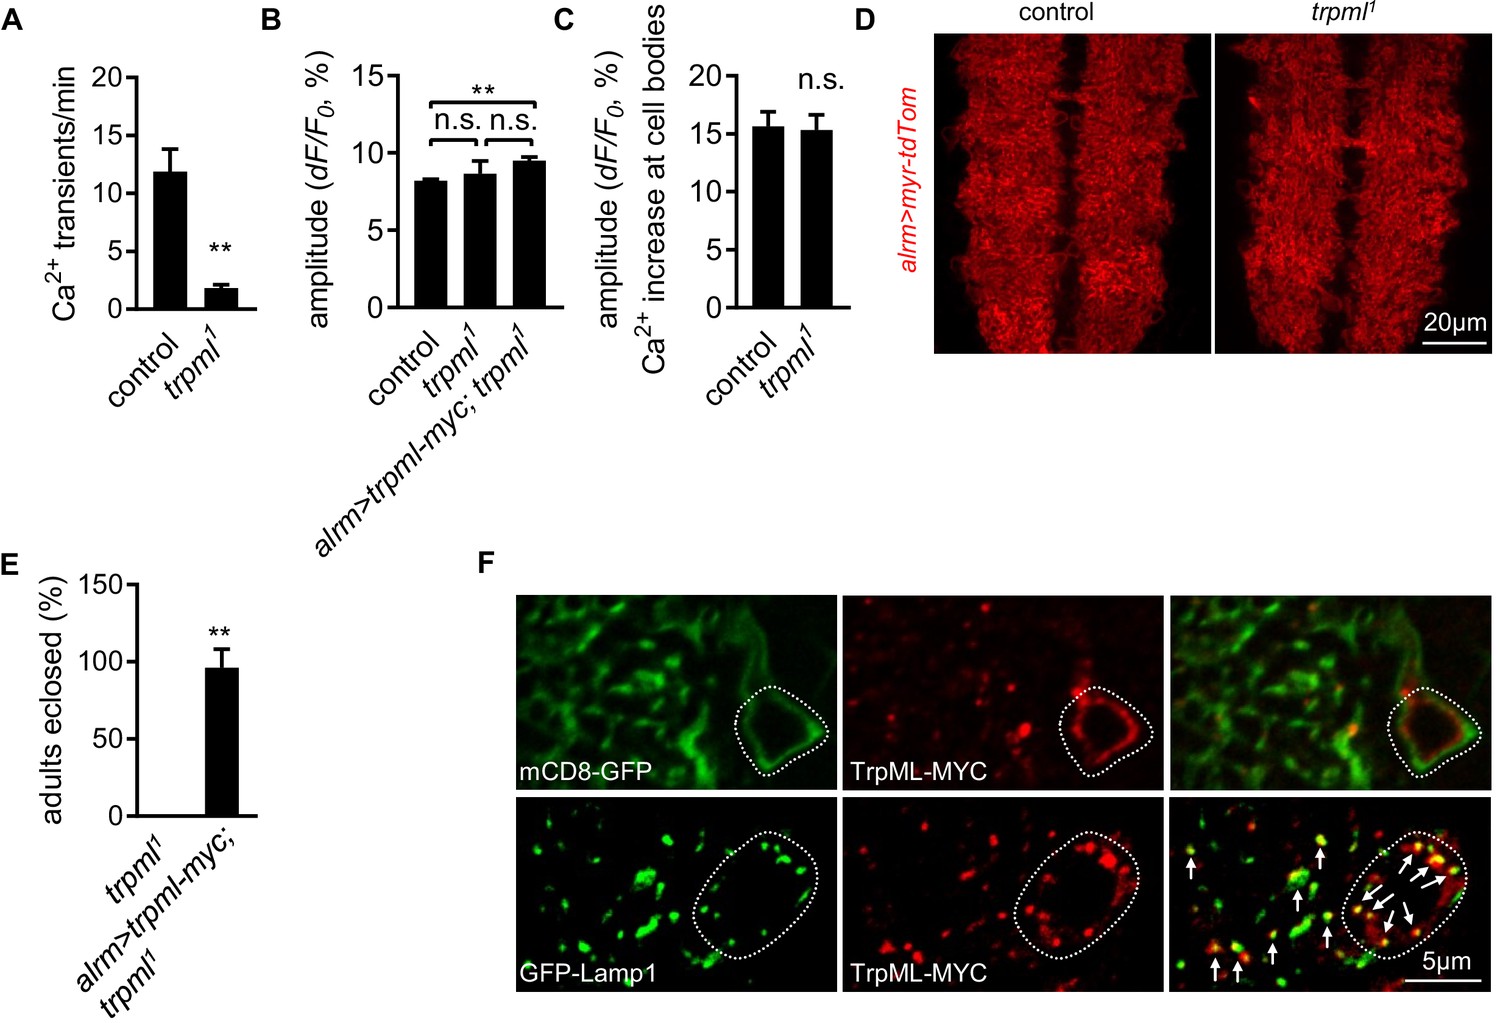
(A) Responses of microdomain Ca2+ transients (frequency) to glutamate (Glu), acetylcholine (Ach), γ-aminobutyric acid (Gaba), tyramine (Tyr), octopamine (Oct) in presence of tetrodotoxin. (B) Effect of tyramine on Ca2+ transient frequency in genotypes indicated. Oct-TyrR mutants, and astrocyte-specific (alrm>) expression of RNAis to TyrR or TyrRII (in A and B, n = 6, mean ± SEM, paired t-test). (C) Quantification of microdomain Ca2+ transients in Tdc2RO54, TβhnM18 or Oct-TyrRhono mutants (n = 6, mean ± SEM, one-way ANOVA). (D) Maximally projected astrocyte microdomain Ca2+ transients during 6 min in control, trpml1 mutants, and astrocyte-specific trpmlRNAi (in pseudocolor, grayscale values ranging from 0 to 255. scale bar, 20 µm). Quantification of microdomain Ca2+ transients in mutants (loss-of-function mutations or astrocyte-specific RNAi driven by alrm-Gal4) of genes encoding TRP family ion channels (n = 6, mean ± SEM, one-way ANOVA). (E) trpml-myc expression in astrocytes rescues microdomain Ca2+ transients in trpml1 mutants (n = 6, mean ± SEM, one-way ANOVA). (F) Effect of tyramine treatment on controls and trpml1 mutants (n = 6, mean ± SEM, one-way ANOVA. within groups, paired t-test). Right panel, increase in transients by tyramine (subtracting the basal included) in control and trpml1 mutants. (G) Application of the antioxidant N-acetyl cysteine (NAC) or H2O2 to the larval CNS. (for F and G n = 6, mean ± SEM, across groups, one-way ANOVA; within groups, paired t-test; -, + indicate pre-, post-delivery). (H) H2O2 application to control and trpml mutants shows that H2O2-dependent increases require TrpML. See source data Figure 2—source data 1.
-
Figure 2—source data 1
Astrocyte microdomain Ca2+ transients require TrpML.
- https://cdn.elifesciences.org/articles/58952/elife-58952-fig2-data1-v1.xlsx
-
Figure 2—source data 2
Astrocyte microdomain Ca2+ transients are genetically distinct from soma transients and require TrpML.
- https://cdn.elifesciences.org/articles/58952/elife-58952-fig2-data2-v1.xlsx
Figure 2—figure supplement 1
Astrocyte microdomain Ca2+ transients require TrpML.
(A) Quantification of microdomain Ca2+ transients in intact control and trpml1 mutant larvae at 1st instar stage (n = 6, mean ± SEM, t-test). (B) Average amplitude of microdomain Ca2+ transients in genotypes as indicated (n = 6, mean ± SEM, one-way ANOVA). (C) Tyramine- induced soma Ca2+ rise measured in GCaMP6s intensity (n = 70–73 cells from six larval CNS in each genotype, mean ± SEM, t-test). (D) Gross astrocyte morphology in control and trpml1. (E) trpml1 mutant larvae with trpml-myc expression in astrocytes survived to adulthood (n = 3, each n contains 20–40 larvae, mean ± SEM, t-test). (F) Double-labeling TrpML-MYC with a marker for cell membrane (mCD8-GFP) or lysosomes (GFP-Lamp1). Dash lines, cell bodies. Arrows, TrpML-MYC/GFP-Lamp1 colocalization. See source data Figure 2—source data 2.
Figure 2—video 1
Microdomain Ca2+ transients in acutely dissected CNS preparations from trpml mutant 3rd instar (L3) larva.
Figure 2—video 2
Microdomain Ca2+ transients pre/post H2O2 treatment in wild type 3rd instar (L3) larva.
Figure 2—video 3
Microdomain Ca2+ transients pre/post H2O2 treatment in trpml1 mutant 3rd instar (L3) larva.
Figure 3 with 2 supplements
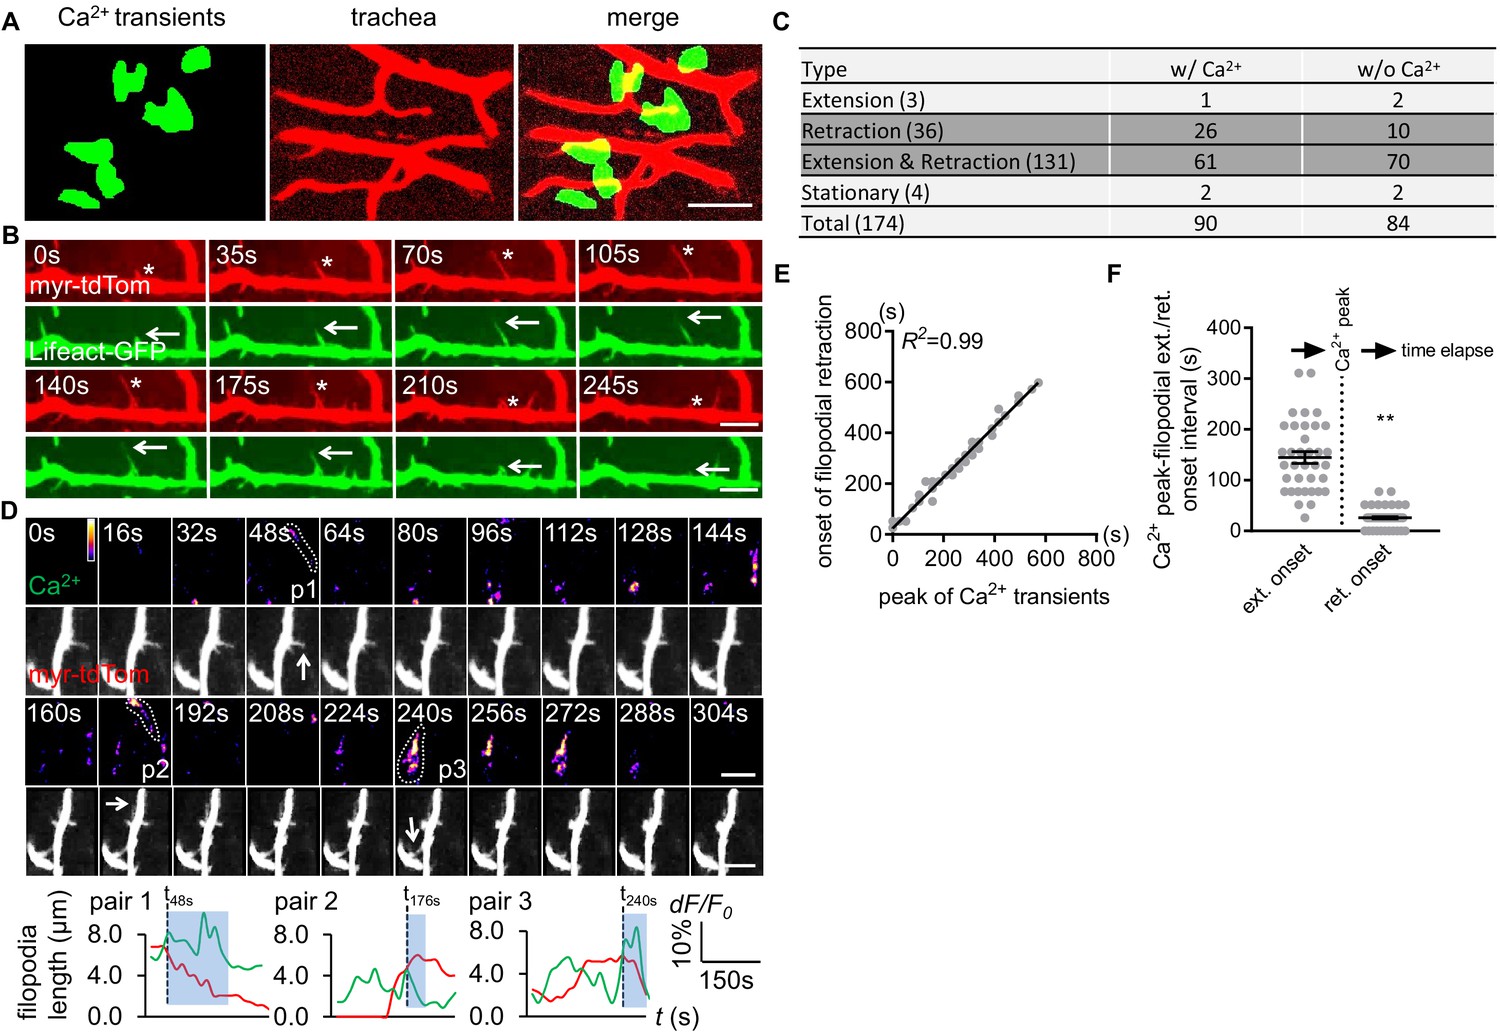
Astrocyte microdomain Ca2+ transients are associated with tracheal branches and precede retraction onset of tracheal filopodia.
(A) Astrocyte microdomain Ca2+ transients (green) overlap with tracheal branches (red) (scale bar, 20 µm). (B) Tracheal branches extend and retract F-actin containing filopodia. Asterisks, myr-tdTomato labeled filopodia; Arrows, Lifeact-GFP labeled F-actin (scale bar, 10 µm). (C) Categorization of tracheal filopodia across the entire population (extension, retraction, extension and retraction, or stationary). w/Ca2+ indicates tracheal filopodia extended into an astrocyte microdomain Ca2+ transient; w/o Ca2+ indicates no visible astrocyte microdomain Ca2+ transient was observed. (D) Time-lapse images and superimposed traces (green trace, myr-GCaMP5a in astrocytes expressed as dF/F0; red trace, myr-tdTomato in tracheal filopodia expressed as length) of 3 pairs (p1, p2, p3) of tracheal filopodia and astrocyte microdomain Ca2+ transients (in pseudocolor, grayscale values ranging from 0 to 255. scale bar, 10 µm). Vertical dash lines, timepoints when tracheal filopodia enter astrocyte Ca2+ microdomains. Blue boxes, time windows astrocyte microdomain Ca2+ transients persist after tracheal filopodia enter. Note that prior to entering the astrocyte Ca2+ microdomain, tracheal filopodial extension is not coupled to increases in astrocyte Ca2+, but after entry, increased astrocyte Ca2+ is strongly correlated with tracheal filopodial retraction. (E) Temporal correlation between onset of filopodia retraction and timing of peak astrocyte microdomain Ca2+ transients in seconds (n = 61 filopodia from Extension and Retraction pool). (F) Time intervals between astrocyte microdomain Ca2+ transients and tracheal filopodial extension versus retraction. See source data Figure 3—source data 1.
-
Figure 3—source data 1
Distribution of microtubules and F-actin in larval CNS tracheal elements.
- https://cdn.elifesciences.org/articles/58952/elife-58952-fig3-data1-v1.xlsx
-
Figure 3—source data 2
Astrocyte microdomain Ca2+ transients are associated with tracheal branches and precede retraction onset of tracheal filopodia. hea.
- https://cdn.elifesciences.org/articles/58952/elife-58952-fig3-data2-v1.xlsx
Figure 3—figure supplement 1
Distribution of microtubules and F-actin in larval CNS trachea.
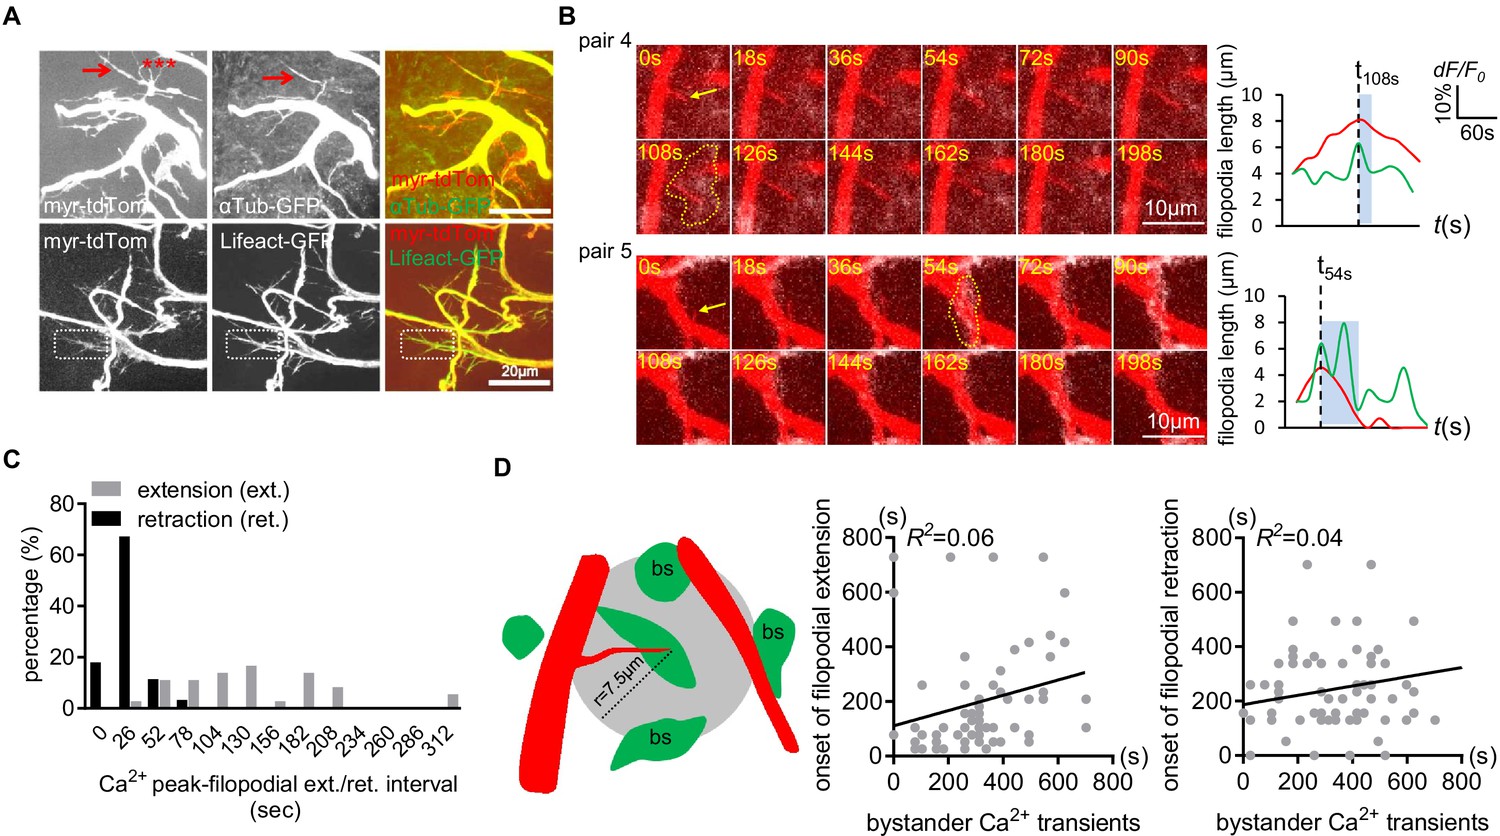
(A) Microtubules (aTub-GFP) were present in major tracheal branches and a few filopodia (arrow), but the majority of filopodia were unlabeled (asterisks). F-actin (Lifeact-GFP) was found to be present in all tracheal membrane protrusions (e.g. dash boxes). (B) Two more examples of the associated microdomain-tracheal filopodia retraction events. Note that tracheal filopodia (arrows) entered microdomains that reached their peak (dash lines). (C) Distribution of onset of filopodial extension or retraction events relative to astrocyte microdomain Ca2+ peaks. Compared to retraction onset, the onset of extension time is more broadly distributed relative to the peak astrocyte Ca2+ signal. (D) Tracheal dynamics do not correlate with astrocyte microdomain Ca2+ transients that occur at a distance. A circle with a 7.5 µm radius was drawn around filopodial tips, and we attempted to correlate the onset of tracheal extension or retraction with astrocyte Ca2+ signals. We found a lack of correlation. See source data Figure 3—figure supplement 1, Figure 3—source data 2.
Figure 3—video 1
Microdomain Ca2+ transients and tracheal filopodial dynamics in wildtype L3 CNS preparation, related to Figure 3D.
Figure 4 with 1 supplement
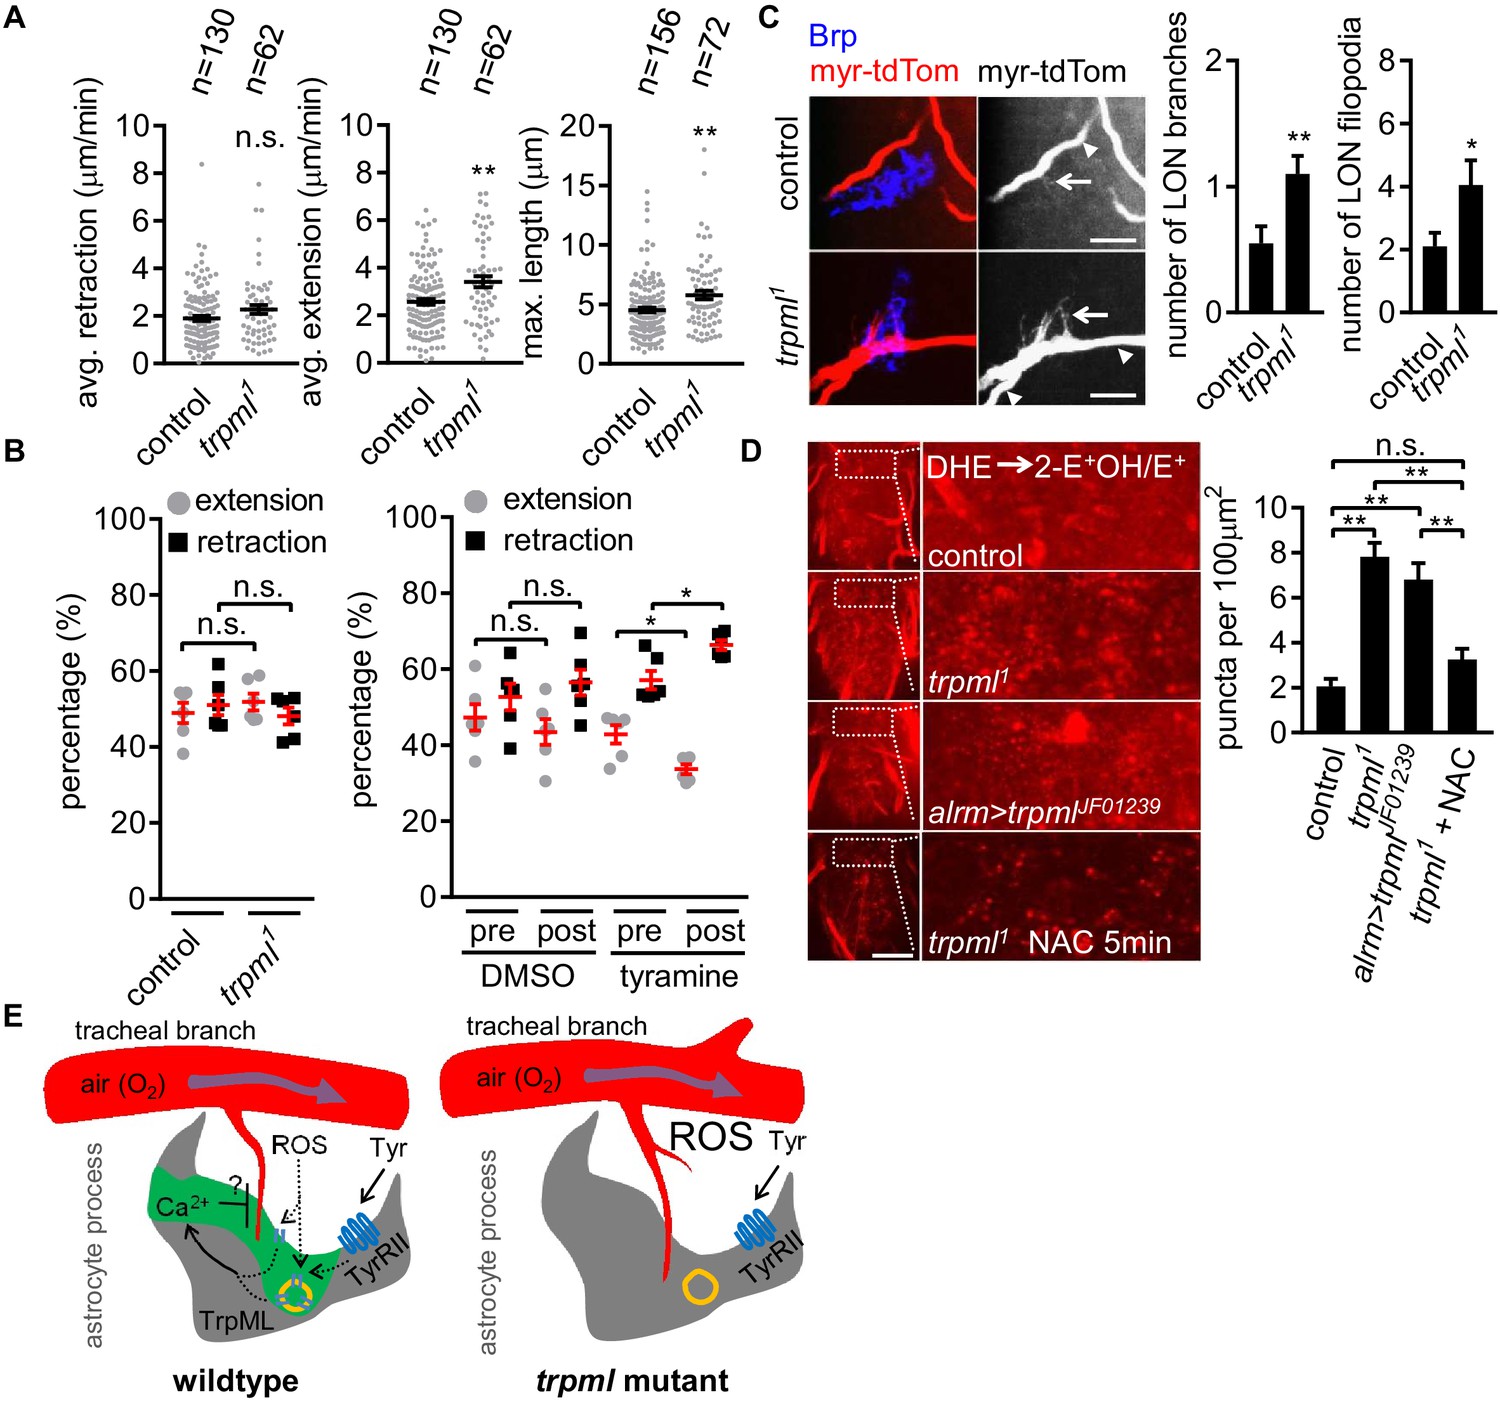
Loss of TrpML leads to overgrowth of trachea and excessive reactive oxygen species (ROS) in larval CNS.
(A) Quantification of average filopodial retraction and extension rates, and maximal length of tracheal filopodia (n indicate the number of filopodia randomly selected from 6 to 8 larval CNS, mean ± SEM, t-test). (B) Comparison of changes in extension/retraction ratios after bath application of tyramine in control and trpml1 mutants (n = 6, mean ± SEM, one-way ANOVA across groups; within groups, paired t-test). (C) In control, one tracheal branch (labeled with btl >myr::tdTom, arrowhead) near the LON (Brp, blue) grows short filopodia (arrows) into the LON. In trpml1, two transverse tracheal branches grow near the LON, and they exhibit increases in filopodial extension into the LON (n = 20, mean ± SEM, t-test. scale bar, 10 µm). (D) Dihydroethidium (DHE) staining in indicated genotypes. ROS-oxidized DHE forms 2-hydroxyethidium (2-OH-E+) and ethidium (E+). Quantifications to right (n = 6, mean ± SEM, t-test. scale bar, 50 µm). NAC was added 5 min prior to DHE incubation. (E) Proposed model. Astrocyte microdomain Ca2+ transients are modulated by reactive oxygen species (ROS) and TrpML. Astrocyte Ca2+ signaling can facilitate filopodial retraction if a tracheal filopodium enters a microdomain. Cell cortex underlying membrane or lysosomal localization of TrpML regulates Ca2+ signaling in response to ROS, presumably due to increased O2 delivery, to generate astrocyte microdomain Ca2+ transients. Tyramine induces increased microdomain Ca2+ transients via TrpML. Loss of astrocyte microdomains resulted from trpml mutation leads to overgrown trachea including filopodia, and increased ROS. See source data Figure 4—source data 1.
-
Figure 4—source data 1
Loss of TrpML leads to overgrowth of trachea and excessive reactive oxygen species (ROS) in larval CNS.
- https://cdn.elifesciences.org/articles/58952/elife-58952-fig4-data1-v1.xlsx
-
Figure 4—source data 2
Tracheal branches overgrow in the larval ventral nerve cord of trpml1 mutants.
- https://cdn.elifesciences.org/articles/58952/elife-58952-fig4-data2-v1.xlsx
Figure 4—figure supplement 1
Tracheal branches overgrow in the larval ventral nerve cord of trpml1 mutants.
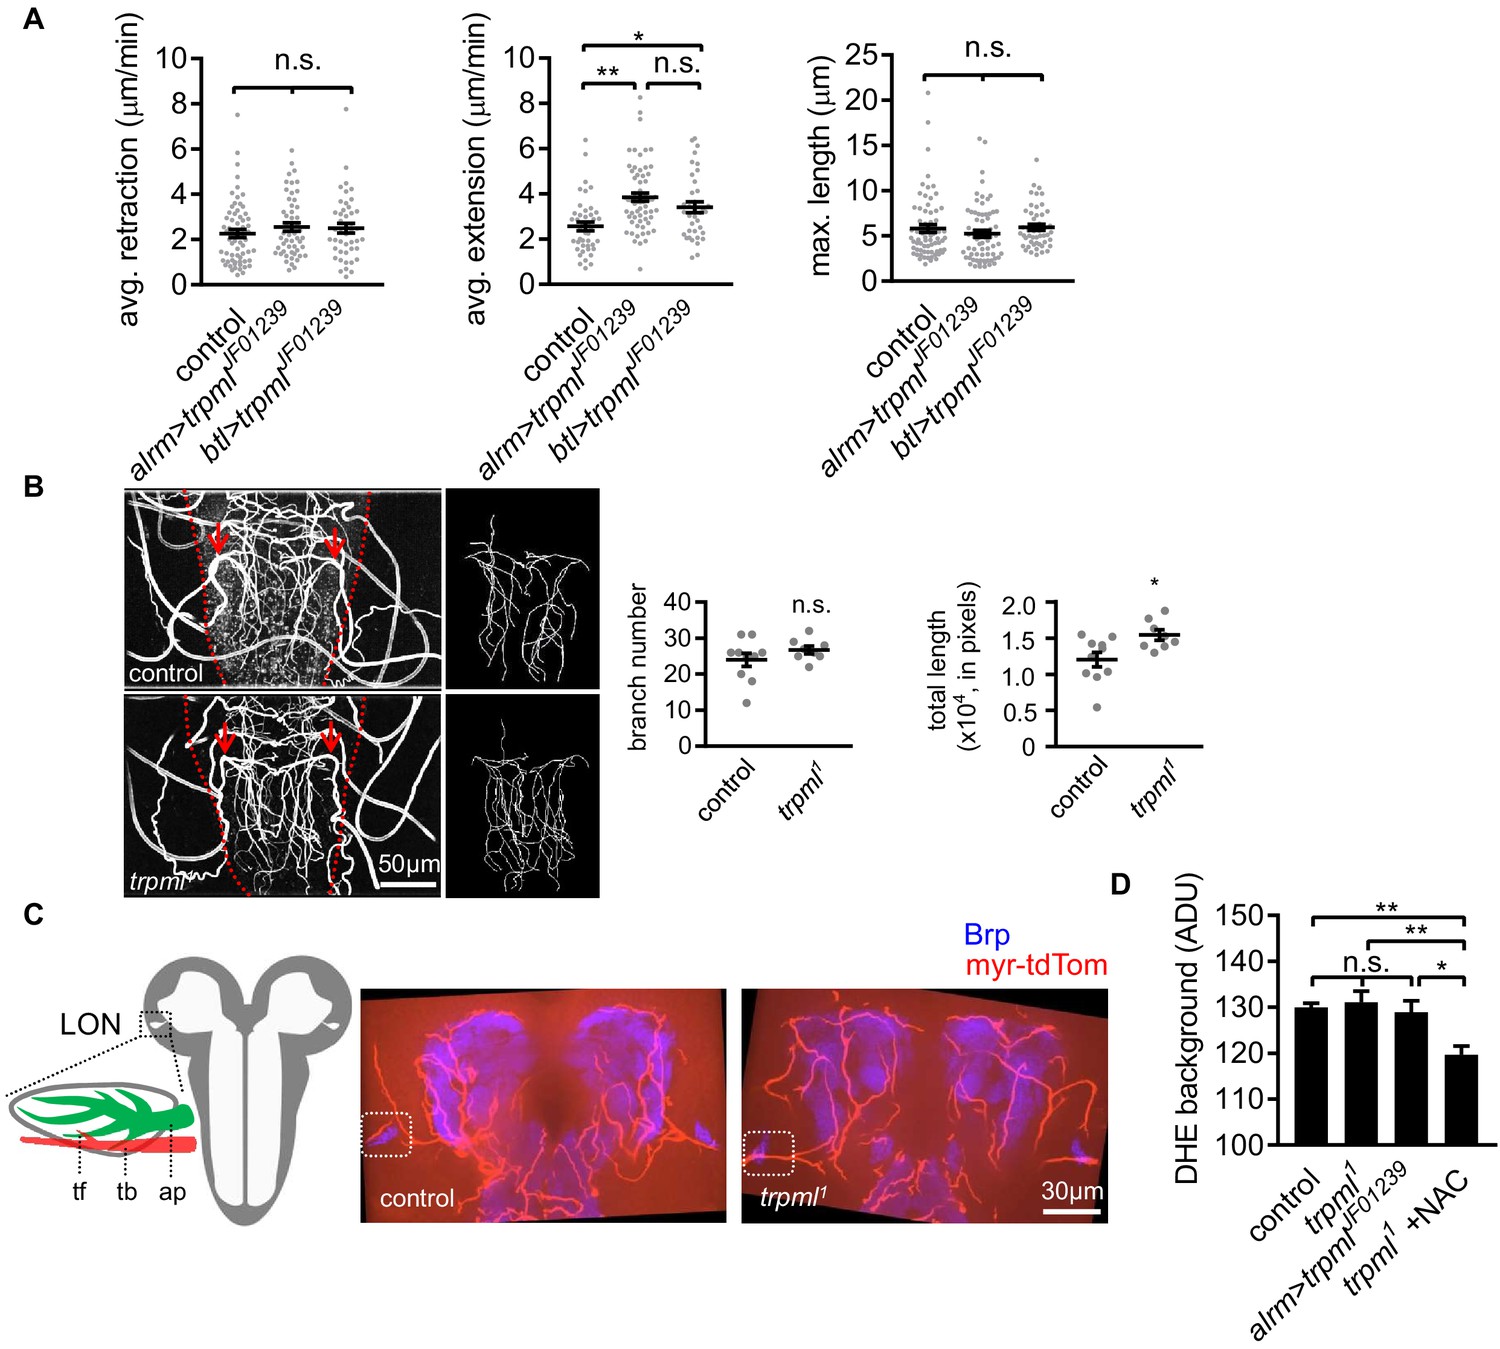
(A) Quantification of average filopodial retraction and extension rates, and maximal length of tracheal filopodia. Trachea is labeled using btl-LexA >LexAop-rCD2RFP (n = 37–69 filopodia randomly selected from six larval CNS in each genotype indicated, mean ± SEM, one-way ANOVA). (B) Tracheal autofluorescence when illuminated with 408 nm laser was used to trace individual branches sprouting from the uniquely identifiable pair of mpgTr (red arrows). The ventral nerve cords are outlined with red dash lines (n = 8–10, mean ± SEM, t-test). (C) Schematic of larval optic neuropil (LON). ap, astrocyte process; tb, tracheal branch; tf, tracheal filopodium. Representative confocal images of larval brains showing the position of LONs (dash boxes). Image represents an 8.1 µm z-projection, covering brain neuropil and LONs (blue) and associated tracheal branches/filopodia. LONs zoomed in Figure 4C. (D) Background fluorescence intensity in DHE staining (n = 6, mean ± SEM, one-way ANOVA). See source data Figure 4—figure supplement 1. Figure 4—source data 1.
Author response image 1
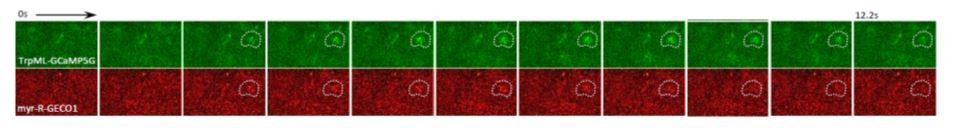
Live imaging of TrpML-GCaMP5G and myr-R-GECO1 in astrocytes in 3rd instar larval brain.
Note the overlap of signals (dotted circle) arguing for some level of TrpML signaling at the membrane.
Tables
Key resources table
| Reagent type (species) or resource | Designation | Source or reference | Identifiers | Additional information |
|---|---|---|---|---|
| Genetic reagent (D. melanogaster) | trpml1 | Bloomington Stock Center | BDSC: 28992 | FlyBase symbol: w1118; Trpml1 |
| Genetic reagent (D. melanogaster) | trpml2 | Bloomington Stock Center | BDSC: 42230 | FlyBase symbol: w*; Trpml2/TM6B, Tb1 |
| Genetic reagent (D. melanogaster) | trpmlJF01239 | Bloomington Stock Center | BDSC: 31294 | FlyBase symbol: y1 v1; P{TRiP.JF01239}attP2 |
| Genetic reagent (D. melanogaster) | tyrRJF01878 | Bloomington Stock Center | BDSC: 25857 | FlyBase symbol: y1 v1; P{TRiP.JF01878}attP2 |
| Genetic reagent (D. melanogaster) | tyrRIIJF02749 | Bloomington Stock Center | BDSC: 27670 | FlyBase symbol: y1 v1; P{TRiP.JF02749}attP2 |
| Genetic reagent (D. melanogaster) | trpA11 | Bloomington Stock Center | BDSC: 36342 | FlyBase symbol: TI{TI}TrpA11 |
| Genetic reagent (D. melanogaster) | trpm2 | Bloomington Stock Center | BDSC: 35527 | FlyBase symbol: w*; TI{TI}Trpm2/CyO |
| Genetic reagent (D. melanogaster) | nompC3 | Bloomington Stock Center | BDSC: 42258 | FlyBase symbol: nompC3 cn1 bw1/CyO |
| Genetic reagent (D. melanogaster) | trp1 | Bloomington Stock Center | BDSC: 5692 | FlyBase symbol: trp1 |
| Genetic reagent (D. melanogaster) | trpl302 | Bloomington Stock Center | BDSC: 31433 | FlyBase symbol: cn1 trpl302 bw1 |
| Genetic reagent (D. melanogaster) | pkd21 | Bloomington Stock Center | BDSC: 24495 | FlyBase symbol: w1118; Pkd21/CyO |
| Genetic reagent (D. melanogaster) | trpγJF01244 | Bloomington Stock Center | BDSC: 31299 | FlyBase symbol: y1 v1; P{TRiP.JF01244}attP2 |
| Genetic reagent (D. melanogaster) | pyxJF01242 | Bloomington Stock Center | BDSC: 31297 | FlyBase symbol: y1 v1; P{TRiP.JF01242}attP2 |
| Genetic reagent (D. melanogaster) | btl-Gal4 | Bloomington Stock Center | BDSC: 8807 | FlyBase symbol: W*; P{GAL4-btl.S}2, P{UASp-Act5C.T:GFP}2/CyO, P{lacZ.w+}276. UASp-Act5C.T:GFP was replaced with 10XUAS-IVS-myr::tdTomato by recombination in this paper. |
| Genetic reagent (D. melanogaster) | UAS-Lifeact-GFP | Bloomington Stock Center | BDSC: 57326 | FlyBase symbol: w*; P{UAS-Lifeact.GFP.W}3 |
| Genetic reagent (D. melanogaster) | UASp-αTub-GFP | Bloomington Stock Center | BDSC: 7373 | FlyBase symbol: w*; P{UASp-GFPS65C-αTub84B}3/TM3, Sb1 |
| Genetic reagent (D. melanogaster) | 10XUAS-IVS-myr::tdTomato | Bloomington Stock Center | BDSC: 32222 | FlyBase symbol: w*; P{10XUAS-IVS-myr::tdTomato}attP40 |
| Genetic reagent (D. melanogaster) | UAS-trpml-myc | Bloomington Stock Center | BDSC: 57372 | FlyBase symbol: w*; P{UAS-Trpml.MYC}3, Trpml1/TM6B, Tb1 |
| Genetic reagent (D. melanogaster) | 5XUAS-trpml-GCaMP5g | Bloomington Stock Center | BDSC: 80066 | FlyBase symbol: y1 w*; PBac{5XUAS-Trpml::GCaMP5G}VK00033 |
| Genetic reagent (D. melanogaster) | UAS-GFP-Lamp1 | Bloomington Stock Center | BDSC: 42714 | FlyBase symbol: w*; P{UAS-GFP-LAMP}2; P{nSyb-GAL4.S}3/T(2;3)TSTL, CyO: TM6B, Tb1 |
| Genetic reagent (D. melanogaster) | Oct-TyrRhono | Kyoto Stock Center (DGRC) | BDSC: 109038 | FlyBase symbol: w1118; P{lwB}Oct-TyrRhono |
| Genetic reagent (D. melanogaster) | btl-LexA | Roy et al., 2014 | ||
| Genetic reagent (D. melanogaster) | nompC4 | Walker et al., 2000 | ||
| Genetic reagent (D. melanogaster) | painless70 | Im et al., 2015 | ||
| Genetic reagent (D. melanogaster) | nan36a | Kim et al., 2003 | ||
| Genetic reagent (D. melanogaster) | wtrwex | Kim et al., 2010 | ||
| Genetic reagent (D. melanogaster) | Tdc2RO54 | Cole et al., 2005 | ||
| Genetic reagent (D. melanogaster) | TβhnM18 | Monastirioti et al., 1996 | ||
| Genetic reagent (D. melanogaster) | alrm-Gal4 | Doherty et al., 2009 | ||
| Genetic reagent (D. melanogaster) | alrm > QF > Gal4 | Stork et al., 2014 | ||
| Genetic reagent (D. melanogaster) | repo-FLPase | Stork et al., 2014 | ||
| Genetic reagent (D. melanogaster) | alrm-LexA::GAD | Stork et al., 2014 | ||
| Genetic reagent (D. melanogaster) | UAS-myr::GCaMP5a | This paper | transgenic flies harboring UAS-myr::GCaMP5a | |
| Genetic reagent (D. melanogaster) | UAS-myr::R-GECO1 | This paper | transgenic flies harboring UAS-myr::R-GECO1 | |
| Genetic reagent (D. melanogaster) | QUAS-myr::GCaMP5a | This paper | transgenic flies harboring QUAS-myr::GCaMP5a | |
| Genetic reagent (D. melanogaster) | 13XLexAop2-myr::GCaMP6s | This paper | transgenic flies harboring 13XLexAop2-myr::GCaMP6s | |
| Antibody | mouse monoclonal anti-Brp | DSHB | Cat# nc82 | 1:50 |
| Antibody | mouse monoclonal anti-c-Myc | DSHB | Cat# 9E10 | 1:100 |
| Chemical compound, drug | tetrodotoxin | Tocris | Cat# 1078 | 1 µM |
| Chemical compound, drug | lanthanum chloride | Sigma-Aldrich | Cat# 211605 | 0.1 mM, 1 mM |
| Chemical compound, drug | acetylcholine | Sigma-Aldrich | Cat# A6625 | 2.5 mM |
| Chemical compound, drug | γ-aminobutyric acid (GABA) | Sigma-Aldrich | Cat# A2129 | 2.5 mM |
| Chemical compound, drug | glutamate | Sigma-Aldrich | Cat# G1626 | 2.5 mM |
| Chemical compound, drug | tyramine | Sigma-Aldrich | Cat# T90344 | 2.5 mM |
| Chemical compound, drug | octopamine | Sigma-Aldrich | Cat# O0250 | 2.5 mM |
| Chemical compound, drug | N-acetyl cysteine | Sigma-Aldrich | Cat# A7250 | 2.5 mM |
| Chemical compound, drug | hydrogen peroxide | Sigma-Aldrich | Cat# H1009 | 0.1 mM |
| Chemical compound, drug | halocarbon oil 27 | Sigma-Aldrich | Cat# H8773 | |
| Chemical compound, drug | dihydroethidium (DHE) | Sigma-Aldrich | Cat# 309800 | 30 µM |
| Recombinant DNA reagent | pUAST-myr::GCaMP5a | This paper | Fly germline transformation plasmid | GCaMP5a DNA with myristoylation sequence fused at the 5’ end |
| Recombinant DNA reagent | pQUAST-myr::GCaMP5a | This paper | Fly germline transformation plasmid | GCaMP5a DNA with myristoylation sequence fused at the 5’ end |
| Recombinant DNA reagent | pUAST-myr::R-GECO1 | This paper | Fly germline transformation plasmid | R-GECO1 DNA with myristoylation sequence fused at the 5’ end |
| Recombinant DNA reagent | pJFRC19-13XLexAop2-IVS-myr::GCaMP6s | This paper | Fly germline transformation plasmid | GCaMP6s DNA with myristoylation sequence fused at the 5’ end |
| Software, algorithm | Volocity | PerkinElmer, Inc | http://www.perkinelmer.com/lab-products-and-services/cellular-imaging/performing-advanced-image-data-analysis.html | |
| Software, algorithm | Slidebook | Intelligent Imaging Innovations, Inc | https://www.intelligent-imaging.com/slidebook | |
| Software, algorithm | Fiji | Schindelin et al., 2012 | https://fiji.sc/ | |
| Software, algorithm | Graphpad Prism 7 | GraphPad software | https://www.graphpad.com/scientific-software/prism/ | |
| Software, algorithm | Igor Pro | WaveMetrics, Inc | https://www.wavemetrics.com/products/igorpro | |
| Software, algorithm | AQuA | Wang et al., 2019 | https://github.com/yu-lab-vt/AQuA#fiji-plugin; Wang, 2019 |
Additional files
-
Source data 1
Manual VS AQuA.
Manual method and AQuA identify comparable amount of microdomain Ca2+ transients.
- https://cdn.elifesciences.org/articles/58952/elife-58952-data1-v1.xlsx
-
Transparent reporting form
- https://cdn.elifesciences.org/articles/58952/elife-58952-transrepform-v1.docx
Download links
A two-part list of links to download the article, or parts of the article, in various formats.
Downloads (link to download the article as PDF)
Open citations (links to open the citations from this article in various online reference manager services)
Cite this article (links to download the citations from this article in formats compatible with various reference manager tools)
TrpML-mediated astrocyte microdomain Ca2+ transients regulate astrocyte–tracheal interactions
eLife 9:e58952.
https://doi.org/10.7554/eLife.58952


