Diffusion vs. direct transport in the precision of morphogen readout
- Department of Physics and Astronomy, Purdue University, United States
- Department of Physics and Astronomy, University of Pennsylvania, United States
- Department of Physics and Astronomy, University of Pittsburgh, United States
Figures
Figure 1
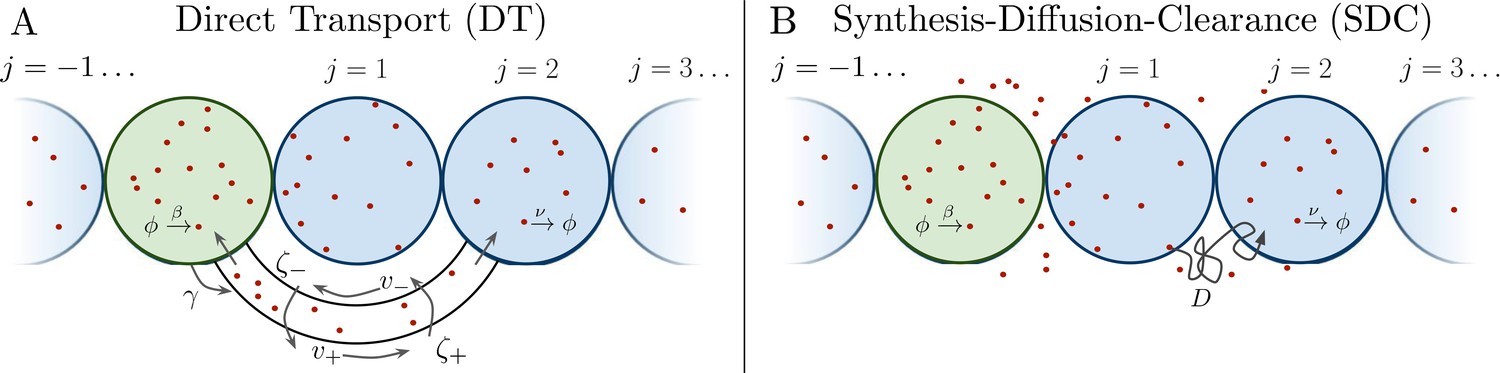
Source cell (green) produces morphogen which is delivered to N target cells (blue) on either side via (A) direct transport (DT) or (B) synthesis-diffusion-clearance (SDC).
Figure 2
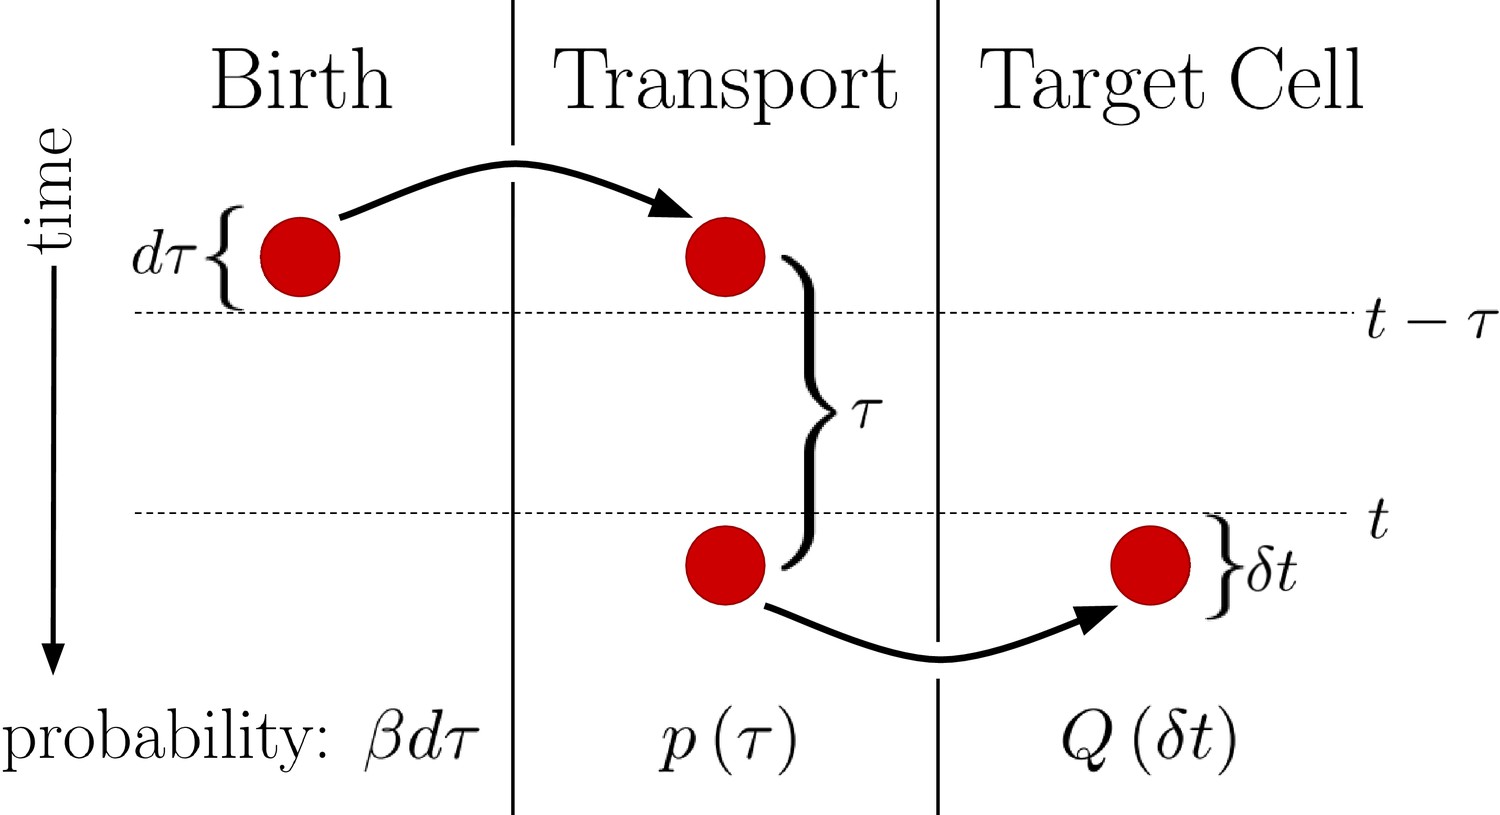
Diagram outlining a generalized version of the DT model.
Between times and a molecule is produced with probability . This molecule then undergoes a transport process over a time with probability density . Finally, the molecule is deposited into the target cell at the end of the transport process. Integrating over all possible values of then yields , the probability of the molecule entering the target cell between times t and .
Figure 3
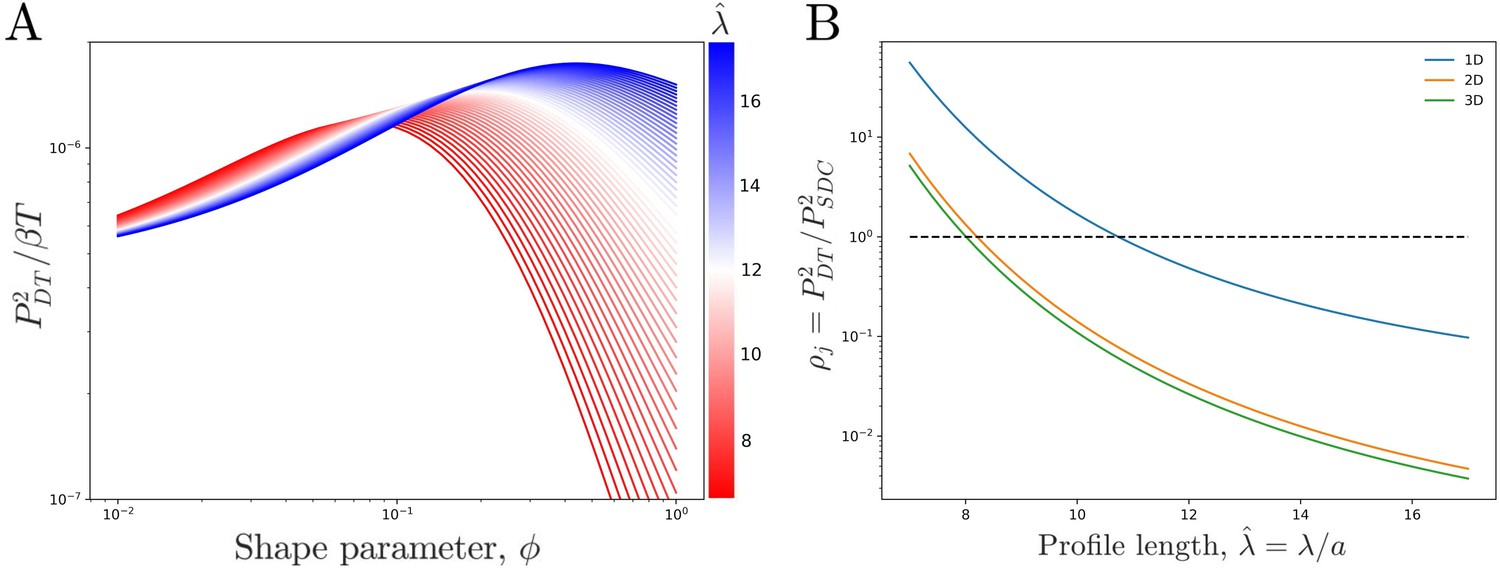
Comparing theoretical DT precision to SDC precision for a single cell.
(A) DT precision shows a maximum as a function of shape parameter for any value of the profile lengthscale. (B) Ratio of DT to SDC precision shows a crossover () as a function of profile lengthscale for 1D, 2D, and 3D geometries. Here is the central cell of target cells. For each value of the value of which maximizes precision in the DT model () as seen in A is used.
Figure 4
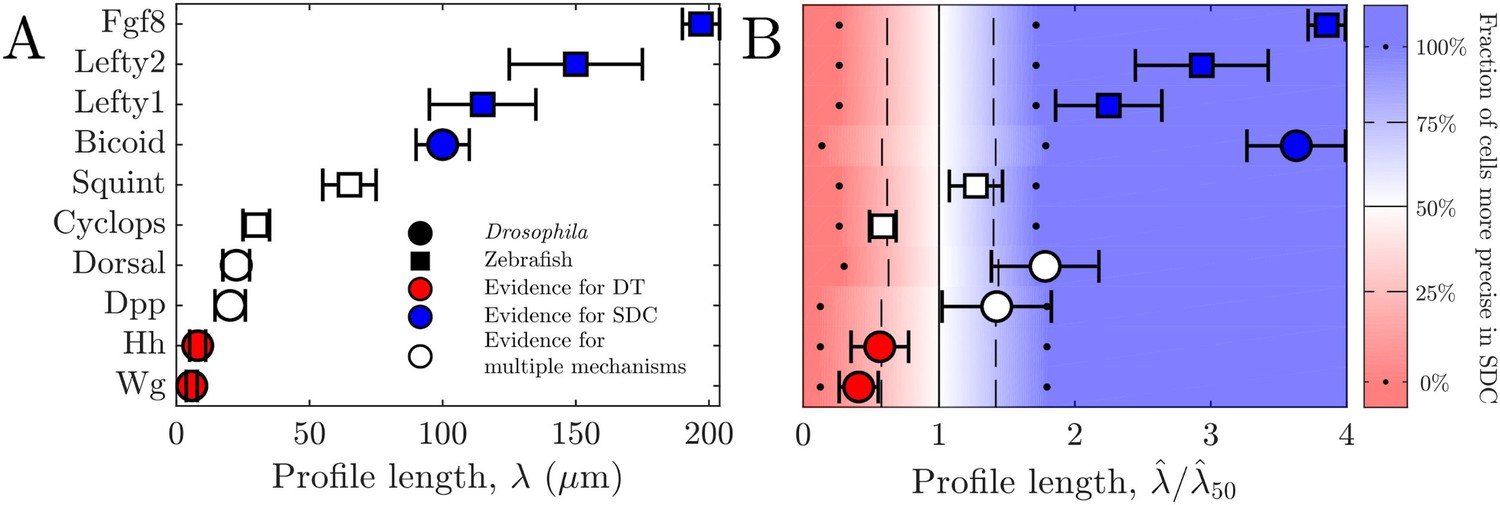
Comparing theory and experiment.
(A) values for morphogens estimated from experiments, colored by whether experiments support a DT (red), SDC (blue), or multiple mechanisms (white). (B) Data from A overlaid with color from theory using values of a and N estimated from experiments. Color indicates percentage of cells for which SDC is predicted to be more precise with dots signifying 0% and 100%, dashed lines signifying 25% and 75%, and solid lines signifying 50%. The axis is normalized by , the value of at which 50% of cells are more precise in SDC.
Additional files
Download links
A two-part list of links to download the article, or parts of the article, in various formats.
Downloads (link to download the article as PDF)
Open citations (links to open the citations from this article in various online reference manager services)
Cite this article (links to download the citations from this article in formats compatible with various reference manager tools)
Diffusion vs. direct transport in the precision of morphogen readout
eLife 9:e58981.
https://doi.org/10.7554/eLife.58981


