Expansion of the circadian transcriptome in Brassica rapa and genome-wide diversification of paralog expression patterns
- Department of Plant and Microbial Biology, University of Minnesota, United States
- Crop and Soil Sciences, North Carolina State University, United States
- Department of Biological Sciences, Dartmouth College, United States
- Donald Danforth Plant Science Center, United States
Figures
Figure 1 with 1 supplement
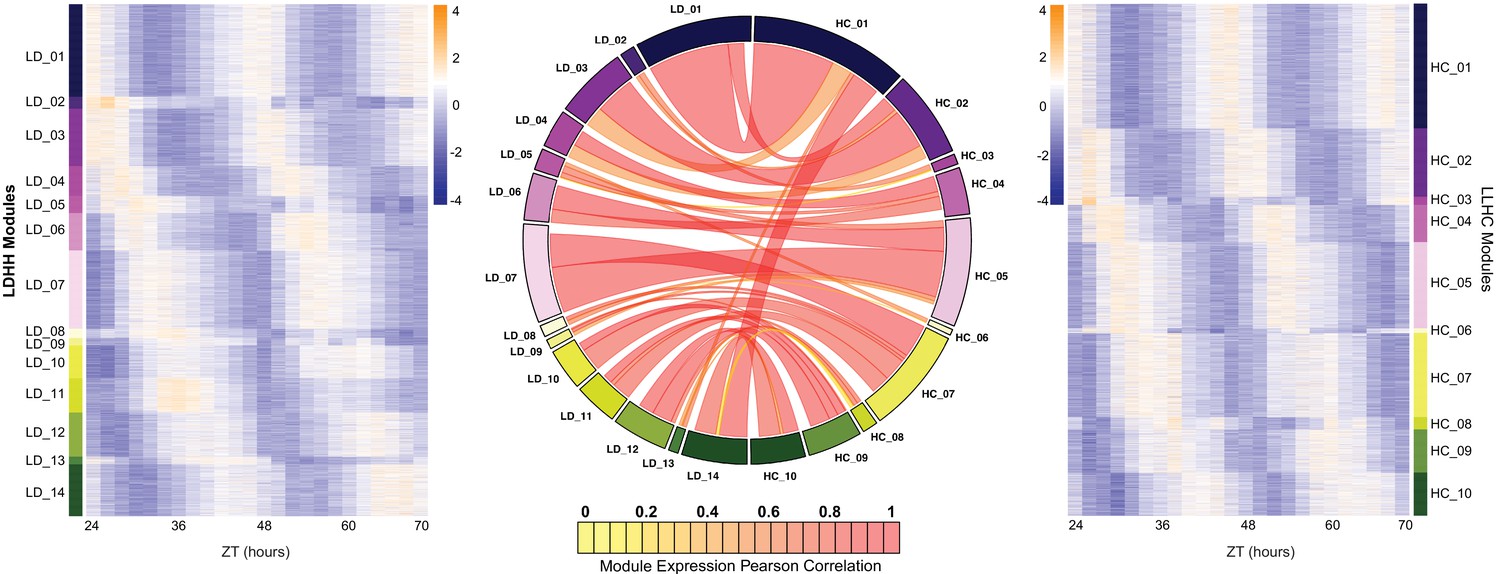
Expansion of the circadian transcriptome in B. rapa.
Co-expression networks were generated for the LD and HC datasets (named for the entraining conditions; all samples were from plants transferred to constant light and temperature [LLHH]). The 14 modules from the LD dataset are shown in the heatmap on the left and the 10 modules from the HC dataset are shown on the right. Heatmaps were generated using the log2 transformed FKPM expression data. The low expression level is in purple and the high expression level is in orange. The circos plot in the middle shows the overlap in genes between the LD and HC modules. Modules are numbered based on their phase starting at the beginning of the day (ZT24). The width of the ribbon signifies the number of genes in common between the connected modules and the color represents the Pearson correlation coefficient between the eigengenes of the two datasets. The high correlations (median of 0.73) indicates no or little phase difference between LD and HC entrainment for most genes.
Figure 1—figure supplement 1
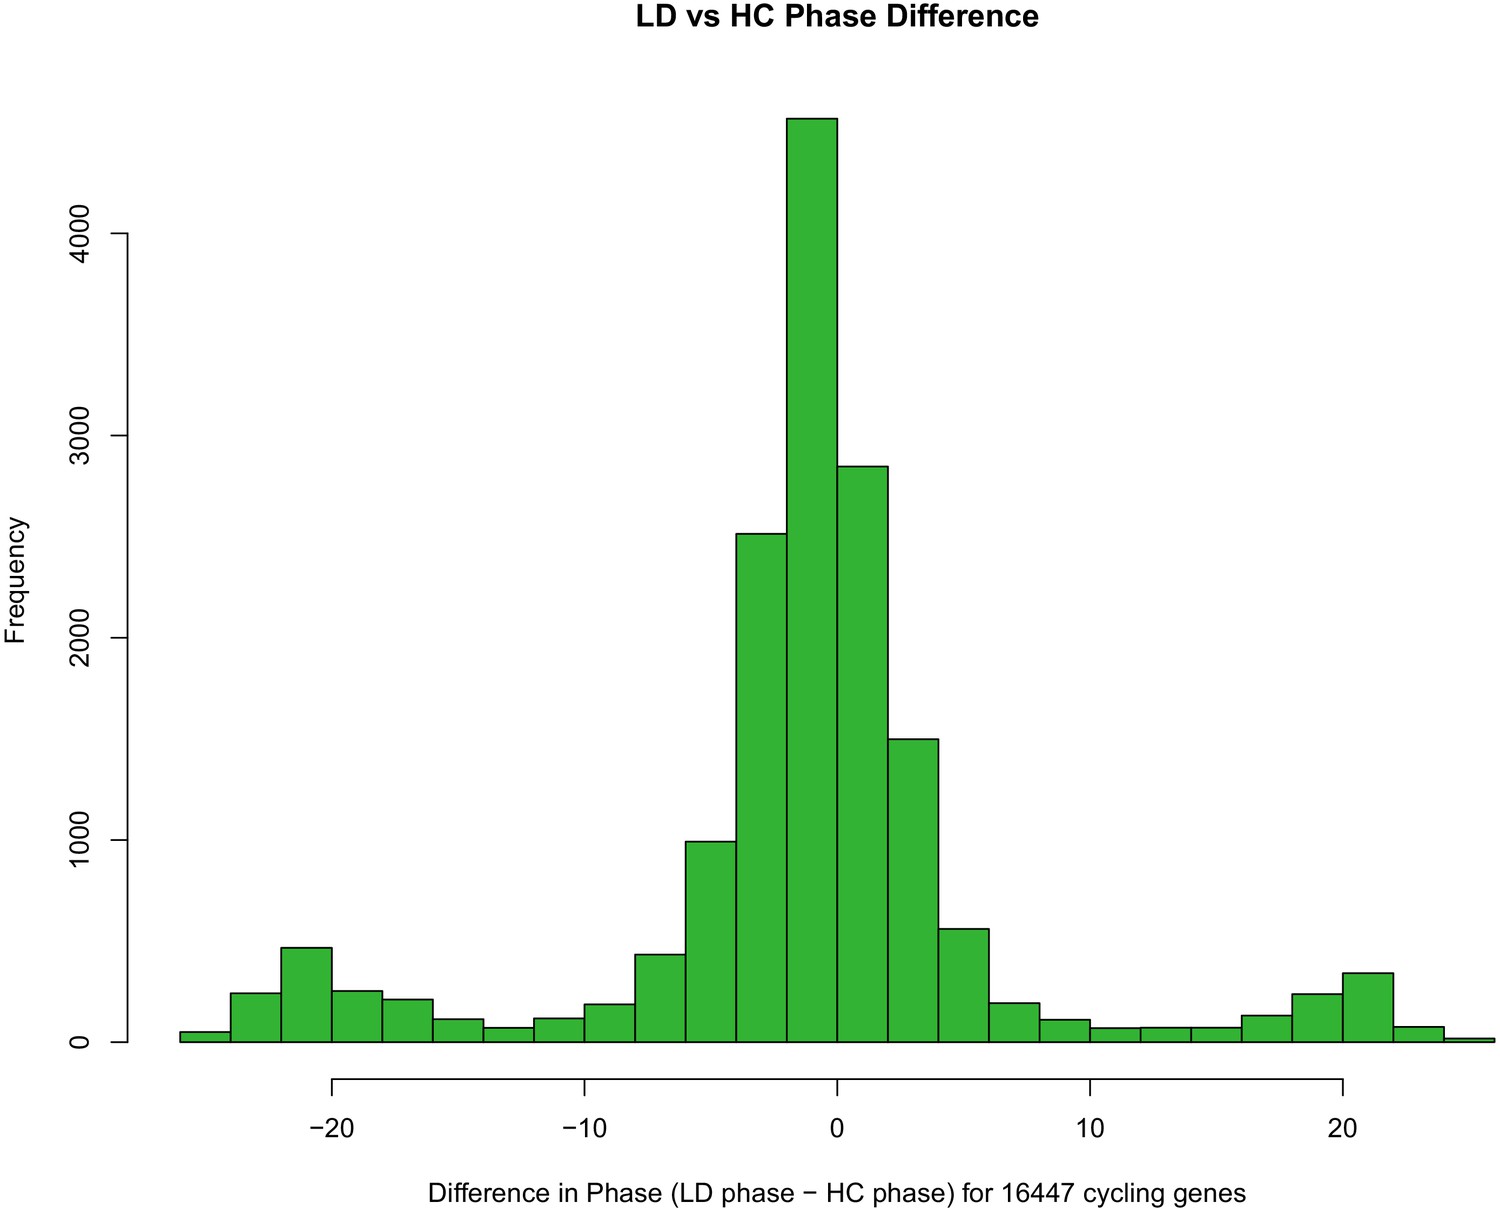
Phase difference of genes between LD and HC entrainment.
Distribution of differences in circadian phase (time of peak expression) for 16,447 genes following entrainment to LD (cycling light and constant temperature) versus HC (constant light with cycling temperature) entrainment conditions. The histogram plots the LD phase - HC phase difference for the set of genes exhibiting significant cycling (detected using the Rain R package) following entrainment to either LD or HC.
Figure 2
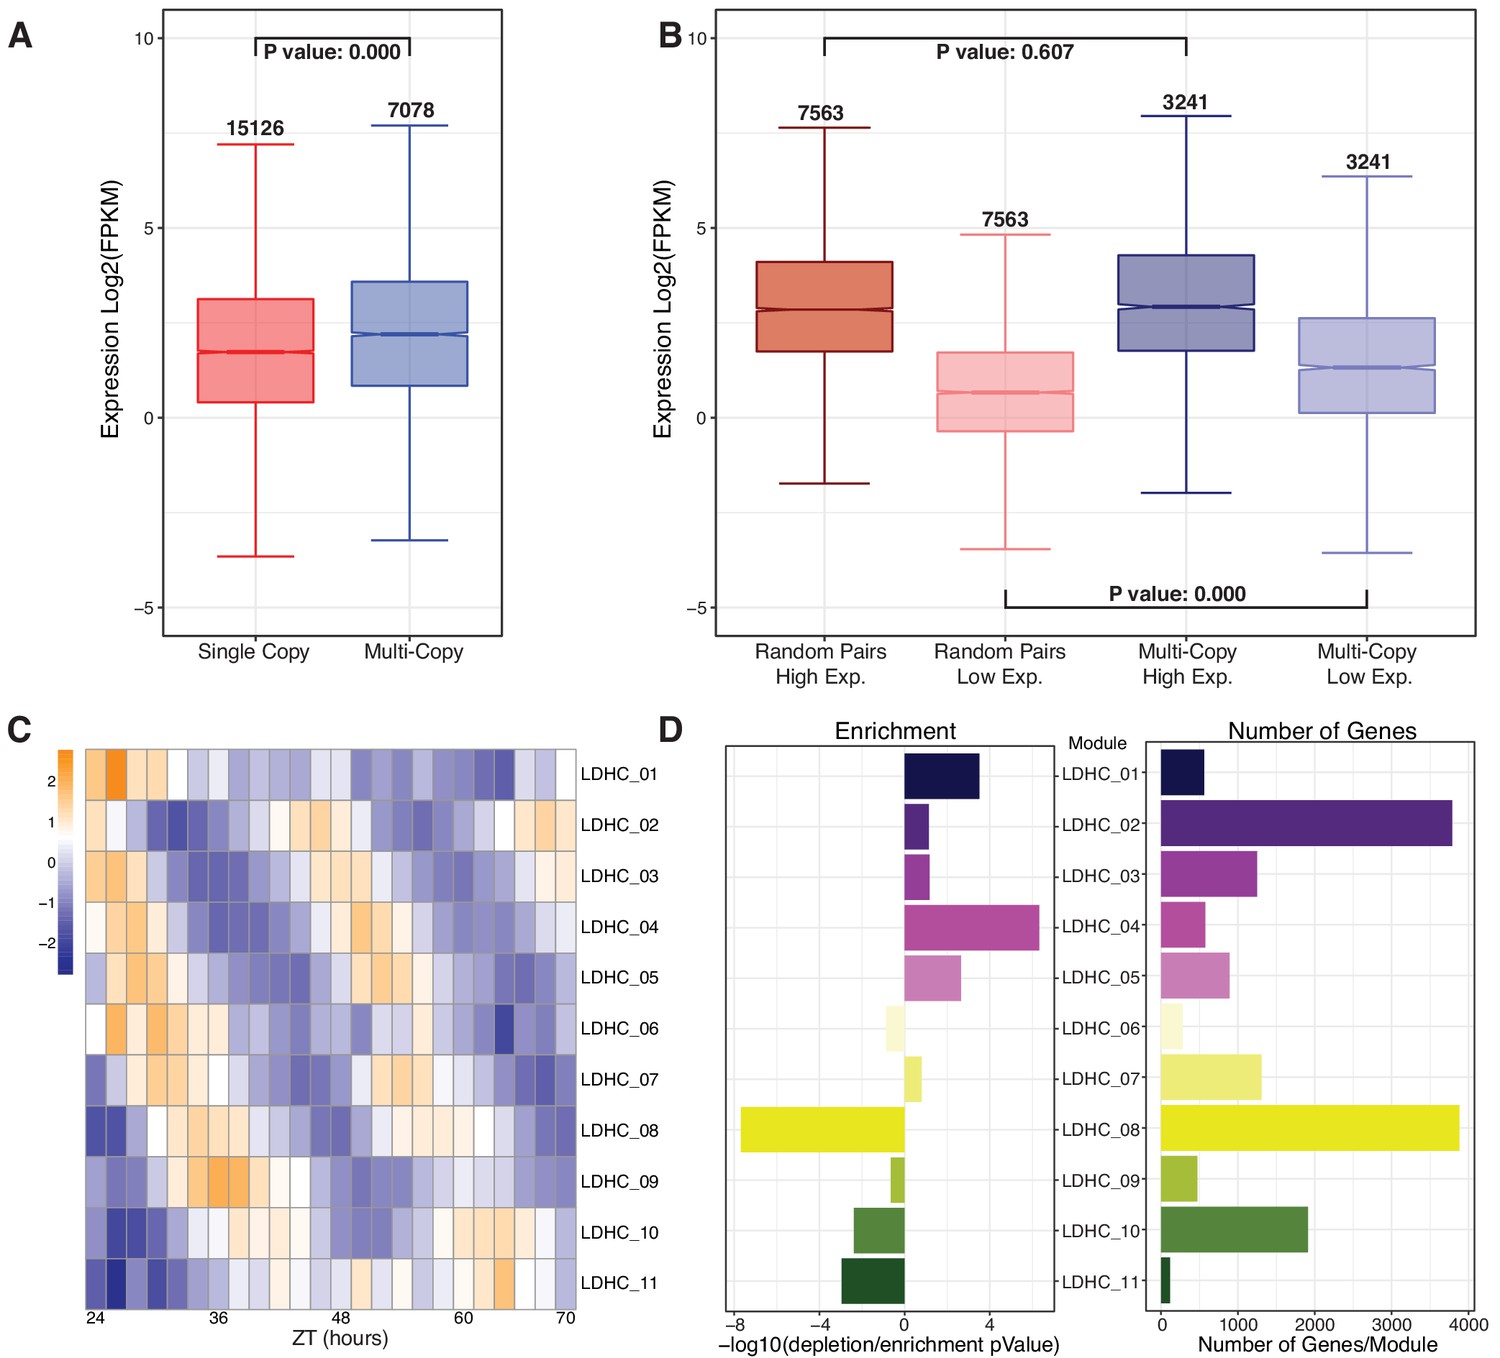
Retained multi-copy circadian regulated genes are highly expressed and display time of day variation.
(A) Mean log2 FPKM expression levels for each gene across the combined LD and HC time course for multi-copy paralogs compared to single-copy genes. Numbers above the whiskers indicate the number of genes in each group. P-value is the result of a one-way ANOVA with Tukey’s test. (B) Expression level comparison when paralogs are separated into high and low expression groups compared to randomly paired single-copy genes. Numbers above the whiskers indicate the number of genes in the groups. P-value is the result of an ANOVA test. (C) Heatmap of the 11 modules of the combined LDHC co-expression network arranged by ZT time (in Zeitgeber [ZT] time, where ZT0 represents the most recent dark to light or cold to warm transition) across the x-axis and circadian phase along the y-axis. (D) Results of a hypergeometric test of the number of multi-copy genes in each module. The left barplot shows the results of the hypergeometric test expressed as a -log10 pValue with enrichment to the right and depletion to the left of 0. The right barplot shows the number of multi-copy genes in each of the modules.
Figure 3 with 1 supplement
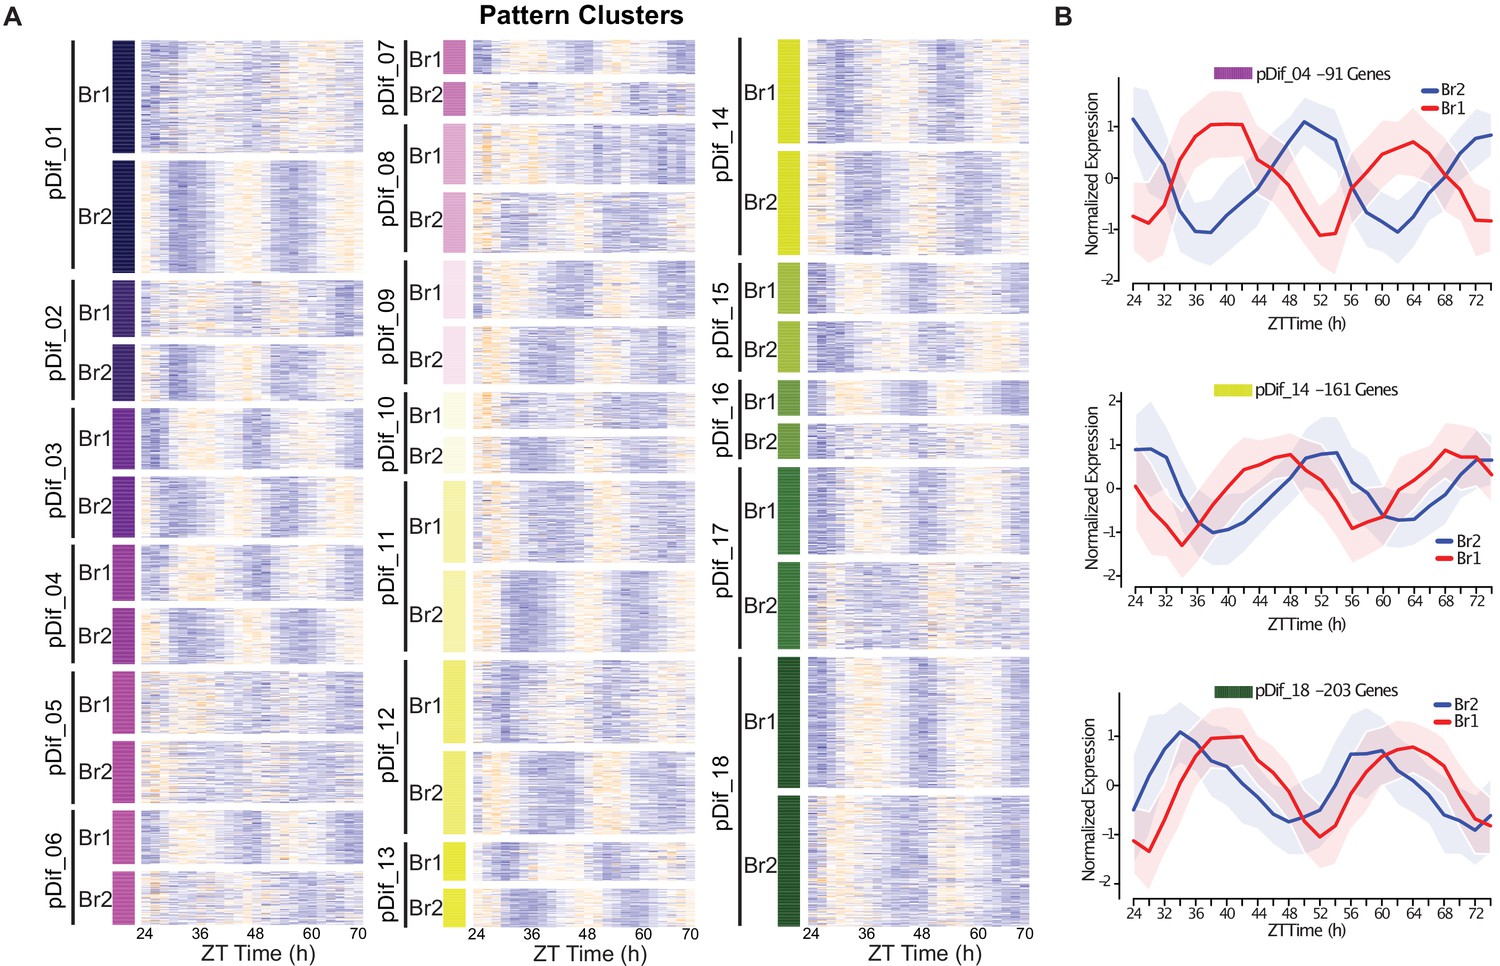
Divergence in phase domains among retained paralogs.
(A) Heatmap of the results from the DiPALM differential pattern analysis (pDif) clustering showing the changes in expression pattern for paralogous pairs. The Br1 and Br2 heatmap blocks for each module contain matching paralogous pairs; for example, the gene in the first line of Br1 and Br2 heatmaps for module pDif_01 are paralogs. The blocks have been stacked on top of each other to be able to compare the change in pattern across the time course. Three-copy paralogs were split into three two-way comparisons. Expression values are log2 transformed FPKM values and the expression is arranged by ZT time across the x-axis. Higher expression levels are in orange and low expression levels are in purple. For example, pDif_01 shows paralogous pairs that are anti-phase with Br1 paralogs peaking at ZT36 and ZT60 and Br2 paralogs peaking at ZT24 and ZT48. (B) Line plots showing the expression patterns for three modules (pDif_04, pDif_14, and pDif_18). Each plot shows the normalized expression of paralogous pairs for all the genes in the module. Ribbons (shaded regions) represent the standard deviation.
Figure 3—figure supplement 1
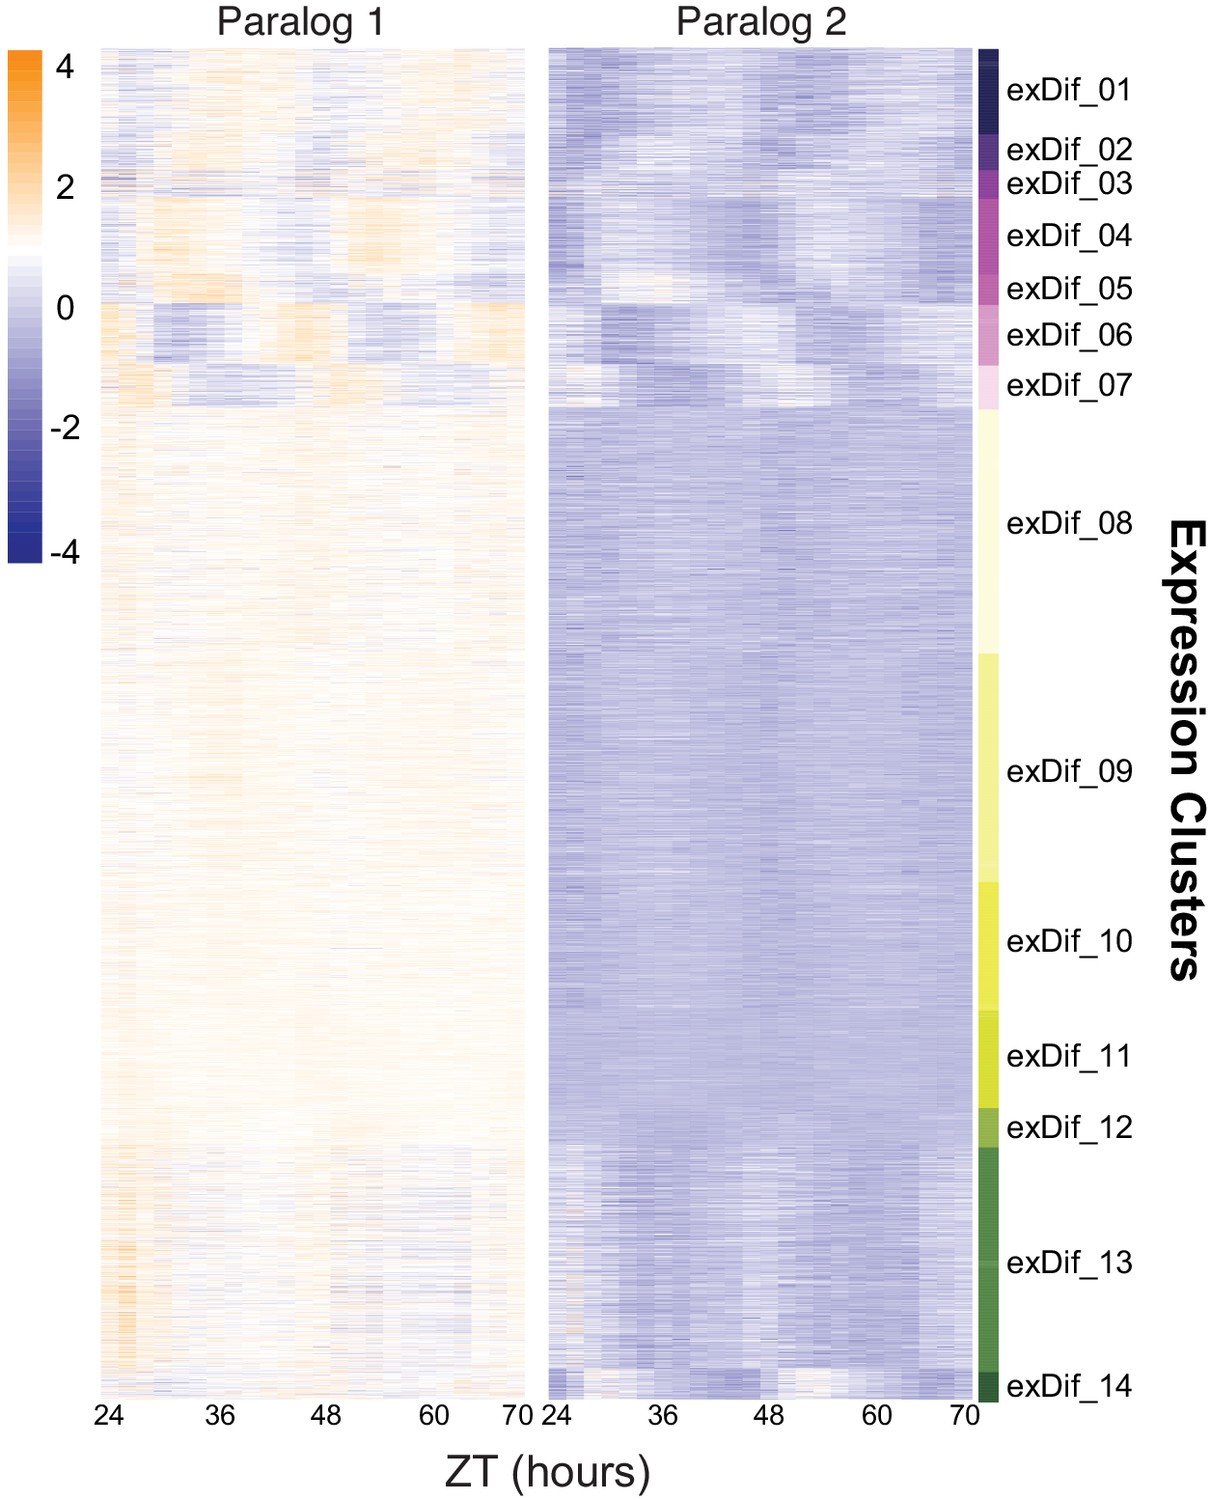
Divergence in median expression levels among retained paralogs.
Heatmap of the results from the DiPALM exDif clustering showing the changes in expression pattern for paralogous pairs. Each line of the heatmap for each block corresponds to a paralogous pair. Three copy paralogs were split into three, two-way comparisons. Expression values are log2 transformed FPKM values and the expression is arranged by ZT time across the x-axis. Higher expression levels are in orange and low expression levels are in purple.
Figure 4 with 2 supplements
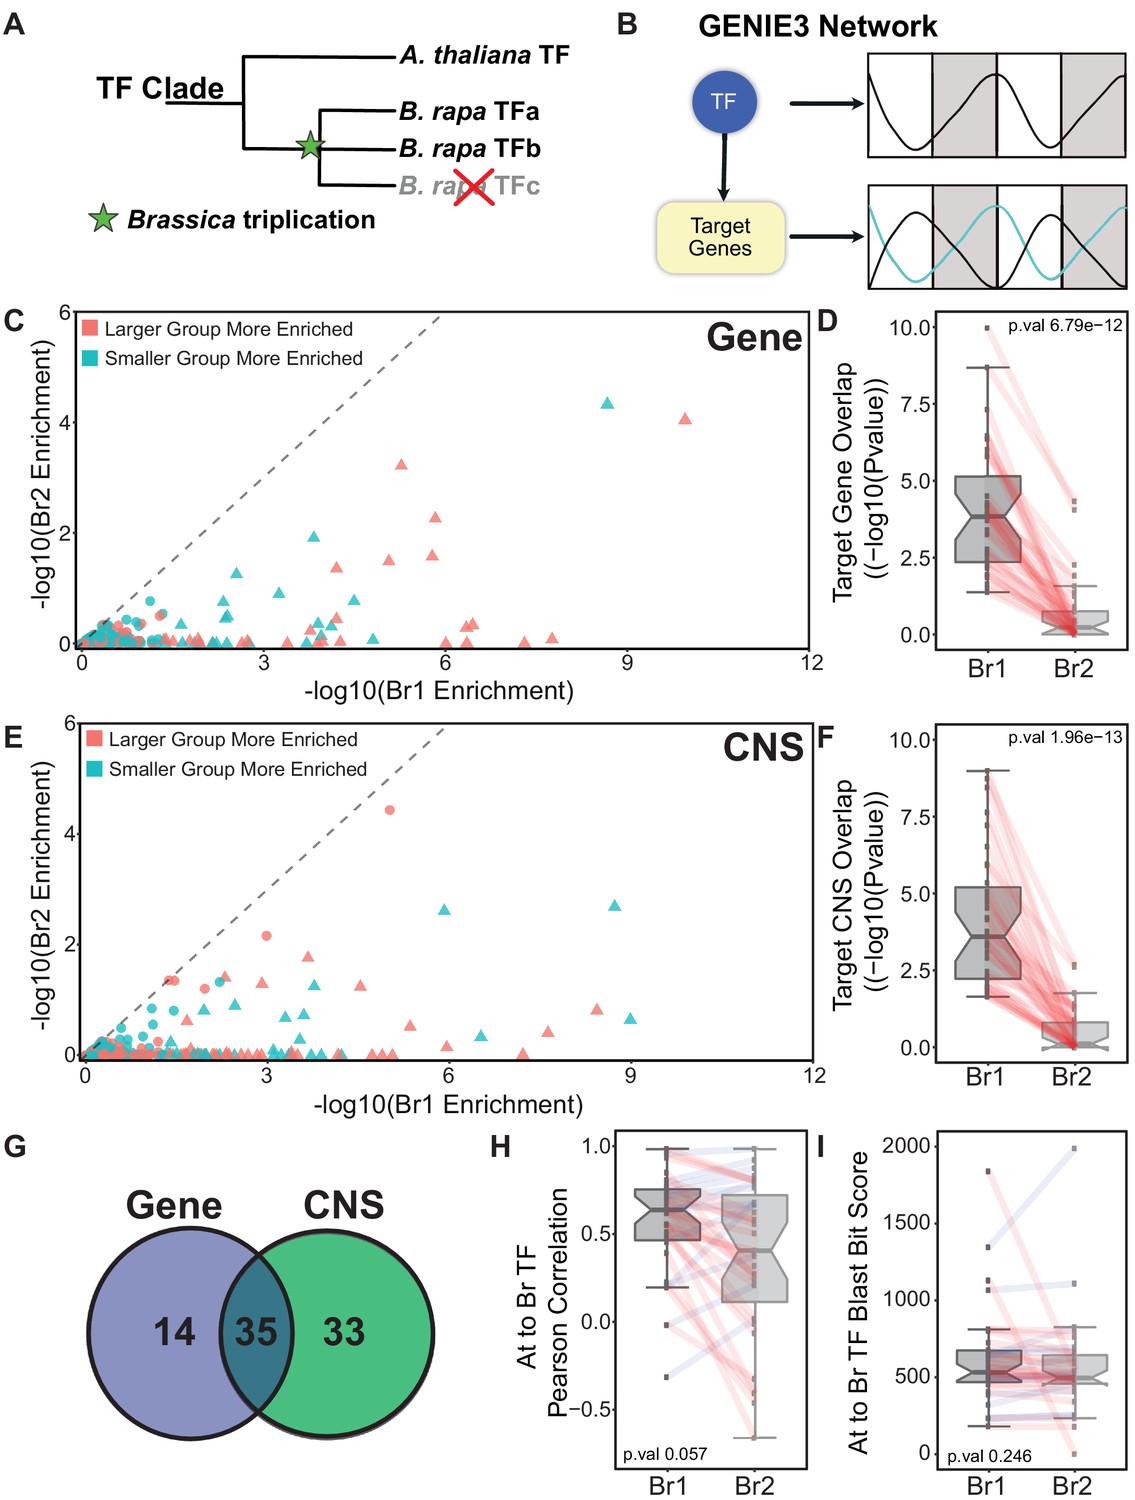
Identifying the ‘Arabidopsis-like’ paralog using GRNs.
(A) Schematic showing the triplication event following the divergence between Arabidopsis and B. rapa leading to multi-copy orthologs of known Arabidopsis transcription factors (TF). (B) GENIE3 networks are generated to associate a TF with target genes based on the expression patterns of the TF and all the genes in the network. There is no assigned direction to the TF regulation in our GENIE3 network resulting in possible positive or negative regulation. (C) Scatterplot showing the results for the gene overlap network analysis for all 256 B. rapa TF pairs. Triangles indicate TF pairs that were identified as having one B. rapa paralog significantly more Arabidopsis-like (p-value<0.05, based on target group overlap) than the other; circles were not significantly different. Points colored red means that Br1 (the more Arabidopsis-like TF) has a larger target group and teal means Br1 has the smaller target group. (D) P-value distribution of the overlap in the B. rapa versus Arabidopsis target genes from the analysis shown in panel (C). All Br1 and Br2 TFs are viewed as separate groups with paralogs connected by red lines. (E) Same scatterplot presentation as panel (C) showing the results from the CNS overlap analysis. (F) P-value distributions of the overlap in B. rapa versus Arabidopsis target CNSs from the analysis shown in panel (E). (G) Of the 49 TFs identified as more Arabidopsis-like based on target genes between the Arabidopsis and B. rapa networks, 35 overlapped with the 68 TFs identified based on CNSs between Arabidopsis and B. rapa target groups. (H) Distribution of the Pearson correlation of TF expression patterns comparing each Br1 and Br2 TF with Arabidopsis TF ortholog. (I) Distribution of BLAST bit score of Br1 and Br2 TFs compared to their orthologous Arabidopsis TF.
Figure 4—figure supplement 1
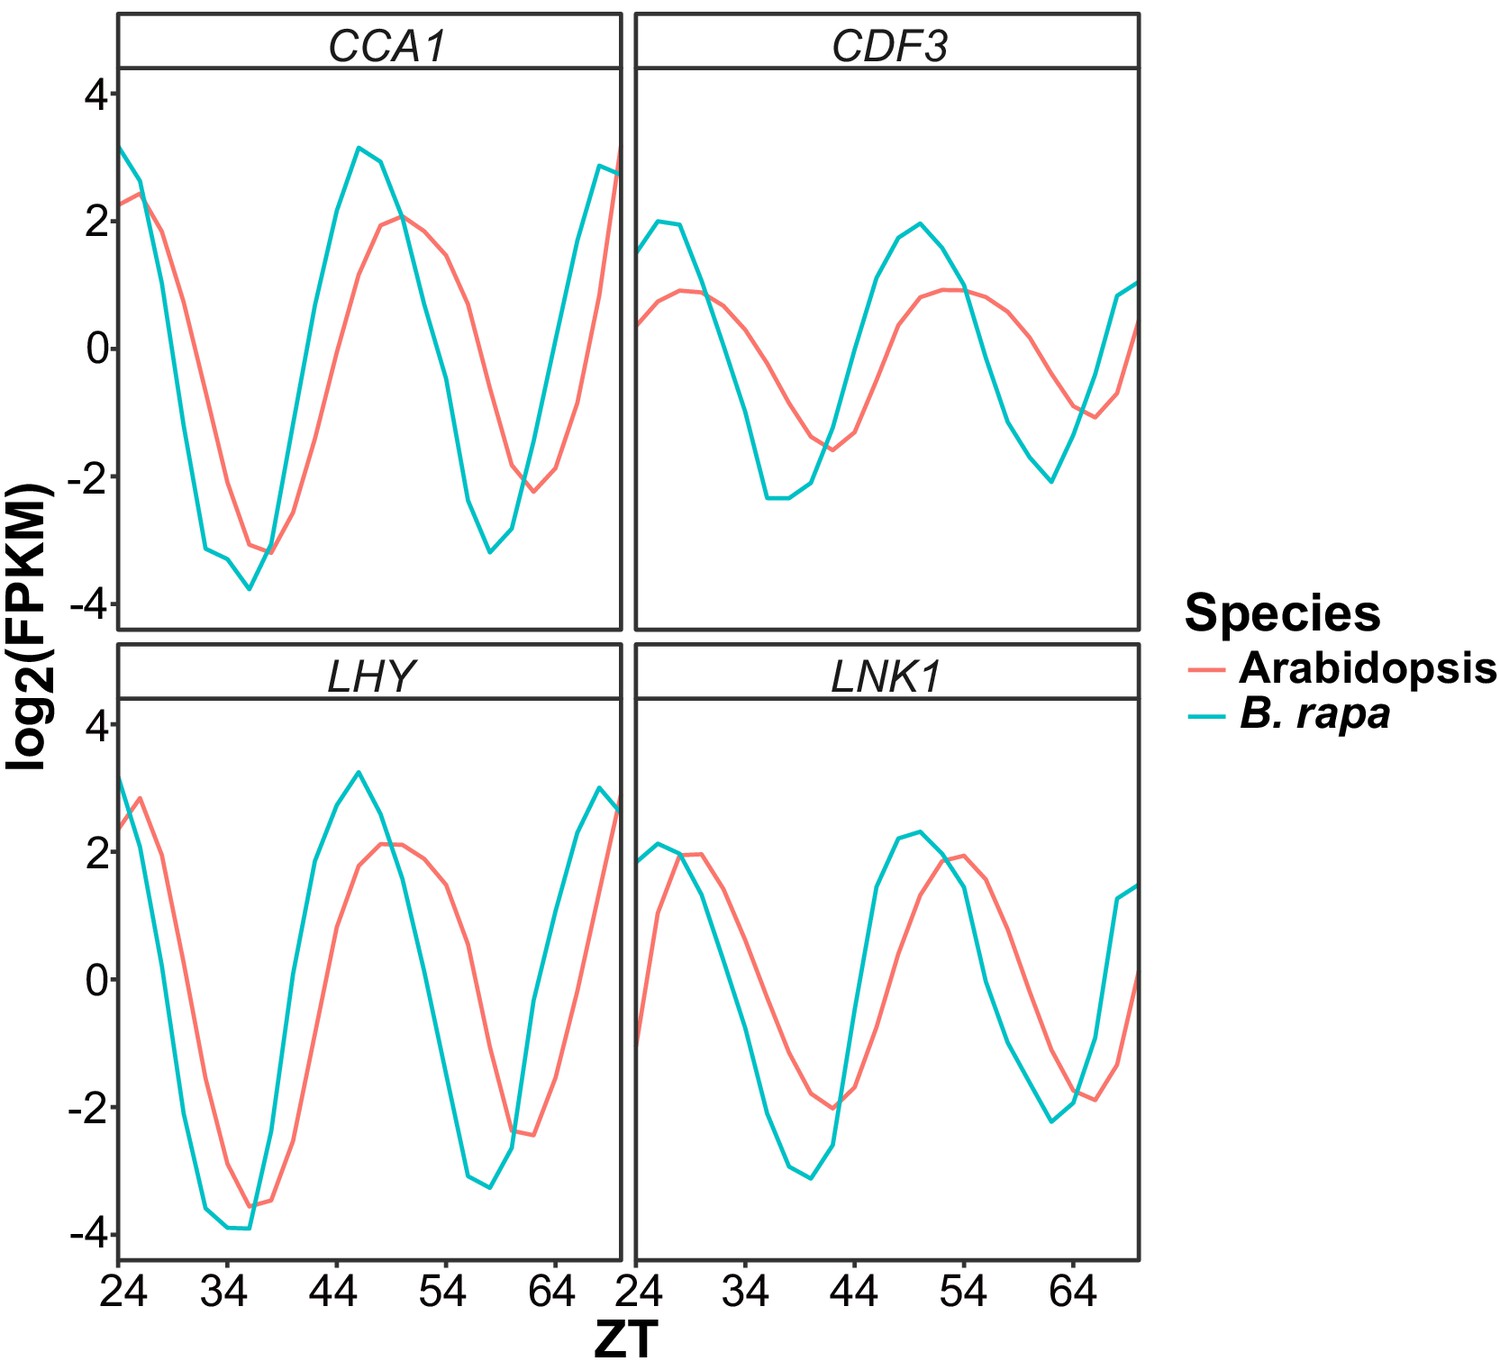
Phase variation between Arabidopsis and B. rapa clock genes.
Gene expression expressed as log2 transformed FPKM values for four circadian clock genes (CCA1, CDF3, LHY, and LNK1) from the Arabidopsis microarray data and B. rapa RNAseq data used in this study. Due to the variation in the circadian period in Col-0 and B. rapa R500 there are visible phase differences as seen by the shift in peak timing of expression.
Figure 4—figure supplement 2
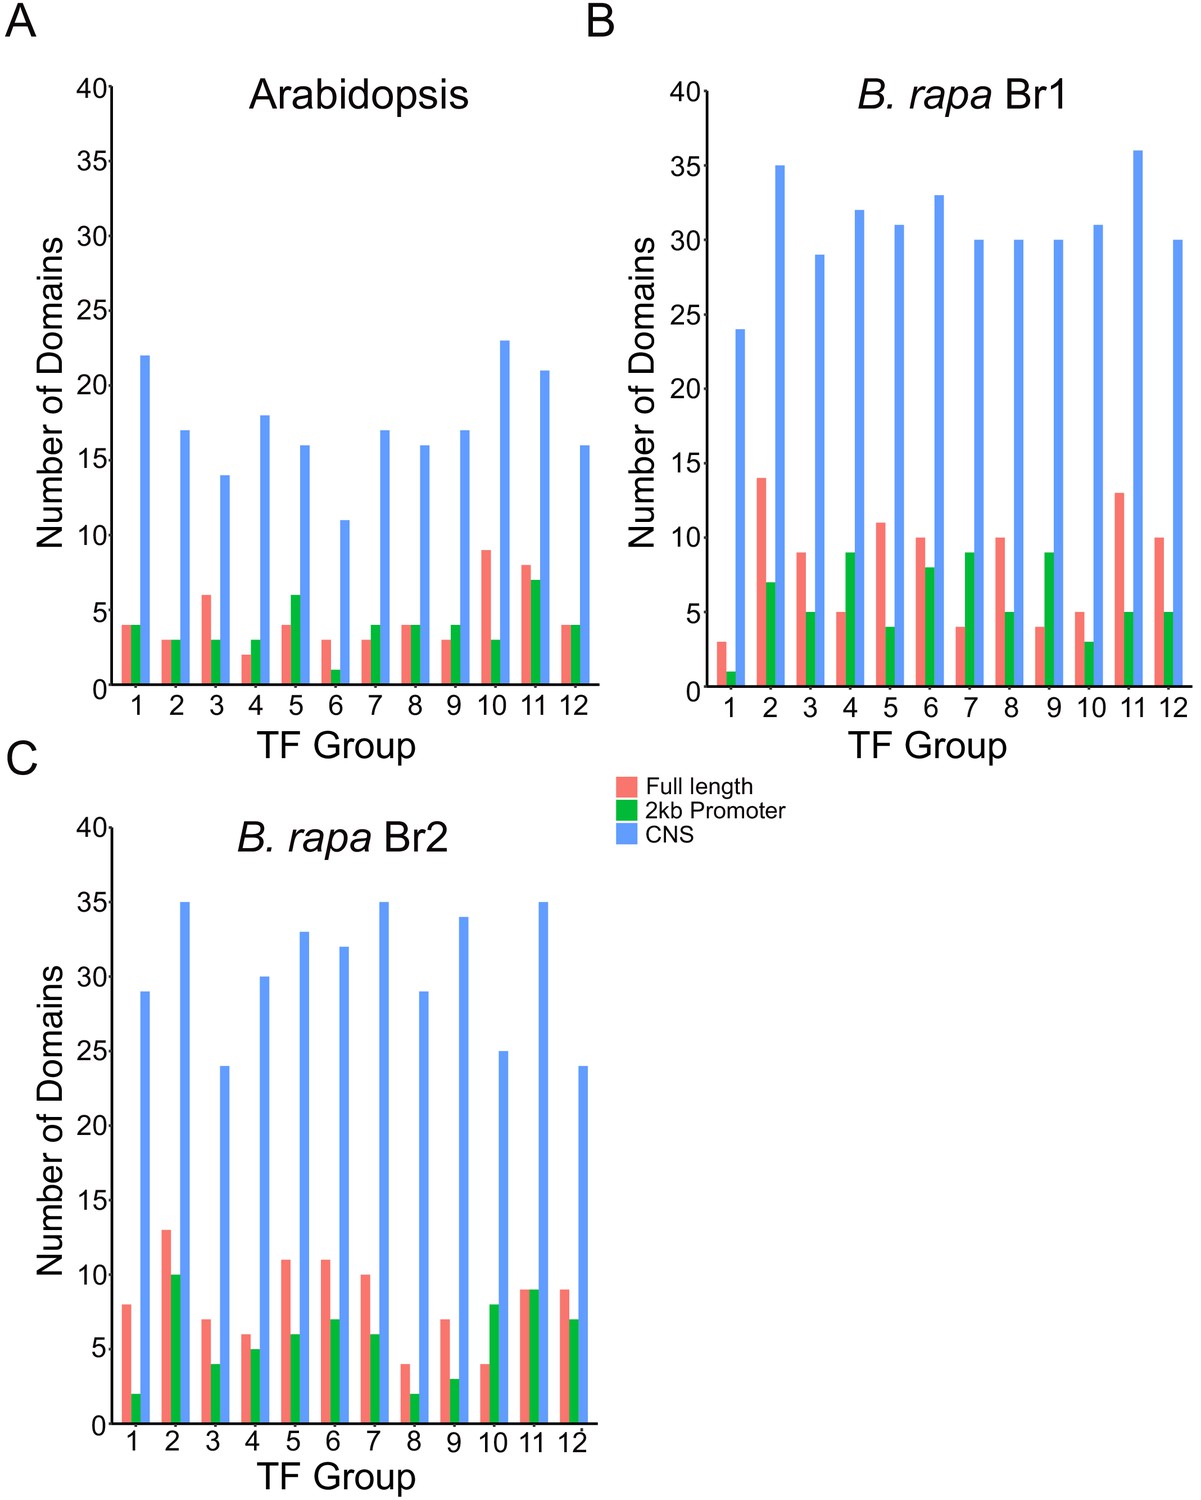
Motif enrichment in CNS regions in Arabidopsis and B. rapa GRN TF target genes.
The HOMER motif analysis software was used to look for enrichment of known TF binding motif sequences among the target gene groups for the 12 TFs in the gene and CNS GRN overlap list (Figure 4G, Supplementary file 5). Motif results were compared for the CNS regions, the full-length gene (2 kb upstream promoter to the 3’UTR) and just the 2 kb promoter region (2 kb upstream promoter to the start codon). For the Arabidopsis (A), Br1 (B) and Br2 (C) target group analysis there was between three- and fivefold greater enrichment of motifs in the CNS regions.
Figure 5
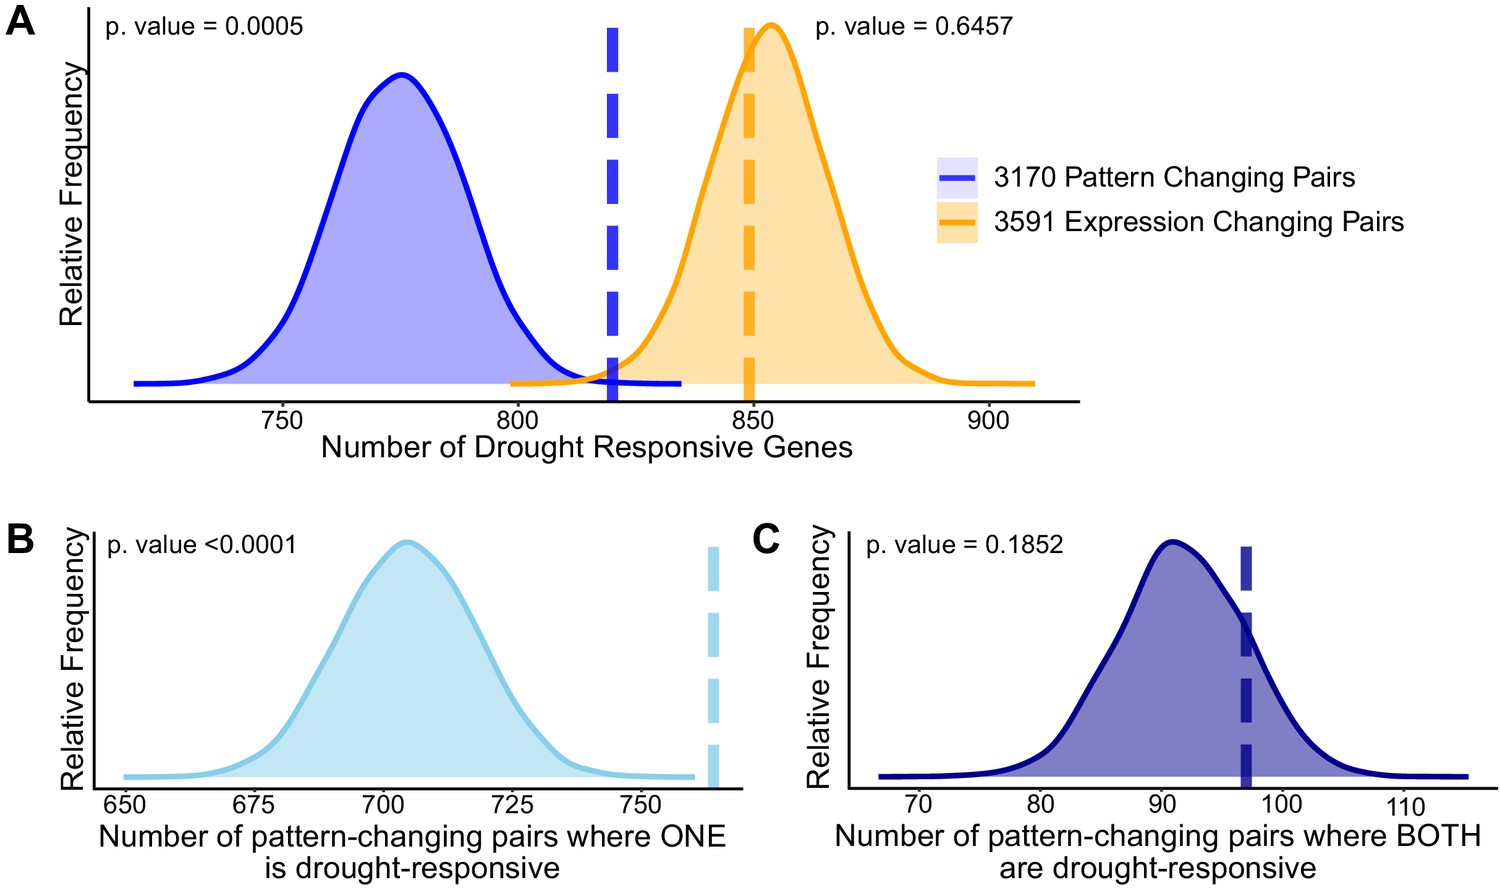
Divergence in drought responsiveness among retained paralogs.
(A) Frequency distributions showing the results of a permutation test of the likelihood of paralogous pairs with significantly diverged expression patterns (blue) or significantly different expression levels (orange) in control conditions being drought responsive. Frequency distributions showing permutation results testing the significance of only one member of the paralogous pair being drought-responsive (B) or both paralogs being drought-responsive genes (C). The dashed vertical lines represent the true test statistic and the frequency distributions represent the null distributions that result from the 10,000 permutation tests. Supplementary information accompanies this paper.
Tables
Key resources table
| Reagent type (species) or resource | Designation | Source or reference | Identifiers | Additional information |
|---|---|---|---|---|
| Biological sample (Brassica rapa subsp. trilocularis) | R500 | ABRC | CS28987 | |
| Software, algorithm | DiPALM | This paper and CRAN (https://CRAN.R-project.org/package=DiPALM) | See markdown file on github page (Greenham, 2020; https://github.com/GreenhamLab/Brapa_R500_Circadian_Transcriptome) |
Additional files
-
Supplementary file 1
Categorical enrichment of GO Biological Process annotations in WGCNA circadian modules.
Coexpression modules were generated for genes in circadian conditions using two different entrainments (LD and HC). Each module was analyzed for categorical enrichment using Biological Process Gene Ontology annotations. Each tab in this file represents a different LD or HC module. The last tab, titled ‘Differential_Pattern’ represents categorical enrichment results on the list of 1713 genes that show significant pattern changes between LD and HC entrainment conditions.
- https://cdn.elifesciences.org/articles/58993/elife-58993-supp1-v2.xlsx
-
Supplementary file 2
DiPALM results for LD versus HC entrainment conditions.
Gene expression was evaluated under circadian conditions (constant light and temperature) for 48 hr after plants were entrained in one of the two conditions; LD (12 hr light/12 hr dark) or HC (12 hr 20 °C/ 12 hr 12°C). Using the set of cycling genes that were identified in both datasets, DiPALM was used to detect differential patterning and differential median expression between LD and HC conditions. This dataset reports these results. Column 1 are gene accessions, Column 2 are adjusted p-values for differential patterning and Column 3 are adjusted p-values for differential median expression.
- https://cdn.elifesciences.org/articles/58993/elife-58993-supp2-v2.csv.zip
-
Supplementary file 3
Categorical enrichment of GO Biological Process annotations in morning-phased and evening-phased multi-copy genes.
WGCNA modules generated with cycling genes from a combined LD and HC dataset were analyzed for depletion or enrichment of multi-copy genes. Significant enrichment of multi-copy genes was observed in five morning-phased modules while depletion was observed in four evening-phased modules. This dataset shows the results of Biological Process Gene Ontology categorical enrichment for the set of multi-copy genes in these five enriched modules (‘MorningCopied’ tab) and the set of multi-copy genes in these four depleted modules (‘EveningCopied’ tab).
- https://cdn.elifesciences.org/articles/58993/elife-58993-supp3-v2.xlsx
-
Supplementary file 4
DiPALM results for paralog comparison in LDHC circadian time course.
The LD and HC circadian time-course datasets were combined into one LDHC time course. B. rapa paralogous pairs were identified and DiPALM was used to detect differential patterning and differential median expression between paralogs. This dataset reports these results. Column 1 are gene accessions, Column2 are adjusted p-values for differential patterning and Column 3 are adjusted p-values for differential median expression.
- https://cdn.elifesciences.org/articles/58993/elife-58993-supp4-v2.csv.zip
-
Supplementary file 5
GRN target groups identify which member of B. rapa paralog pairs is more Arabidopsis-like.
Predicted target groups from GRNs were compared between Arabidopsis (At) and B. rapa (Br) networks. Sets of 3 genes containing one At Transcription factor (TF) and its two Br orthologs (denoted B. rapa 1 and B. rapa 2) were defined. 256 of these TF sets were found between the At and Br GRNs. Tab ‘GRN_Comparison_Orthologs’ reports results after testing for orthology between predicted target groups of corresponding At and Br TFs. Column 1 (Gene Accessions) denotes the three accessions for TFs in each set. For simplicity, B. rapa 1 was always made to be the Br TF with the most significant overlap in target genes with the At TF. Columns 2, 3, and 4 are the total number of genes in the predicted target groups for At, Br1, and Br2, respectively. Columns 5 and 6 are the number of overlapping genes with the At targets (based on orthology) for Br1 and Br2, respectively. Columns 7 and 8 are the p-values for the significance of overlap with At targets for Br1 and Br2, respectively. Column 9 is the p-value result of a permutation test performed to determine if Br1 is significantly more At-like than Br2. This p-value is meaningless unless Column 7 is also significant. Tab: GRN_Comparison_CNSs reports results after testing for conserved non-coding sequences (CNSs) near genes in predicted target groups of corresponding At and Br TFs. Column 1 (Gene Accessions) denotes the three accessions for TFs in each set. For simplicity, B. rapa 1 was always made to be the Br TF with the most significant overlap in target gene CNSs with the At TF. Columns 2, 3, and 4 are the total number of CNSs associated with genes in the predicted target groups for At, Br1, and Br2, respectively. Columns 5 and 6 are the number of overlapping CNSs with the At targets for Br1 and Br2, respectively. Columns 7 and 8 are the p-values for the significance of CNS overlap with At for Br1 and Br2, respectively. Column 9 is the p-value result of a permutation test performed to determine if Br1 is significantly more At-like than Br2. This p-value is meaningless unless Column 7 is also significant. Tab: Significant_Groups summarizes all TF groups where Br1 is significantly more At-like than Br2 based on either the ortholog or CNS comparison. Column 1 lists the three accession numbers for TFs in each group and is ordered based on the target genes orthology comparison (i.e. Br1 is always the most At-like based on orthology of the predicted TF-target genes with predicted At target genes). Column 2 lists the three accessions for TFs in each group and is ordered based on the target genes CNS comparison (i.e. Br1 is always the most At-like based on CNS overlap of the predicted TF-target genes with predicted At target genes). Column 3 lists the p-values for the significance of overlap with At targets and Br1 targets based on orthology. Column 4 indicates if Br1 is significantly more At-like than Br2 based on target gene orthology. Column 5 lists the p-values for the significance of overlap with At targets and Br1 targets based on CNSs. Column 6 indicates if Br1 is significantly more At-like than Br2 based on target gene CNS overlap. Column 7 indicates the 12 TF groups that were used for the motif enrichment analysis (Figure 4—figure suplement 2).
- https://cdn.elifesciences.org/articles/58993/elife-58993-supp5-v2.xlsx
-
Supplementary file 6
DiPALM results for paralog comparison in diel time course.
Gene expression data from control samples in a time course performed in diel conditions (14 hr light 21°C/10 hr dark 18°C) were examined (Greenham et al., 2017). B. rapa paralogous pairs were identified and DiPALM was used to detect differential patterning and differential median expression between paralogs. This dataset reports these results. Column 1 are gene accessions, Column 2 are adjusted p-values for differential patterning, and Column 3 are adjusted p-values for differential median expression.
- https://cdn.elifesciences.org/articles/58993/elife-58993-supp6-v2.csv.zip
-
Supplementary file 7
DiPALM results for drought-responsive genes in drought time course.
Gene expression data from Greenham et al., 2017 were examined. Mild drought was imposed and compared to well-watered samples. DiPALM was used to identify differential patterning and differential median expression of genes in response to drought. This dataset reports these results. Column 1 are gene accessions, Column 2 are adjusted p-values for differential patterning, and Column 3 are adjusted p-values for differential median expression.
- https://cdn.elifesciences.org/articles/58993/elife-58993-supp7-v2.csv.zip
-
Supplementary file 8
DiPALM benchmarking using the area under the receiver operating characteristic (AUROC) curve.
DiPALM was evaluated using simulated benchmark datasets (Spies et al., 2019). Eight different simulated datasets were generated (rows). Dataset names denote the number of simulated counts, number of simulated replicates, and the number of simulated timepoints. This table also includes the top three performing methods mentioned in Spies et al.: splineTC (Michna et al., 2016), maSigPro (Nueda et al., 2014), and impulseDE2 (Fischer et al., 2018). The method of running a traditional differential expression analysis on each timepoint separately and then taking the most significant timepoint for each gene is also shown (pairwise). Three different DiPALM evaluations were carried out using the pattern-detecting version (kME), the abundance-detecting version (Median) and a combined score using the sum of both.
- https://cdn.elifesciences.org/articles/58993/elife-58993-supp8-v2.docx
-
Supplementary file 9
CNS annotations for Arabidopsis.
Using a list of canonical CNS sequences derived from Haudry et al., 2013, the TAIR10 genome was annotated for those CNSs using NCBI BLAST+. This dataset is in BED file format with six fields as follows: Field 1 denotes the chromosome, Field 2 denotes the start nucleotide position, Field 3 denotes the end nucleotide position, Field 4 denotes the CNS accession (name), Field 5 is a placeholder ‘1’ for a score annotation but is not used in this case, Field 6 denotes the strand.
- https://cdn.elifesciences.org/articles/58993/elife-58993-supp9-v2.txt.zip
-
Supplementary file 10
CNS Annotations for Brassica rapa R500.
Using a list of canonical CNS sequences derived from Haudry et al., 2013, the B. rapa R500 genome was annotated for those CNSs using NCBI BLAST+. This dataset is in BED file format with six fields as follows: Field 1 denotes the chromosome, Field 2 denotes the start nucleotide position, Field 3 denotes the end nucleotide position, Field 4 denotes the CNS accession (name), Field 5 is a placeholder ‘1’ for a score annotation but is not used in this case, Field 6 denotes the strand.
- https://cdn.elifesciences.org/articles/58993/elife-58993-supp10-v2.txt.zip
-
Transparent reporting form
- https://cdn.elifesciences.org/articles/58993/elife-58993-transrepform-v2.docx
Download links
A two-part list of links to download the article, or parts of the article, in various formats.
Downloads (link to download the article as PDF)
Open citations (links to open the citations from this article in various online reference manager services)
Cite this article (links to download the citations from this article in formats compatible with various reference manager tools)
Expansion of the circadian transcriptome in Brassica rapa and genome-wide diversification of paralog expression patterns
eLife 9:e58993.
https://doi.org/10.7554/eLife.58993


