Molecular principles of assembly, activation, and inhibition in epithelial sodium channel
- Department of Biochemistry and Molecular Biology, Oregon Health & Science University, United States
- Vollum Institute, Oregon Health & Science University, United States
- Neuroscience Graduate Program, Oregon Health & Science University, United States
Figures
Figure 1 with 6 supplements
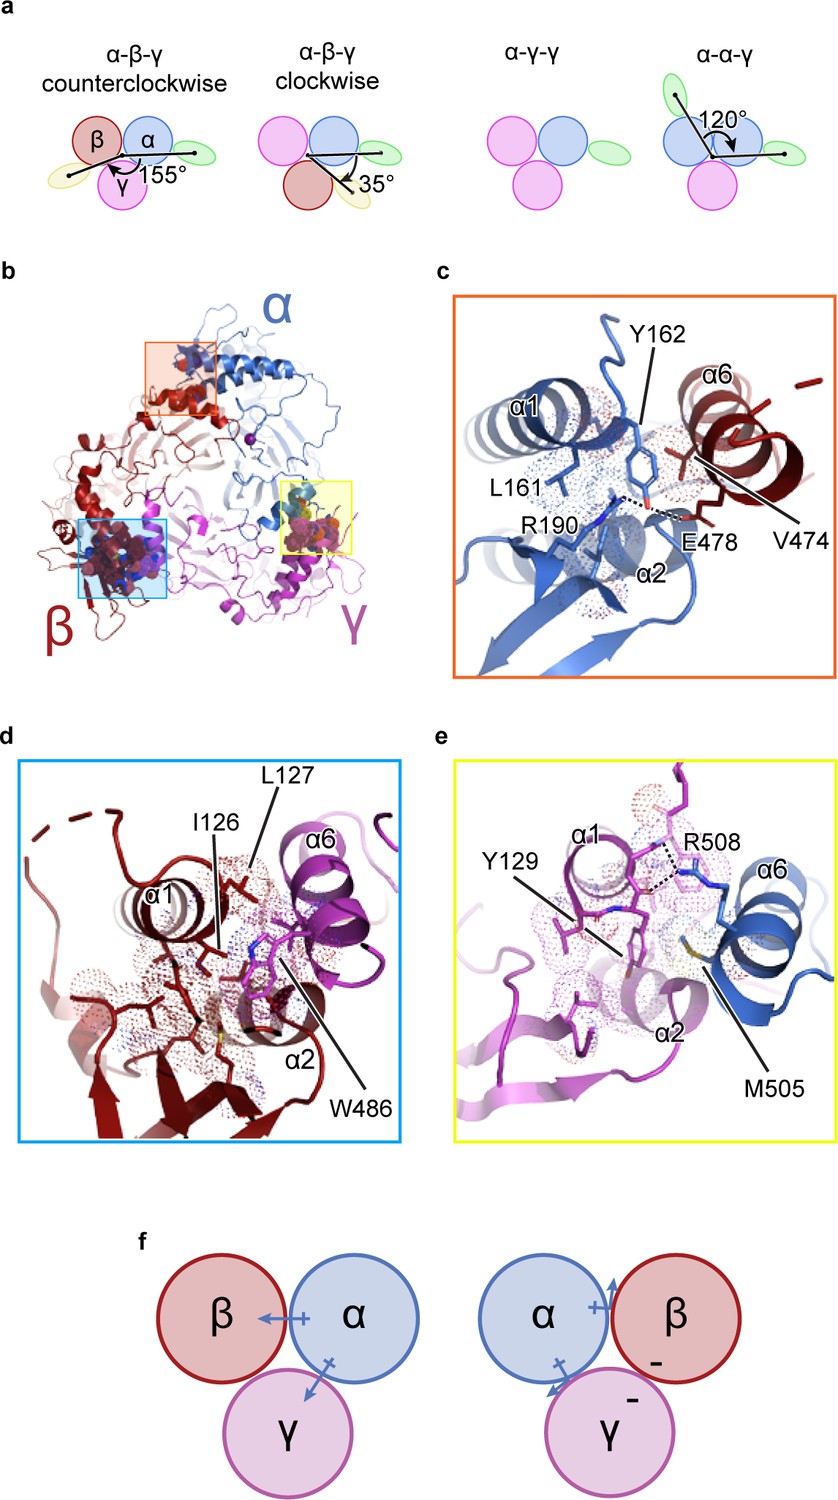
The unique molecular interactions at the subunit interface define heteromeric assembly of ENaC.
(a) Top-down cartoon schematic illustration of ENaC with α-β-γ counterclockwise as resolved by cryo-EM (top left) and three possible assemblies of ENaC based on the defined purification scheme (see Materials and methods) as seen from left: α-β-γ clockwise (second panel), α-γ-γ (third panel), and α-α-γ (fourth panel). Subunits and Fabs are colored blue (α), red (β), magenta (γ), green (7B1) and yellow (10D4). (b) View of the ENaCFL from the extracellular side and shown in cartoon representation. The α, β, and γ are colored blue, red, magenta, respectively. Boxed regions define subunit interactions near the top of the ECD. (c) Close-up view of the α-β interface as highlighted with an orange square in (b). The hydroxyl group of αTyr162 forms hydrogen bonds with αArg190 and βGlu478. Dashed lines indicate distances of 2.5–3.5 Å. (d) Zoomed-in view of the β-γ interface in blue boxed region. The equivalent residue βLeu127 is primarily interacting with residues in the adjacent α6. Instead, βIle126 resides in the equivalent position as in αTyr162 and γTyr129 makes van der Waals contacts with the residues from the α2, βGRIP, and the adjacent α6. (e) Enlarged view of the γ-α interface, yellow boxed region. The side chain of the equivalent γTyr129 is largely surrounded by hydrophobic residues. (f) Cartoon schematic illustration of the ENaC hydrogen bonding network. The α subunit donates hydrogen bonds to both the β and γ subunits in the counterclockwise arrangement (left). If the positions of α and β are swapped, the hydrogen bond donors and acceptors are mutually inaccessible (right).
Figure 1—figure supplement 1
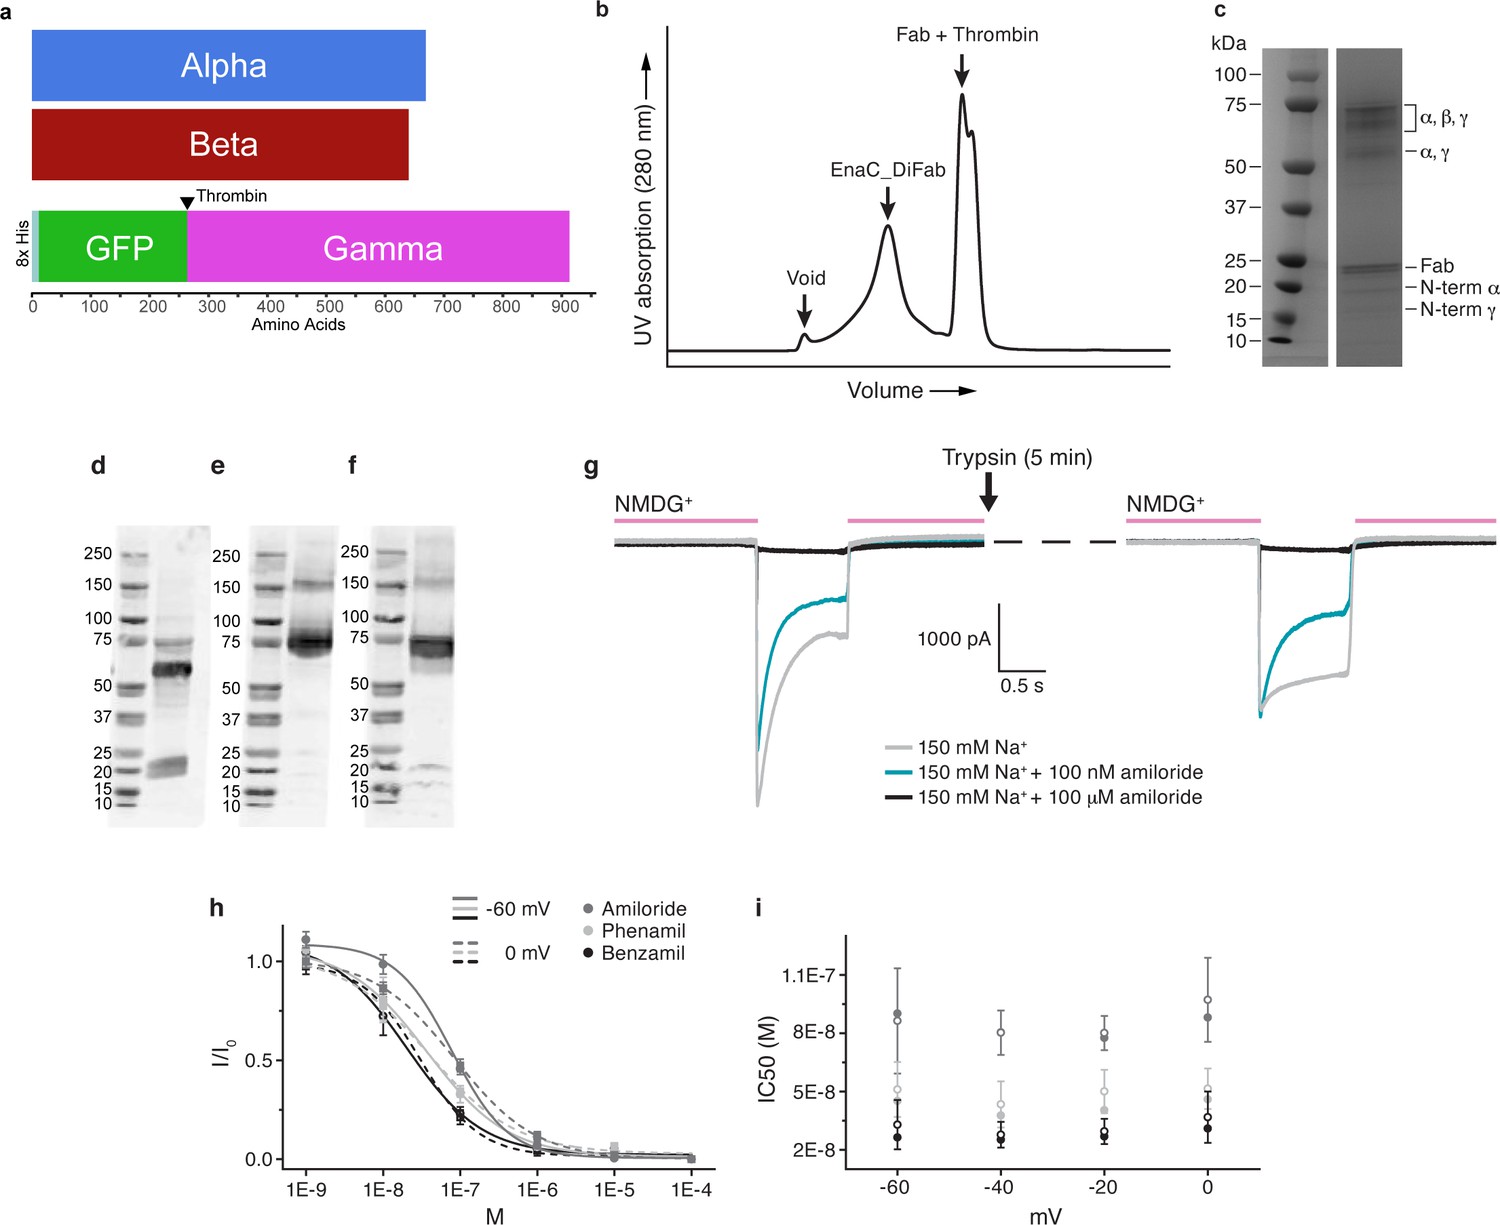
Biochemical and functional characterization of ENaCFL.
(a) Schematic illustration of the ENaCFL subunit constructs. (b) Size-exclusion chromatogram of purified ENaCFL in complex with 7B1 and 10D4 Fabs (c) Representative SDS-PAGE of the purified protein. (d) Western blot (6 μg/ blot, rabbit polyclonal Ab to SCNN1A raised against amino acids 131–225, sc-21012) probing for the α subunit. The α lane has three bands, the uncut band at 75 kDa, and cut bands at approximately 60 and 20 kDa. This is expected due to the endogenous cleavage sites in WTα. (e) Western blot (2.5 μg/ blot, rabbit polyclonal Ab to SCNN1B raised against amino acids 406–640, ABclonal A1765) probing for the β subunit. As expected, majority of the band remains uncut at 75kD. (f) Western blot ( 6.25 μg/ blot, rabbit polyclonal Ab to SCNN1G raised against amino acids 100–250, ABclonal A15097) probing for the γ subunit. Majority of the band remains uncut at 75kD. Bands between 15-20kD are observed when γ is cut at the thrombin site at or near the thrombin and furin sites. (g) Representative current traces of ENaCeGFP by whole-cell patch-clamp electrophysiology. Current amplitude mediated by ENaCeGFP is sensitive to trypsin treatment based on increase of steady-state current. (h) Dose response curves of ENaCeGFP at −60 mV and 0 mV for the three different pore blockers amiloride (grey), phenamil mesylate (light grey) and benzamil (dark grey). The dose response was determined using the following concentrations of each blocker, 1 nM, 10 nM, 100 nM, 1 μM, 10 μM and 100 μM. The amiloride-sensitive current response (Na+ current subtracted from Na+ current in presence of 100 μM blocker) was normalized to the amiloride-sensitive Na+ current with no blocker. Each dose response was repeated five times for each blocker, and a curve was fitted to mean ± S.E.M. (i) Plot of IC50 vs voltage shows that there is no voltage dependency. The IC50 was determined for each dose response and represent five independent experiments for each blocker (mean ± S.E.M). Closed circles represent the IC50 determined from a curve fitted to the average normalized current, open circles represents the mean value after fitting a dose response curve to each individual experiment and determining the IC50.
Figure 1—figure supplement 2
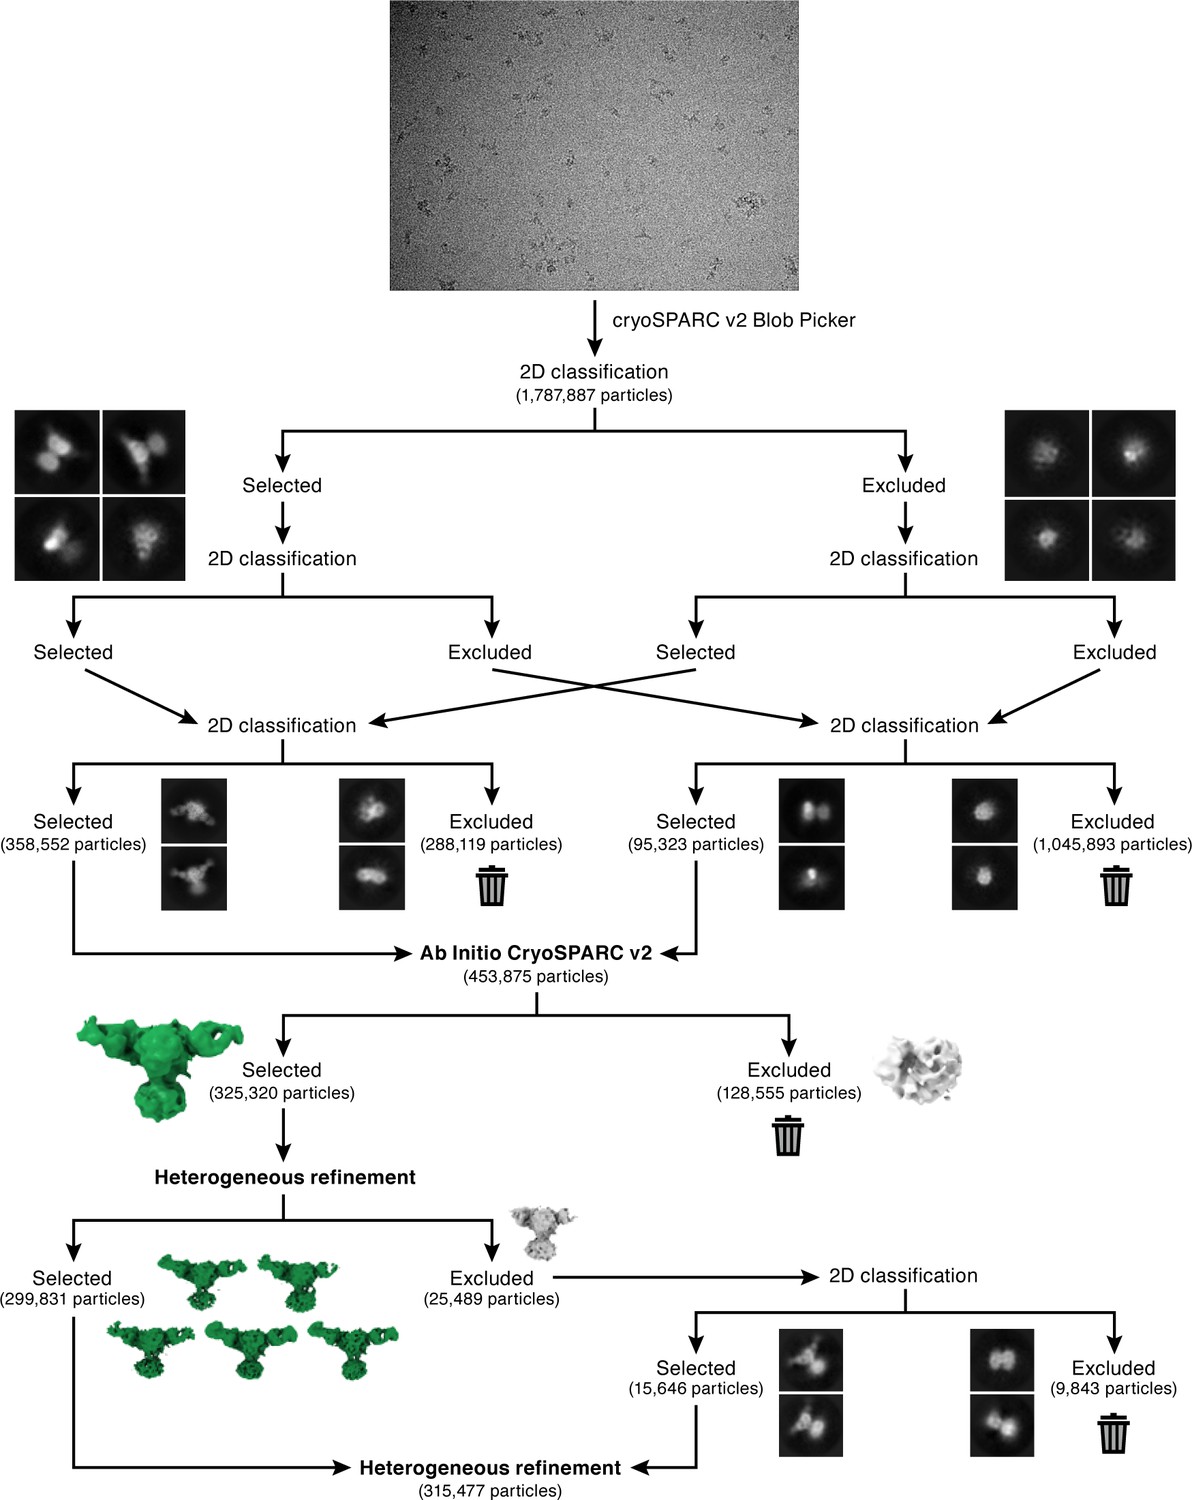
Cryo-EM initial data processing workflow.
CryoSPARC Blob Picker was used for automated particle picking, to select an initial set of 1,787,887 particles. Multiple rounds of 2D classification were performed to select true-positive 2D classes of ENaCFL as illustrated in the flowchart. After each round of classification, particles excluded from selection were combined and subject to 2D classification in order to recover true-positive 2D classes. After 2D classification, a final set of 453,875 particles were subject to 3D classification using cryoSPARC Ab Initio. Two classes were requested which resulted in one good class that contained 325,320 particles. Further 3D classification using cryoSPARC heterogeneous refinement was performed. Five of the six requested classes had similar features, and therefore combined. The sixth class was further classified by 2D classification to recover true-positive ENaCFL classes, and added to a final stack of 315,477 particles.
Figure 1—figure supplement 3
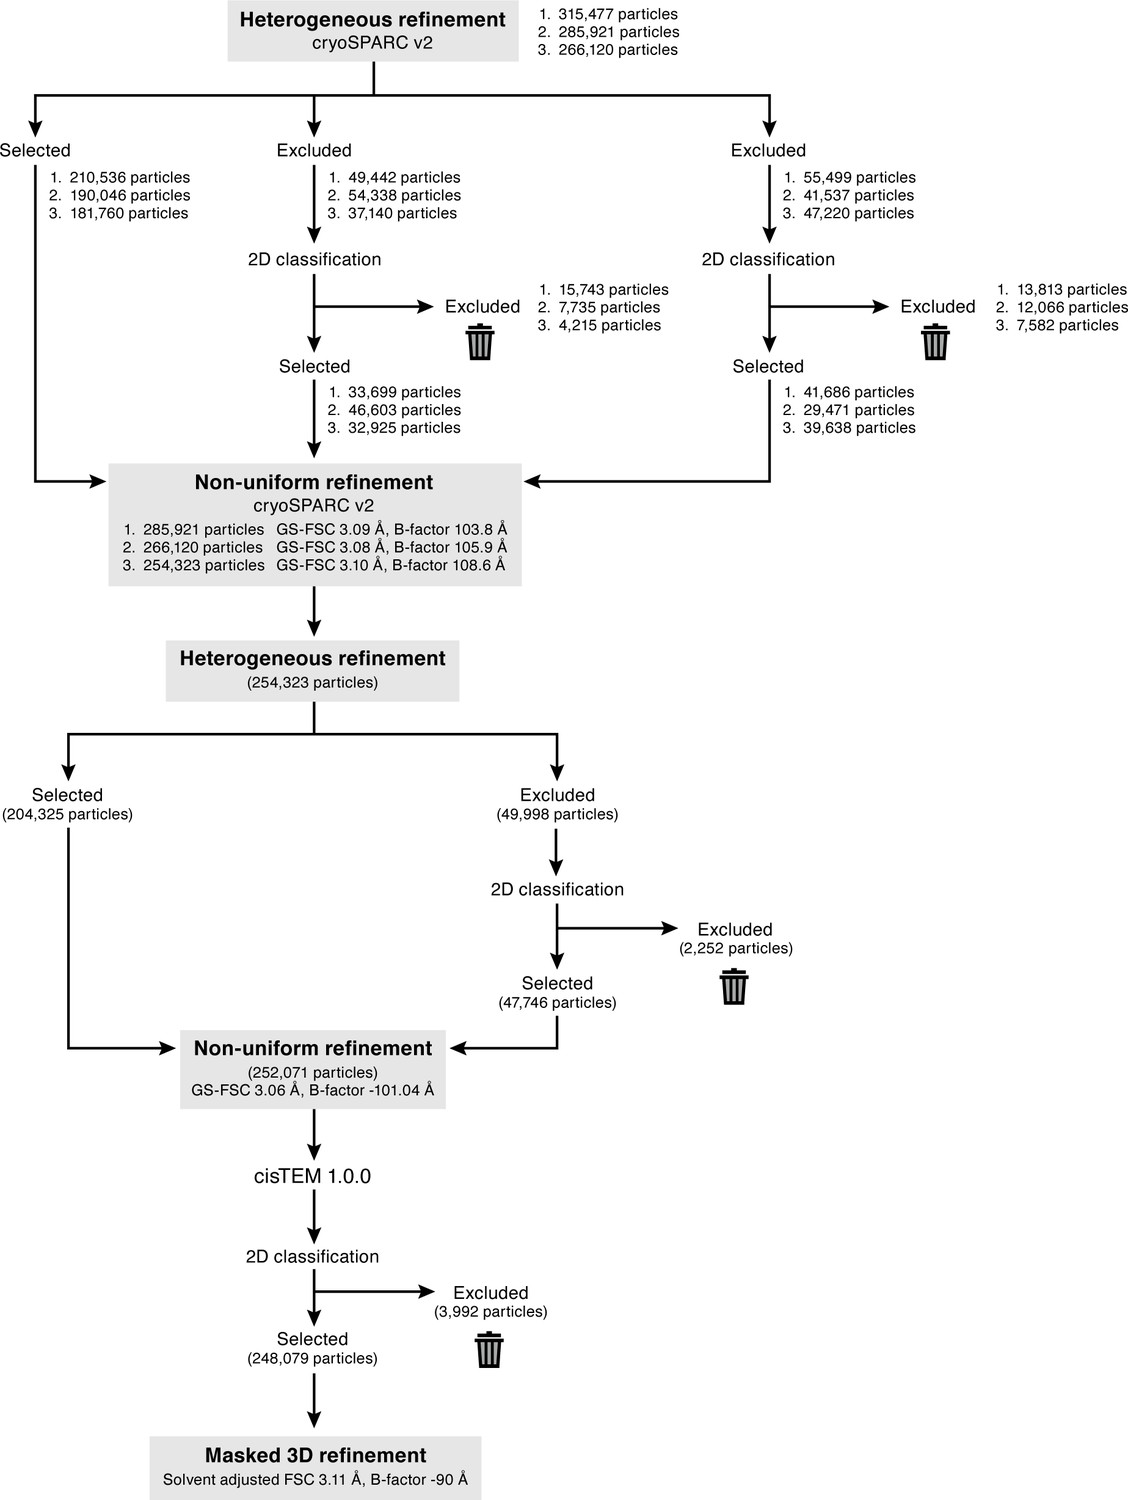
Cryo-EM data processing for the final map.
To remove false-positive particles, three rounds of 3D classification was performed using cryoSPARC heterogeneous refinement. For each round, only the best class was selected, and the other two classes excluded. The excluded classes were classified by 2D classification to reveal true-positive ENaC classes, and then combined with the particles selected from the best class. The numbers listed (1-3) represent the number of particles in each round of refinement. Additionally, after each round of heterogenous refinement, the combined particle stack was refined using cryoSPARC non-uniform refinement. Three rounds of iterative heterogenous refinement and non-uniform refinement resulted in a stack of 254,323 particles. A final round of heterogeneous refinement resulted in a particle stack of 252,071 particles. Non-uniform refinement of this final set of particles resulted in a cryo-EM map of ENaCFL at 3.06 Å resolution (gold-standard FSC), and a B-factor of ~ −100 Å2. This refined particle stack was also imported to cisTEM 1.0.0, classified by 2D classification, before final 3D refinement of 248,079 particles resulted in a cryo-EM map at a resolution of 3.11 Å (solvent-adjusted FSC).
Figure 1—figure supplement 4
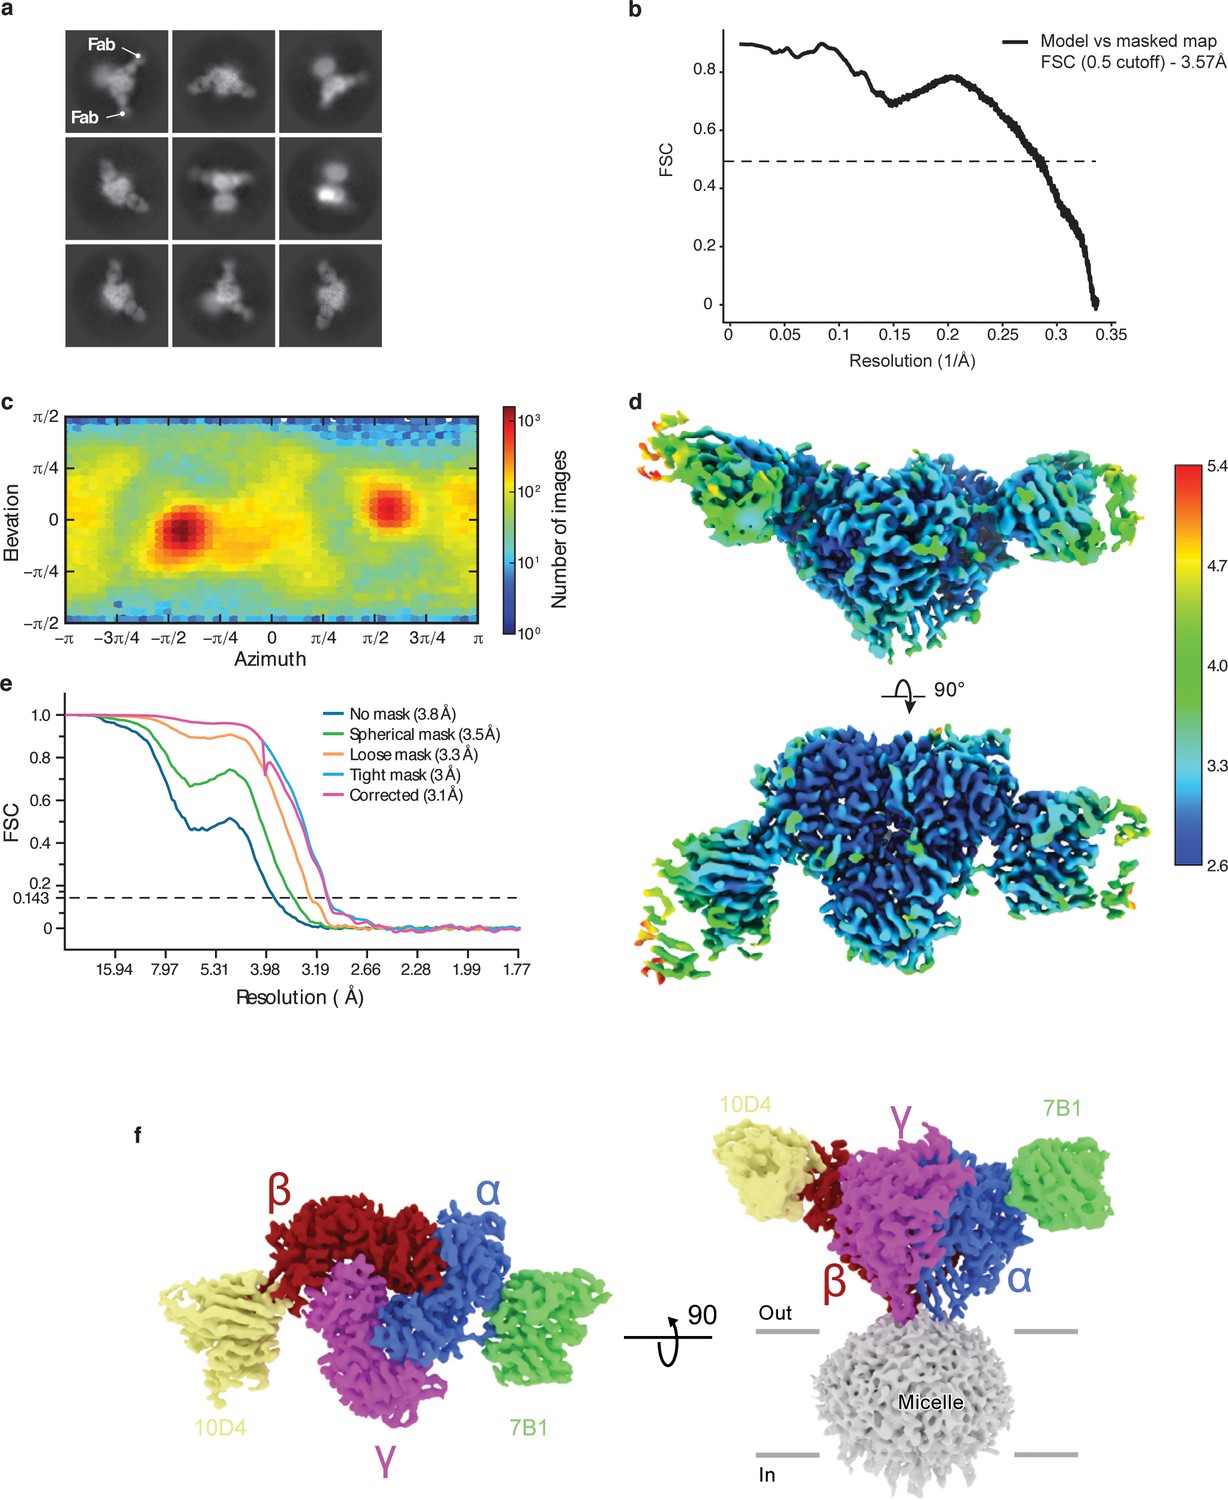
Cryo-EM analysis of ENaCFL dataset.
(a) Representative 2D class averages of ENaCFL. (b) Fourier Shell Correlation plot of model vs masked map. (c) Angular particle distribution. (d) Local resolution estimate (e) Gold-standard Fourier shell correlation (GS-FSC) (f) Final cryo-EM map of ENaCFL with the α, β, γ, 7B1 Fab, and 10D4 Fab colored blue, red, magenta, green, and yellow, respectively.
Figure 1—figure supplement 5
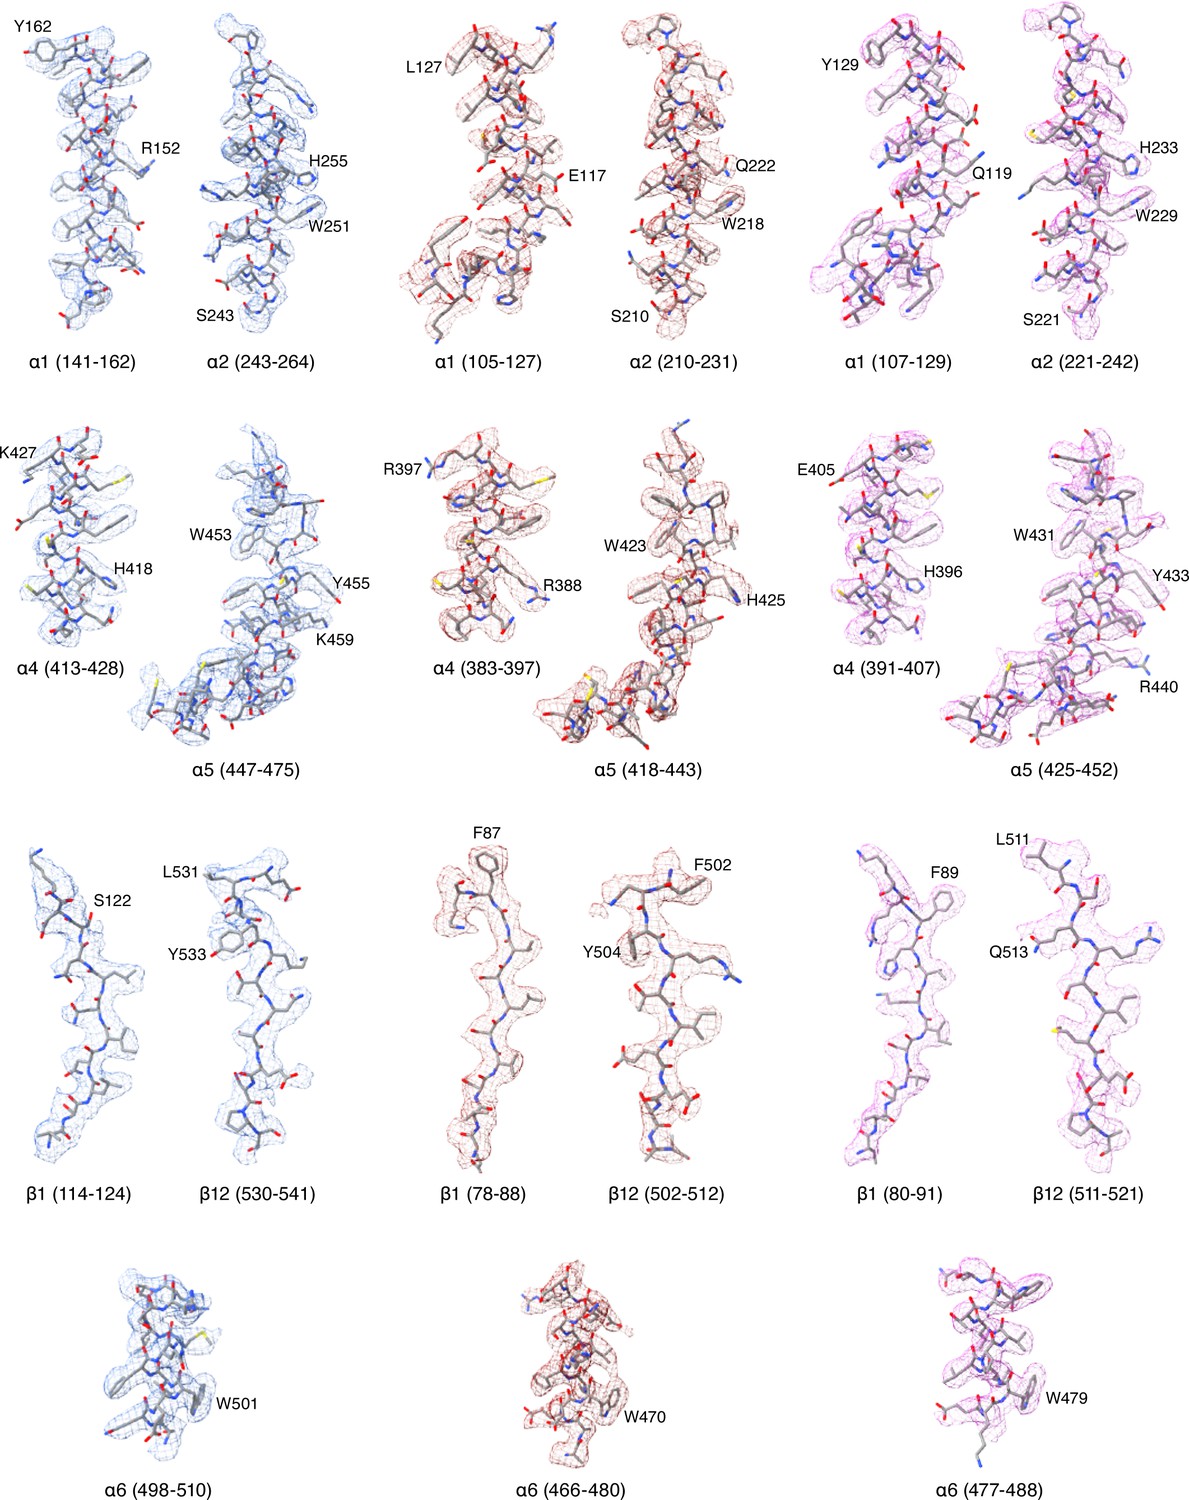
Cryo-EM potential maps of different regions in ENaCFL map.
The α, β, and γ subunit maps are represented in blue, red and magenta colored mesh, respectively. ENaCFL coordinates are represented in grey stick superposed with the colored mesh maps.
Figure 1—figure supplement 6
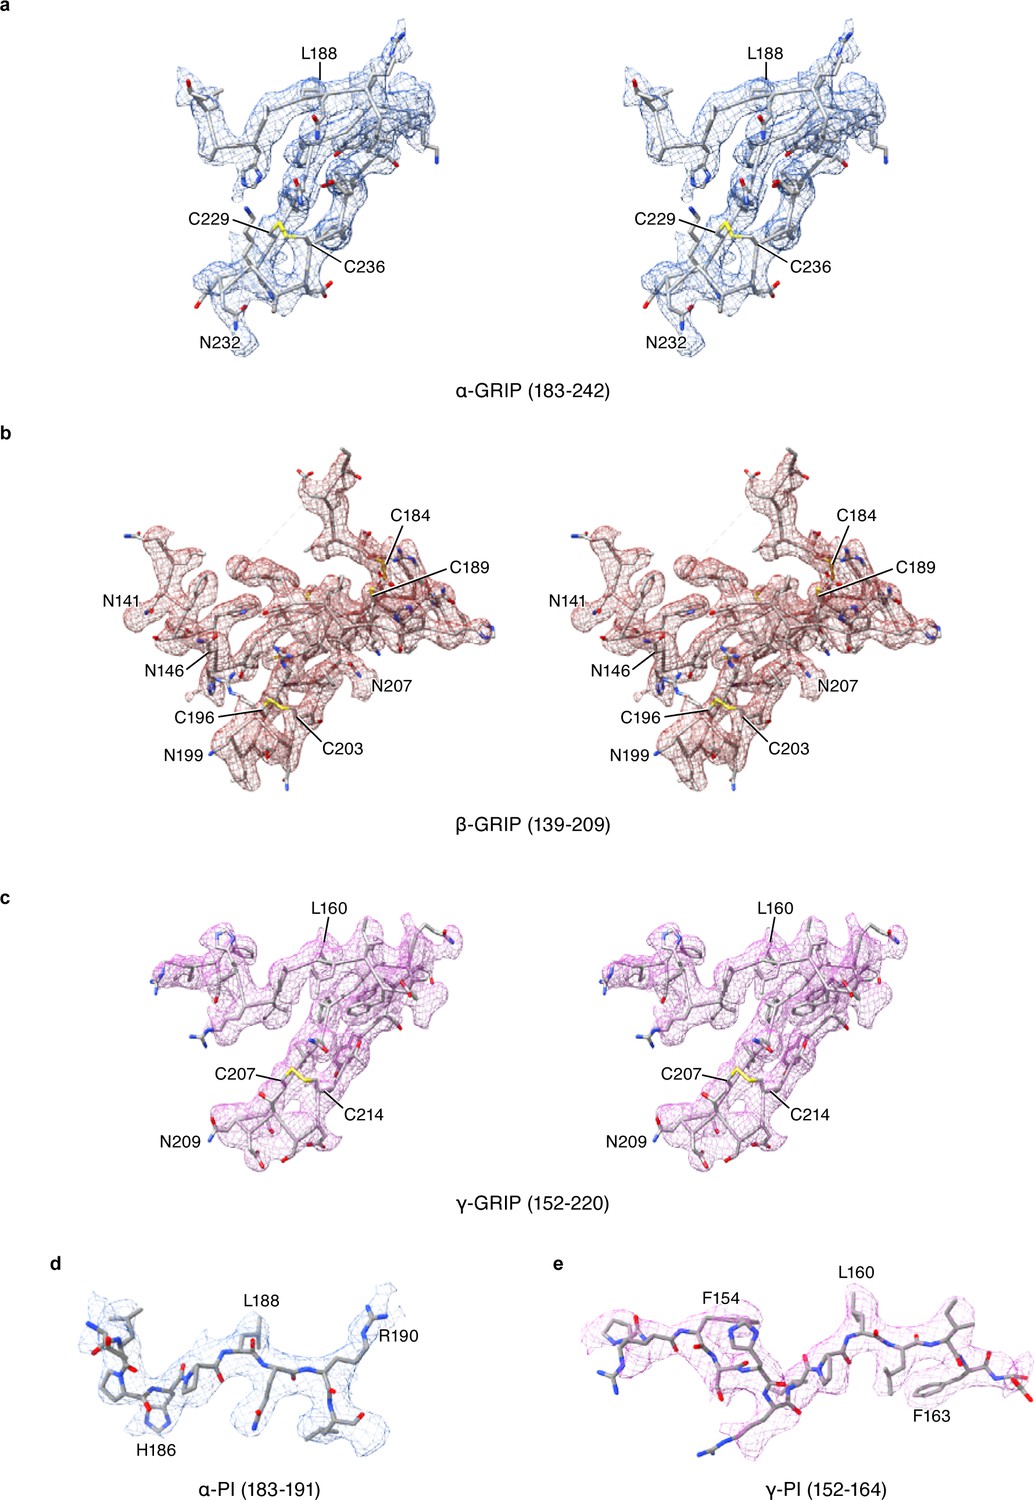
Stereoview of cryo-EM potential maps of the GRIP domain in ENaCFL map.
The α, β, and γ subunit maps are colored in blue, red and magenta colored mesh, respectively. The ENaCFL coordinates are represented in grey stick superposed with the colored mesh maps.
Figure 2 with 1 supplement
Human ENaC is a heteromeric channel with three different subunits.
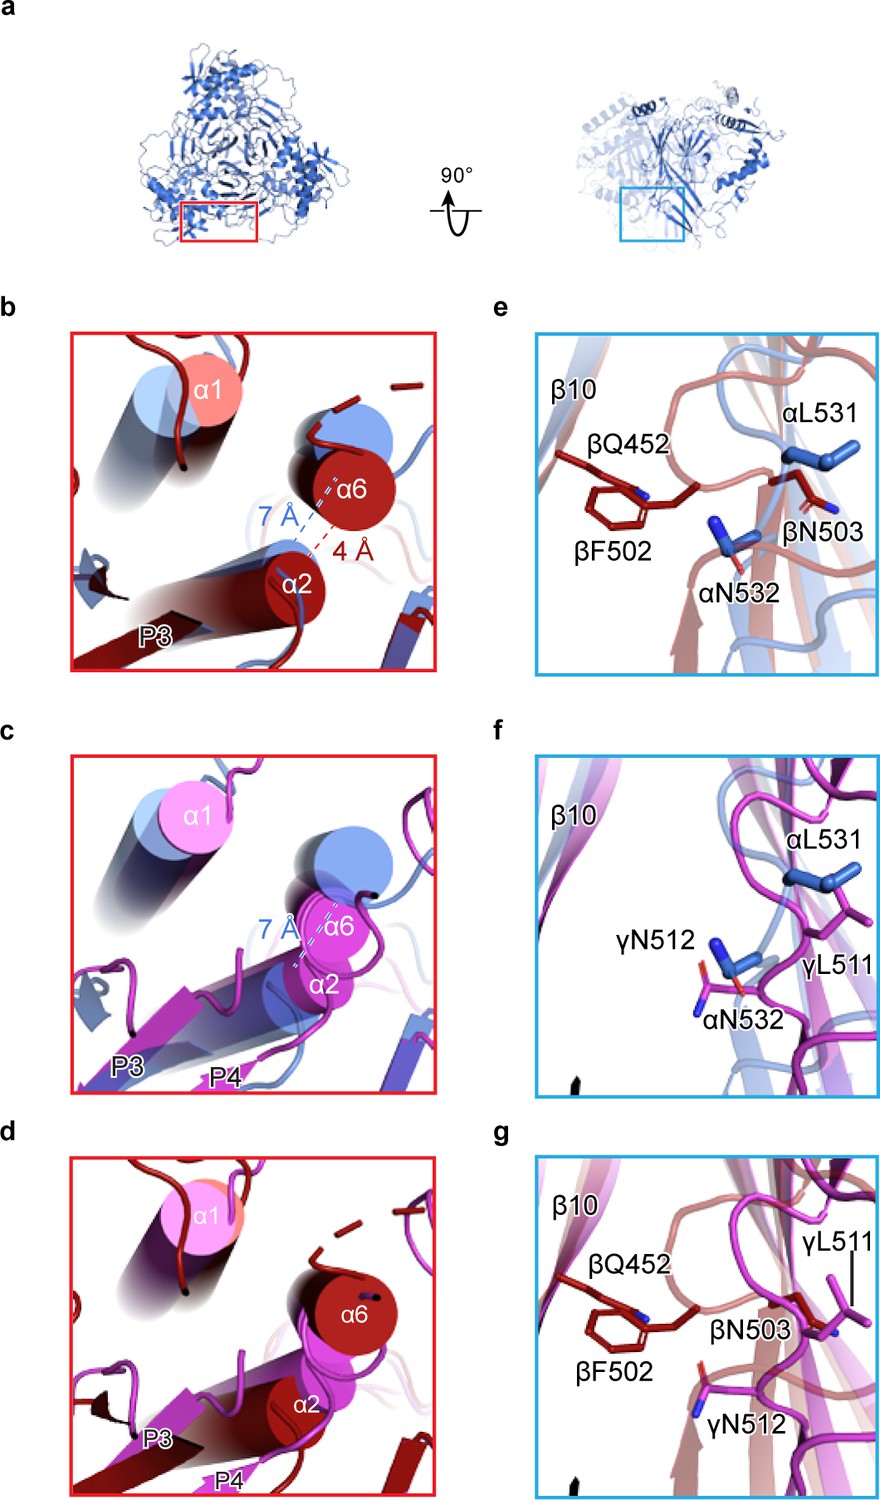
(a) Generated model of homomeric α ENaC using coordinates of the α subunit from the ENaCFL structure. The two additional α subunits that complete the trimer were generated around the three-fold axis of symmetry. (b–d) Enlarged view of the subunit interface, from the red rectangular frame in (a), focusing on the α1 and α2 helices of the finger domain from one subunit and the α6 helix of the knuckle domain from the adjacent subunit. The homomeric trimers of α, β, and γ are superposed using the coordinates of the upper palm domain. Cartoon cylinders are colored as in (Figure 1). The α2 and α6 helices are spatially accommodated in the homomeric α (b and c) while minor and major clashes are observed in homomeric β (b and d) and γ (c and d), respectively. (e–g) Close-up view of the β10 strand from one subunit and the β11-β12 linker from the adjacent subunit. The observed conformation of the α (e and f) and γ (f and g) linkers is reminiscent of the β11-β12 linker conformations of the open and closed states of chicken acid-sensing ion channel 1. Conserved leucine and asparagine residues comprise the β11-β12 linker. The adopted linker conformation in β (e and g) is similar to that of the desensitized state of cASIC1. In this conformation, there is a steric clash between Gln452 of β10 and Phe502 of the β11-β12 linker.
Figure 2—figure supplement 1
The domains within the ENaC subunits favor a heteromeric assembly.
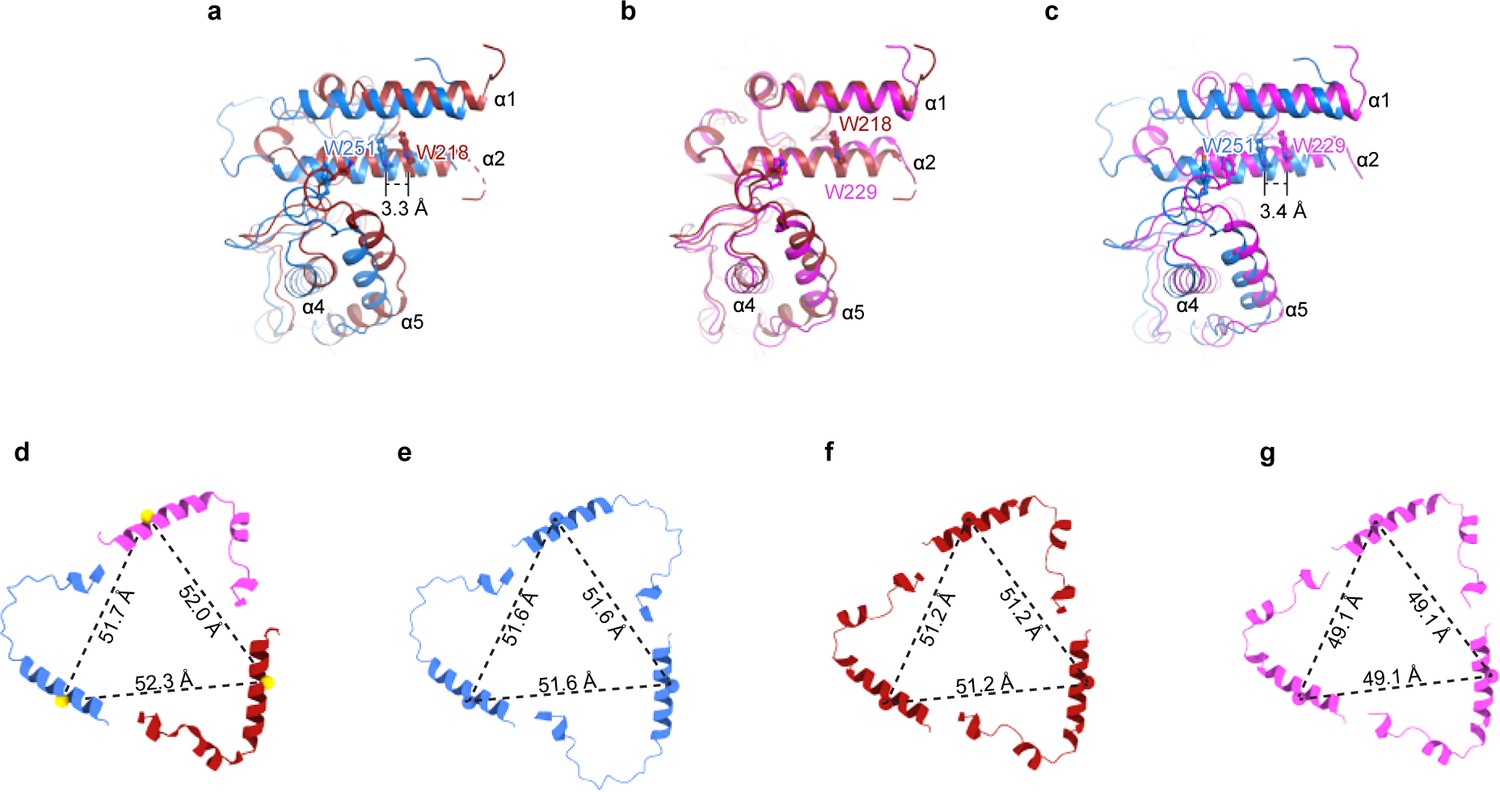
(a-c) Superpositions of the three subunits from the ENaCFL structure at the upper palm domain show that the α subunit is distinct from the β and γ subunits. There is a rigid-body shift of the α finger and thumb domains relative to the equivalent domains in the β and γ subunits. Measured distances between the Cα atoms of the conserved Trp in the α2 helices show a shift of more than 3 Å in the finger domain region. (d) The cartoon representation of the α2 helices from α, β, and γ subunits. Cα atoms of the well-defined tryptophan residues in α, β, and γ (αTrp251, βTrp218, and γ229) are shown as spheres. They form a triangle with measured distances of ~52 Å. (e–g) Cartoon representation of the α2 helices of the generated homomeric models of α (e), β (f), and γ (g) show that the trimers form smaller triangles than the heteromeric form. The γ subunit makes the smallest triangles supporting the observed major clashes between the finger and knuckle domains, as shown in Figure 2.
Figure 3
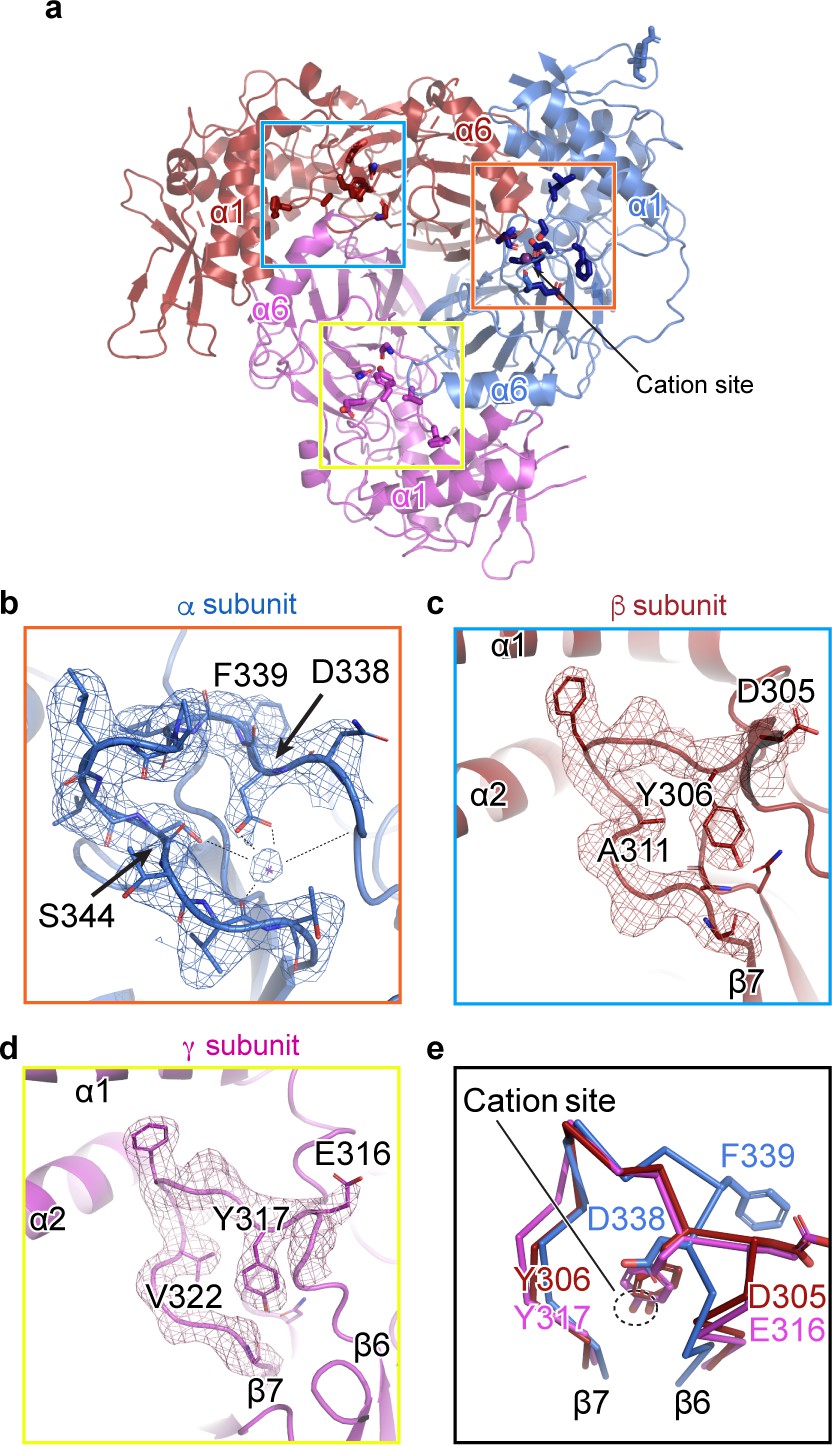
A cation binding site is located in the β6-β7 loop of the α subunit finger domain.
(a) Cartoon representation of ENaC perpendicular to the membrane. α, β and γ are colored blue, red and magenta, respectively. The orange box shows the region of the cation site that is speculated to be a Na+ ion in the α subunit (b). The blue and yellow box represent the equivalent region, not occupied by a cation, in β (c) and γ (d) subunit, respectively. (b–c) Model of the β6-β7 loop superimposed with the potential map for the α subunit (b), β subunit (c) and γ subunit (d). (b) View of the cation site in the α subunit. The electrostatic potential of the β6-β7 loop and the Na+ is shown as a mesh. Dashed lines indicate distances of 2.5 – 3.4 Å. Residues shown with dashed lines are Leu135, Glu335, Asp338, and Val346. Ser344 is 3.8 Å away from the Na+. (c, d) Views of the equivalent regions in β (c) and γ (d). The residues occupying the equivalent position as Ser344 in α are alanine in β and valine in γ. (e) Superposition of the β6-β7 loops of all subunits demonstrate a striking difference in conformation in the α subunit. The acidic αAsp338 faces towards the Na+ site and Phe339 faces away from the cation site. The residues in the β and γ loops adopt a swapped conformation relative to the α subunit in which the aromatic residues are facing the equivalent sites while the acidic residues are exposed in solution.
Figure 4
The inhibitory peptides in α and γ interact distinctly with the gating domains.
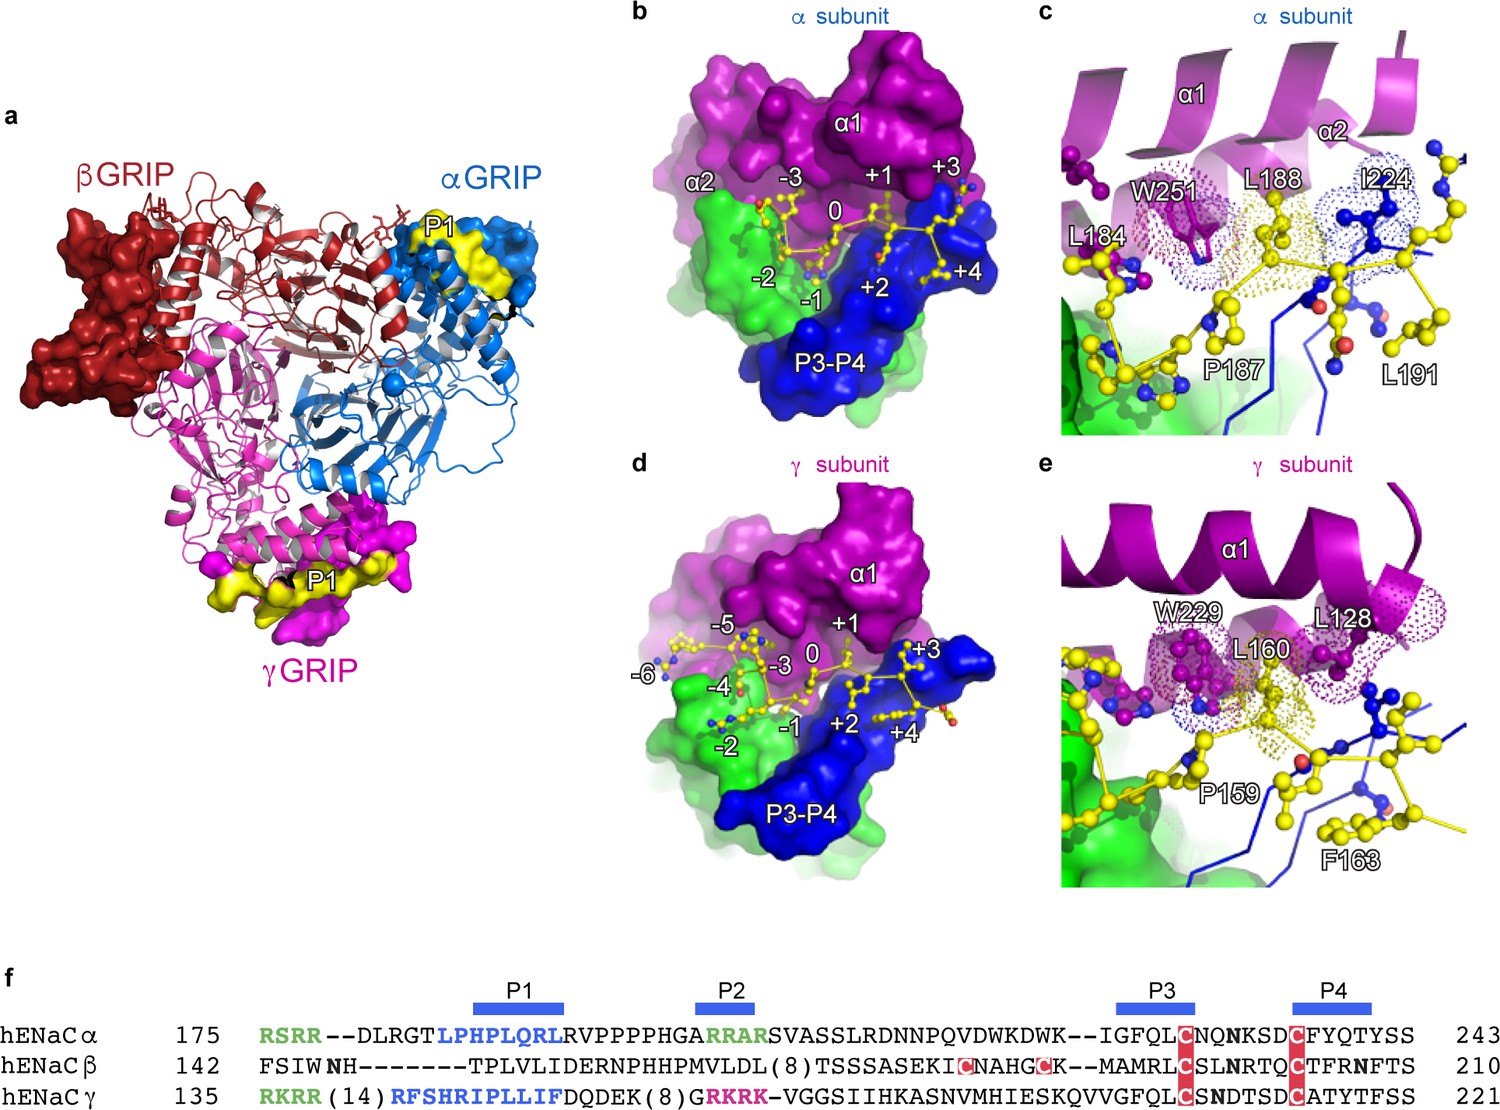
(a) Cartoon representation of ENaC perpendicular to the membrane where the GRIP domains in all three subunits are shown as surface representation. α, β and γ are colored blue, red and magenta, respectively. Additionally, the inhibitory P1 peptides of αGRIP and γGRIP are highlighted in yellow. (b) Overall view of the inhibitory peptide pocket in the α subunit. The finger, thumb, and P3-P4 strands of the GRIP domains are colored purple, green, and blue, respectively, and shown in surface. The inhibitory peptide is shown in sticks representation and colored yellow. In the α subunit, the inhibitory peptide only extends to the −3 position. (c) Close-up view of the pocket consisting of conserved residues Pro187, Leu188, and Trp251. Leu188 makes hydrophobic contacts with Trp251 from the α2 helix and Ile224 of the P3 strand of the GRIP domain. (d) Overall view of the inhibitory peptide pocket in the γ subunit. Representations are similar to (b). In the γ subunit, the inhibitory peptide extends to position −6 making more extensive contacts with the finger and thumb domains. (e) Close-up view of the binding pocket consisting of the equivalent residues shown in (c). In the γ subunit, the Leu160 primarily interacts with the residues in the α2 helix. The residues in the GRIP domain that interact with the inhibitory peptides are in sticks representation in panels (c) and (e). (f) Sequence alignment of ENaC GRIP domains (hENaCα, GenBank ID:4506815; hENaCβ, 124301096; hENaCγ, 42476333). The sequences were aligned with Clustal Omega and manually adjusted. Coloring or shading is as follows: cysteines participating in disulfide bonds are in red boxes, glycosylation sites (predicted and/or present in cryo-EM map) are shown as bold N, furin sites are in green, prostasin site in magenta, and the P1 peptides in α and γ are in blue.
Figure 5 with 3 supplements
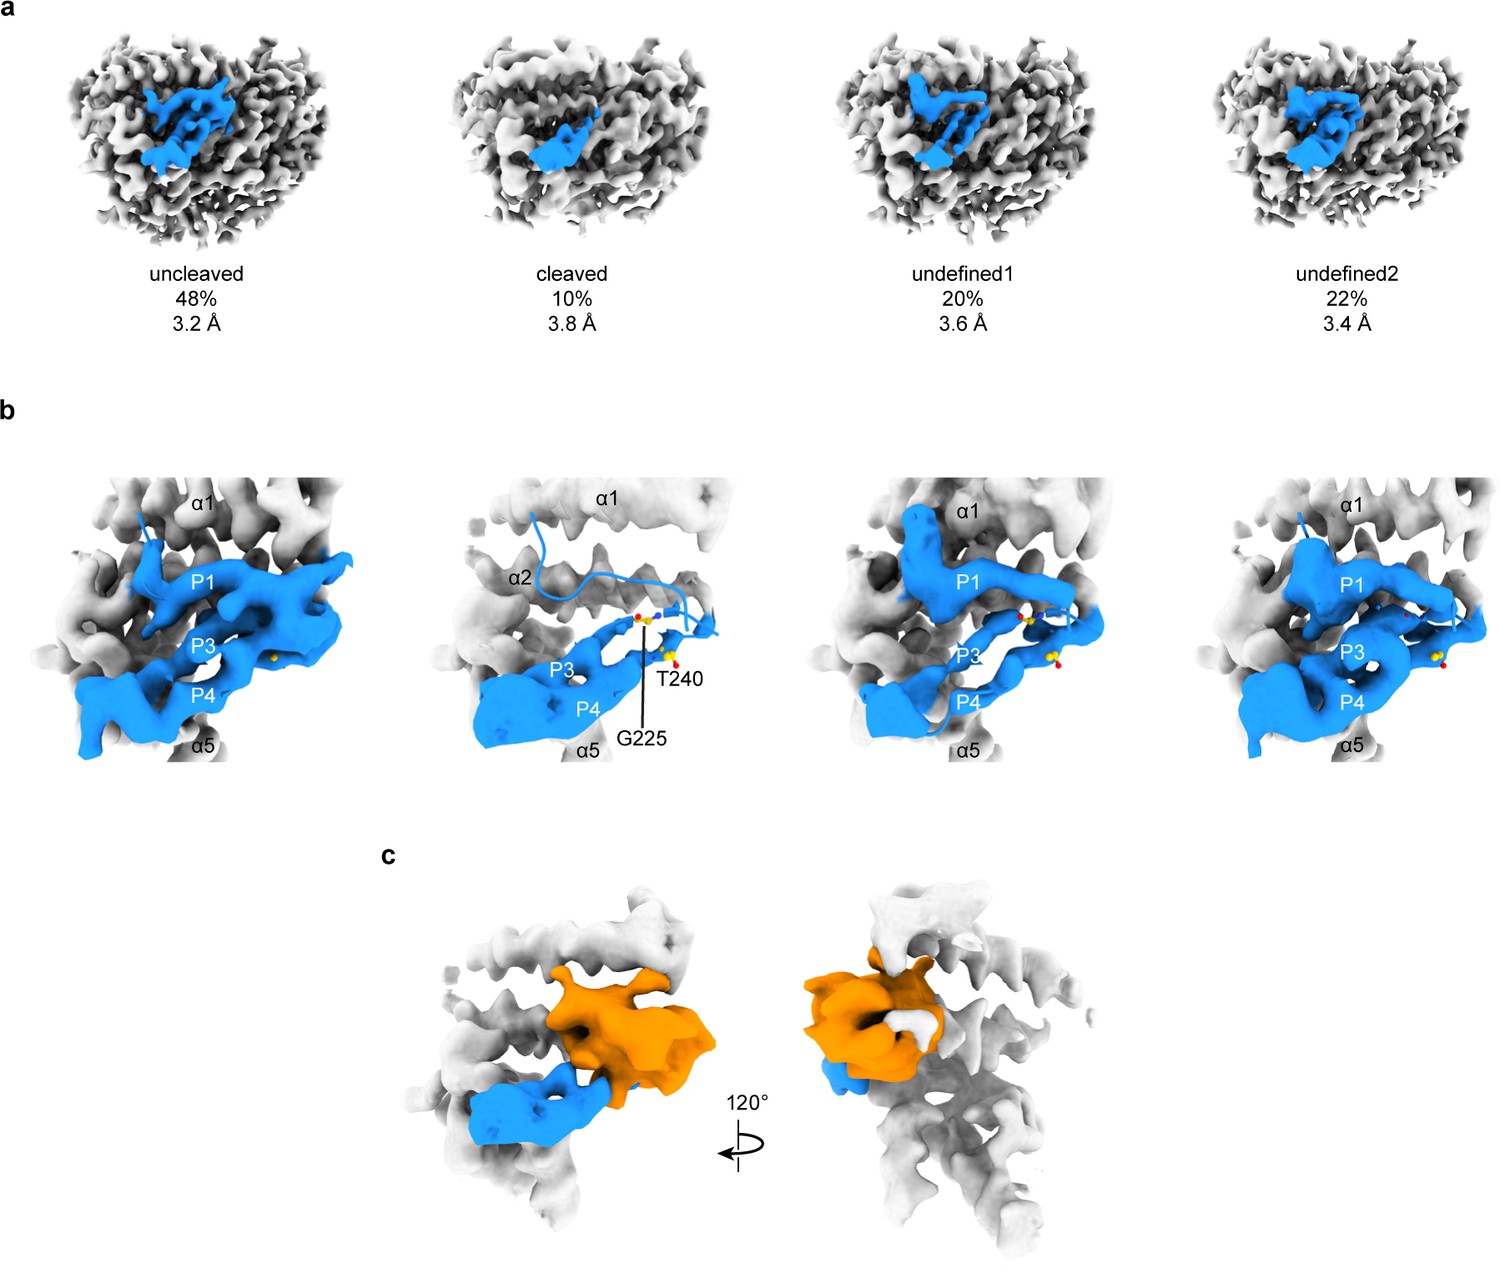
3D focused classification of the inhibitory peptide pocket in the α subunit reveals important site for ENaC regulation.
(a) 3D classification of the GRIP domain in the α subunit revealed four major classes. Two classes clearly demonstrate the uncleaved and cleaved states of the α subunit representing 48% and 10% of the particles. Five classes were initially requested. The αGRIP domain is colored in blue. The remaining region of the ENaC map is colored gray for simplicity. (b) Close-up view of the GRIP domain. Compared to the uncleaved state, the map of the cleaved state shows that the region near the P3-P4/α2 is more disordered based on the lack of well-defined features that are observed in the uncleaved state. Residues that have been identified to markedly reduce peptide inhibition when mutated to tryptophans, Gly225 and Thr240, are shown in yellow and represented in sticks. (c) The difference map (orange) overlaps with the region in the GRIP domain that is absent or more disordered in the cleaved state.
Figure 5—figure supplement 1
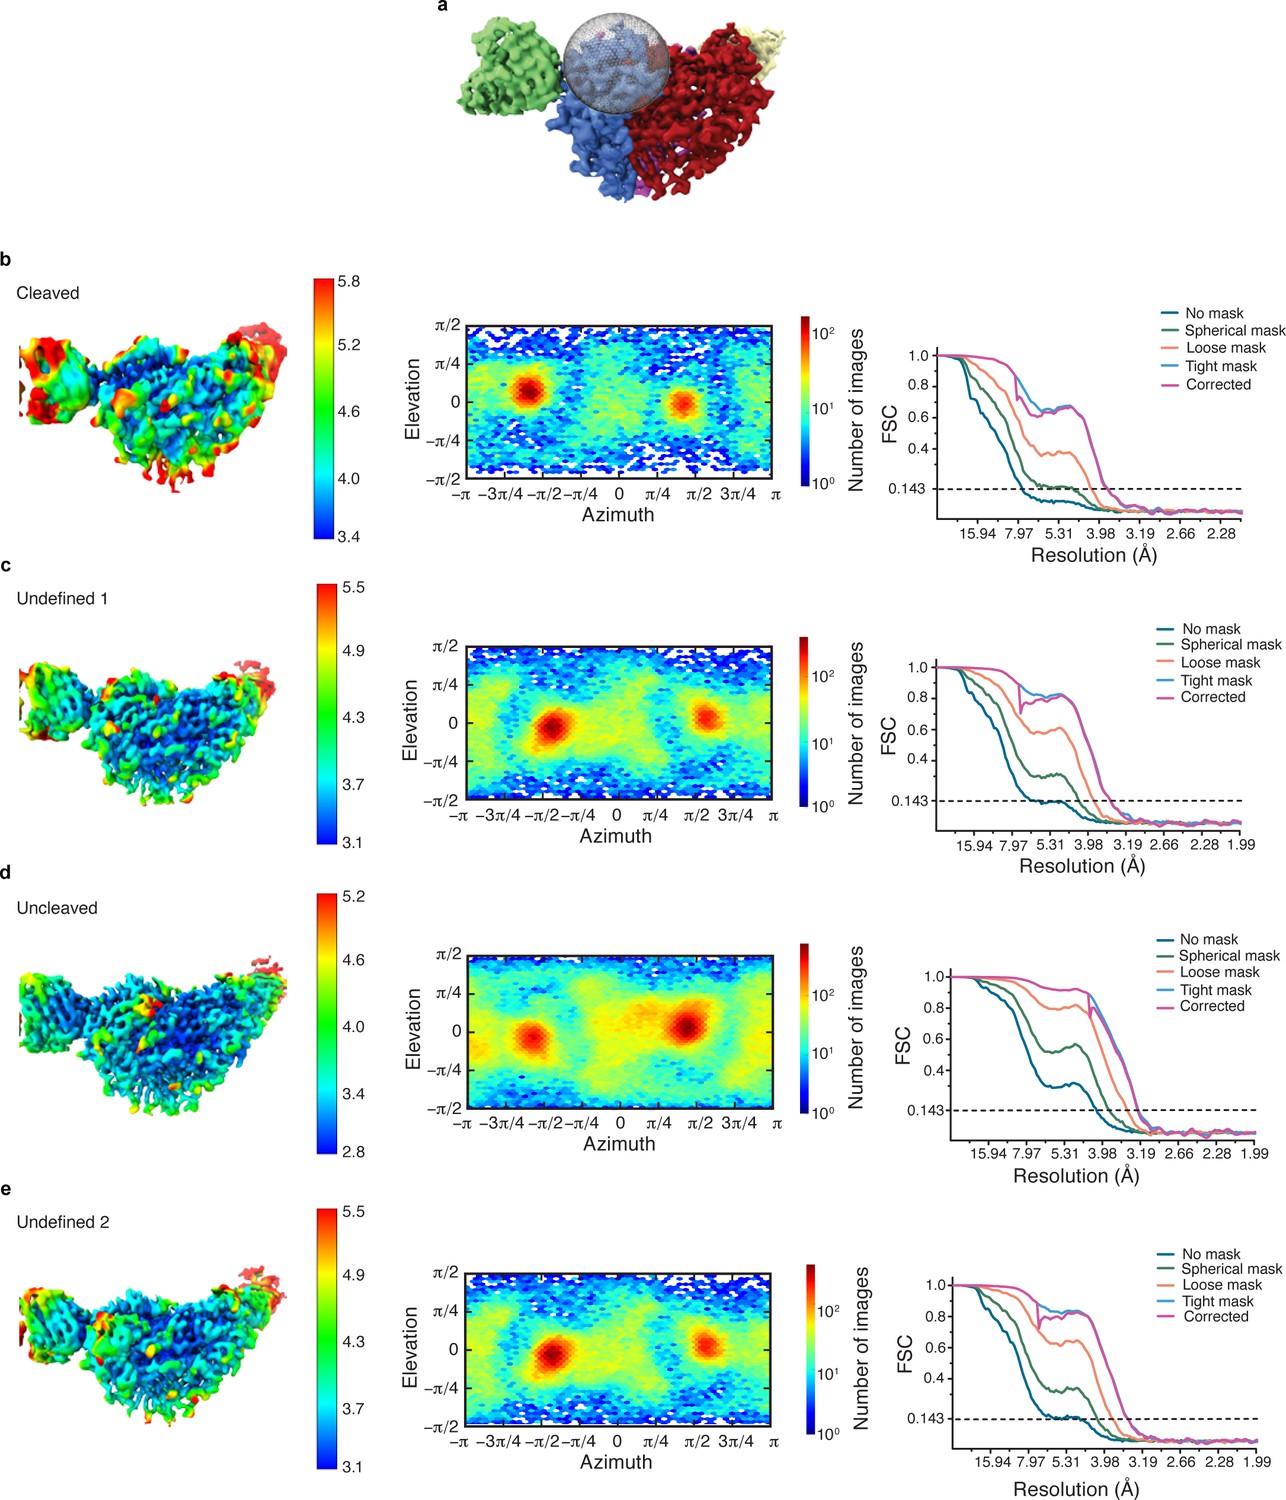
Cryo-EM data analysis of all α-GRIP classes in cryoSPARC.
(a) Illustration of the region in which focused classification was performed. (b–e) Local resolution estimate, angular distribution and gold standard FSC of the resulting four maps from focused classification (as illustrated in Figure 5a) reveal that all classes have a similar overall particle distribution for the classification performed of the α-GRIP region.
Figure 5—figure supplement 2
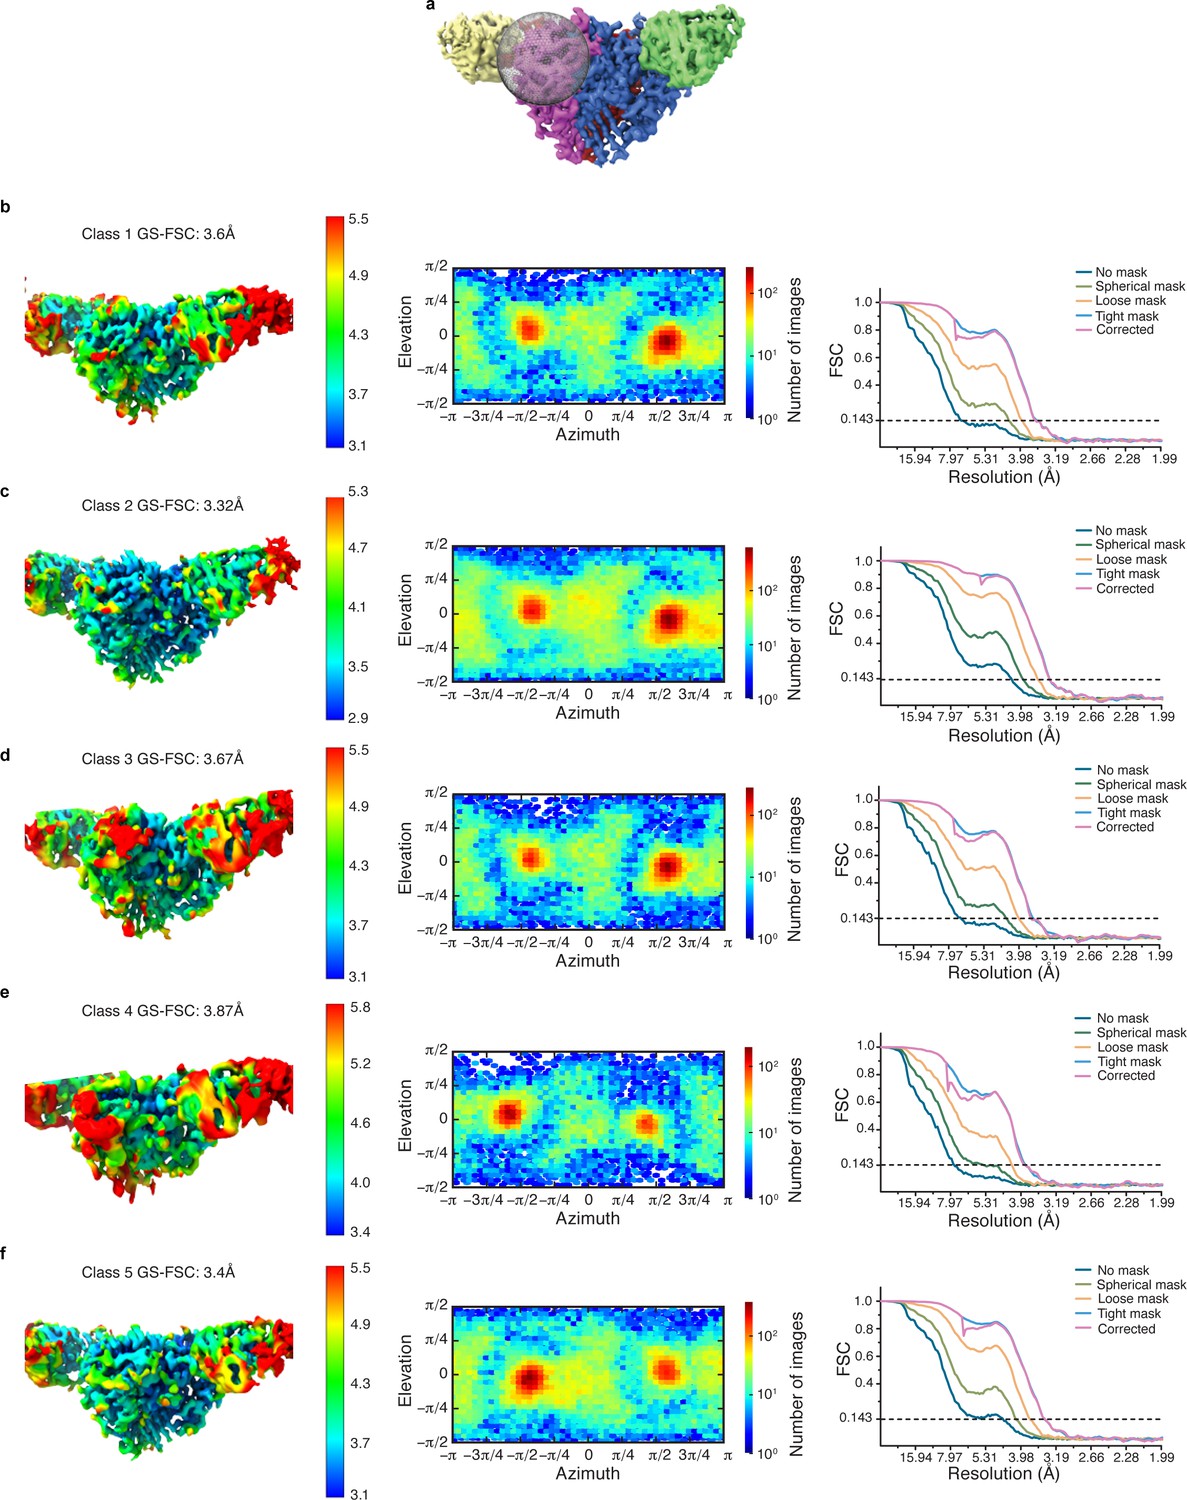
Cryo-EM data analysis of all γ-GRIP classes in cryoSPARC.
(a) Illustration of the region in which focused classification was performed. (b–f) Local resolution estimate, angular distribution and gold standard FSC of the resulting four maps from focused classification reveal that all classes have similar overall particle distribution for the classification performed of the γ-GRIP region.
Figure 5—figure supplement 3
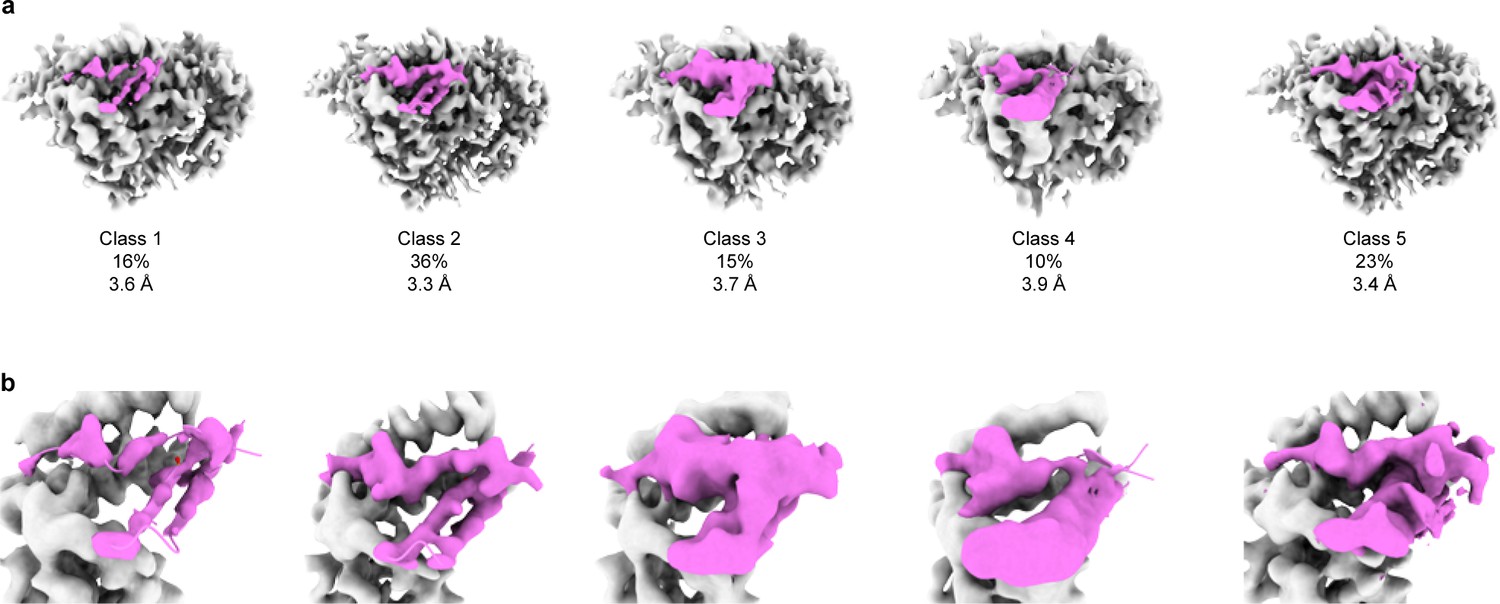
3D focused classification of the inhibitory peptide pocket in the γ subunit demonstrates heterogeneity in the inhibitory peptide cleavage states.
(a) 3D classification of the GRIP domain in the γ subunit revealed five major classes. The major class representing 36% of the particles clearly demonstrate the uncleaved state of the γ subunit. As in the αGRIP classification, five classes were initially requested. The γGRIP domain is colored in magenta and the remaining region of the ENaC map is colored gray for simplicity. (b) Close-up view of the GRIP domain. Comparison of the GRIP domain maps reveals distinct features near the P3-P4 strands.
Figure 6
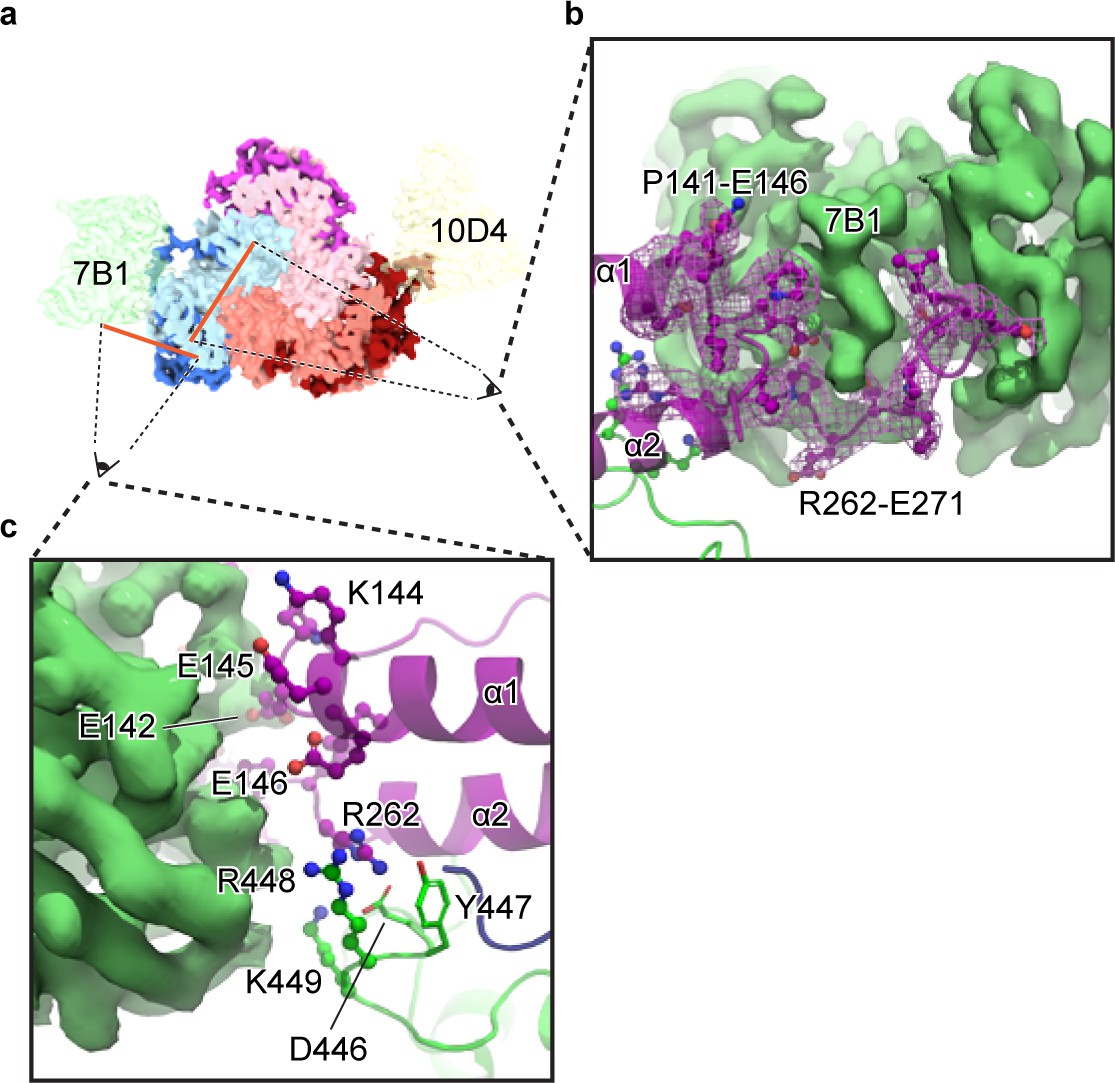
The 7B1 Fab binds to the α subunit making contacts with residues in the finger and thumb domains.
(a) Top-down view of the ENaCFL in complex with 7B1 and 10D4. The subunits and Fabs are colored as in Figure 1. (b) View of the interaction between the 7B1 Fab and the α2/α3 helices of the finger domain. The finger domain weaves within the binding region of the Fab. (c) Another view of the interaction between 7B1 and α subunit mediated by the finger and thumb domains. Acidic and basic residues that belong to the α subunit primarily mediate the interactions.
Figure 7 with 1 supplement
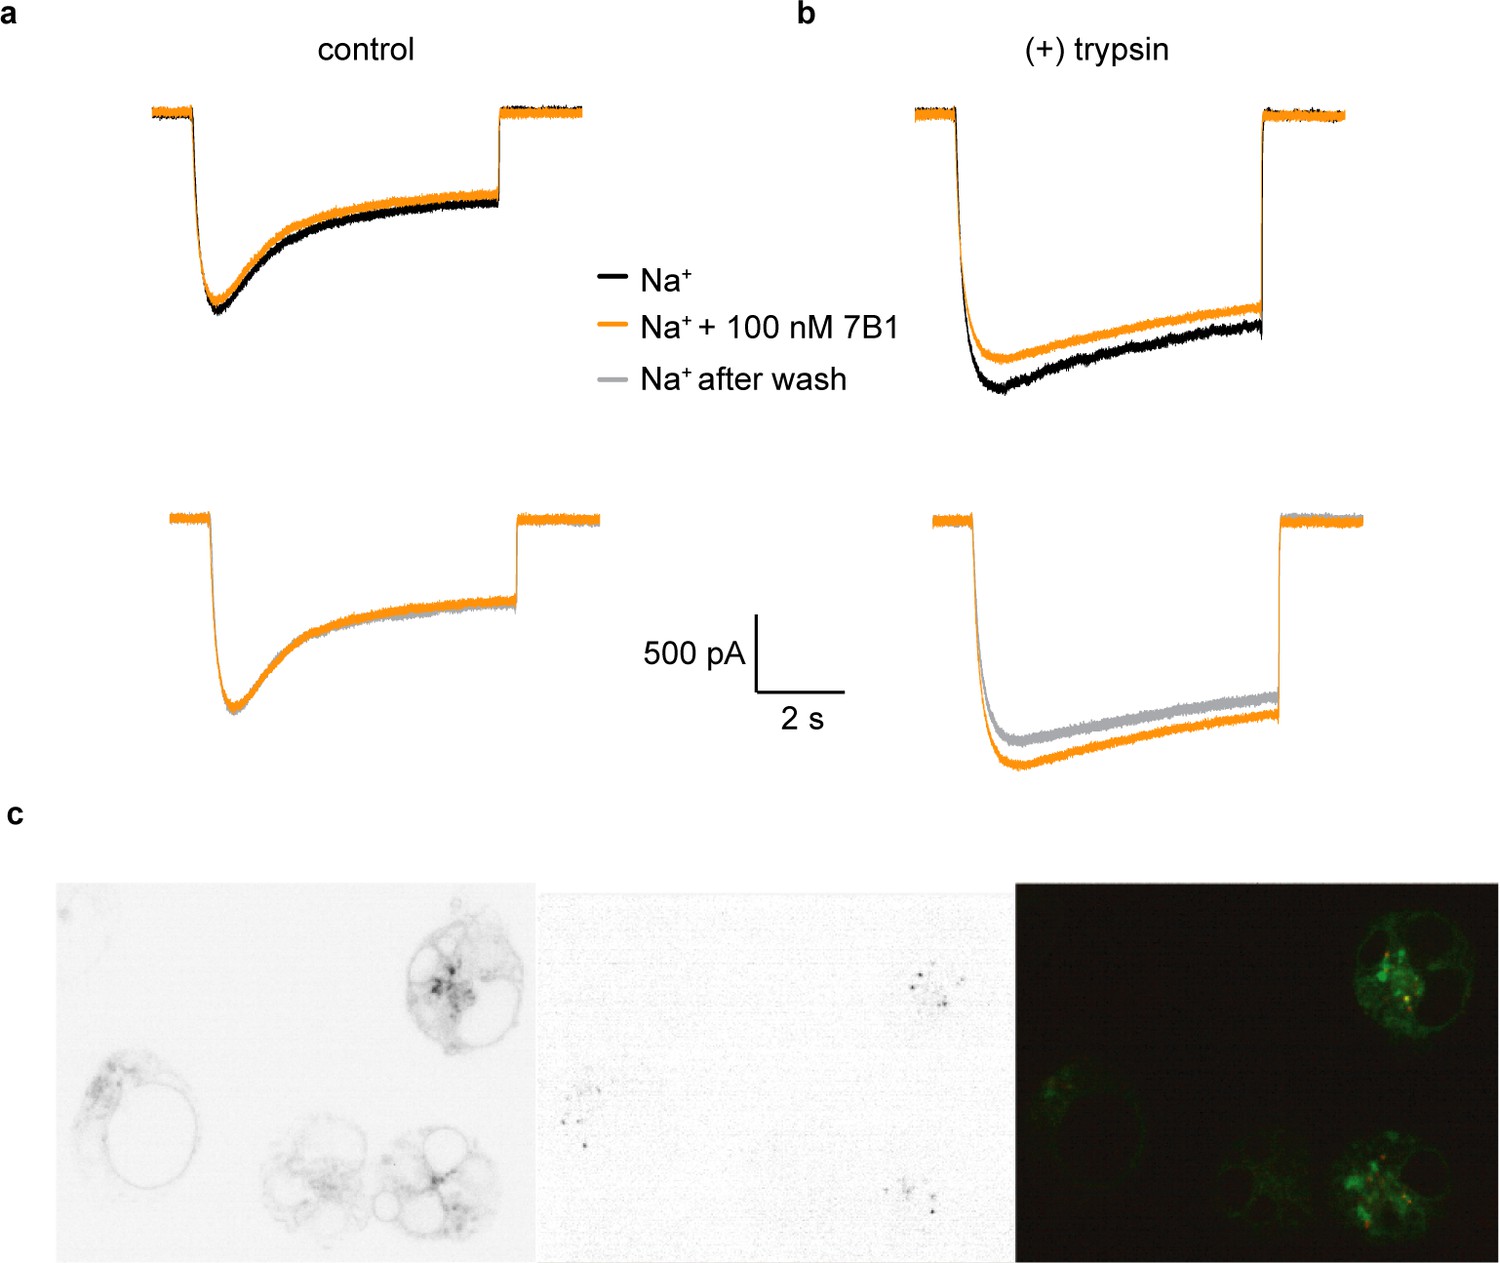
7B1 binds to the α subunit independent of the cleavage state of the α subunit.
(a) Whole-cell patch clamp measurements of ENaC-mediated Na+ current indicate the 7B1 Fab does not alter current amplitude and shape. (b) Similar to the control current, 7B1 does not mediate acute effects of trypsin-cleaved ENaC. (c) Live confocal microscopy of HEK293S GNTI- cells expressing ENaCFL with eGFP fusion (left panel) are stained with TRITC labeled 7B1mAb (middle), recognizing the α subunit. The overlay of the GFP and TRITC channels (yellow, right panel) show that 7B1 mAb binds to ENaCFL that are expressed on the cell surface. Images were acquired at a pixel size of 0.13 μm for two different wavelengths at 488 nm and 561 nm. The samples were binned 2 × 2 and the exposure time was 400 ms for 488 nm and 1 s for 561 nm.
Figure 7—figure supplement 1
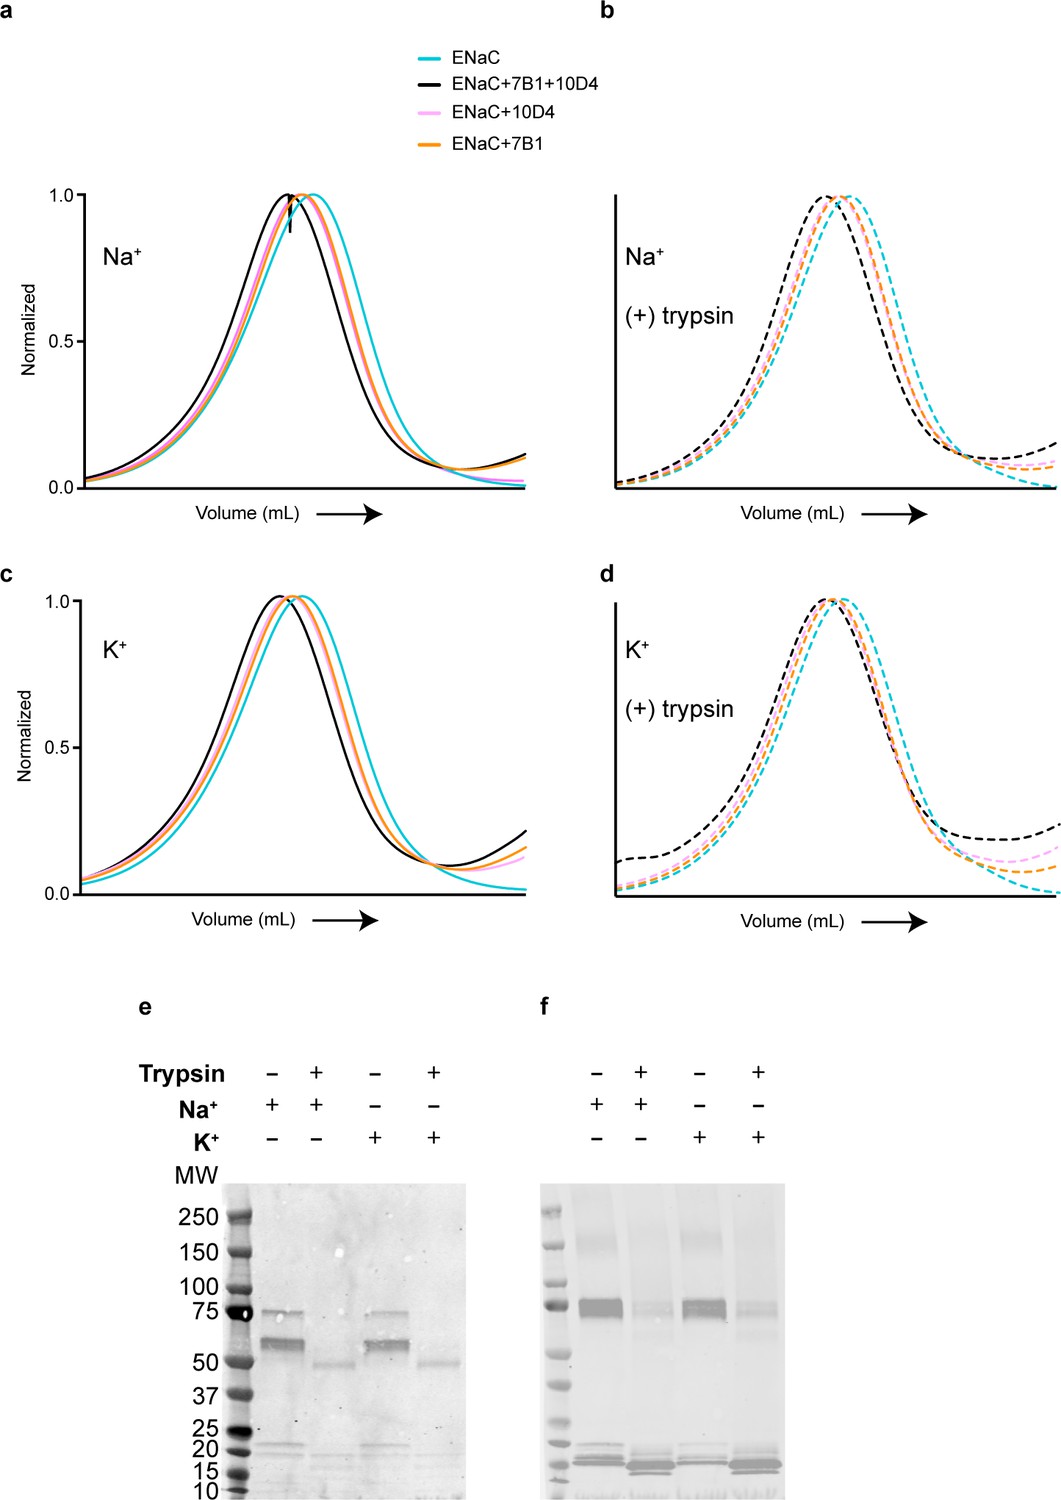
7B1 binds to both uncleaved and cleaved ENaCFL.
(a, b) Biochemical characterization by Fluorescence size-exclusion chromatography (FSEC) shows that the 7B1 Fab binds to purified uncleaved (a) and cleaved ENaCFL (b) in the presence of 150 mM NaCl and 20 mM HEPES pH 7.4. The cleaved ENaCFL was exposed to trypsin prior to further clarification of the sample by size-exclusion chromatography. (c, d) The presence of K+ does not alter binding of 7B1 to uncleaved (c) and cleaved (d) ENaCFL as determined by FSEC. (e, f) Western blot analysis of uncleaved and trypsin-cleaved ENaCFL in the presence of 150 mM NaCl or 150 mM KCl. Samples were processed exactly as for FSEC. (e) The blot was probed with an antibody for the α subunit (αENaC, sc-21012). Before trypsin treatment, bands can be seen at 75 and 60 kDa which are expected sizes for α ENaC. Following trypsin treatment, those bands are no longer present and a new band is seen at approximately 50 kDa whether in a Na+ or K+ solution. (f) The blot was probed with an antibody for the γ subunit (γENaC, ab133430). Bands are seen at 75 kDa before addition of trypsin. Following trypsin treatment, there is decreased intensity of the 75 kDa band and new bands at smaller molecular weight indicating that the γ subunit is cleaved by trypsin. We do not observe a band near the 50 kDa MW marker likely due to loss of binding epitope for the antibody.
Author response image 1
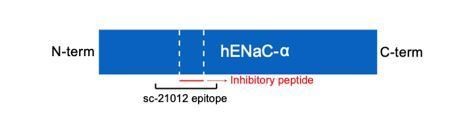
Schematic illustration of human ENaC-α subunit (hENaC-α).
The two furin sites are illustrated as white dotted lines. The location of the epitope for the polyclonal antibody SC-210112 is illustrated in the schematic.
Tables
Table 1
IC50 values of ENaC for three different blockers (amiloride, phenamil mesylate and benzamil).
IC50 values (mean ± S.E.M) determined from dose-response curves for three different blockers (amiloride, phenamil mesylate and benzamil) at different holding voltages (-60 mV, -40 mV, -20 mV, 0 mV).
| IC50 values (nM) | |||
|---|---|---|---|
| Amiloride | Phenamil | Benzamil | |
| 0 mV -20 mV -40 mV -60 mV | 97.14 ± 21.62 80.05 ± 8.78 80.25 ± 11.37 86.34 ± 27.04 | 51.37 ± 10.42 49.97 ± 11.18 43.37 ± 11.86 51.01 ± 14.12 | 36.74 ± 13.25 29.41 ± 6.47 27.72 ± 6.65 32.90 ± 12.66 |
Table 2
Statistics of data collection, three-dimensional reconstruction, and model refinement.
| ENaCFL | |||
|---|---|---|---|
| Pre-merge dataset | 1 | 2 | 3 |
| Material Source | Membrane | Whole cell | Whole cell |
| Detergent | Digitonin | Digitonin | Digitonin |
| Fab | 7B1 and 10D4 | 7B1 and 10D4 | 7B1 and 10D4 |
| Microscope | FEI Krios | FEI Krios | FEI Krios |
| Voltage (kV) | 300 | 300 | 300 |
| Detector | Gatan K2 Summit | Gatan K2 Summit | Gatan K2 Summit |
| Defocus range (µm) | −0.8 – −2.2 | −0.8 – −2.2 | −0.8 – −2.2 |
| Exposure time (s) | 3 | 3 | 3 |
| Dose rate (e−/Å2/frame) | 1.0 | 1.0 | 1.0 |
| Frames per movie | 60 | 60 | 60 |
| Pixel size (Å) | 0.415 | 0.415 | 0.415 |
| Total dose (e−/Å2) | 60 | 60 | 60 |
| Motion correction | UCSF MotionCor2 | UCSF MotionCor2 | UCSF MotionCor2 |
| CTF estimation | CTFFIND 4 | CTFFIND 4 | CTFFIND 4 |
| Particle picking | cryoSPARC blob | cryoSPARC blob | cryoSPARC blob |
| 2D/3D classification | cryoSPARC 2.11 | cryoSPARC 2.11 | cryoSPARC 2.11 |
| 3D classification and refinement | Relion 3.0, | Relion 3.0, | Relion 3.0, |
| cryoSPARC 2.11, | cryoSPARC 2.11, | cryoSPARC 2.11, | |
| cisTEM 1.0 | cisTEM 1.0 | cisTEM 1.0 | |
| Symmetry | C1 | C1 | C1 |
| Particles processed | 172 954 | 218 428 | 71 549 |
| Resolution masked (Å) | 3.57 | 3.05 | 3.96 |
| Map Sharpening B-factor (Å2) | 91.8 | 87.3 | 97.9 |
| cryoSPARC 2.11 merged map | |||
| Merged Symmetry | C1 | ||
| Merged particle count | 252 071 | ||
| Merged resolution masked (Å) | 3.06 | ||
| cisTEM 1.0.0 merged map | |||
| Merged Symmetry | C1 | ||
| Merged particle count | 248 079 | ||
| Merged resolution masked (Å) | 3.11 | ||
| Initial model | 6BQN | ||
| Non-hydrogen atoms | 11 740 | ||
| Protein residues | 1 594 | ||
| Ligands (Na+, NAG) | 1, 10 | ||
| Resolution (FSC = 0.143, Å) | 3.06 | ||
| Molprobity score | 1.37 | ||
| Cβ deviations | 0 | ||
| Poor rotamers | 0.84% | ||
| Ramachandran outliers | 0 | ||
| Ramachandran allowed | 2.7% | ||
| Ramachandran favored | 97.3% | ||
| Bond length rmsd (Å) | 0.002 | ||
| Bond angle rmsd (°) | 0.390 | ||
Key resources table
| Reagent type (species) or resource | Designation | Source or reference | Identifiers | Additional information |
|---|---|---|---|---|
| Gene (Homo sapiens) | Amiloride-sensitive sodium channel subunit alpha isoform 1 | Synthetic | NCBI Reference Sequence: NP_001029.1 | Gene synthesized by BioBasic |
| Gene (Homo sapiens) | Amiloride-sensitive sodium channel subunit beta | Synthetic | NCBI Reference Sequence: NP_000327.2 | Gene synthesized by BioBasic |
| Gene (Homo sapiens) | Amiloride-sensitive sodium channel subunit gamma | Synthetic | NCBI Reference Sequence: NP_001030.2 | Gene synthesized by BioBasic |
| Cell line (Homo sapiens) | HEK293T/17 | ATCC | Cat #ATCC CRL-11268 | |
| Cell line (Homo-sapiens) | HEK293S GnTI- | ATCC | Cat #ATCC CRL-3022 | |
| Antibody | 7B1 mouse monoclonal | OHSU VGTI, Monoclonal Antibody Core | AB_2744525 | Isotype IgG2a, kappa, 1:2 molar ratio |
| Antibody | 10D4 mouse monoclonal | OHSU VGTI, Monoclonal Antibody Core | AB_2744526 | Isotype IgG1, kappa. 1:2 molar ratio |
| Recombinant DNA reagent | pEG BacMam | Gift from Eric Gouaux | Doi: 10.1038/nprot.2014.173 | |
| Chemical compound, drug | Amiloride hydrochloride hydrate | Sigma | Cat#: A7410 | |
| Chemical compound, drug | Phenamil Mesylate | Tocris | Cat#: 3379 | |
| Chemical compound, drug | Benzamil hydrochloride hydrate | Sigma | Cat#: B2417 | |
| Other | TRITC | ThermoFischer | Cat#: 46112 | |
| Software algorithm | HOTSPUR | Doi: 10.1017/s1431927619006792 | ||
| Software algorithm | MotionCor2 | Doi:10.1038/nmeth.4193 | SCR_016499 | https://emcore.ucsf.edu/ucsf-motioncor2 |
| Software algorithm | Ctffind4 | Doi: 10.1016/j.jsb.2015.08.008 | RRID:SCR_016732 | https://grigoriefflab.umassmed.edu/ctffind4 |
| Software algorithm | CryoSPARC | Doi:10.1038/nmeth.4169 | SCR_016501 | https://cryosparc.com/ |
| Software algorithm | cisTEM1.0.0 | Doi: 10.7554/eLife.35383 | SCR_016502 | https://cistem.org/ |
| Software algorithm | pyem | Doi: 10.5281/zenodo.3576633 | https://github.com/asarnow/pyem | |
| Software algorithm | Pymol | Pymol Molecular Graphics System, Schrodinger, LLC | RRID:SCR_000305 | http://www.pymol.org/ |
| Software algorithm | UCSF Chimera | Doi: 10.1002/jcc.20084 | RRID:SCR_004097 | http://plato.cgl.ucsf.edu/chimera/ |
| Software, algorithm | UCSF ChimeraX | Doi: 10.1002/pro.3235 | RRID:SCR_015872 | https://www.cgl.ucsf.edu/chimerax/ |
| Software, algorithm | Coot | Doi: 10.1107/S0907444910007493 | RRID:SCR_014222 | https://www2.mrc-lmb.cam.ac.uk/personal/pemsley/coot/ |
| Software, algorithm | Phenix | Doi:10.1107/S2059798318006551 | RRID:SCR_014224 | https://www.phenix-online.org/ |
| Software, algorithm | MolProbity | Doi:10.1107/S0907444909042073 | RRID:SCR_014226 | http://molprobity.biochem.duke.edu |
Additional files
Download links
A two-part list of links to download the article, or parts of the article, in various formats.
Downloads (link to download the article as PDF)
Open citations (links to open the citations from this article in various online reference manager services)
Cite this article (links to download the citations from this article in formats compatible with various reference manager tools)
Molecular principles of assembly, activation, and inhibition in epithelial sodium channel
eLife 9:e59038.
https://doi.org/10.7554/eLife.59038


