Constitutive activation of cellular immunity underlies the evolution of resistance to infection in Drosophila
- Department of Genetics, University of Cambridge, United Kingdom
- Centre de Biologie du Développement, Centre de Biologie Intégrative, University Paul Sabatier, France
Figures
Figure 1
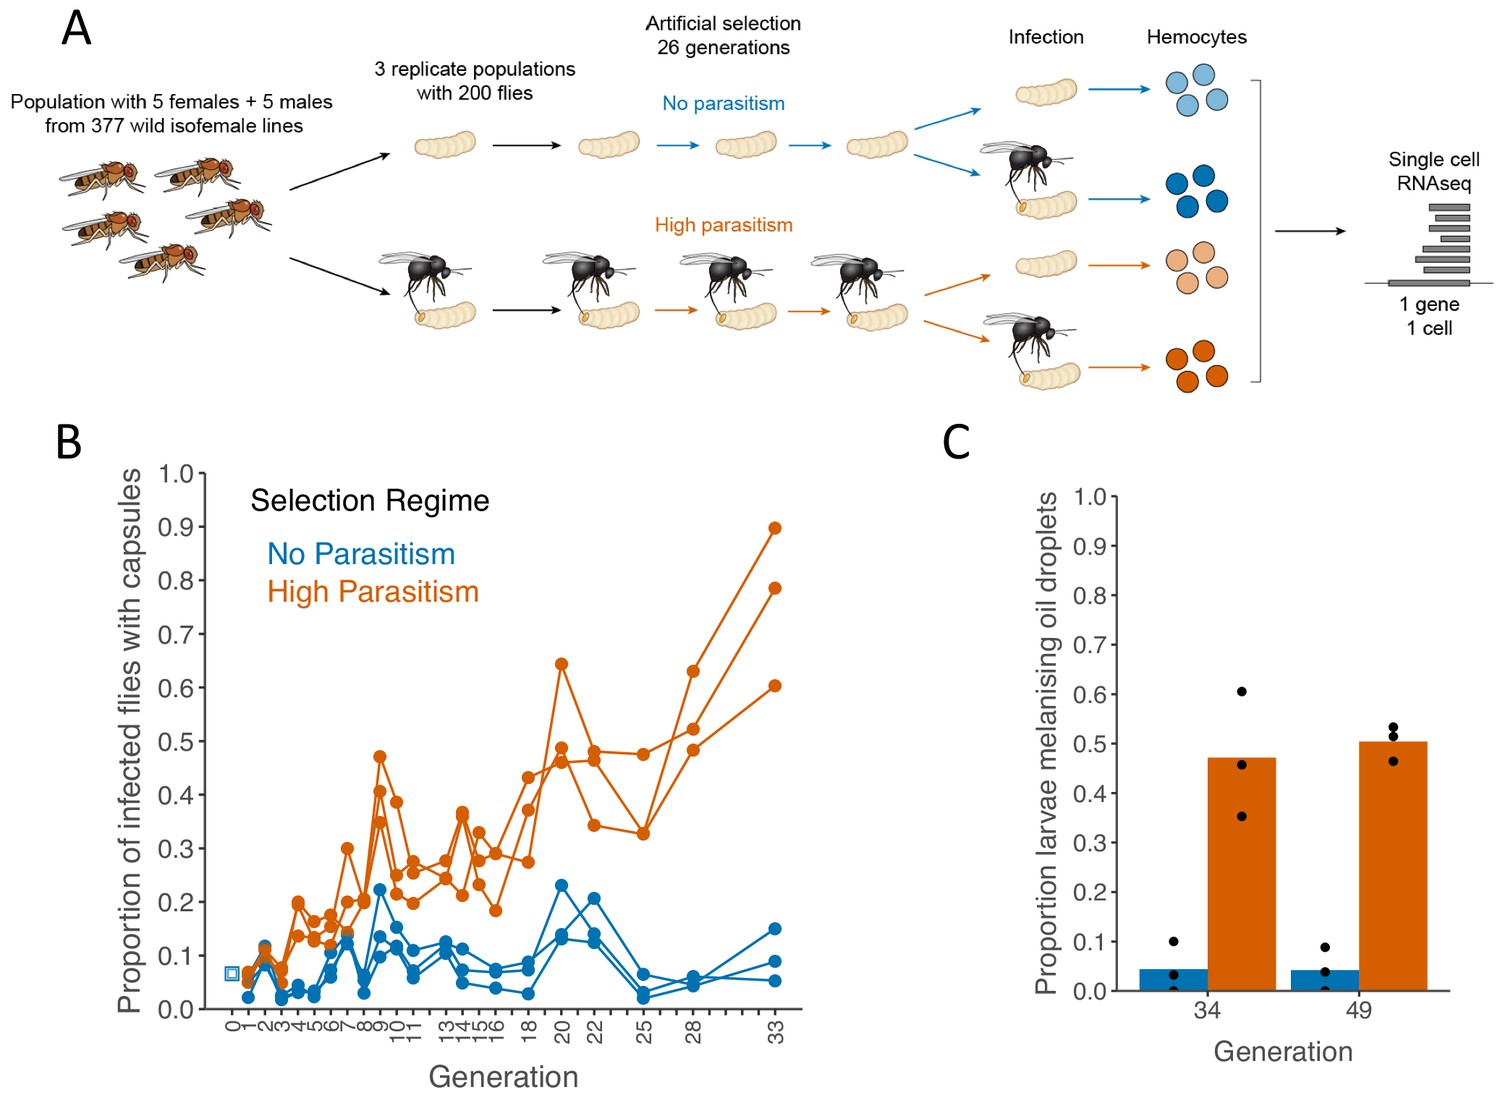
Encapsulation rate during selection for parasitoid resistance.
(A) Schematic of the experiment (B) The proportion of infected larvae that gave rise to adult flies with visible capsules. An outbred population of D. melanogaster (source, blue square) was used to create six populations that were parasitized every generation with L. boulardi (high parasitism, orange) or maintained without infection (no parasitism, blue). (C) Proportion of larvae encapsulating oil droplets at generations 33 and 49. Dots represent the proportion calculated from 15 to 40 injected larvae in triplicate populations from each selection regime. Bar heights represent the mean per selection regime.
-
Figure 1—source data 1
Encapsulation rate during selection for parasitoid resistance.
- https://cdn.elifesciences.org/articles/59095/elife-59095-fig1-data1-v2.xlsx
Figure 2 with 1 supplement
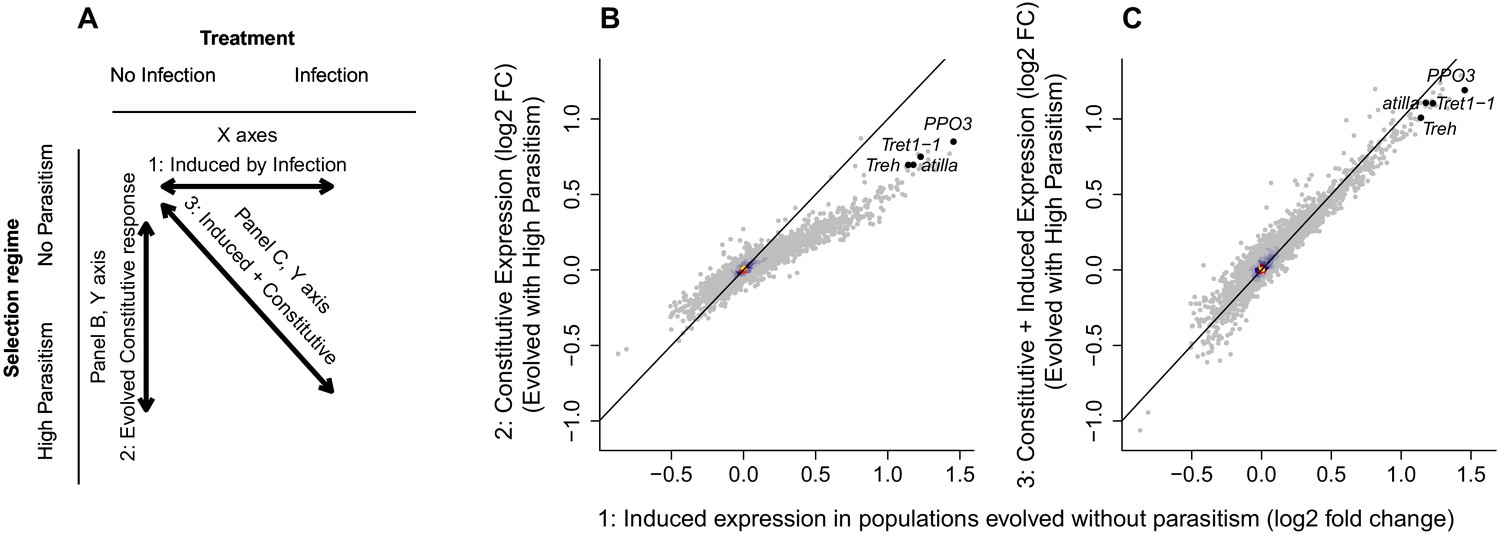
Changes in gene expression following selection for resistance and parasitoid infection.
(A) Summary of the comparisons shown in the other panels. (B) The change in gene expression following infection in populations maintained without parasitoid infection (x axis) compared to the constitutive gene expression following 26 generations of selection for resistance to the parasitoid wasp L. boulardi (y axis). (C) The change in gene expression following infection in populations maintained without parasitoid infection (x axis) compared to the combined induced and constitutive change in gene expression following selection for resistance and infection (y axis). The black diagonals indicate the 1:1 line. The genes atilla, PPO3, Trehalase and Tret1-1 are highlighted. Colour represents the density of overlain points. Relative expression is expressed as log2(fold change).
-
Figure 2—source data 1
Log2 fold change in gene expression following selection and/or infection with parasitoid wasp L.boulardi.
- https://cdn.elifesciences.org/articles/59095/elife-59095-fig2-data1-v2.csv
Figure 2—figure supplement 1
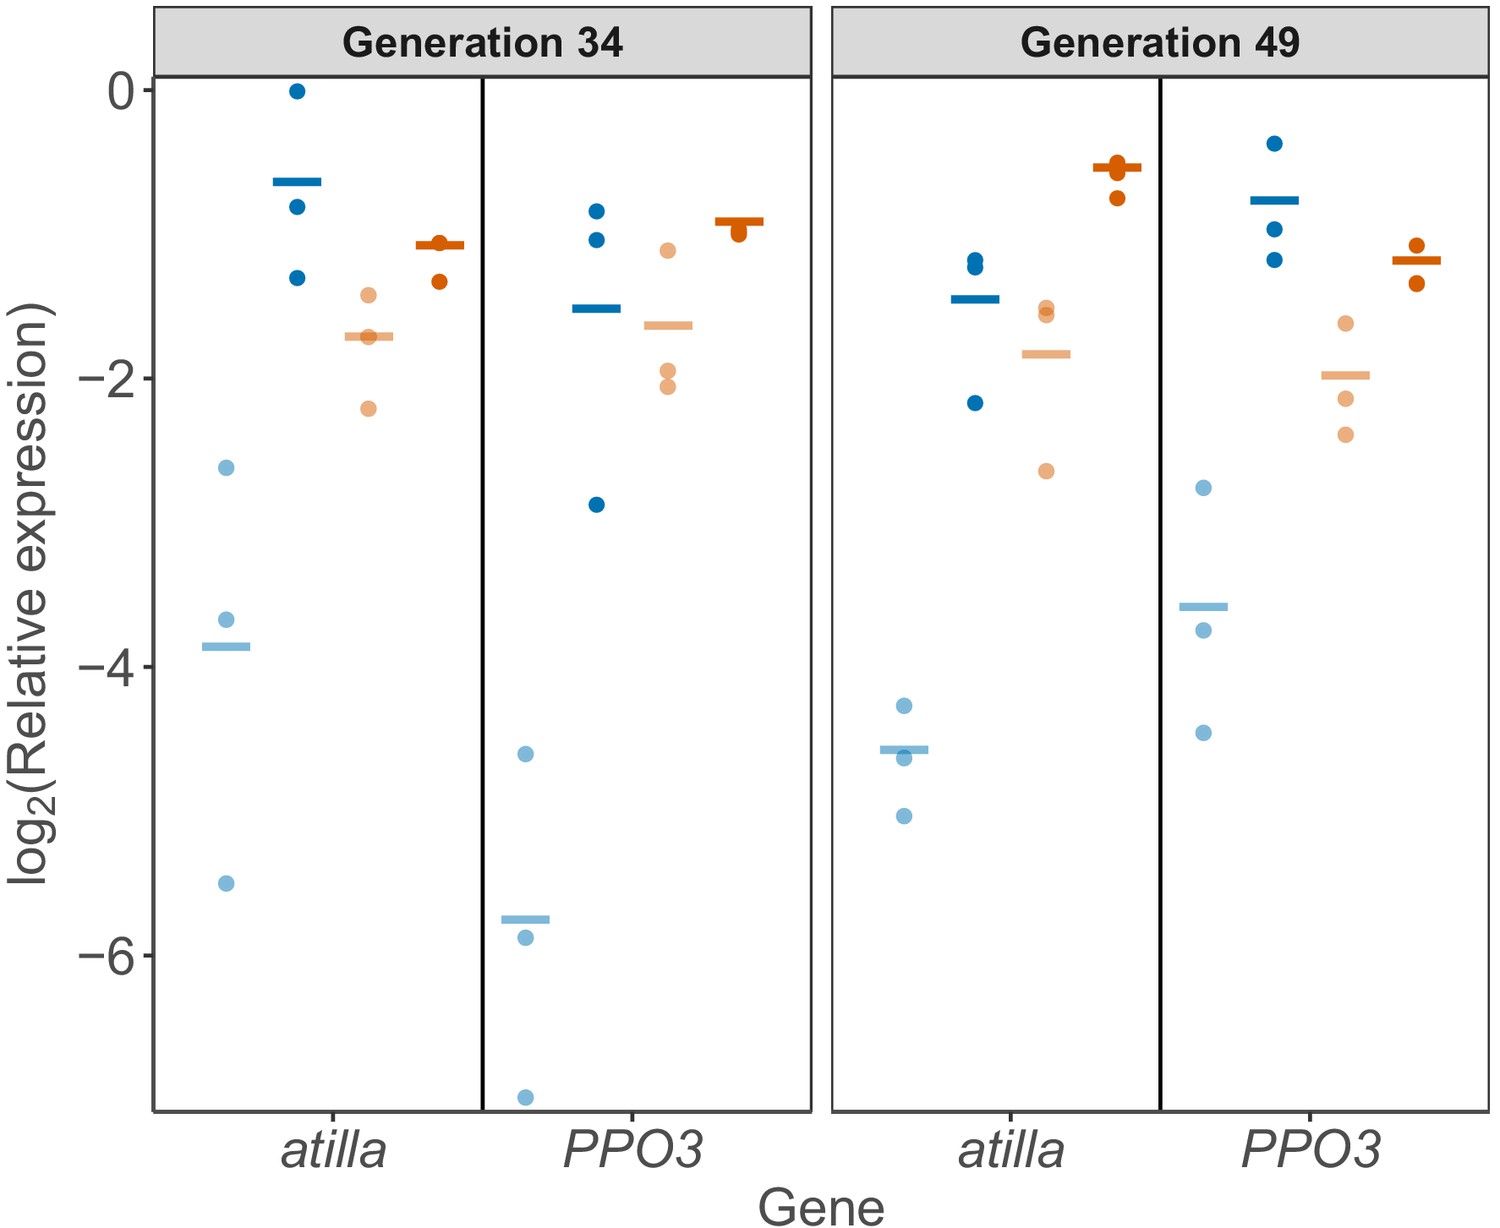
Gene expression in circulating hemocytes measured by qPCR.
atilla and PPO3 expression normalized by the housekeeping gene RpL32 in populations evolved under no parasitism (blue) or high parasitism (orange). Hemocyte samples for RNA extraction were collected from 50 to 70 larvae 24-hr post infection (dark colours) and from larvae with no infection (light colours). Each dot represents the average ΔCt of two biological replicas per population and lines represent the average per selection regime. atilla, Selection regime x Treatment: χ2 = 15.45, d.f = 1, p=8.49×10⁻⁵; PPO3, Selection regime x Treatment: χ2 = 17.64, d.f = 1, p=2.67×10⁻⁵.
-
Figure 2—figure supplement 1—source data 1
Gene expression in circulating hemocytes measured by qPCR.
- https://cdn.elifesciences.org/articles/59095/elife-59095-fig2-figsupp1-data1-v2.xlsx
Figure 3 with 8 supplements
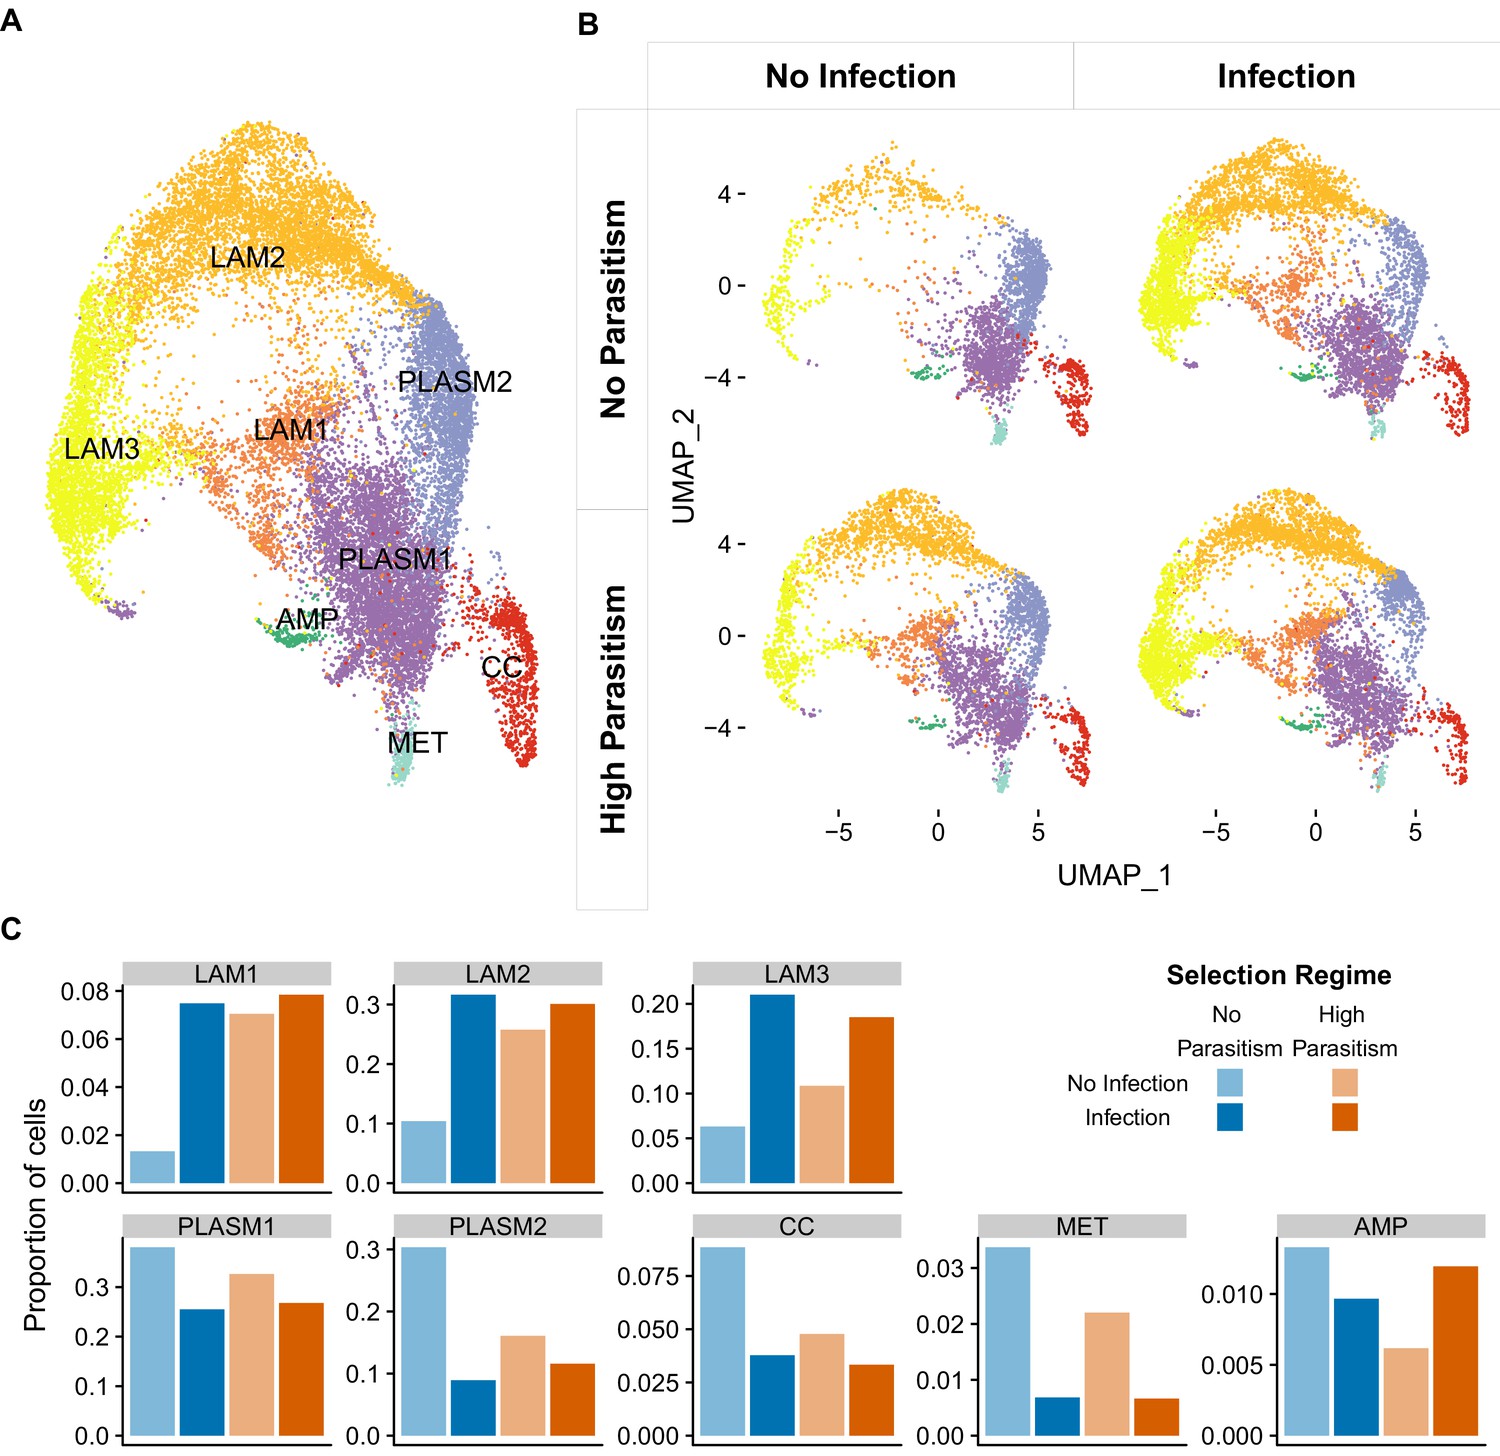
Cell states of Drosophila melanogaster larval hemocytes.
Two-dimensional UMAP projections and cell state classification. (A) All 19,344 cells combined. PLASM: plasmatocytes; MET: metabolic plasmatocyte cluster; AMP: antimicrobial peptide plasmatocyte cluster; LAM: lamellocytes; CC: crystal cells. (B) Cells from populations that had undergone 26 generations of selection with no parasitism (top panels) or high parasitism (bottom panels), and were either uninfected (left panels) or 48 hr post infection (right panels). 64–333 million reads were sequenced in each of the eight 10X libraries that we generated (Supplementary file 3). The number of cells detected per library ranged from 787 to 3463 (Figure 3—figure supplement 4). (C) Proportion of different cell states after infection and selection.
Figure 3—figure supplement 1
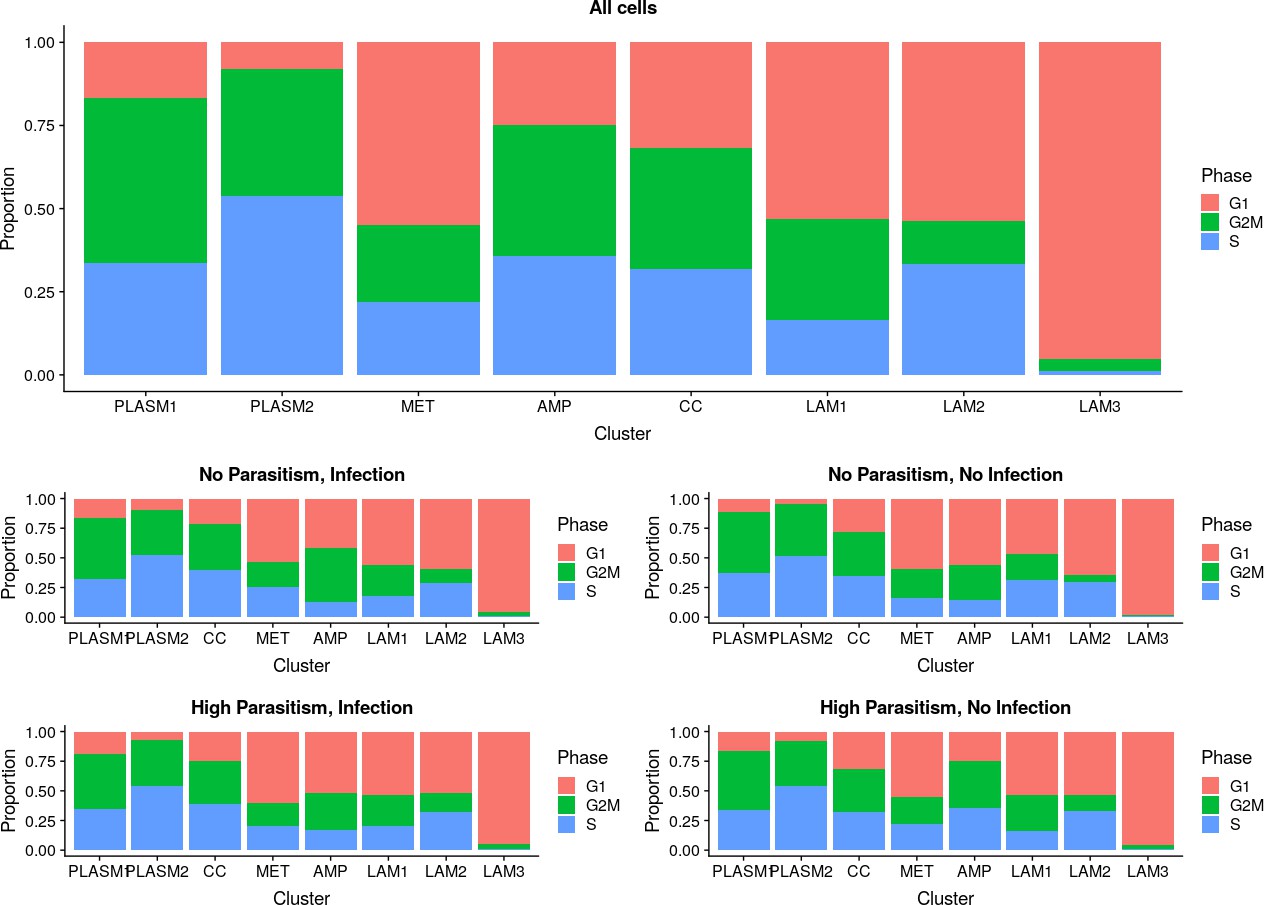
Proportions of cells in G1, G2M, and S phase in the plasmatocyte, lamellocyte, and crystal cell clusters.
Figure 3—figure supplement 2
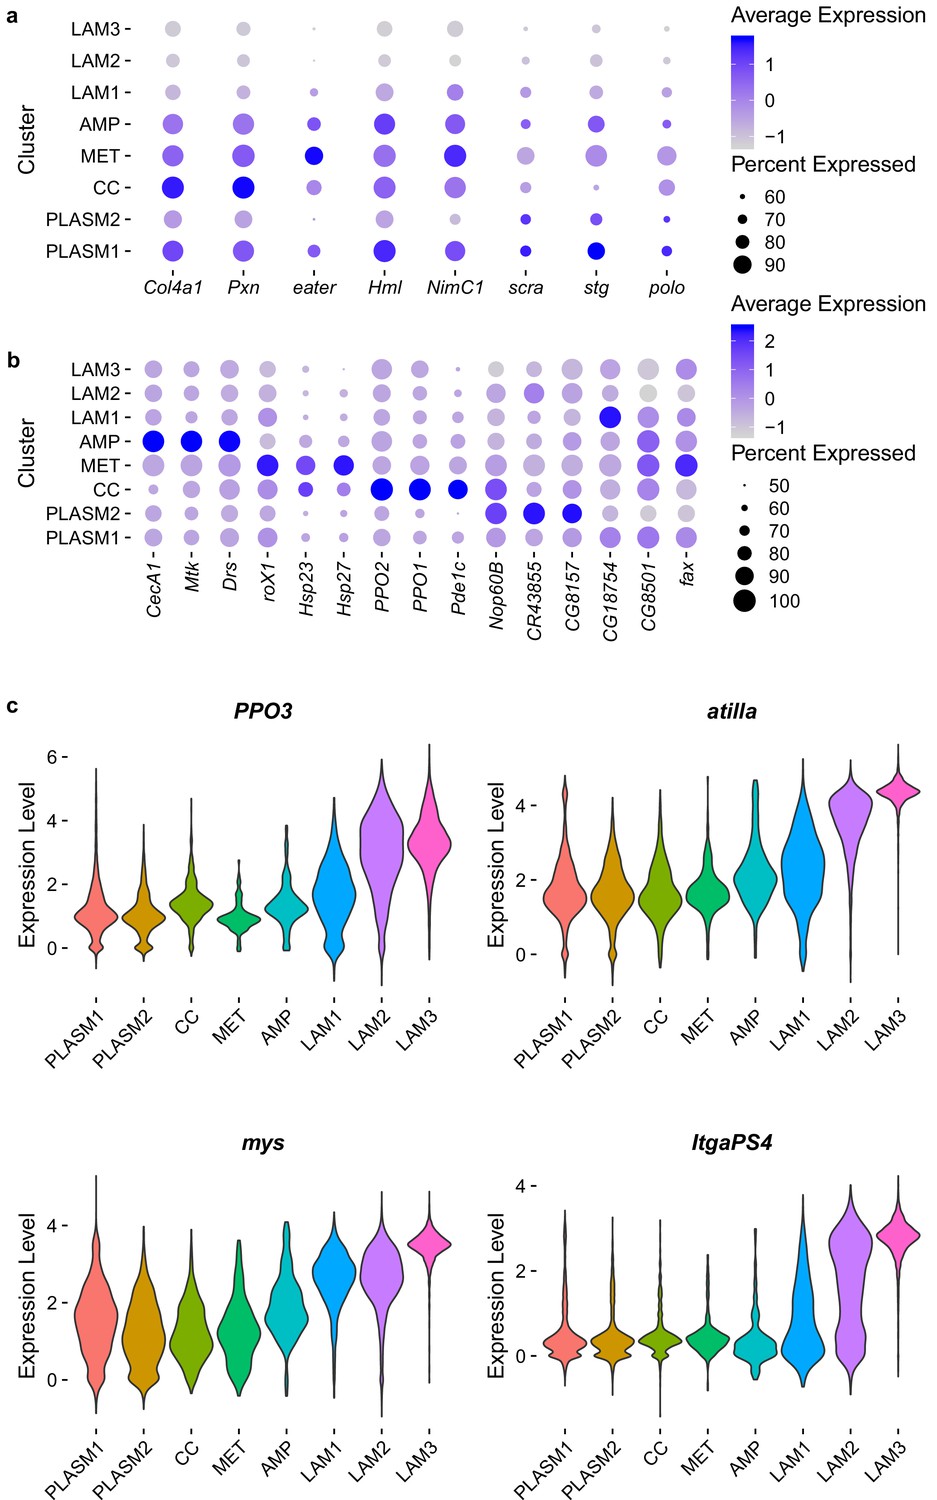
Expression levels (loge) of marker genes.
(A) Relative level of expression of described plasmatocyte and cell cycle genes and (B) Relative level of expression most significant marker genes for the plasmatocyte and crystal cell clusters. The MAST test statistic was used to identify significantly upregulated markers in each cluster comparing the cluster of interest with cells in all other clusters. Percent of cells expressing genes are indicated by circle size. (C) Distribution of gene expression levels for described lamellocyte genes grouped by cluster identities.
Figure 3—figure supplement 3
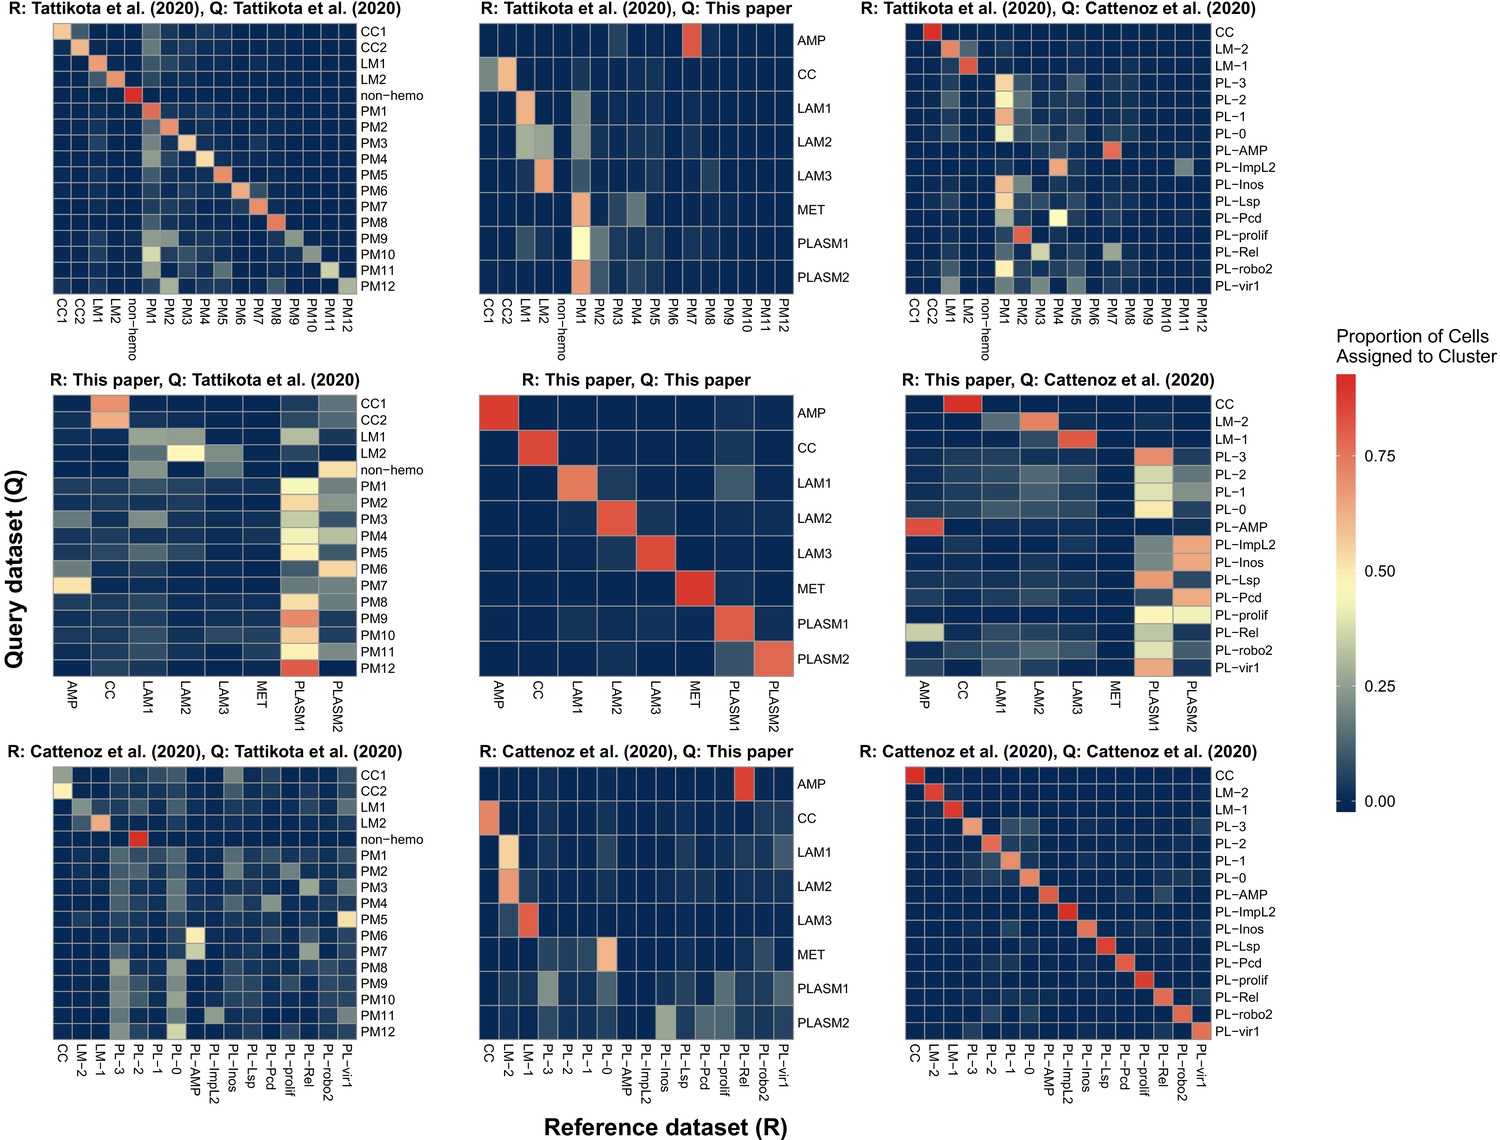
Comparison of scRNA-seq data sets from this paper to those from two previously published studies (Cattenoz et al., 2020; Tattikota et al., 2020).
A reference-based label transfer was used to predict cell cluster identity in the query data set. The scale bar indicates the proportion of cells in query clusters (y axis) that are predicted to belong to a given reference cluster (x axis).
Figure 3—figure supplement 4
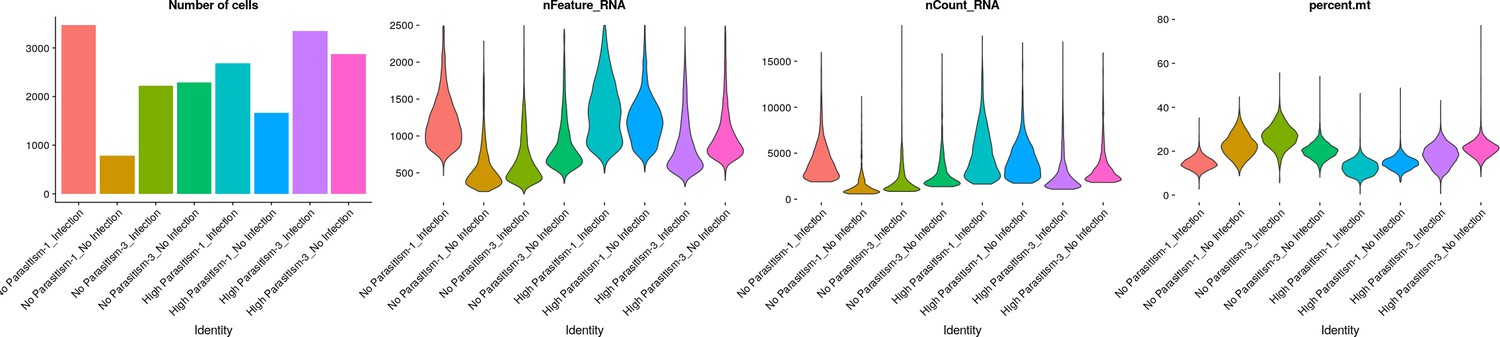
Number of cells and genes detected, unique molecular identifier count and percent mitochondrial gene expression per cell grouped by sample.
HP: high parasitism, NP: No parasitism, I: Infection and NI: no infection. Numbers following HP or NP correspond to replicate.
Figure 3—figure supplement 5
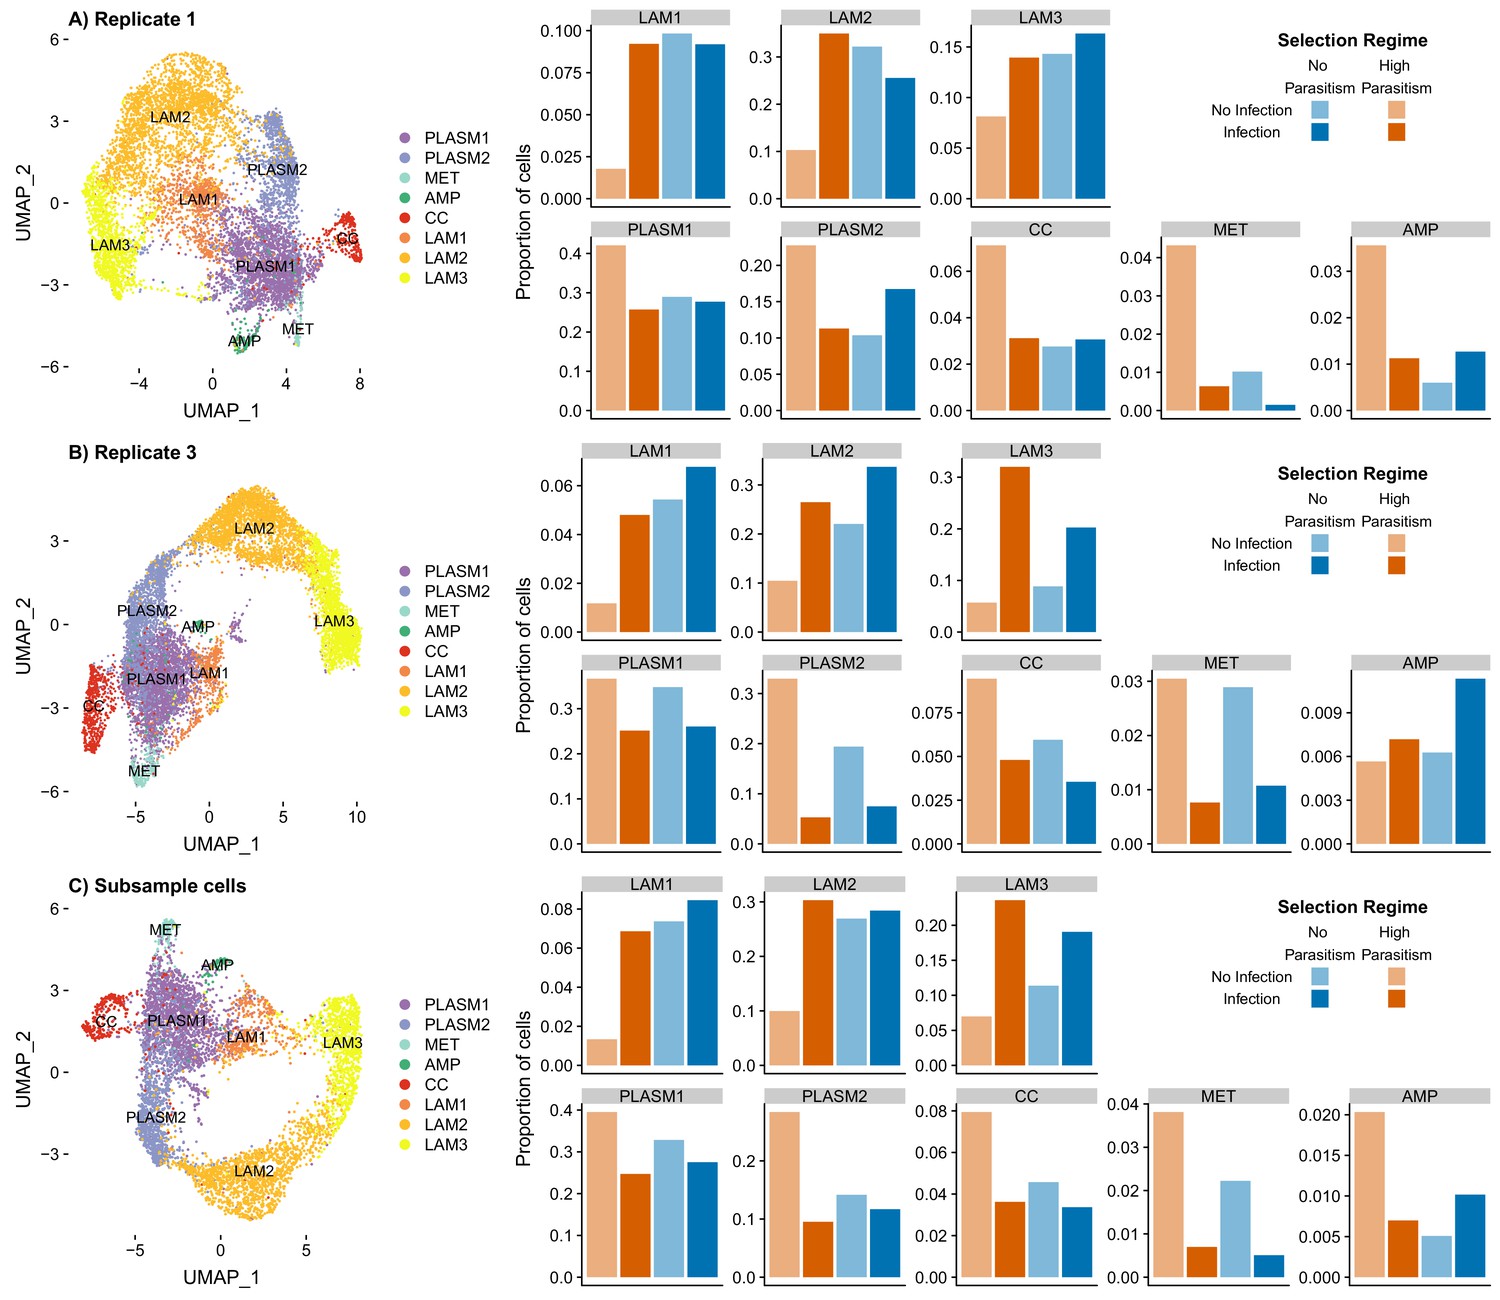
Impact of cell number and library-specific differences on data integration, cell cluster classification and estimating cluster proportions.
(A) Clustering 8,596 cells from replicate one, (B) clustering 10,784 cells from replicate three and (C) clustering 6,296 cells where 787 cells were randomly subsampled without replacement in each of eight libraries used for data integration.
Figure 3—figure supplement 6
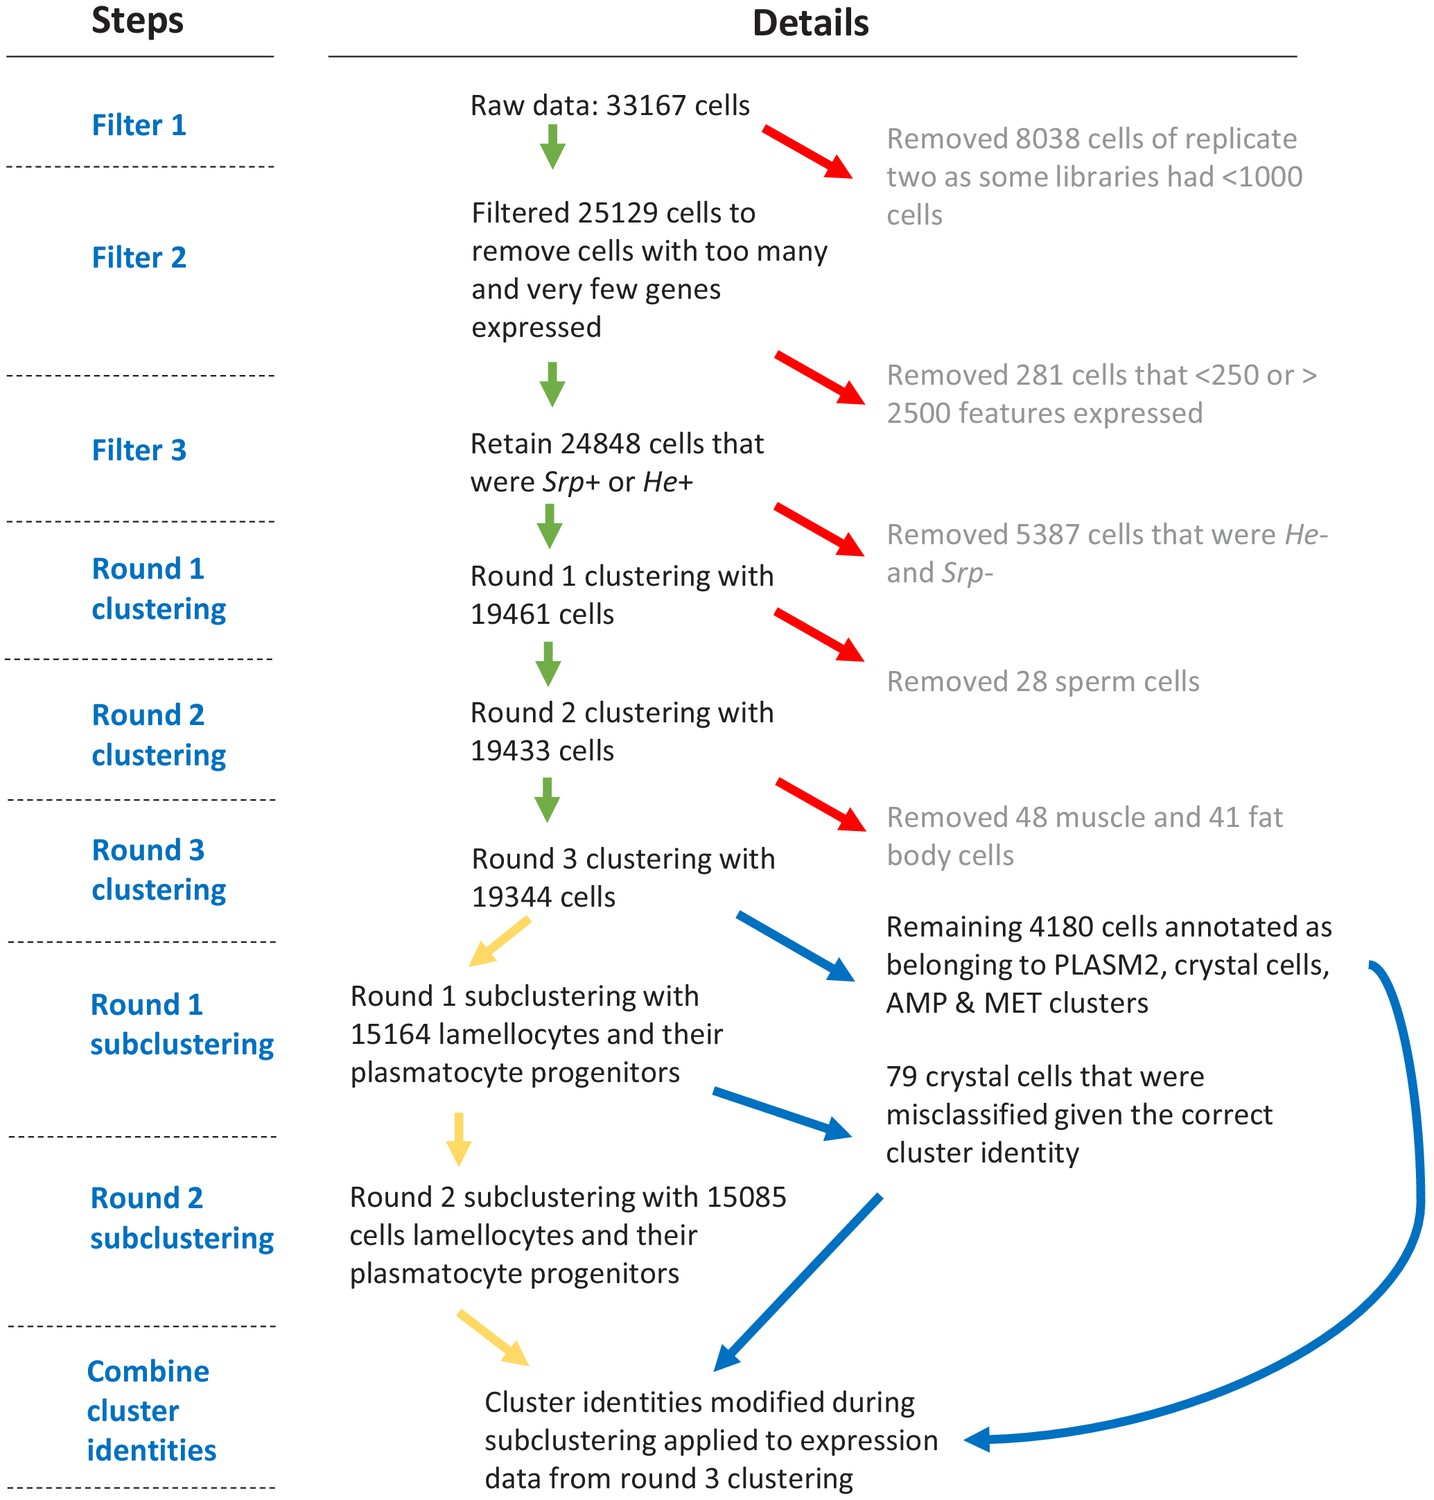
Flowchart of data filtering and clustering steps.
Only cells expressing >250 features and <2500 features and cells that were either He+ or Srp+ were kept. Cells expressing high levels of sperm-cell, muscle, or fat body marker genes were identified during three rounds of clustering and removed. 19,344 cells remained after filtering. Two rounds of subclustering identified plasmatocyte progenitor and lamellocyte clusters and these identities replaced those attained from round three clustering for relevant cells.
Figure 3—figure supplement 7
Proportion of different cell states after infection and selection following data integration with 7716 anchors, the maximum number that can be detected.
Figure 3—figure supplement 8
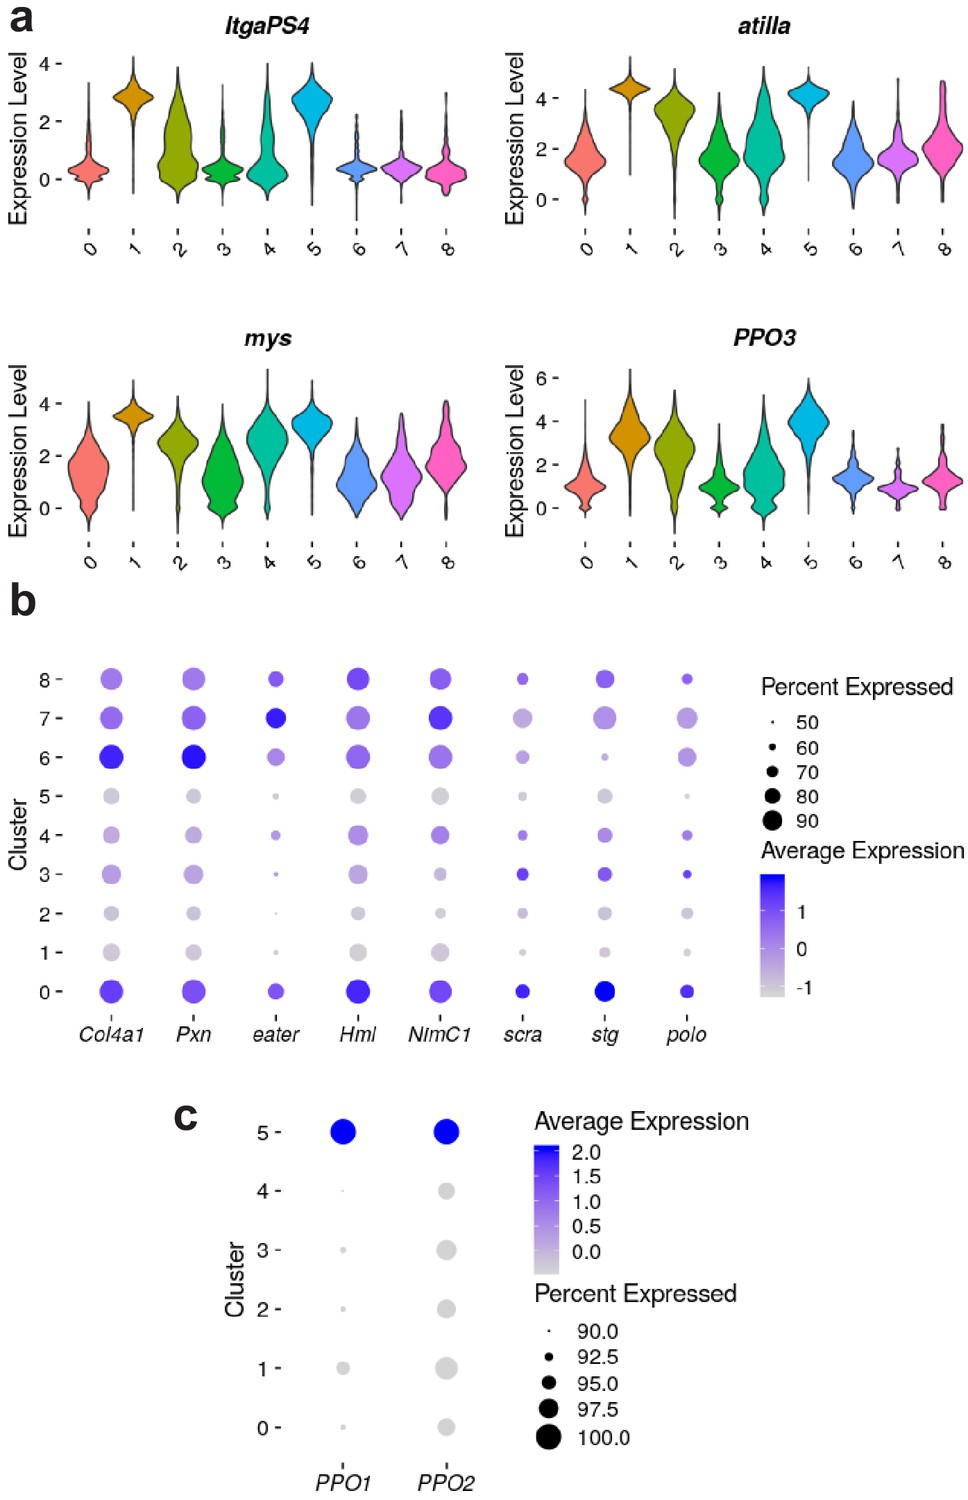
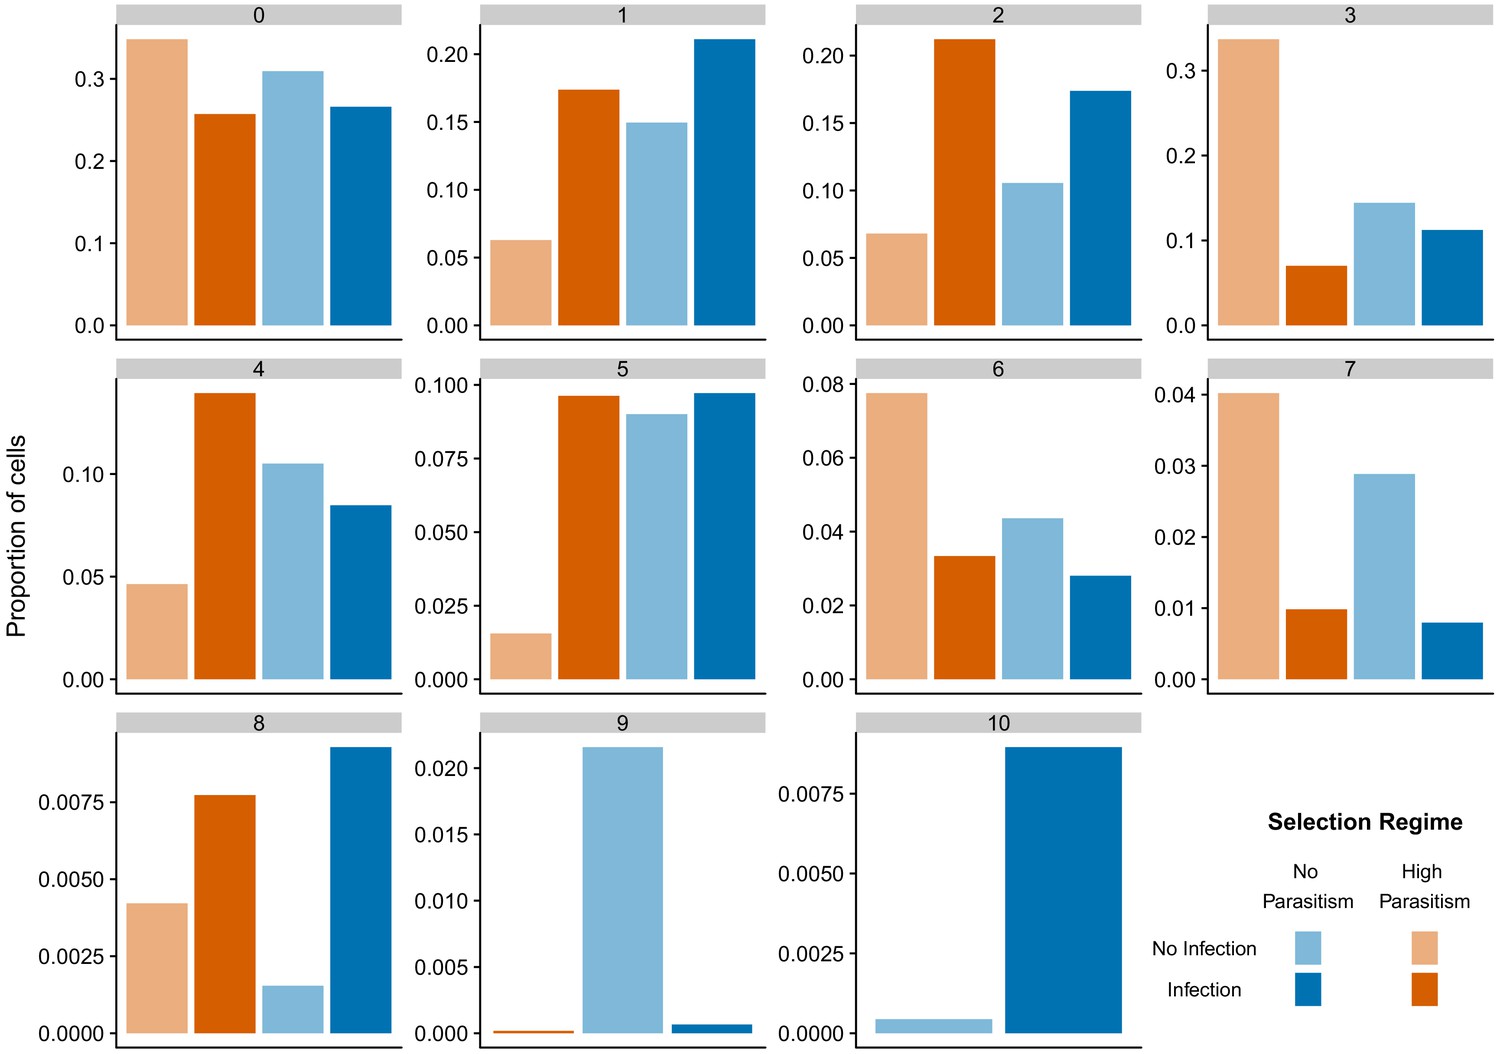
Expression levels (loge) of marker genes from early rounds of clustering.
(A) Distribution of gene expression levels of described lamellocyte marker genes, for clusters identified from round three clustering. (B) Relative level of expression of described plasmatocyte and cell cycle marker genes, for clusters identified from round three clustering. (C) Relative level of expression of two known crystal cell markers from round one of subclustering, using lamellocytes and their plasmatocyte progenitors. Percent of cells expressing genes are indicated by circle size (B and C).
Figure 4 with 1 supplement
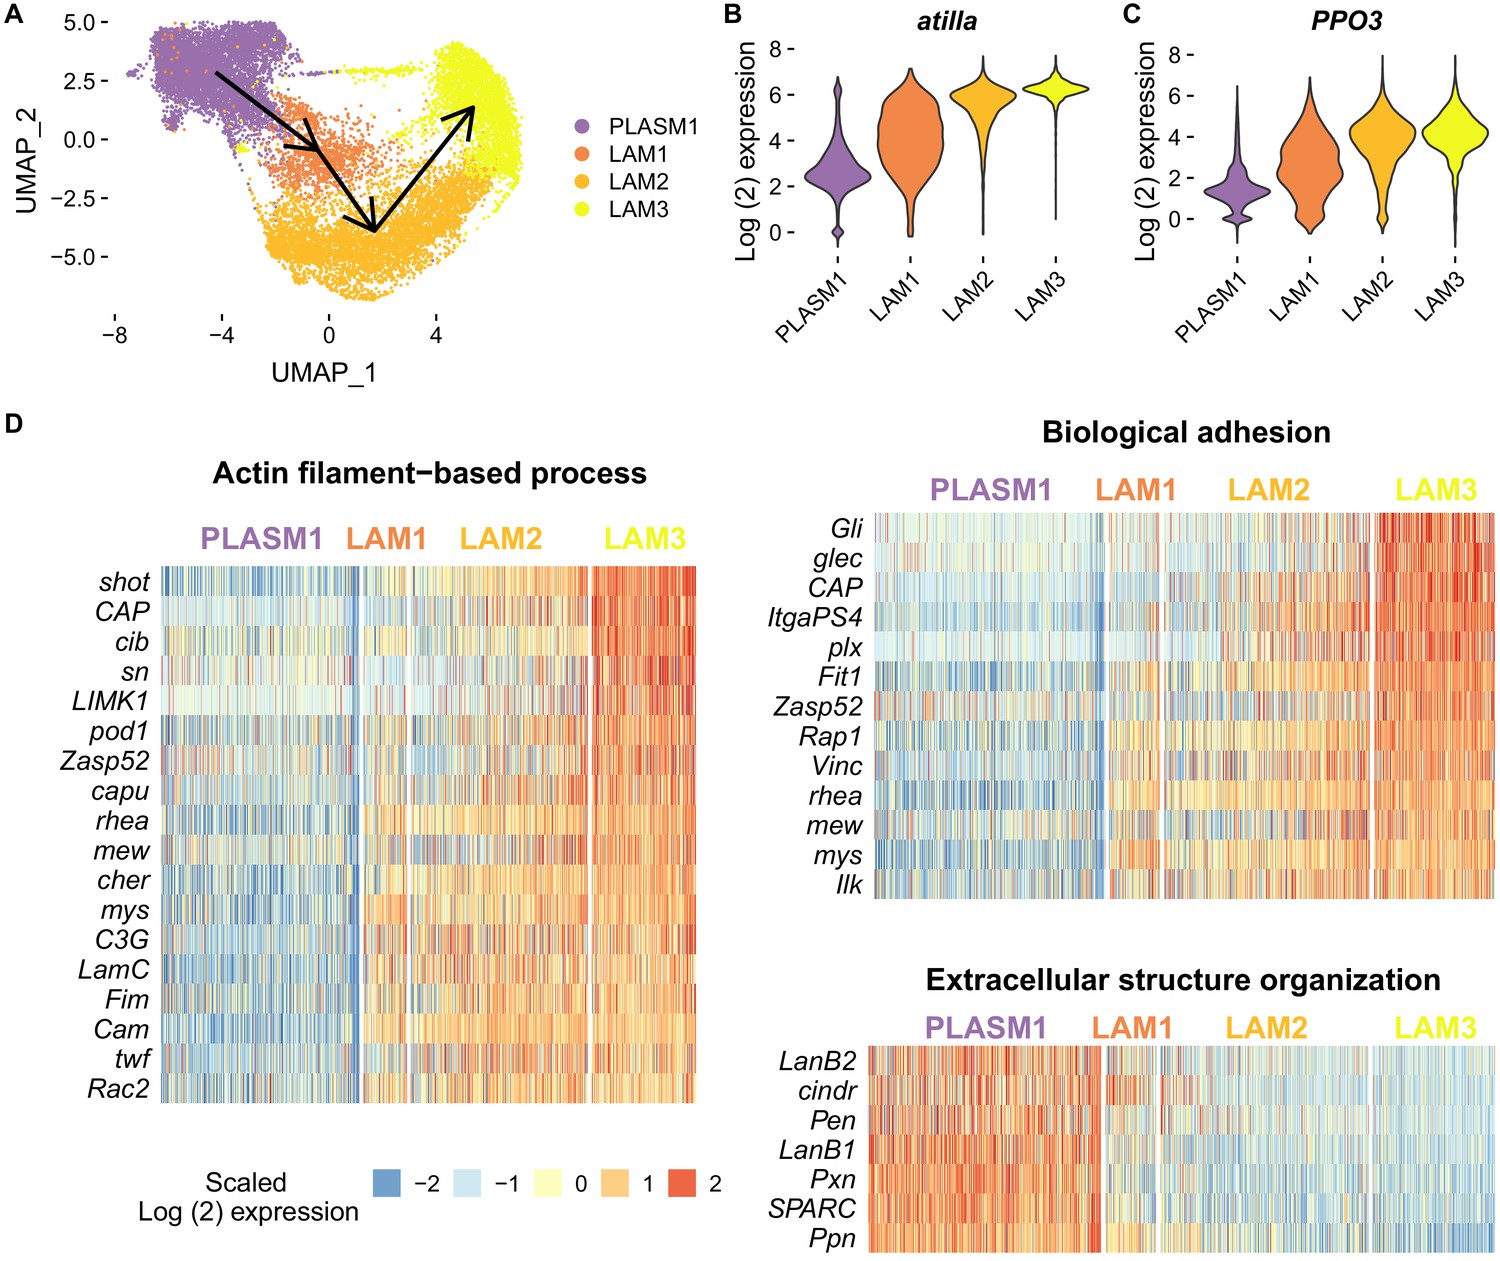
Changes in cell state following infection and adaptation to high rates of parasitism.
(A) Trajectory of lamellocyte differentiation. Plasmatocyte progenitors and lamellocytes were subclustered, the trajectories inferred from multi-dimensional principle components analysis, and the lineage projected onto the two-dimensional UMAP plot. (B–C) Log2 expression levels of atilla and PPO3. Relative expression levels were estimated from normalized and scaled unique molecular identifier counts. (D) Heatmaps of genes that are upregulated in either the starting or terminal clusters of lamellocyte differentiation and belonging to significantly enriched gene ontology categories (biological function). Log2 fold change gene expression levels were centred on their mean value and divided by their standard deviation.
-
Figure 4—source data 1
Changes in cell state following infection and adaptation to high rates of parasitism.
- https://cdn.elifesciences.org/articles/59095/elife-59095-fig4-data1-v2.xlsx
Figure 4—figure supplement 1
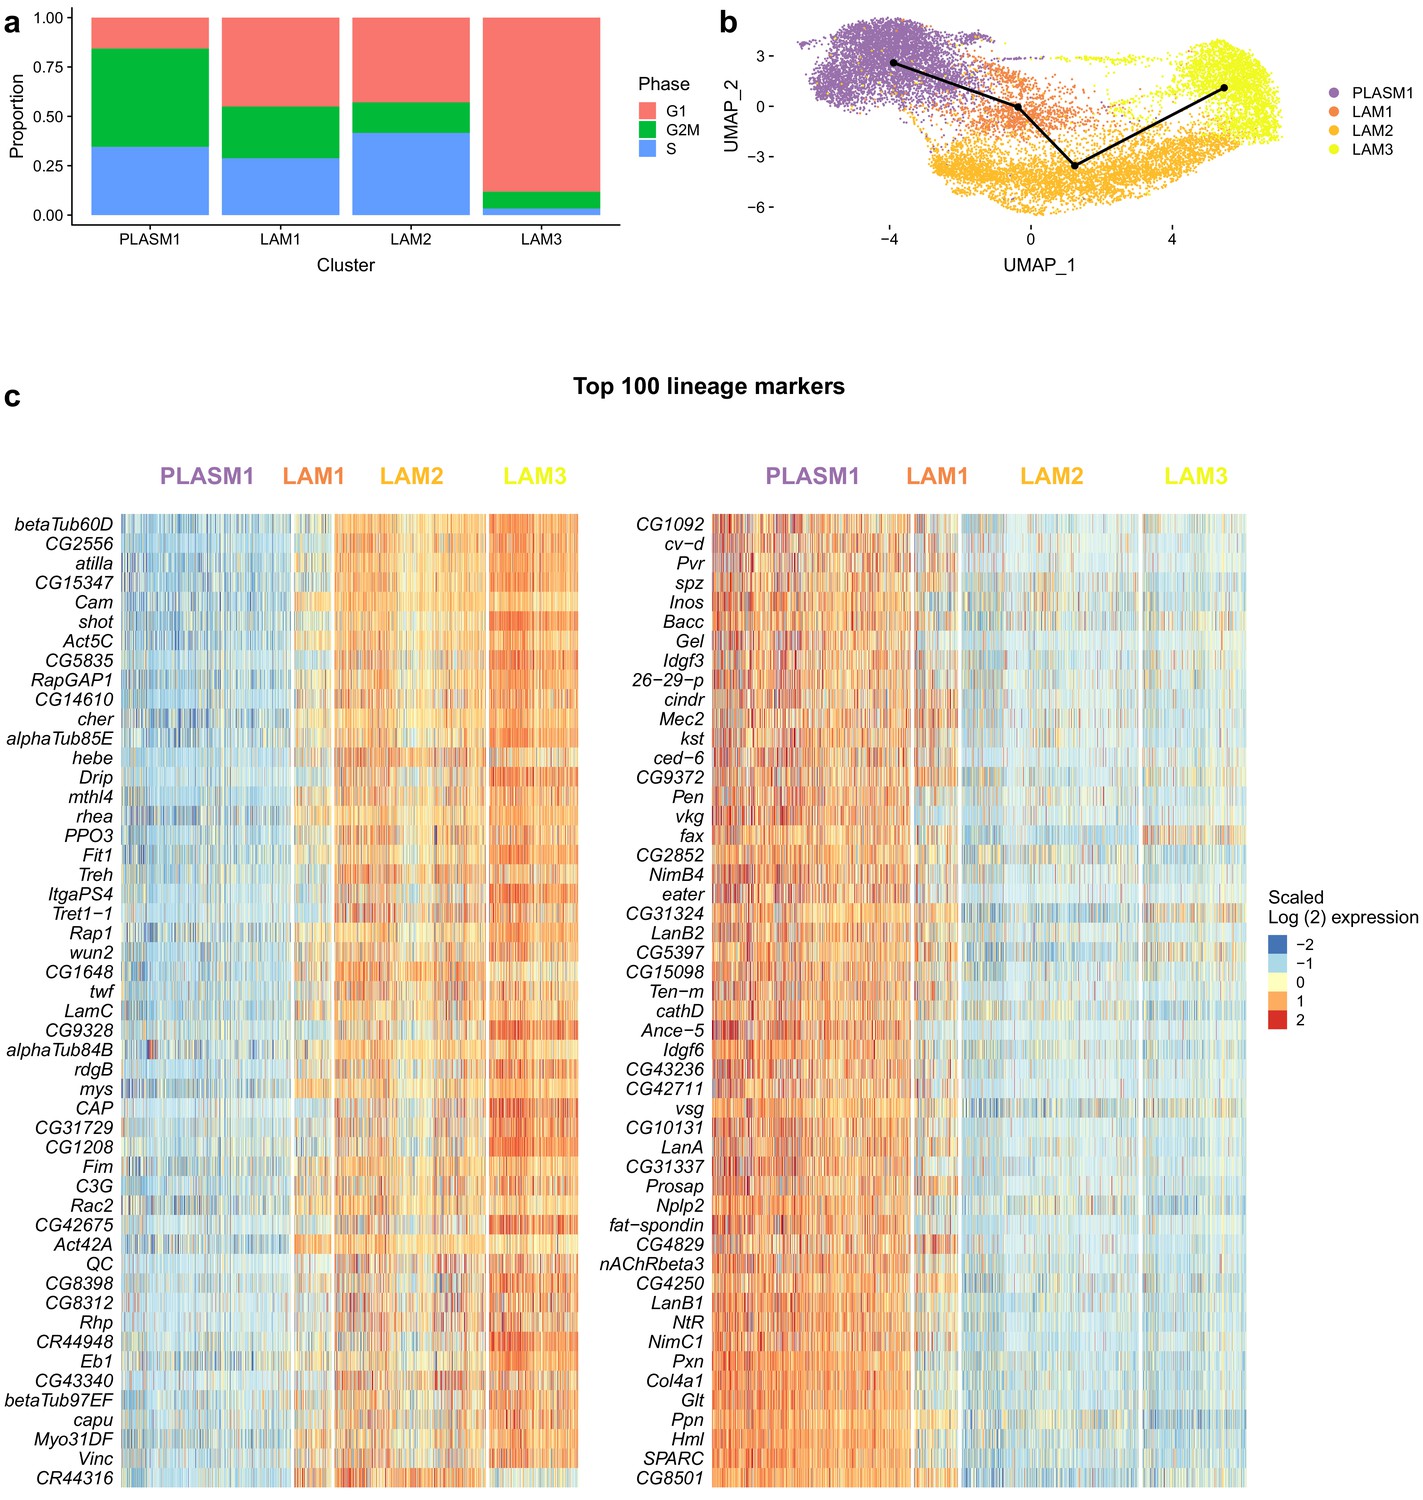
Trajectory of lamellocyte differentiation following subclustering.
(A) Proportions of cells in G1, G2M, and S phase in the plasmatocyte progenitor and lamellocyte clusters. (B) Trajectory of lamellocyte differentiation inferred following cell cycle correction and regressing out the difference between the G2M and S phases. Trajectories were inferred from multi-dimensional principle components analysis, and the lineage projected onto the two-dimensional UMAP plot. (C) Heatmap of top 100 markers predicting lamellocyte differentiation as ranked by variable importance. Genes are grouped by mean cluster expression level and cells (columns) were ordered by expression of the 101st marker. Log2-fold change gene expression levels were centered on their mean value and divided by their standard deviation.
Figure 5 with 6 supplements
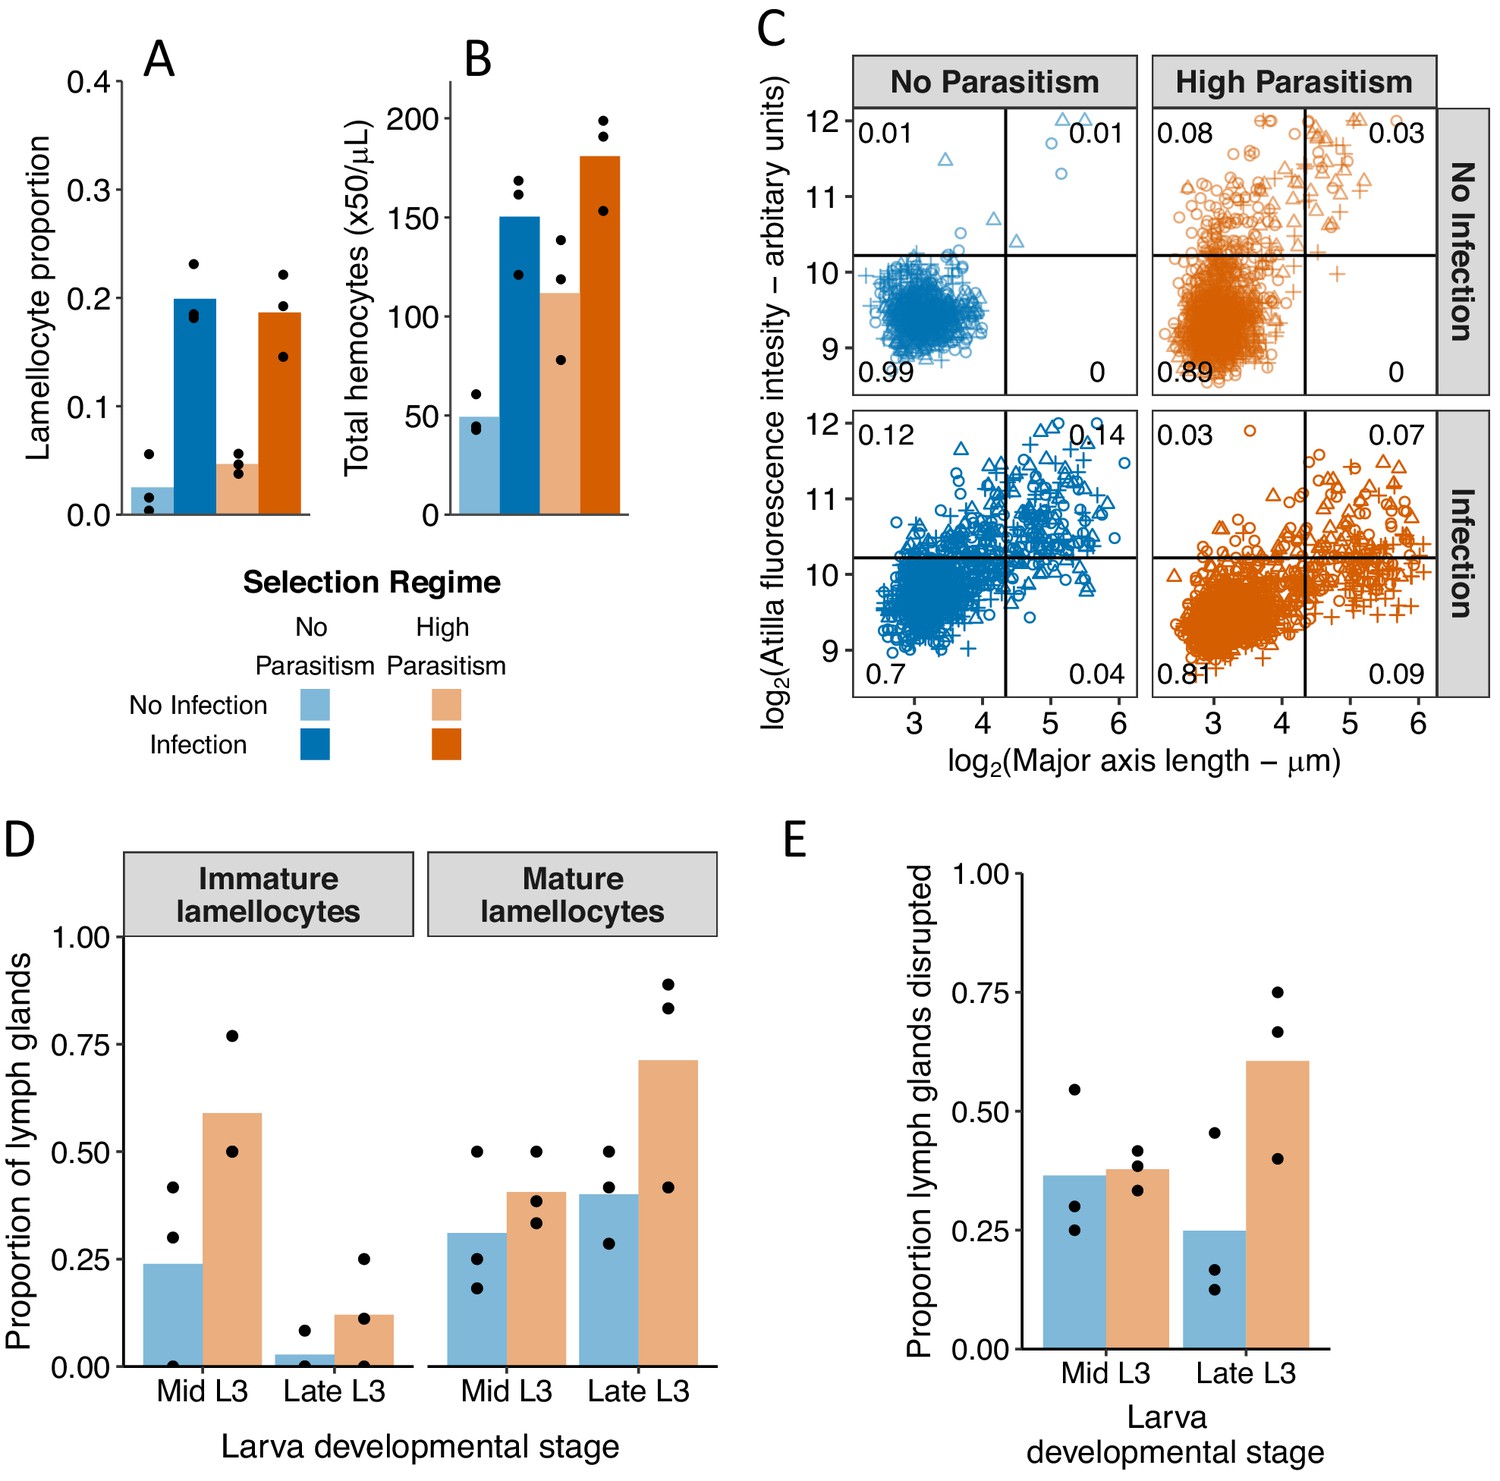
Changes in circulating and lymph gland hemocytes following infection and adaptation to high parasitism rates.
(A) The proportion hemocytes that were morphologically identified as lamellocytes and (B) the concentration of total circulating hemocytes in no infection conditions (light colours) and 48 hr post infection (dark colours). Samples were collected from populations that evolved for 34 generation with high parasitism (orange bars) or no parasitism (blue bars) (C) Cell size and atilla expression. The expression of atilla was measured as the fluorescence intensity resulting from immunohistochemistry staining. Cell size was measured along the major axis. Replicated populations from each selection regime are represented by different symbols and the proportion of cells in each quarter of the plot is shown. (D) The proportion of lymph glands from uninfected larvae containing immature lamellocytes (mys+ α-PS4-) and mature lamellocytes (mys+ α-PS4+). (E) Proportion of disrupted lymph glands in uninfected larvae. The lymph gland anterior lobe was considered disrupted when it was either partially or completely disrupted.
-
Figure 5—source data 1
Changes in circulating and lymph gland hemocytes following infection and adaptation to high parasitism rates.
- https://cdn.elifesciences.org/articles/59095/elife-59095-fig5-data1-v2.xlsx
Figure 5—figure supplement 1
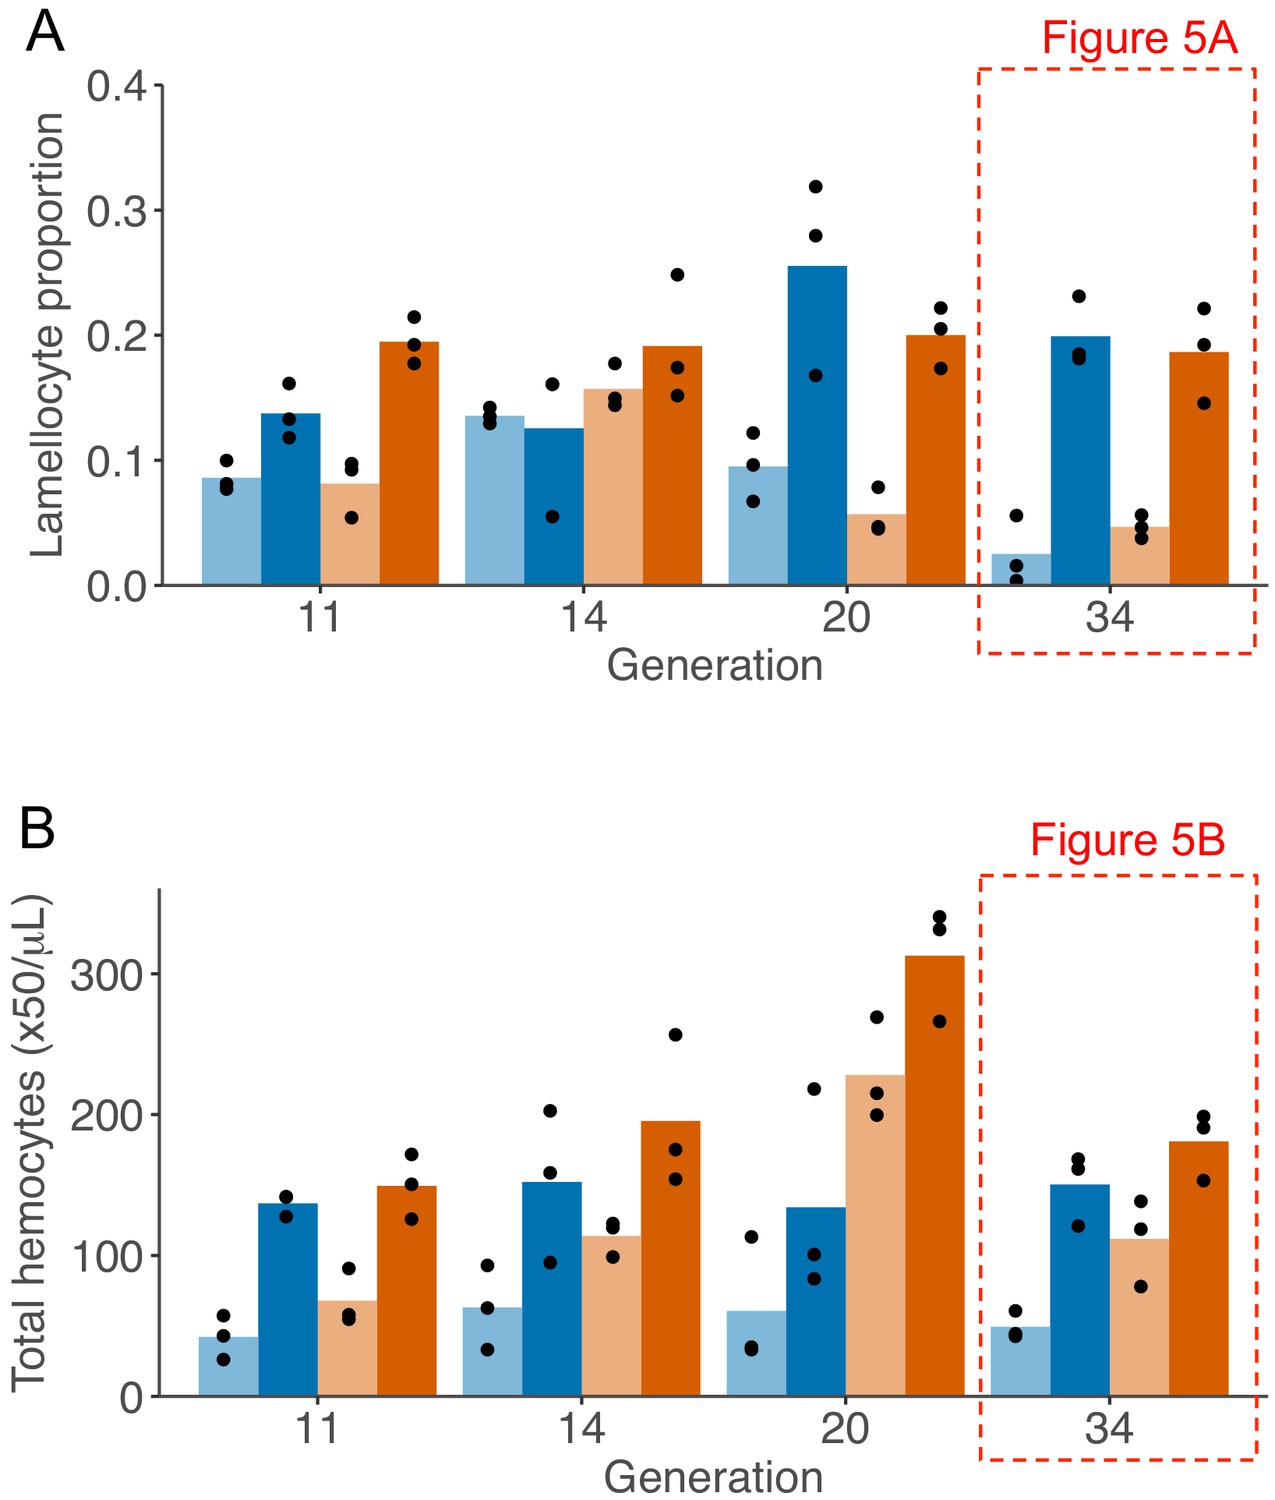
Changes in number of circulating hemocytes during artificial selection.
Proportion of lamellocytes (A) and concentration of total circulating hemocytes (B) in population evolved with no parasitism (blue bars) and with high parasitism (orange bars). Samples were collected as late 3rd instar larvae in homeostasis (light colours) or 48-hr post infection (dark colours). Each dot represents the mean counts of each population calculated from 4 to 10 replicas and bar height represents the mean of the triplicate lines. Generation 34 is represented in Figure 5A–B.
Figure 5—figure supplement 2
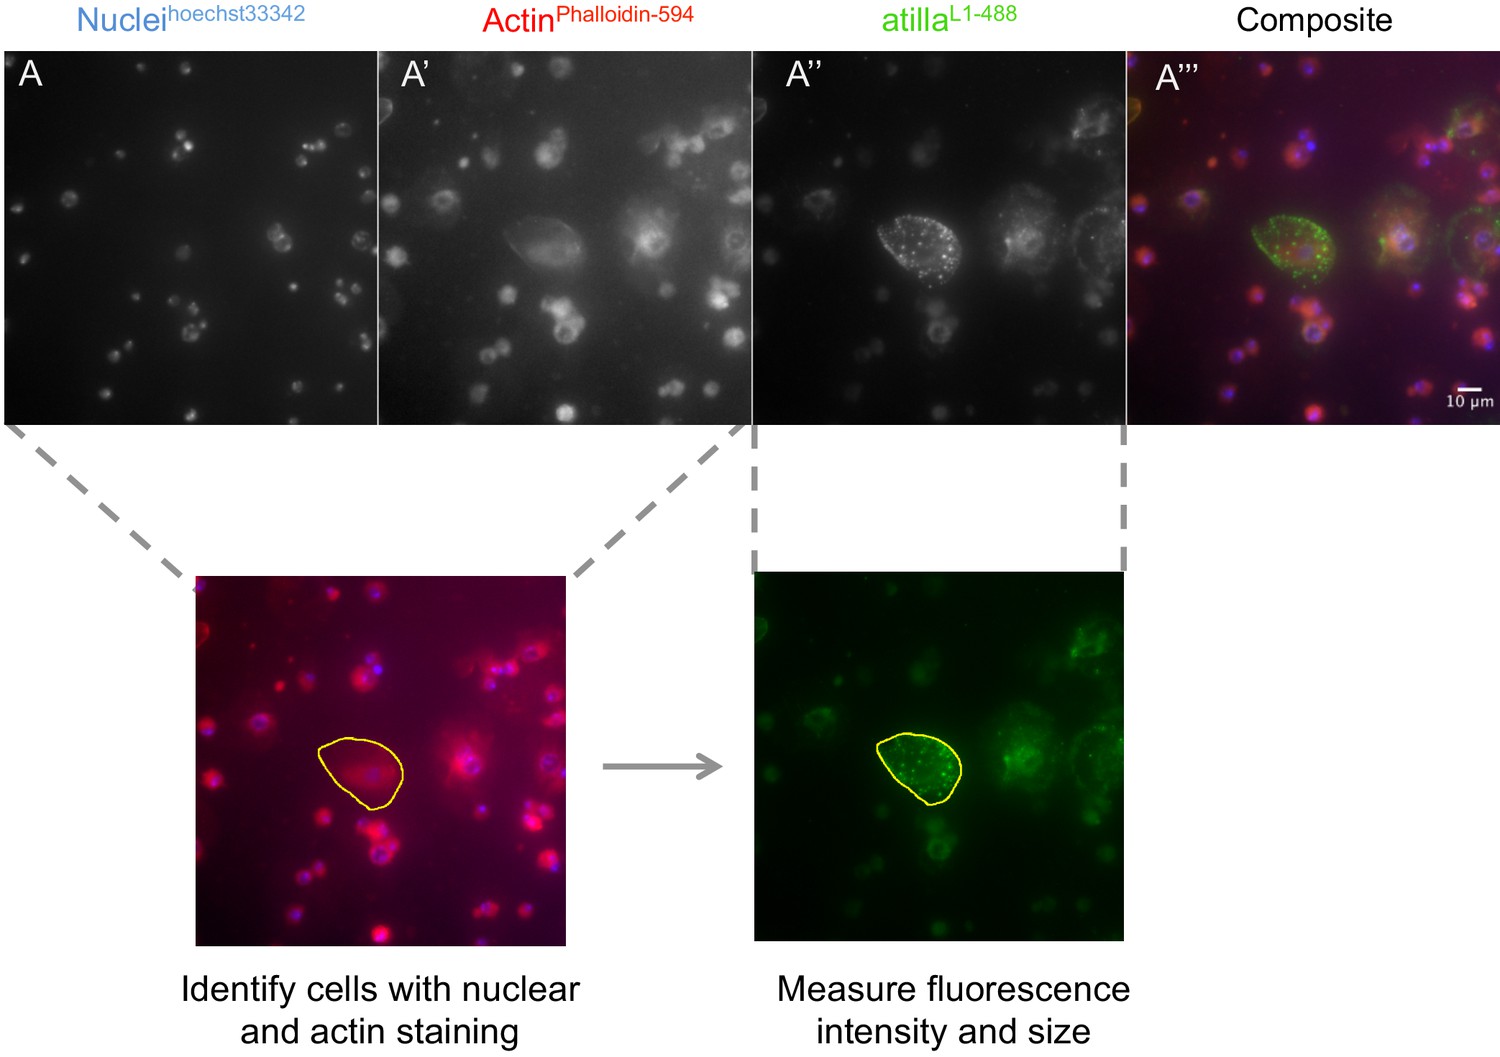
Hemocyte size and atilla staining intensity in circulating hemocytes.
Hemocytes were stained for nuclei (A, hoechst 33342), Actin (A’, Phalloidin- Alexa594) and atilla (A’’, L1 antibody + Alexa488). Composite images were created for phallodin and hoechst staining to identify cells with selection tool (yellow line) and fluorescence intensity was measured in L1 staining.
Figure 5—figure supplement 3
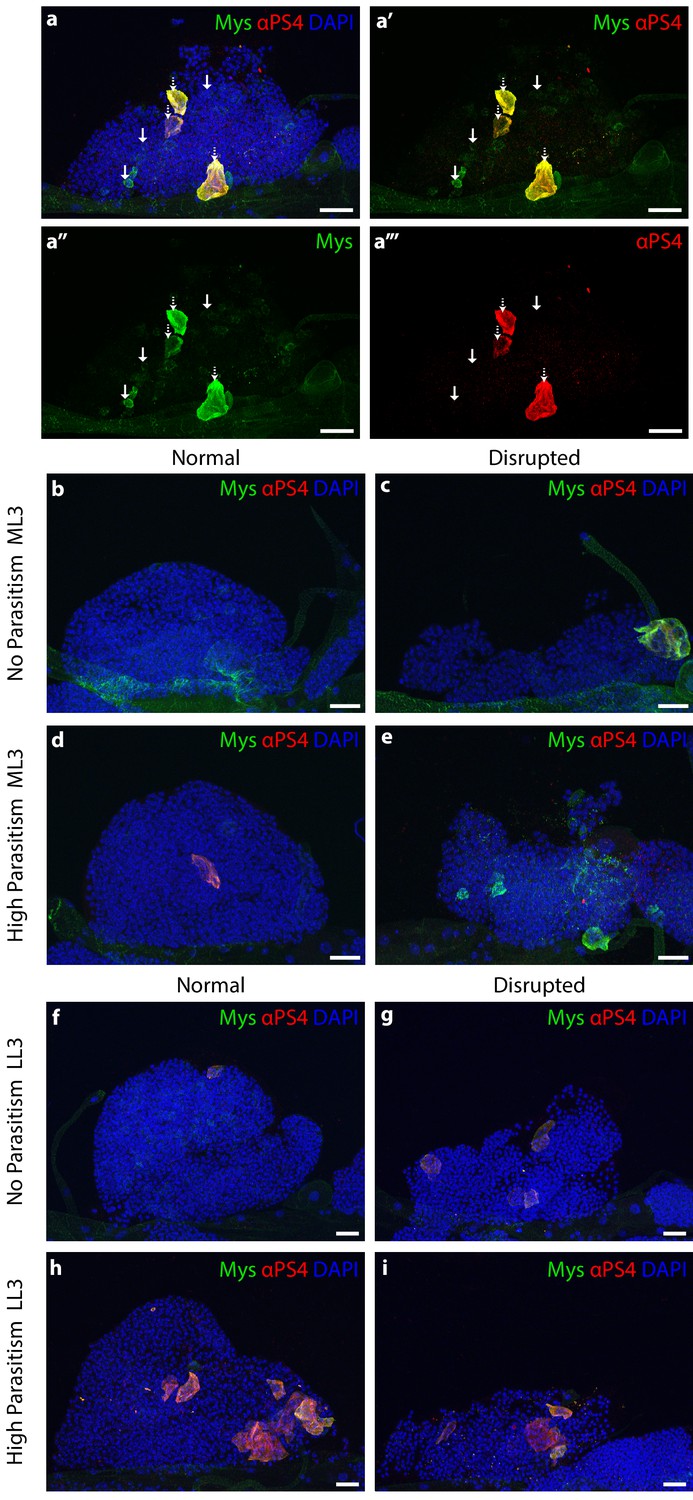
Lamellocytes differentiation state and morphology of anterior lymph gland lobes.
(a) Anterior lobe of a lymph gland from a larva from No Parasitism selection regime. Immature lamellocytes are stained with Myspheroid (Mys, green, with arrow). Mature lamellocytes are double stained with Mys and Integrin alpha PS4 subunit (α-PS4, red, white-dotted arrow). (b,c) No Parasitism anterior lobe in mild larval stage 3; normal (b) and disrupted lobe (c). (d,e) High parasitism anterior lobe in mild larval stage 3; normal (d) and disrupted lobe (e). (f,g) No parasitism anterior lobe in late larval stage 3; normal (f) and disrupted (g). (h,i) High parasitism anterior lobe in late larval stage 3; normal (i) and disrupted (j). All samples were stained with Mys (green), α-PS4 (red). Nuclei were stained with DAPI. Scale bars = 20 µm.
Figure 5—figure supplement 4

Hemocyte concentrations during development of 3rd instar larvae.
Total number of hemocytes (A), lamellocytes (B) and lamellocyte proportions (C) in larvae 12-, 24-, 36-, and 48-hr post infection (dark colours) and corresponding controls with no infection (light colors). Points represent the mean of three biological replicas from each triplicate line of No parasitism (blue) and high parasitism (orange) selection regimes. Restrictions on working hours mean the 12 hr and 36 hr timepoints were performed separately to the 24 hr and 48 hr timepoints.
-
Figure 5—figure supplement 4—source data 1
Hemocyte concentrations during development of 3rd instar larvae.
- https://cdn.elifesciences.org/articles/59095/elife-59095-fig5-figsupp4-data1-v2.xlsx
Figure 5—figure supplement 5
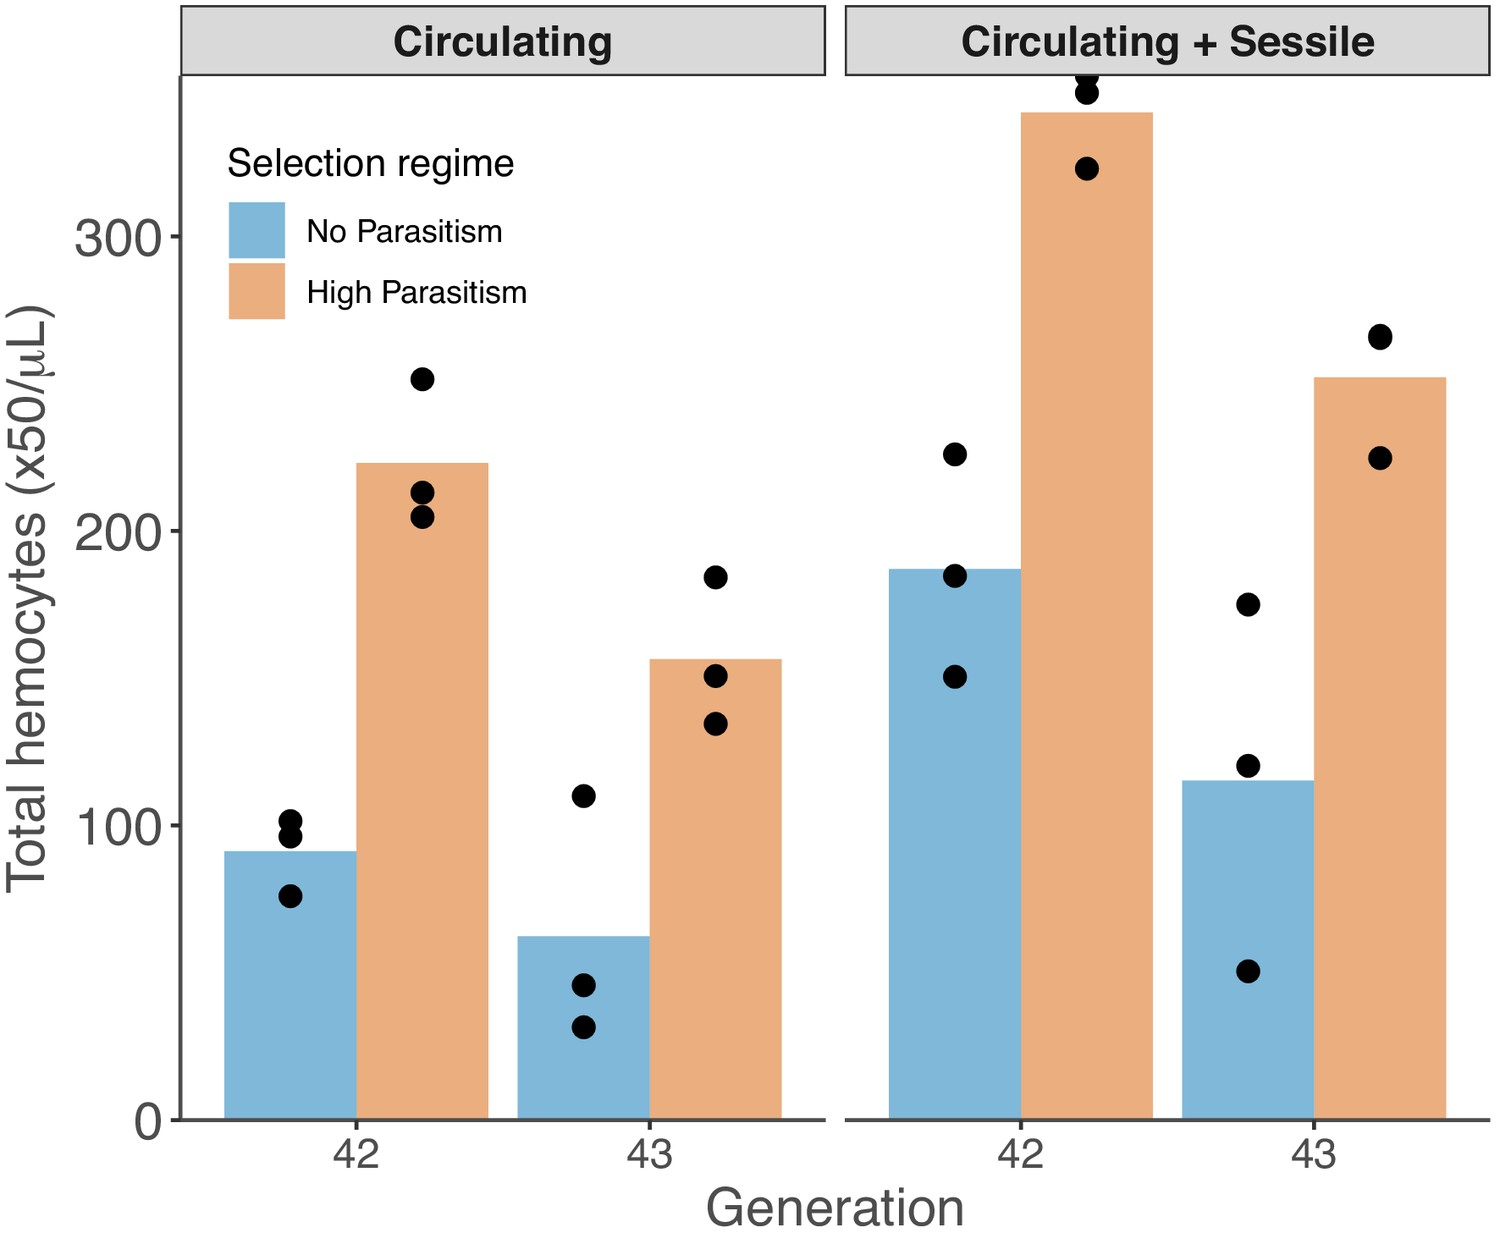
ç Concentration of hemocytes from dissected larvae without manipulation (Circulating) and after vortexing to displace sessile hemocytes into circulation (Circulating + Sessile).
Points represent the mean of four biological replicas for each triplicate line from populations evolved with no parasitism (blue) and high parasitism (orange) selection regimes. Bar heights represent the mean of triplicate lines.
-
Figure 5—figure supplement 5—source data 1
Hemocyte concentrations (circulating and circulating + sessile).
- https://cdn.elifesciences.org/articles/59095/elife-59095-fig5-figsupp5-data1-v2.xlsx
Figure 5—figure supplement 6
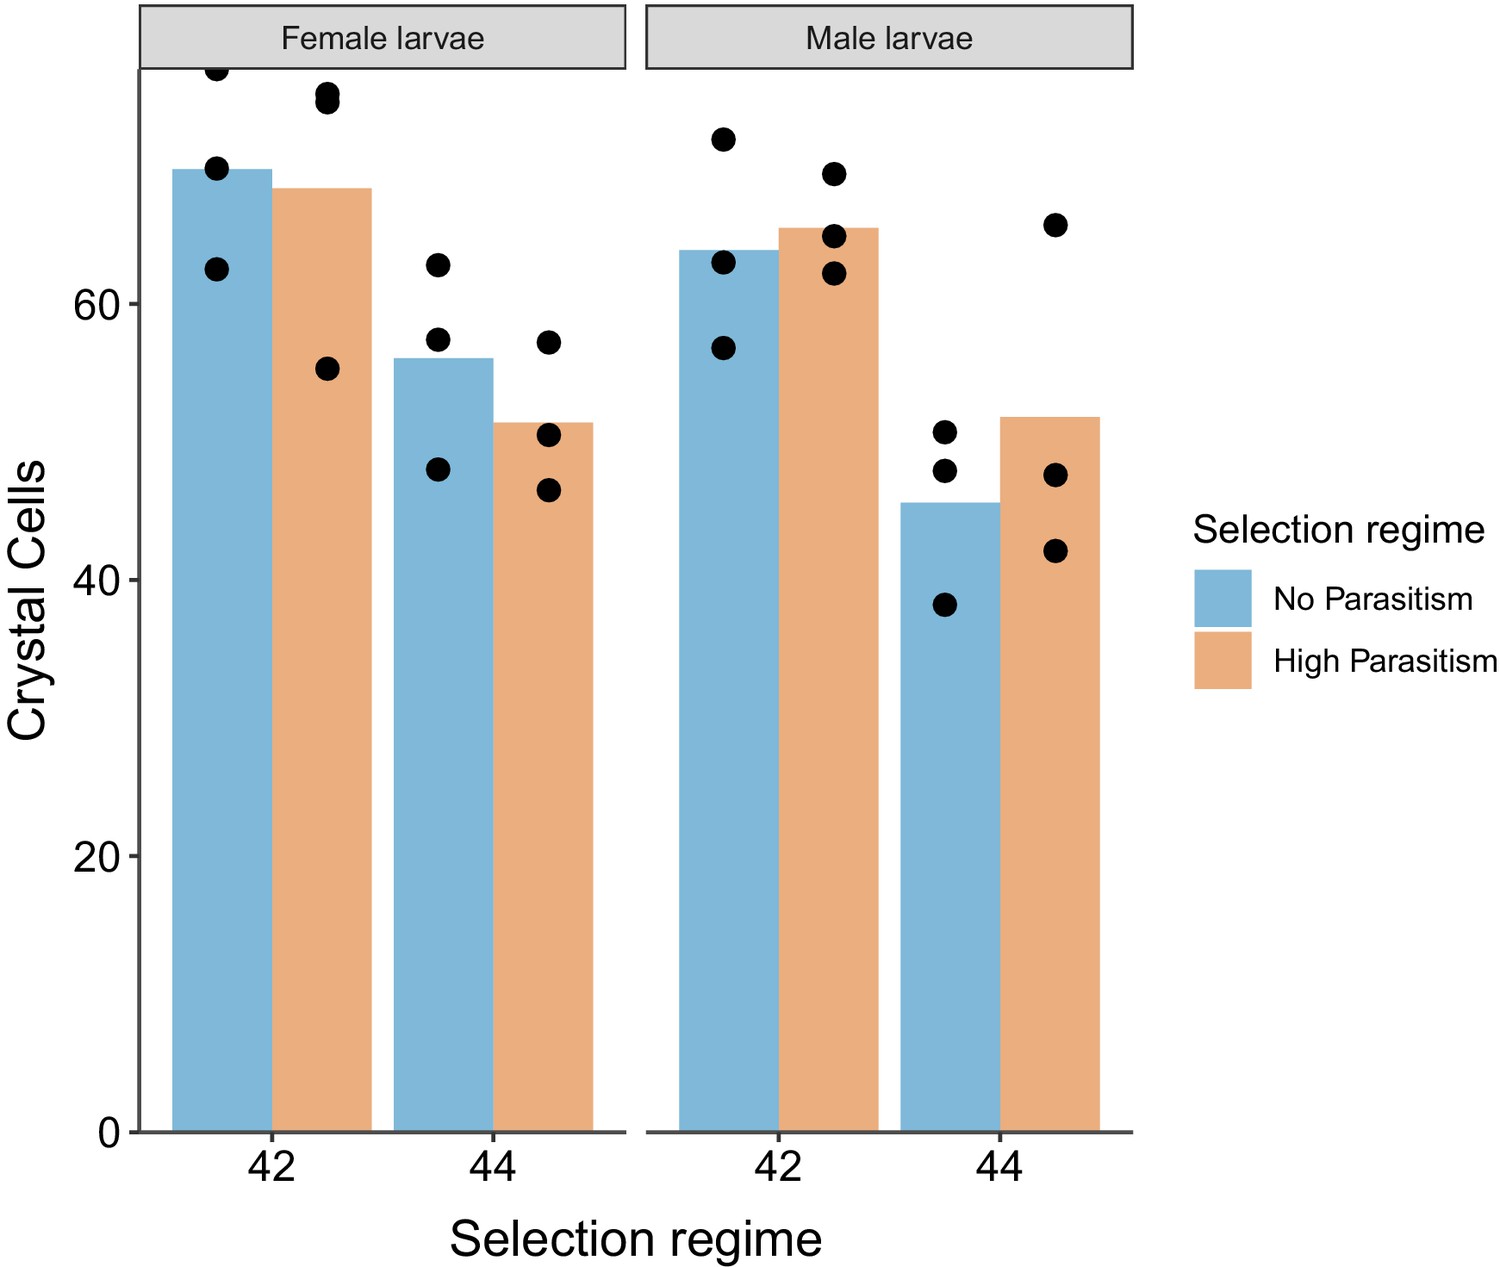
Sessile crystal cells numbers.
Number of sessile crystal cells in dorsal side of the A7 abdominal segment of larvae in male and female larvae. Dots represent the average number of crystal cells calculated from 10 larvae of each triplicate population from both selection regimes. Bar heights represent the average of each selection regime, no parasitism (blue) and high parasitism (Orange).
-
Figure 5—figure supplement 6—source data 1
Sessile crystal cell numbers.
- https://cdn.elifesciences.org/articles/59095/elife-59095-fig5-figsupp6-data1-v2.xlsx
Tables
Key resources table
| Reagent type (species) or resource | Designation | Source or reference | Identifiers | Additional information |
|---|---|---|---|---|
| Software, algorithm | GitHub | https://github.com/ | RRID:SCR_002630 | |
| Software, algorithm | LSD | Schwalb et al., 2020 | https://cran.r-project.org/web/packages/ LSD/index.html | |
| Software, algorithm | MAST | Finak et al., 2015; https://doi.org/10.1186/s13059-015-0844-5 | ||
| Software, algorithm | tidymodels | Kuhn and Wickham, 2020; https://www.tidymodels.org/. | https://www.tidymodels.org/ | |
| Software, algorithm | ranger | doi:10.18637/jss.v077.i01 | RRID:SCR_017344 | https://cran.r-project.org/web/packages/ranger/index.html Version 0.12.1 |
| Software, algorithm | R | http://www.r-project.org/ | RRID:SCR_001905 | Versions 3.6 and 4 |
| Software, algorithm | EBI database | doi: 10.1093/nar/gkz268. | RRID:SCR_004727 | |
| Software, algorithm | Sequence Read Archive | http://www.ncbi.nlm.nih.gov/sra | RRID:SCR_004891 | |
| Software, algorithm | pheatmap | https://www.rdocumentation.org/packages/pheatmap/versions/0.2/topics/pheatmap | RRID:SCR_016418 | |
| Software, algorithm | ArrayExpress | http://www.ebi.ac.uk/arrayexpress/ | RRID:SCR_002964 | |
| Software, algorithm | Gene Expression Omnibus | https://www.ncbi.nlm.nih.gov/geo/ | RRID:SCR_005012 | |
| Software, algorithm | REViGO | doi: 10.1371/journal.pone.0021800. | RRID:SCR_005825 | |
| Software, algorithm | gridExtra | Auguie, 2017; https://CRAN.R-project.org/package=gridExtra | https://cran.r-project.org/web/packages/gridExtra/index.html | |
| Software, algorithm | cowplot | cran | RRID:SCR_018081 | https://cran.r-project.org/web/packages/cowplot/index.html version 1.0.0 |
| Software, algorithm | tidyverse | cran | RRID:SCR_019186 | https://CRAN.R-project.org/package=tidyverse version 1.3.0 |
| Software, algorithm | limma | doi: 10.1093/nar/gkv007. | RRID:SCR_010943 | Version 3.44.3 |
| Software, algorithm | Slingshot | doi: 10.1186/s12864-018-4772-0. | RRID:SCR_017012 | Version 1.6.1 |
| Software, algorithm | KEGG | doi: 10.1093/nar/gkj102. | RRID:SCR_012773 | |
| Software, algorithm | Reactome | doi: 10.1093/nar/gkv1351. | RRID:SCR_003485 | |
| Software, algorithm | Cell Ranger | https://support.10xgenomics.com/single-cell-gene-expression/software/overview/welcome | RRID:SCR_017344 | Version 2.1.1 |
| Software, algorithm | Seurat | doi:10.1016/j.cell.2019.05.031 | RRID:SCR_007322 | Version 3.1.1 |
| Software, algorithm | Flymine | doi:10.1186/gb-2007-8-7-r129 | RRID:SCR_002694 | v51 2020 December |
| Strain, strain background (Drosophila melanogaster) | CAMOP3 | This paper | CAMOP3 | Outbred population of D. melanogaster |
| Antibody | anti-Atilla (mouse monoclonal) | doi: 10.1556/ABiol.58.2007.Suppl.8 | L1 | 1 in 100 |
| Antibody | anti-alphaPS4 (rabbit polyclonal) | doi: 10.1038/nature05650 | 1 in 200 | |
| Antibody | anti-Mys (mouse monoclonal) | Developmental Studies Hybridoma Bank | RRID:AB_528310C; Cat#:F.6G11c | 1 in 100 |
| Sequence-based reagent | PPO3_qPCR_2_Fw | This paper | qPCR primers | GATGTGGACCGGCCTAACAA |
| Sequence-based reagent | PPO3_qPCR_2_Rev | This paper | qPCR primers | GATGCCCTTAGCGTCATCCA |
| Sequence-based reagent | atilla_qPCR2_Fw | This paper | qPCR primers | ACCCACCAAATATGCTGAAACA |
| Sequence-based reagent | atilla_qPCR2_Rv | This paper | qPCR primers | TTGATGGCCGATGCACTGT |
| Sequence-based reagent | RpL32_qPCR_F-d | https://doi.org/10.1371/journal.ppat.1004728 | qPCR primers | TGCTAAGCTGTCGCACAAATGG |
| Sequence-based reagent | RpL_qPCR_R-h | https://doi.org/10.1371/journal.ppat.1004728 | qPCR primers | TGCGCTTGTTCGATCCGTAAC |
| Other | Phalloidin staining | Invitrogen | RRID:AB_2315633; Cat. #: A12381 | 1 in 2000 |
| Other | Mineral oil | Sigma-Aldrich | Cat#: M5904 |
Additional files
-
Supplementary file 1
Gene ontology enrichment for 173 genes that had >50% change in transcript levels after infection or selection.
- https://cdn.elifesciences.org/articles/59095/elife-59095-supp1-v2.csv
-
Supplementary file 2
Enriched gene ontology categories and pathways for non-lamellocyte clusters.
- https://cdn.elifesciences.org/articles/59095/elife-59095-supp2-v2.xlsx
-
Supplementary file 3
10x v2 library sequencing metrics.
- https://cdn.elifesciences.org/articles/59095/elife-59095-supp3-v2.csv
-
Supplementary file 4
Lamellocyte lineage classification with and without cell cycle correction.
- https://cdn.elifesciences.org/articles/59095/elife-59095-supp4-v2.csv
-
Supplementary file 5
List of marker genes for predicting lamellocyte differentiation.
- https://cdn.elifesciences.org/articles/59095/elife-59095-supp5-v2.csv
-
Supplementary file 6
Enriched gene ontology categories and pathways for lamellocytes.
- https://cdn.elifesciences.org/articles/59095/elife-59095-supp6-v2.xlsx
-
Supplementary file 7
Genes detected in scRNA-seq dataset.
- https://cdn.elifesciences.org/articles/59095/elife-59095-supp7-v2.xlsx
-
Supplementary file 8
Cluster markers identified from round one of clustering.
- https://cdn.elifesciences.org/articles/59095/elife-59095-supp8-v2.csv
-
Supplementary file 9
Cluster markers identified from round two of clustering.
- https://cdn.elifesciences.org/articles/59095/elife-59095-supp9-v2.csv
-
Supplementary file 10
Hemocyte classification with and without cell cycle correction.
- https://cdn.elifesciences.org/articles/59095/elife-59095-supp10-v2.csv
-
Supplementary file 11
Hemocyte classification using 2000 highly variable genes or all 7716 detected genes.
- https://cdn.elifesciences.org/articles/59095/elife-59095-supp11-v2.csv
-
Supplementary file 12
Cluster markers identified from round one of subclustering.
- https://cdn.elifesciences.org/articles/59095/elife-59095-supp12-v2.csv
-
Supplementary file 13
Marker genes for non-lamellocyte clusters.
- https://cdn.elifesciences.org/articles/59095/elife-59095-supp13-v2.csv
-
Transparent reporting form
- https://cdn.elifesciences.org/articles/59095/elife-59095-transrepform-v2.docx
Download links
A two-part list of links to download the article, or parts of the article, in various formats.
Downloads (link to download the article as PDF)
Open citations (links to open the citations from this article in various online reference manager services)
Cite this article (links to download the citations from this article in formats compatible with various reference manager tools)
Constitutive activation of cellular immunity underlies the evolution of resistance to infection in Drosophila
eLife 9:e59095.
https://doi.org/10.7554/eLife.59095


