Thermal acclimation of tropical coral reef fishes to global heat waves
- Hawaii Institute of Marine Biology, University of Hawaii, United States
- ARC Centre of Excellence for Coral Reef Studies, James Cook University, Australia
- Halmos College of Arts and Sciences, Nova Southeastern University, United States
- College of Science and Engineering, James Cook University, Australia
- CSIRO, Australia
- Institute of Marine and Antarctic Studies, University of Tasmania, Australia
Figures
Figure 1
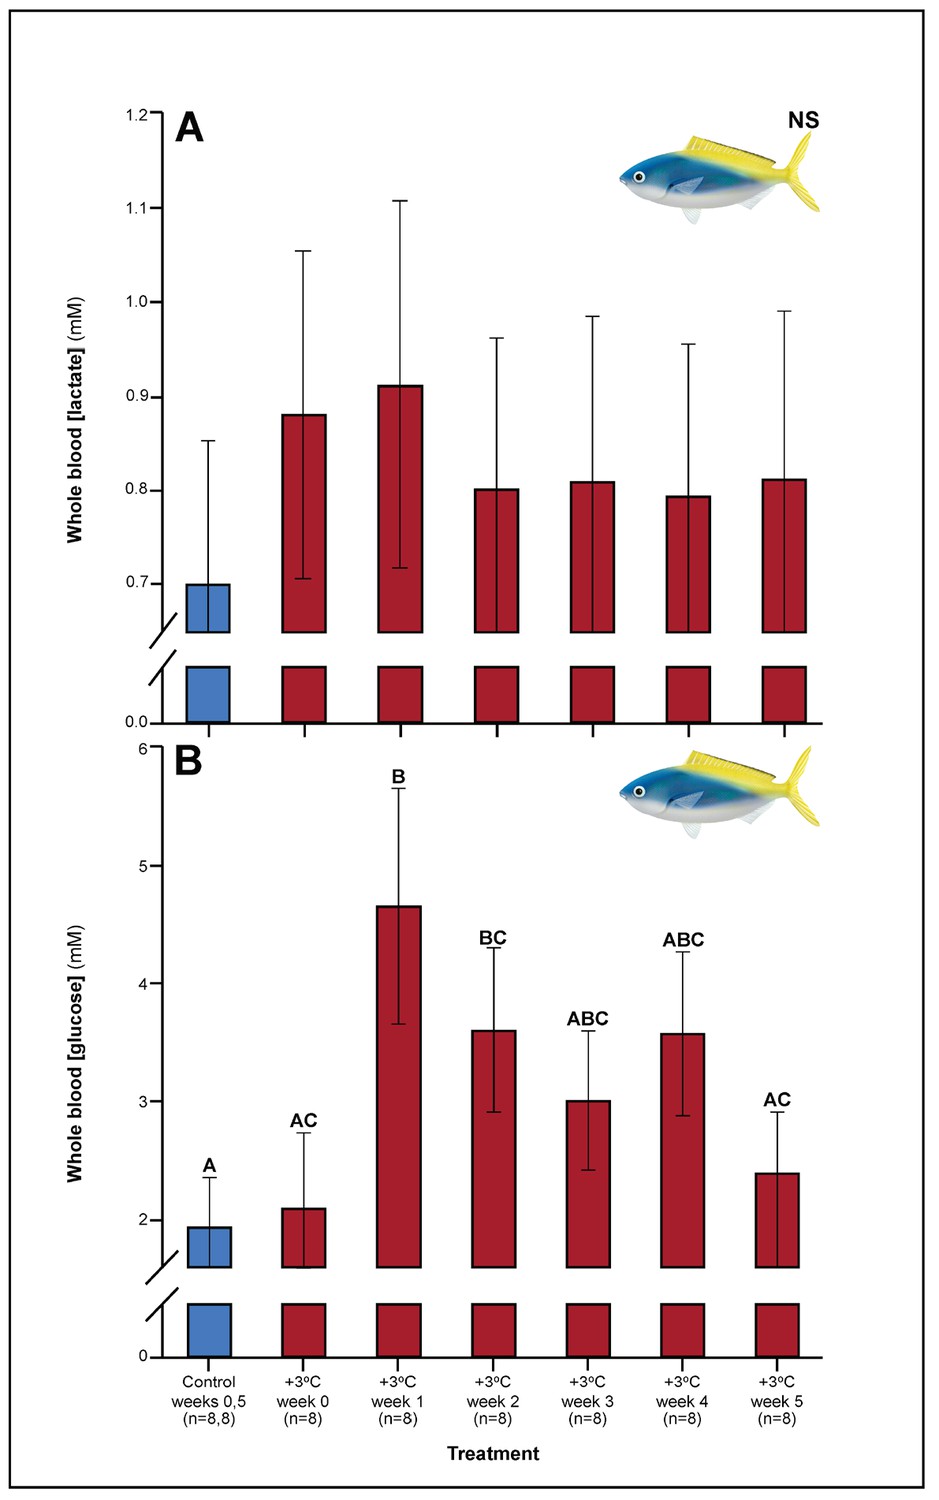
Effect of 5 weeks’ exposure to elevated temperatures (+3.0°C) on whole blood.
(A) Lactate and (B) glucose concentrations in Caesio cuning. The first blue column in each figure illustrates the control (29.0°C). Letters above columns indicate significant differences between treatment groups, determined through multiple comparisons post-hoc testing (based on linear mixed-effects model analysis). ‘NS’ denotes that the model did not indicate any significant effects of temperature. Error bars are s.e.m., and numbers in parentheses below each category on the x-axis denote sample sizes for each group.
Figure 2
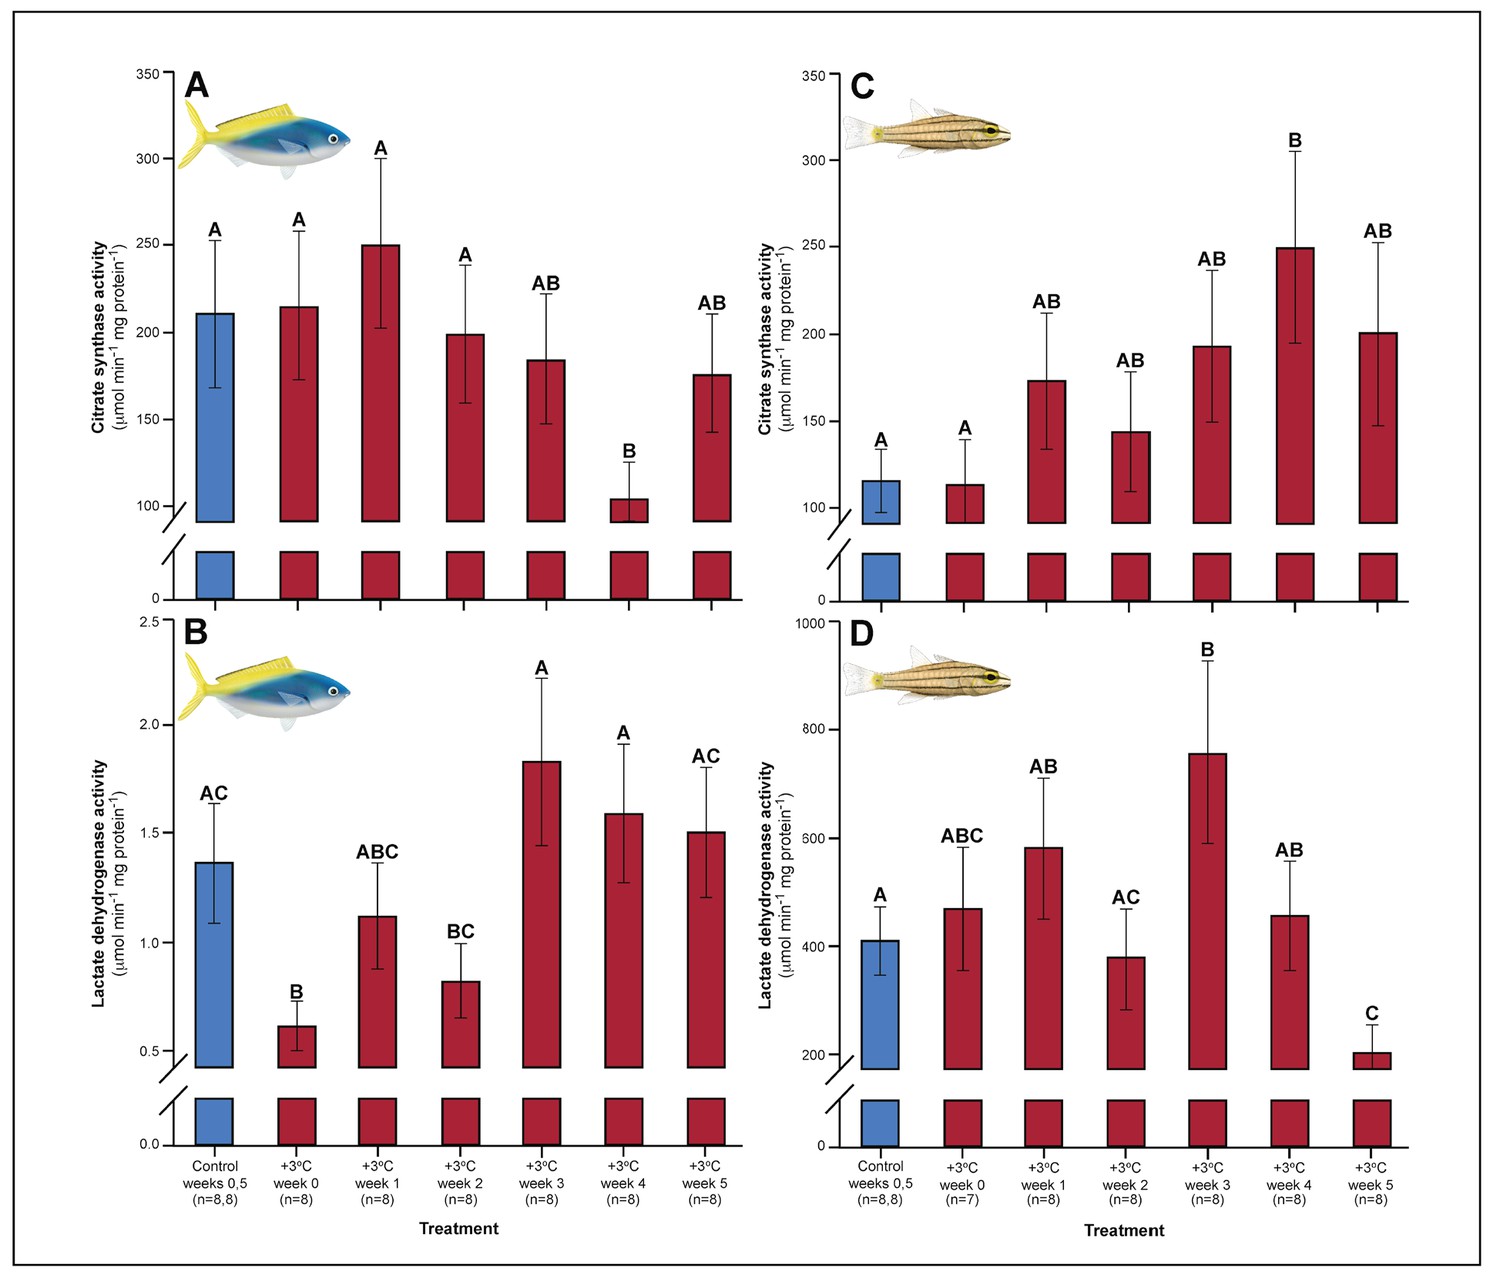
Effect of 5 weeks’ exposure to elevated temperature (+3.0°C) on citrate synthase (CS) and lactate dehydrogenase (LDH) enzyme activity in the pectoral muscle of Caesio cuning (A and B) and Cheilopterus quinquelineatus (C and D).
The first blue column in each figure illustrates the control (29.0°C). Letters above columns indicate significant differences between treatment groups, determined through multiple comparisons post-hoc testing (based on linear mixed-effects model analysis). Error bars are s.e.m., and numbers in parentheses below each category on the x-axis denote sample size.
Figure 3
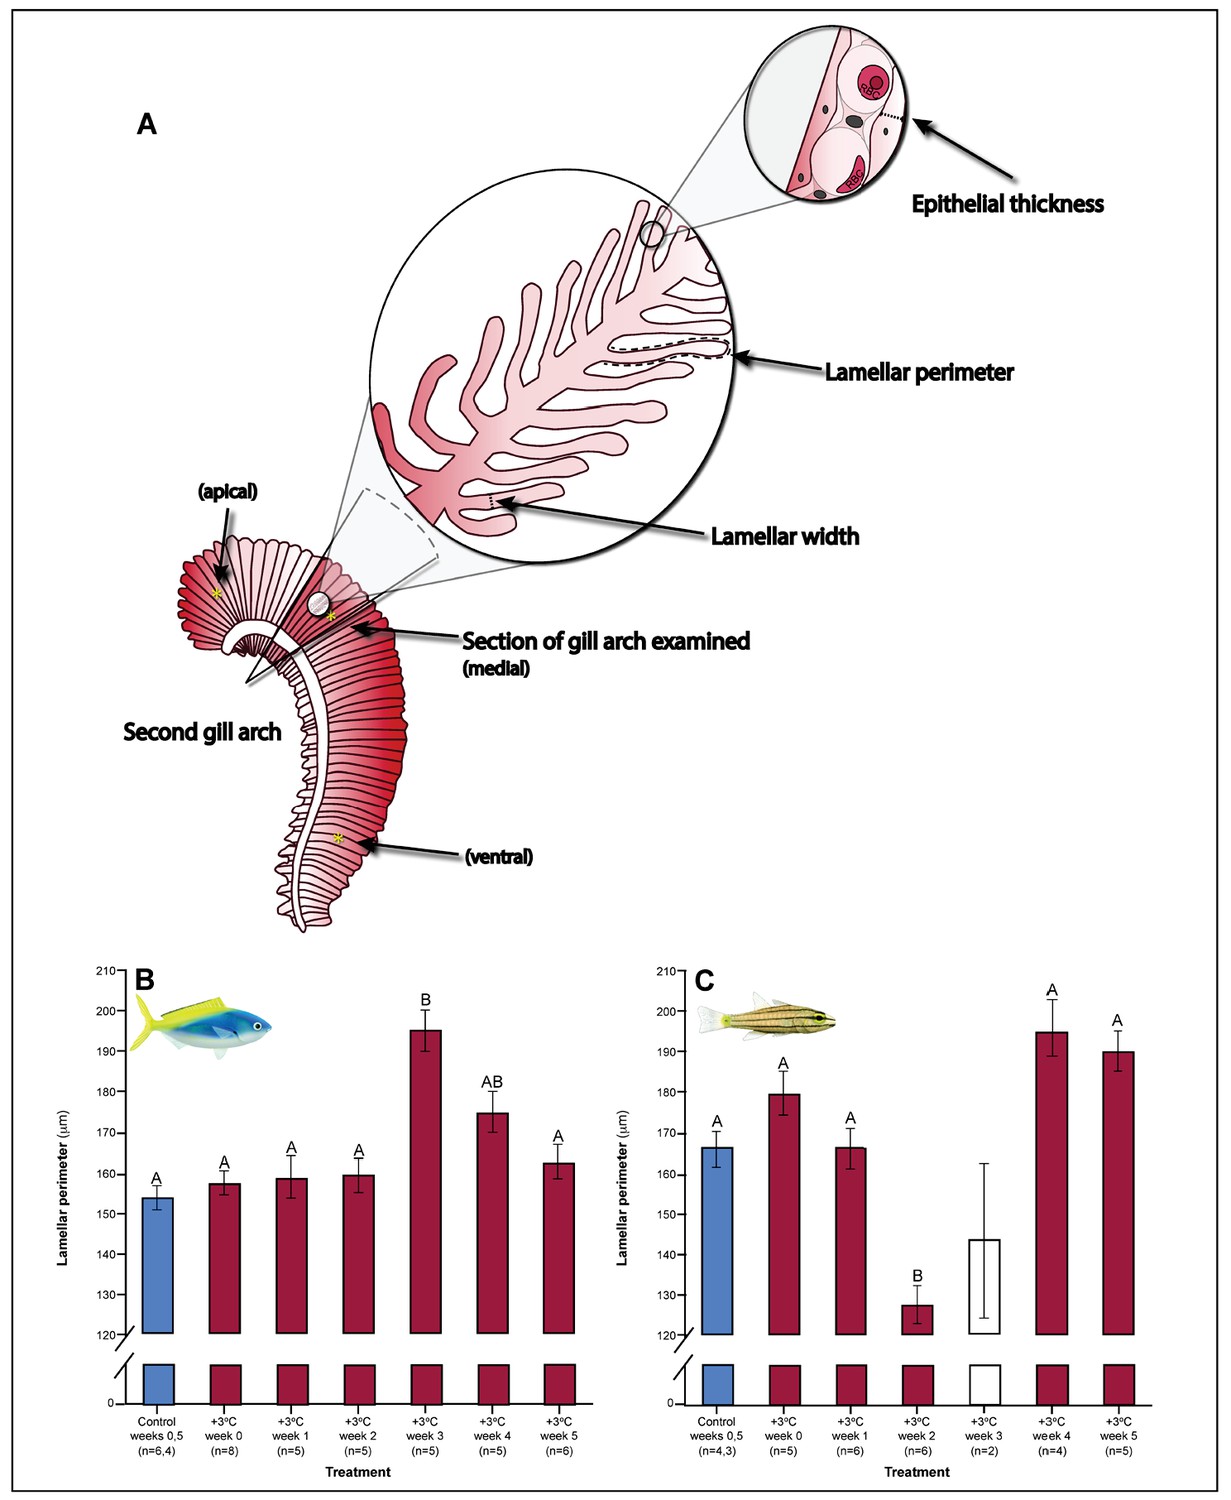
Gill parameters examined throughout the five weeks’ exposure to elevated temperature (+3.0 ̊C).
(A) Illustration of gill parameters examined. The response of lamellar perimeter to elevated changed through time (in mm) in Caesio cunning (B) and Cheilopterus quinquelineatus (C). The first blue column in each figure illustrates the control (29.0 ̊C). Letters above columns indicate significant differences between treatment groups, determined through multiple comparisons post-hoc testing (based on linear mixed-effects model analysis). The white bar denotes data excluded from analyses due to low n, but shown for clarity. Error bars are s.e.m., and numbers in parentheses below each category on the x-axis denote sample size.
Figure 4
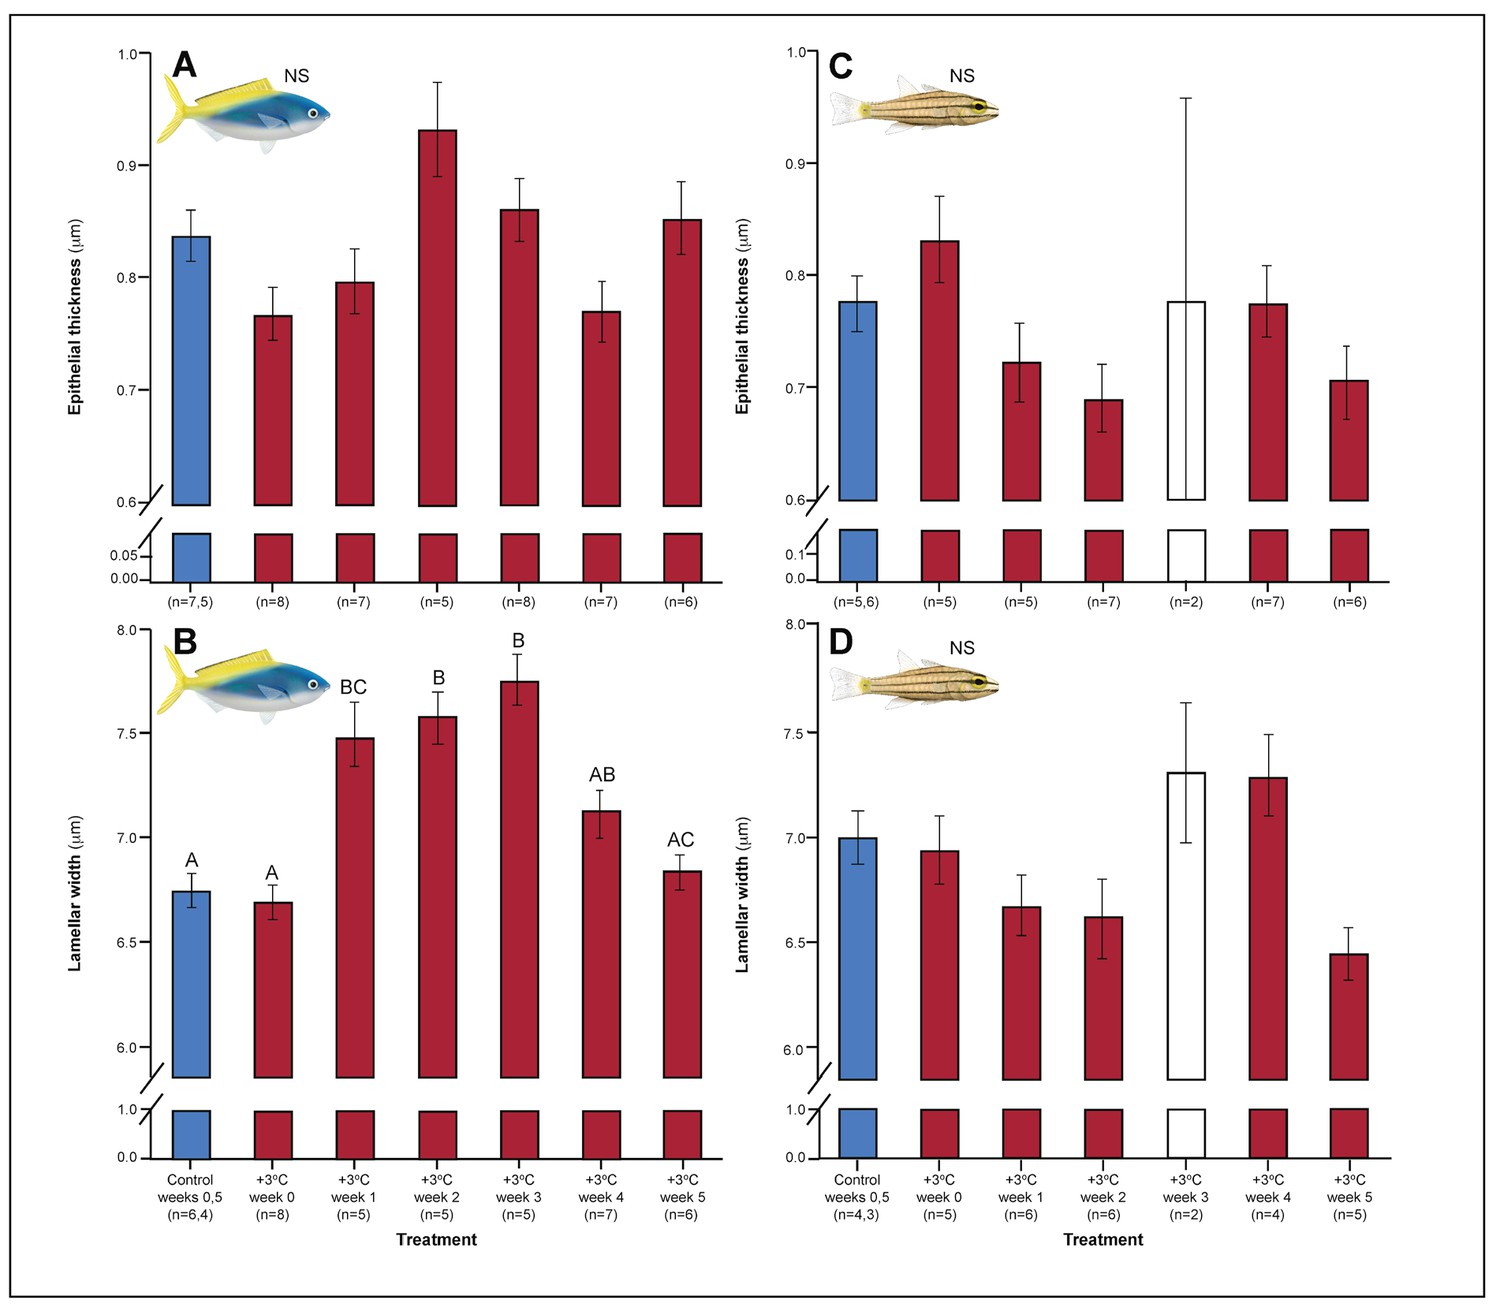
Effect of 5 weeks’ exposure to elevated temperatures (+3.0°C) on epithelial thickness and lamellar width (both in μm) in the gills of Caesio cuning (A and B) and Cheilopterus quinquelineatus (C and D).
The first blue column in each figure illustrates the control (29.0°C). Letters above columns indicate significant differences between treatment groups, determined through multiple comparisons post-hoc testing (based on linear mixed-effects model analysis). The white bar denotes data excluded from analyses due to low n, but shown for clarity. ‘NS’ denotes that the model did not indicate any significant effects of temperature. Error bars are s.e.m., and numbers in parentheses below each category on the x-axis denote sample size.
Figure 5

Effect of 5 weeks’ exposure to elevated temperatures (+3.0°C) on metabolic performance of Caesio cuning (A and B) and Cheilopterus quinquelineatus (C and D).
Estimates of standard (white circles) and maximum (black circles) metabolic rates (A and C) and aerobic scope (ASc = triangles, B and D) are illustrated. The first blue data point in panels B and D represent the control (29.0°C). Letters above data points indicate significant differences between treatment groups, determined through multiple comparisons post-hoc testing (based on linear mixed-effects model analysis). Error bars are s.e.m., and numbers in parentheses below each category on the x-axis denote sample size.
Figure 6

Effect of 5 weeks’ exposure to elevated temperatures (+3.0°C) on spleen somatic index and spleen hemoglobin concentration of Caesio cuning (A and B) and Cheilopterus quinquelineatus (C and D).
The first blue column in each figure illustrates the control (29.0°C). Letters above columns indicate significant differences between treatment groups, determined through multiple comparisons post-hoc testing (based on linear mixed-effects model analysis). ‘NS’ denotes that the model did not indicate any significant effects of temperature. Error bars are s.e.m., and numbers in parentheses below each category on the x-axis denote sample size.
Figure 7
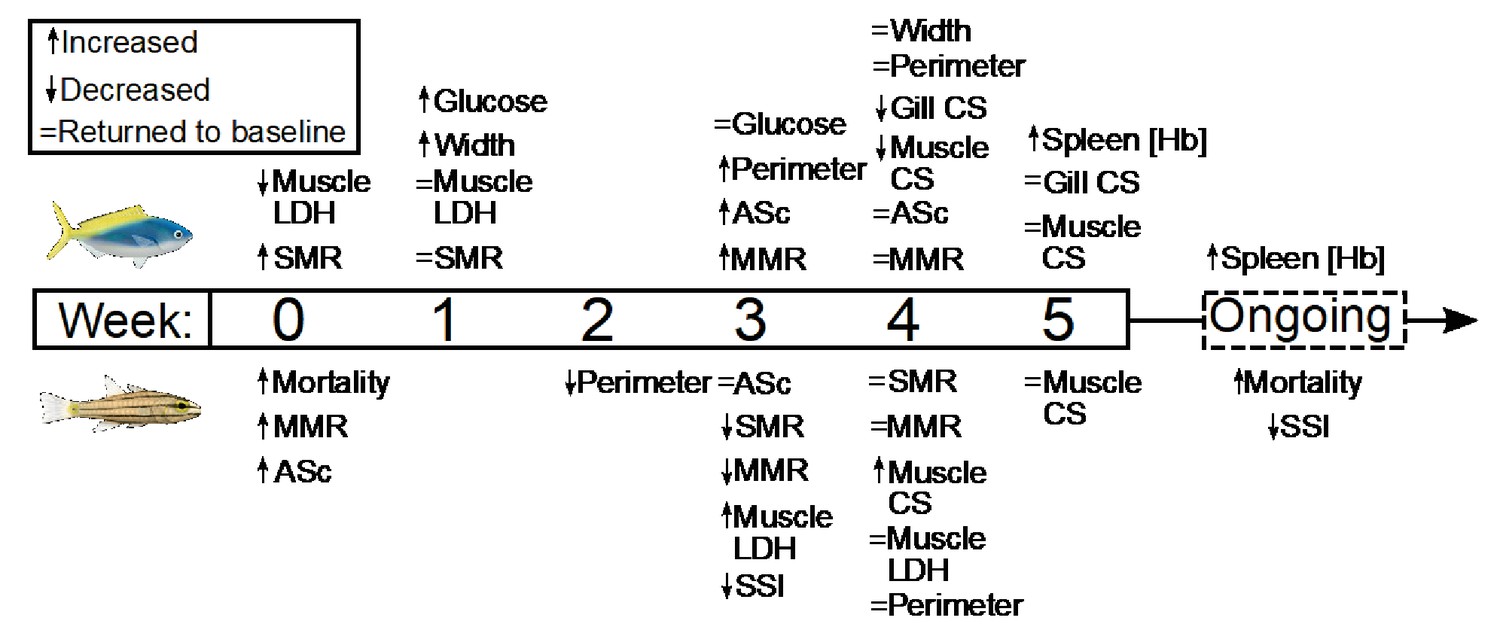
Summary of the timing and duration of the physiological responses of two stenothermal fishes (Caesio cuning, top, and Cheilodipterus quinquelineatus, bottom) to a five-week acute heating event.
Summary of the timing and duration of the physiological responses of two stenothermal fishes (Caesio cuning, top, and Cheilodipterus quinquelineatus, bottom) to a 5-week acute heating event, including responses in mortality, whole organism demand (standard metabolic rate, SMR), whole organism supply (maximum metabolic rate, MMR, and aerobic scope, ASc), tissue demand (citrate synthase, CS, and lactate dehydrogenase, LDH, enzyme activity in the gill and muscle tissue), and tissue supply (lamellar width and perimeter, blood glucose, spleen [Hb], and spleen somatic index, SSI).
Appendix 1—figure 1
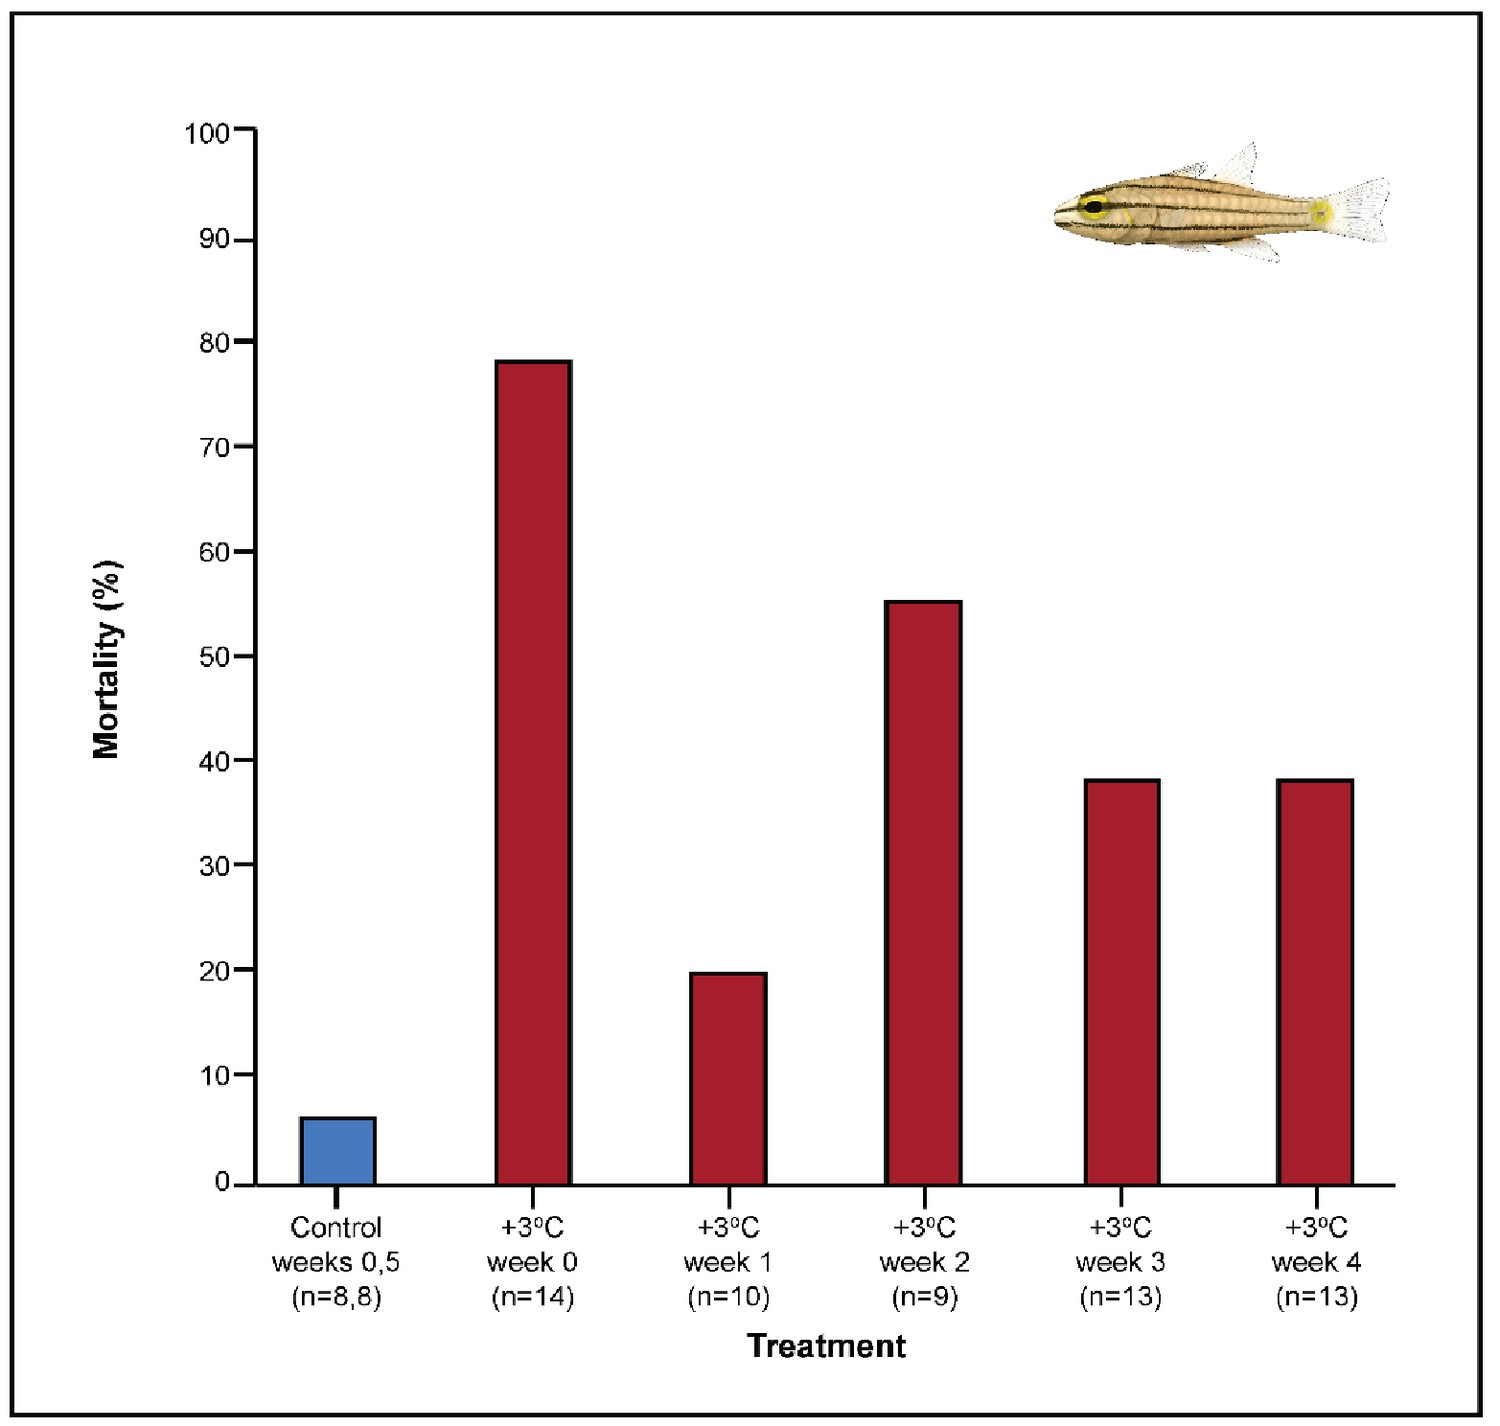
Effect of exhaustive exercise on the mortality (%) of Cheilopterus quinquelineatus.
The first blue column illustrates control mortality (29.0°C), while red columns illustrate elevated temperature effects (+3.0°C). No mortality was seen in Caesio cuning during the experimental period (not depicted). Numbers in parentheses below each category on the x-axis denote sample sizes for each group.
Appendix 1—figure 2

Effect of 5 weeks’ exposure to elevated temperatures (+3.0°C) on citrate synthase (CS) and lactate dehydrogenase (LDH) activity in the gills of Caesio cuning (A and B) and Cheilopterus quinquelineatus (C and D).
The first blue column in each figure illustrates the control (29.0°C). Letters above columns indicate significant differences between treatment groups, determined through multiple comparisons post-hoc testing (based on linear mixed-effects model analysis). ‘NS’ denotes that the model did not indicate any significant effects of temperature. Error bars are s.e.m., and numbers in parentheses below each category on the x-axis denote sample sizes for each group.
Appendix 1—figure 3
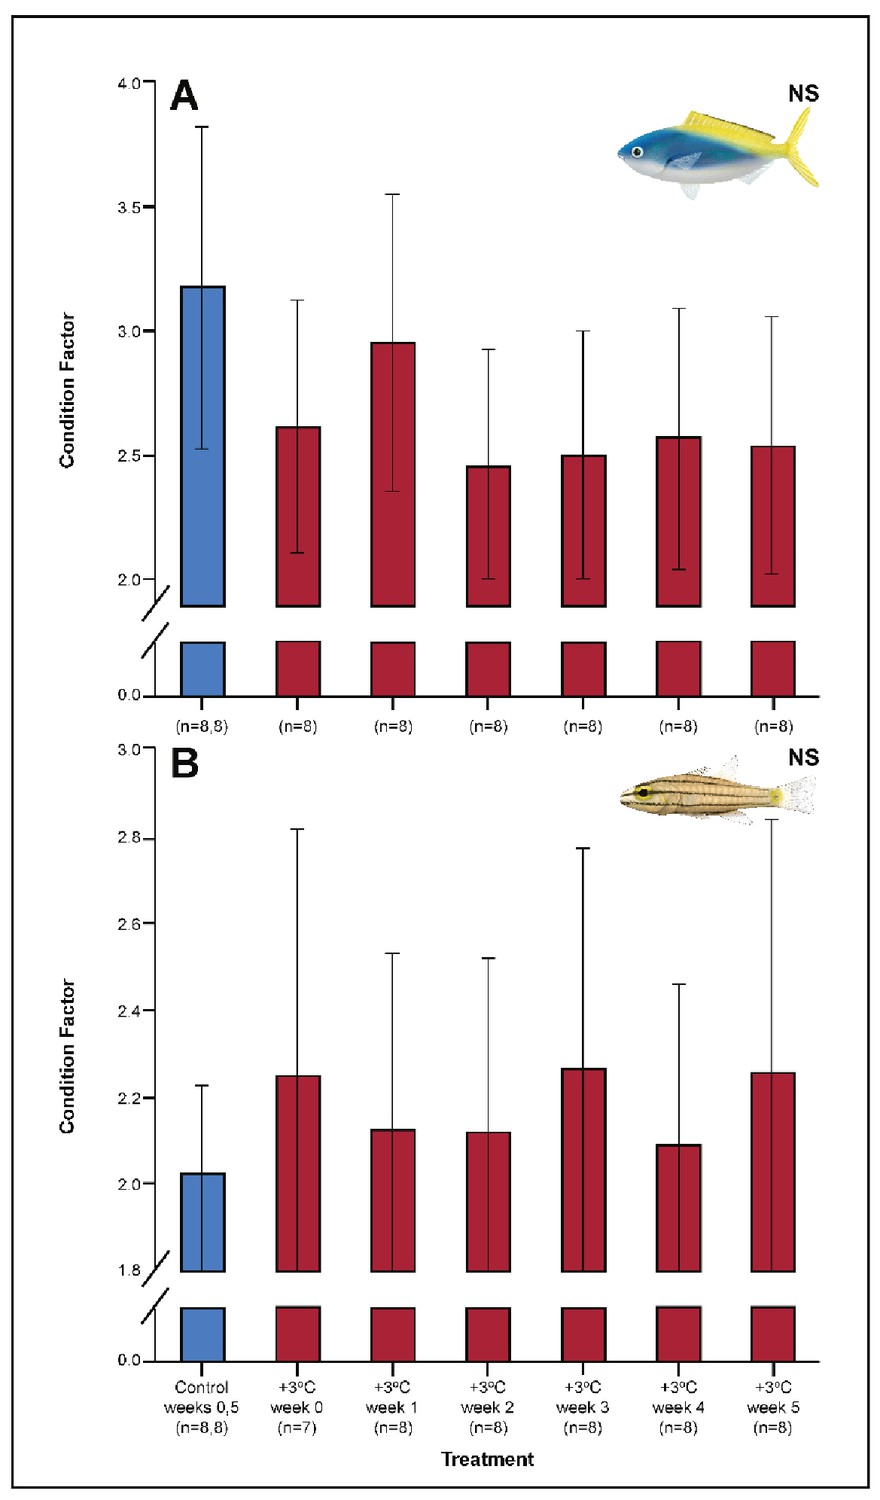
Effect of 5 weeks’ exposure to elevated temperatures (+3.0°C) on Fulton’s K condition factor in Caesio cuning (A) and Cheilopterus quinquelineatus (B).
The first blue column in each figure illustrates the control (29.0°C). ‘NS’ denotes that the linear mixed-effects model analysis did not indicate any significant effects of temperature. Error bars are s.e.m., and numbers in parentheses below each category on the x-axis denote sample sizes for each group.
Appendix 1—figure 4
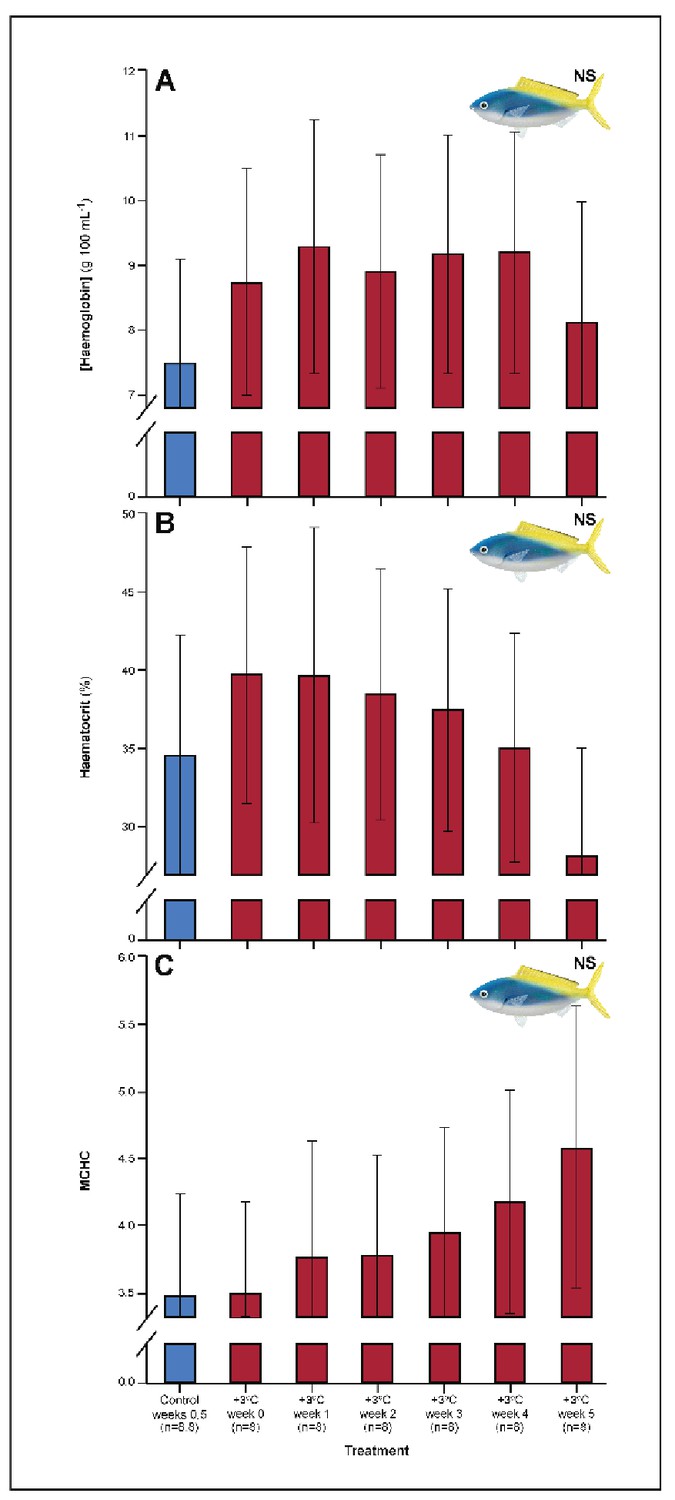
Effect of 5 weeks’ exposure to elevated temperatures (+3.0°C) on (A) hemoglobin concentration, (B) hematocrit, and (C) mean corpuscular haemoglobin content (MCHC) in Caesio cuning.
The first blue column in each figure illustrates the control (29.0°C). ‘NS’ denotes that the linear mixed-effects model analysis did not indicate any significant effects of temperature. Error bars are s.e.m., and numbers in parentheses below each category on the x-axis denote sample sizes for each group.
Tables
Table 1
Acclimation responses of 18 hematological and cardiorespiratory parameters.
| Type | Parameter | Definition |
|---|---|---|
| Muscle + Gill | Citrate synthase activity (CS) | An exclusive marker of the mitochondrial matrix and a marker of mitochondrial density in tissues |
| Lactate dehydrogenase (LDH) | An enzyme involved in anaerobic energy production | |
| Spleen | Spleen somatic index (SSI) | The relative spleen to body mass, used to assess release of red blood cell stores into the blood stream |
| Spleen [Hb] | An indicator of red blood cell production within the spleen | |
| Blood | Mean corpuscular hemoglobin content (MCHC) | Hemoglobin concentration in red blood cells, indicative of blood oxygen carrying capacity |
| Hematocrit (Hct) | The ratio of red blood cells to the total volume of blood | |
| Hemoglobin (Hb) | The protein responsible for transporting oxygen in the blood | |
| Whole blood lactate | Lactic acid appears in the blood as a result of anaerobic metabolism | |
| Whole blood glucose | Used to support the metabolic pathways in the mitochondria and cytoplasm | |
| Gill | Lamellar perimeter | The perimeter of a cross-section of the lamellae measured histologically as a proxy for total diffusible surface area for O2 transport over the lamellae. |
| Lamellar width | The histological total diameter of the lamellae epithelium and capillary. Lamellar width is here used to indicate the epithelial thickness of the lamellae (i.e. diffusion distance for O2). | |
| Epithelial thickness | A measure of the diameter of the epithelia on the lamellae | |
| Whole body metabolism | Standard metabolic rate (SMR) | Baseline oxygen consumption required to maintain bodily functions. |
| Maximum metabolic rate (MMR) | Maximal oxygen consumption | |
| Aerobic scope (ASc) | The difference between MMR and SMR, indicating the maximal O2 available for activity. | |
| Whole body condition | Fulton’s K condition factor | Length-mass relationship used to estimate health of an individual |
Table 2
Sample size of each parameter across species and exposure week.
For histological samples, each Individual was used for both tissue and gill analyses. For respirometry (due to ethical requirements to minimize sample numbers), we used a mixed-staggered repeated measures design in which each individual was tested twice where possible, but with a 3-week separation between each trial (i.e. Week 0 and Week 3, Week 1 and Week 4, and Week 2 and Week 5).
| Species | Parameter | Ctrl Week 0 | Crtl Week 5 | Week 0 | Week 1 | Week 2 | Week 3 | Week 4 | Week 5 |
|---|---|---|---|---|---|---|---|---|---|
| C. quinquelineatus | Tissue | 8 | 8 | 7 | 8 | 8 | 8 | 8 | 6 |
| C. quinquelineatus | Gill (thickness, perimeter, width) | 5, 4, 4 | 6, 3, 3 | 5, 5, 5 | 5, 6, 6 | 7, 6, 6 | 2, 2, 2 | 7, 4, 4 | 6, 5, 5 |
| C. quinquelineatus | Respirometry / mortality | 8 | 8 | 14 | 10 | 9 | 13 | 13 | 0 |
| C. cuning | Tissue / blood | 8 | 8 | 8 | 8 | 8 | 8 | 8 | 8 |
| C. cuning | Gill (thickness, perimeter, width) | 7, 6, 6 | 5, 4, 4 | 8, 8, 8 | 7, 5, 5 | 5, 5, 5 | 8, 5, 5 | 7, 5, 7 | 6, 6, 6 |
| C. cuning | Respirometry / mortality | 8 | 8 | 8 | 7 | 8 | 8 | 7 | 8 |
Additional files
-
Supplementary file 1
Statistical model routines and raw outputs.
- https://cdn.elifesciences.org/articles/59162/elife-59162-supp1-v1.docx
-
Supplementary file 2
Model adjusted means.
- https://cdn.elifesciences.org/articles/59162/elife-59162-supp2-v1.xlsx
-
Transparent reporting form
- https://cdn.elifesciences.org/articles/59162/elife-59162-transrepform-v1.pdf
Download links
A two-part list of links to download the article, or parts of the article, in various formats.
Downloads (link to download the article as PDF)
Open citations (links to open the citations from this article in various online reference manager services)
Cite this article (links to download the citations from this article in formats compatible with various reference manager tools)
Thermal acclimation of tropical coral reef fishes to global heat waves
eLife 10:e59162.
https://doi.org/10.7554/eLife.59162


