Single molecule poly(A) tail-seq shows LARP4 opposes deadenylation throughout mRNA lifespan with most impact on short tails
- Intramural Research Program, Eunice Kennedy Shriver National Institute of Child Health and Human Development, National Institutes of Health, United States
- Commissioned Corps, U.S. Public Health Service, United States
Figures
Figure 1 with 1 supplement
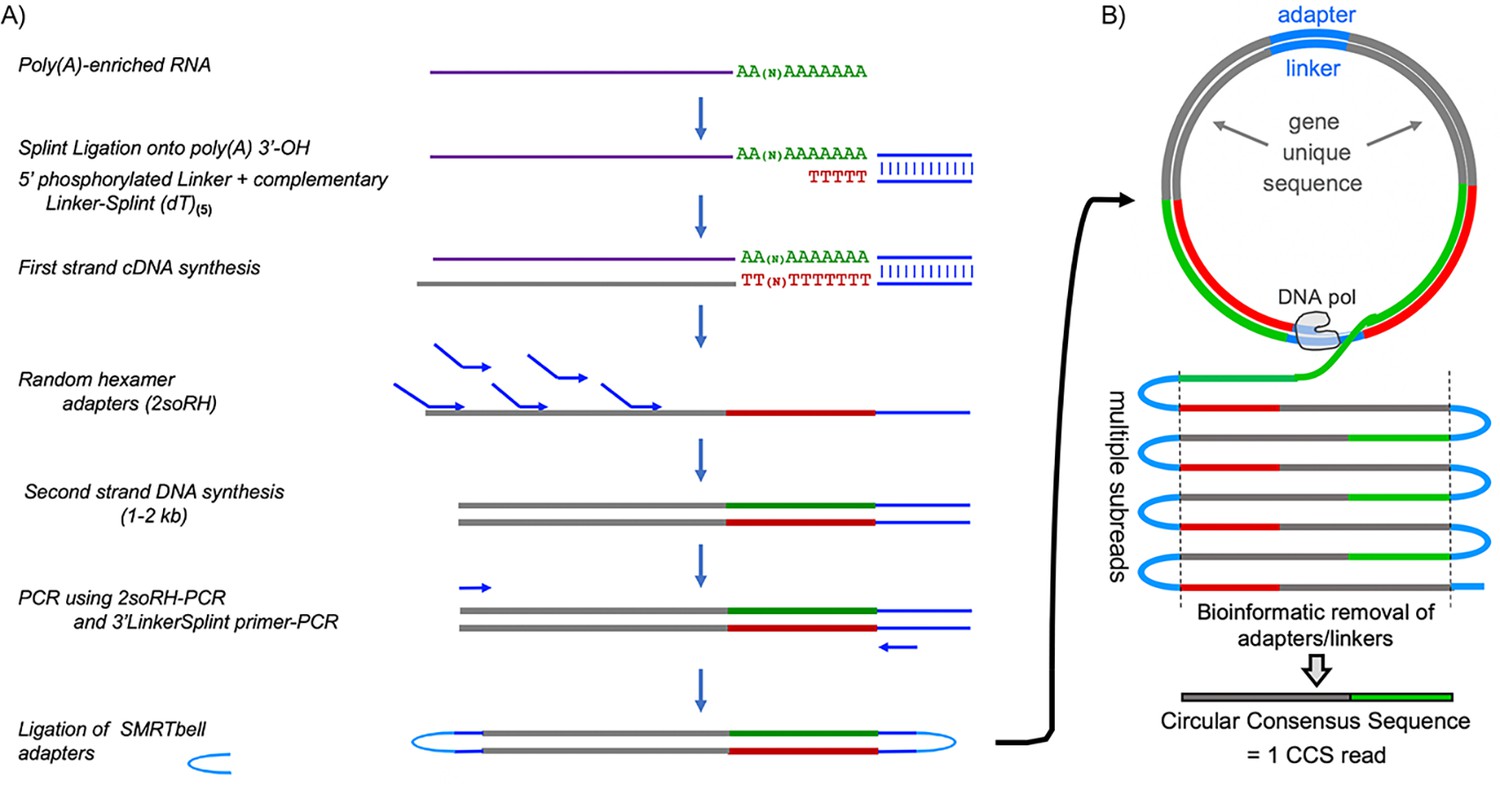
Flow diagram of SM-PAT-seq library preparation, sequencing and read output.
(A) Overview of library construction for SM-PAT-seq, depicting production of a circular DNA from a single mRNA molecule with a specific poly(A) length. (B) Schematic production of one circular consensus sequence (CCS) read (bottom) from the mRNA-derived DNA template as performed by the Pacific Biosciences Sequel system (see text); DNA pol = DNA polymerase.
Figure 1—figure supplement 1

Analysis of SM-PAT-seq performance.
(A) Analysis of libraries from a MEF RNA sample prepared for RNA-seq or SM-PAT-seq. Following RNA-seq, transcripts were aligned with Salmon (Patro et al., 2017) against GENCODE v23 transcripts to generate transcripts per million (TPM) abundance measures. Following SM-PAT-seq and transcript assignment of reads, counts were converted to TPM. Data for all non-zero genes were evaluated for Spearman correlation of abundance, using the base R package (Bates et al., 2020). R2 correlation = 0.58 with p value of 2.2e-16. B) Plot of unique vs. total reads, with the dashed line representing the theoretical perfect library where every sequenced molecule is unique; numerals on axes are millions. The dark pink and blue lines represent actual data for the HEK293 and MEF library data sets, with light shaded regions representing 90% confidence. The data indicate that >99.03% and 99.04% of SM-PAT-seq CCS reads obtained from these libraries were unique.
Figure 2 with 1 supplement
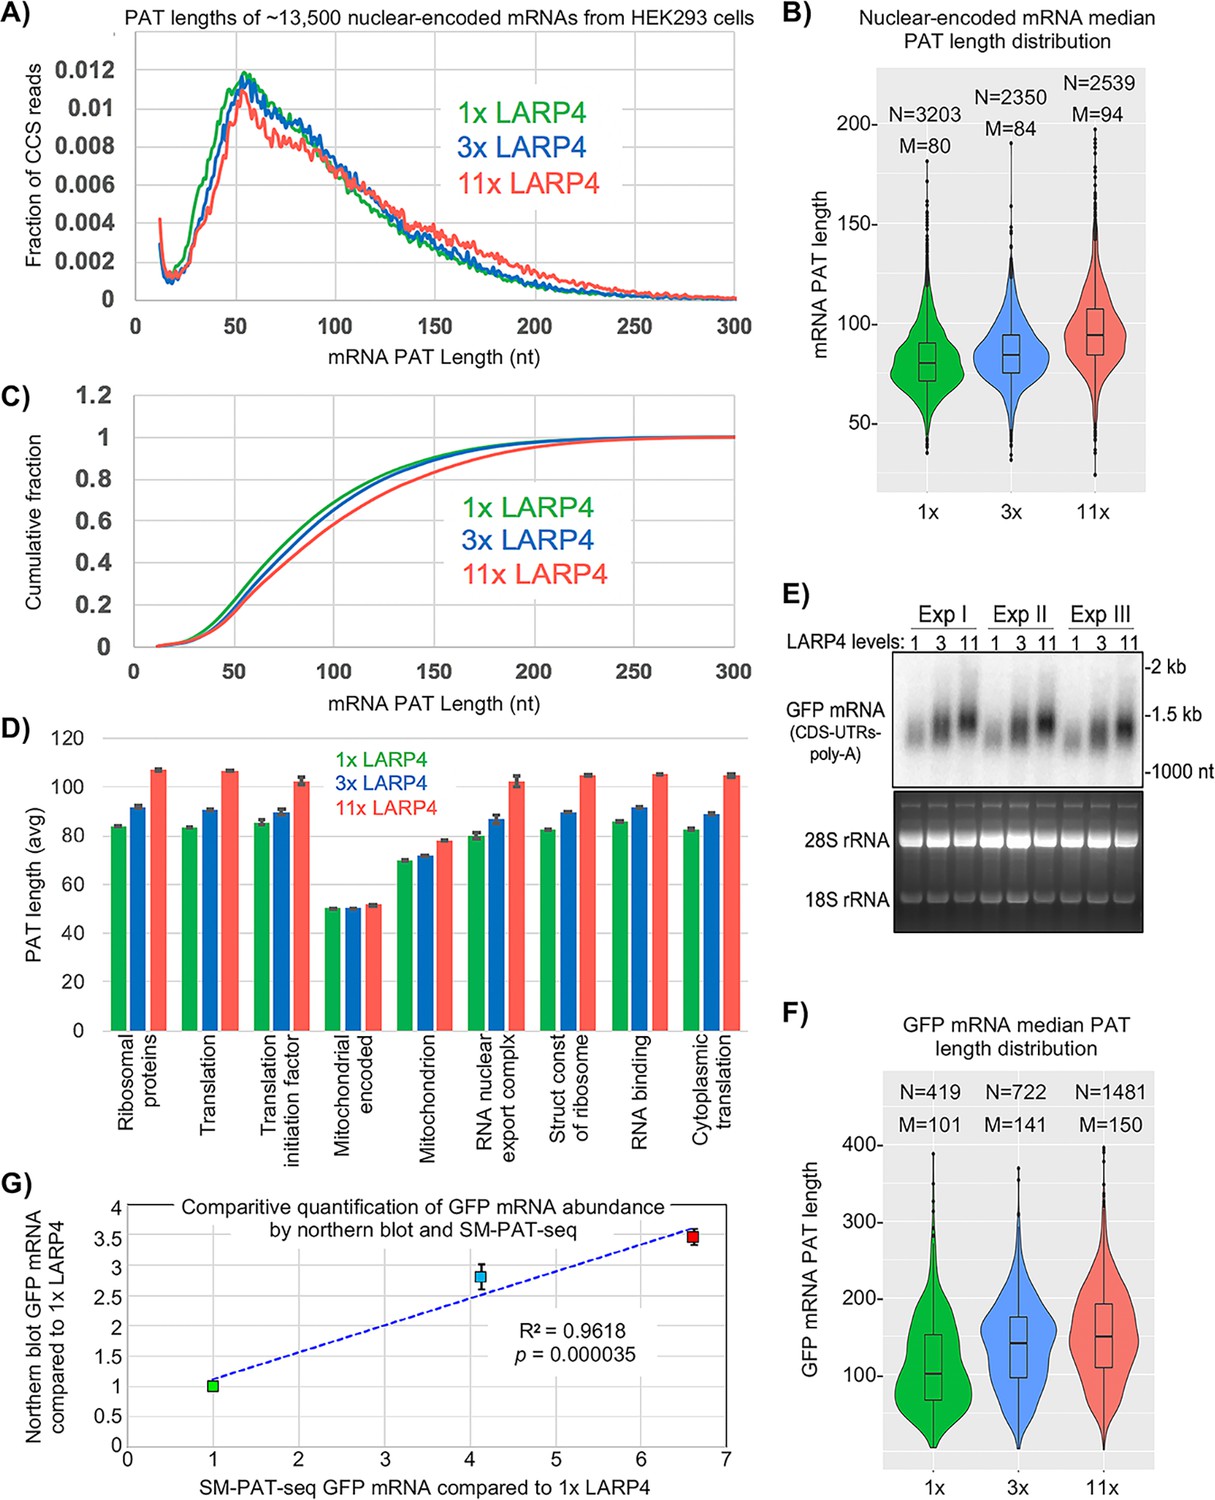
SM-PAT-seq shows LARP4 overexpression increases global PAT length in HEK293 cells.
(A) Fraction of total reads vs. PAT length, at three levels of LARP4 expression, comprising ~13,500 annotated gene transcripts, with ~200,000 CCS reads per condition. (B) Violin plots of median PAT lengths determined for genes with ≥10 CCS reads. N: number of genes, M: median length. The p values calculated using a 2-tailed Welch's T-test with unequal variance are as follows; 1x vs 3x: 4.81E-17, 3x vs 11x: 3.94E-102, and 1x vs 11x: 3.10E-186. (C) The data in C plotted as cumulative distribution, read fraction sum at or below PAT length x. Analyses in A-C excluded mitochondrial-encoded transcripts. (D) Average PAT lengths for various functional group mRNAs as determined by gene ontology (GO) analysis, error bars represent the standard error. (E) Northern blot analysis of the triplicate RNA samples used for SM-PAT-seq probed for GFP mRNA. Bottom is gel prior to transfer. (F) GFP mRNA median PAT-length by SM-PAT-Seq. N: number of GFP CCS reads, M: median length. The p values calculated for the GFP mRNA median PAT lengths using a 2-tailed Welch's T-test with unequal variance are as follows; 1x vs 3x: 2.72E-10, 3x vs 11x: 3.60E-8, and 1x vs 11x: 4.01E-27. (G) Comparison of the triplicate GFP CCS reads and the triplicate GFP mRNA quantitation by northern blot for1X, 3X and 11X LARP4 levels revealed a R2 = 0.96 with a p value of = 0. 000035 calculated using Fisher transformation of the correlation coefficient and the sample size; the error bars reflect standard deviation of the Northern data.
Figure 2—figure supplement 1
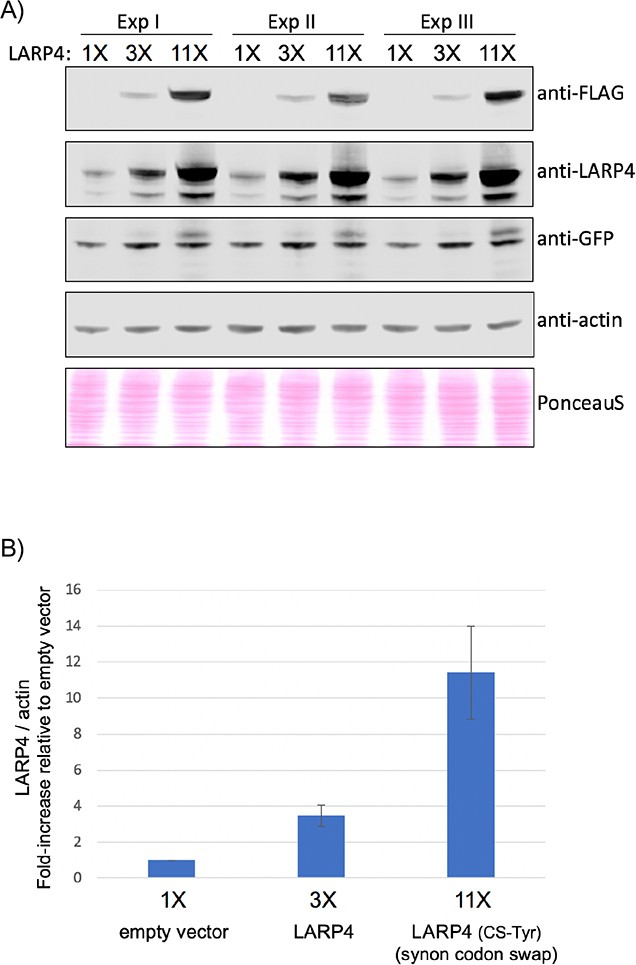
Quantification of LARP4 expression levels in HEK293 cells analyzed by SM-PAT-seq in biological triplicate experiments I, II and III.
(A) Western blot analysis of the same HEK293 cells that were used for the triplicate SM-PAT-seq in Figure 2. Antibodies used are indicated and the bottom panel represents total protein stained with PonceauS. Signals were scanned and quantified using the Odyssey CLx imaging system (LI-COR Biosciences). (B) Graph of the quantitation of the signals from the FLAG-antibody, normalized by Actin. Error bars represent the standard deviation.
Figure 3 with 1 supplement
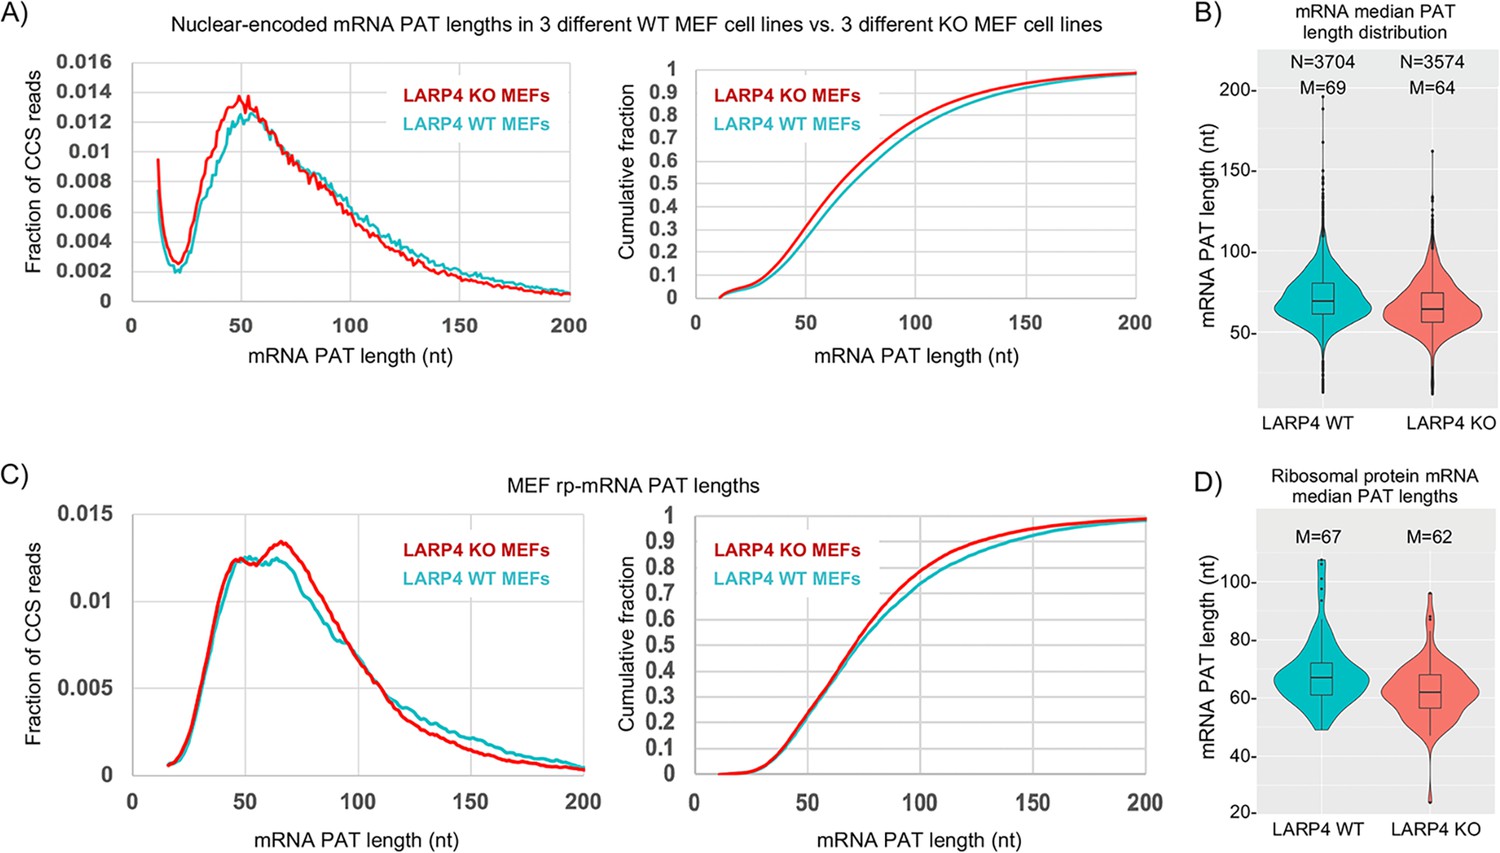
LARP4 deletion decreases mRNA PAT length in MEFs.
(A) Left: Fraction of total CCS reads vs. PAT length for triplicate WT vs. LARP4 KO MEFs for ~10,500 nuclear-encoded mRNAs. Right: The same data plotted as cumulative distribution. The p value for WT vs KO calculated using a 2-tailed Welch's T-test with unequal variance was 4.53E-291. (B) Violin plots of median PAT length distribution per gene as described for Figure 2B. The p value for WT vs KO median PAT lengths calculated using a 2-tailed Welch's T-test with unequal variance was 9.34E-55. (C) Left: Fraction of total CCS reads vs. PAT length for a subset of 77 ribosomal protein-mRNAs data from A. The p value for WT vs KO rpmRNAs calculated using a 2-tailed Welch's T-test with unequal variance was 1.81E-61. Right: The same data plotted as cumulative distribution. (D) Violin plots of median PAT length distribution per rp-mRNA as described for Figure 2B, on the rp-mRNAs in panel C with ≥10 CCS reads. The p value for WT vs KO median PAT lengths for rp-mRNAs was calculated using a 2-tailed Welch's T-test with unequal variance was 0.000431.
Figure 3—figure supplement 1
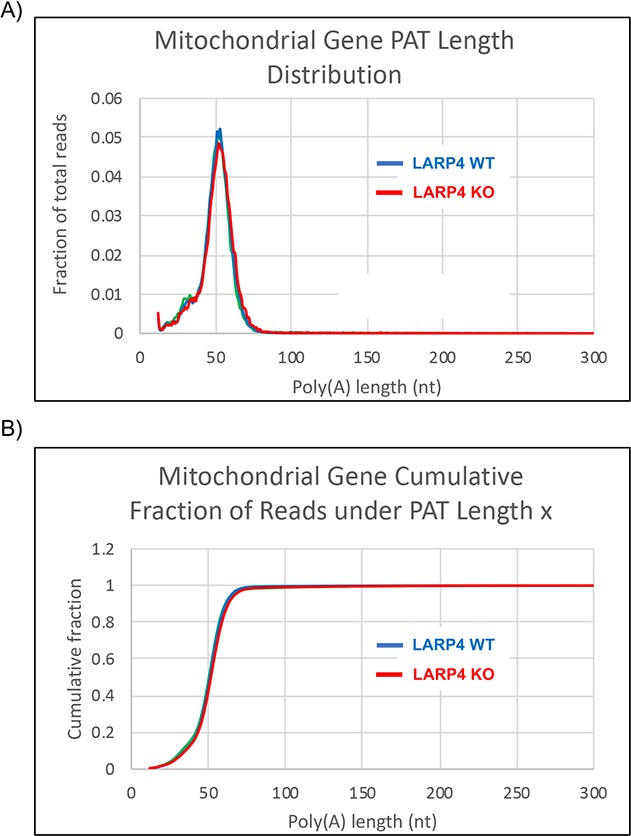
SM-PAT-seq profiles of mitochondrial DNA encoded mRNAs.
(A) Fraction of total CCS reads vs. PAT length, from biological triplicate MEF data, comprising only the mitochondrially-encoded mRNAs from Figure 3. (B) The same data in A plotted as cumulative distribution.
Figure 4
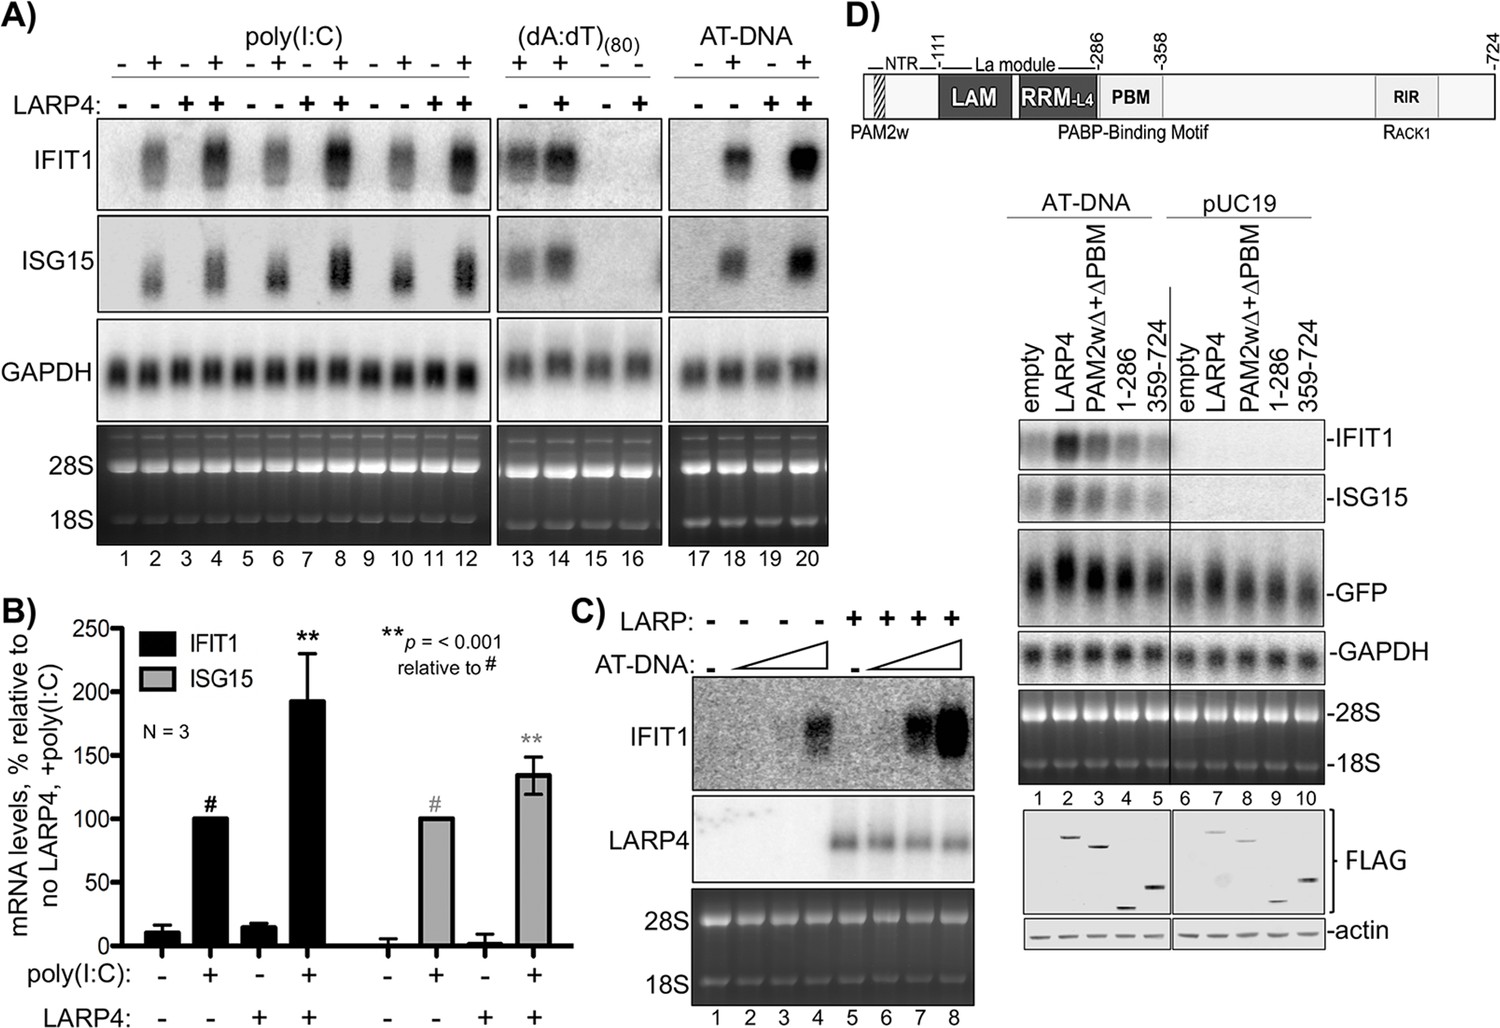
LARP4 promotes accumulation of interferon-induced innate immune mRNAs.
(A) Northern blot analysis of two ISG mRNAs, IFIT1 and ISG15 after transfection-mediated induction by IFN-stimulating nucleic acids, and + / - co transfection with LARP4, as indicated above the lanes. Bottom panels are stained gels prior to transfer. (B) Quantitation of biological triplicate northern blot data, normalized by GAPDH, with the poly(I:C) +, LARP4 - sample (annotated with # above the bar) set to 100%; error bars represent 95% confidence interval. P values were calculated using a 2-tailed Welch's T-test with unequal variance. (C) Northern blot of IFIT1 and LARP4 from total RNA 48 hr after transfection of 0, 2, 4 or 6 µg of 1 kb AT-rich DNA in 6-well format (the total DNA amount for this component of the transfection was maintained at 6 µg with carrier pUC19), plus 2.5 µg pFLAG-LARP4 (+) or empty pFLAG vector (-) as indicated. (D) Top: schematic of LARP4 showing its two PABP-interaction motifs, PAM2w and PBM, the La-module comprised of LaM (La motif) and RRM-L4, and the RACK-1 interaction region (RIR). The N-terminal region (NTR) which is responsible for poly(A)-binding (Cruz-Gallardo et al., 2019), is also indicated. Middle: Northern blot after co-transfection of 1 kb AT-rich DNA or pUC19 and various LARP4 constructs indicated above the lanes. Bottom: Western blot analysis of protein from the same cells.
Figure 5 with 1 supplement
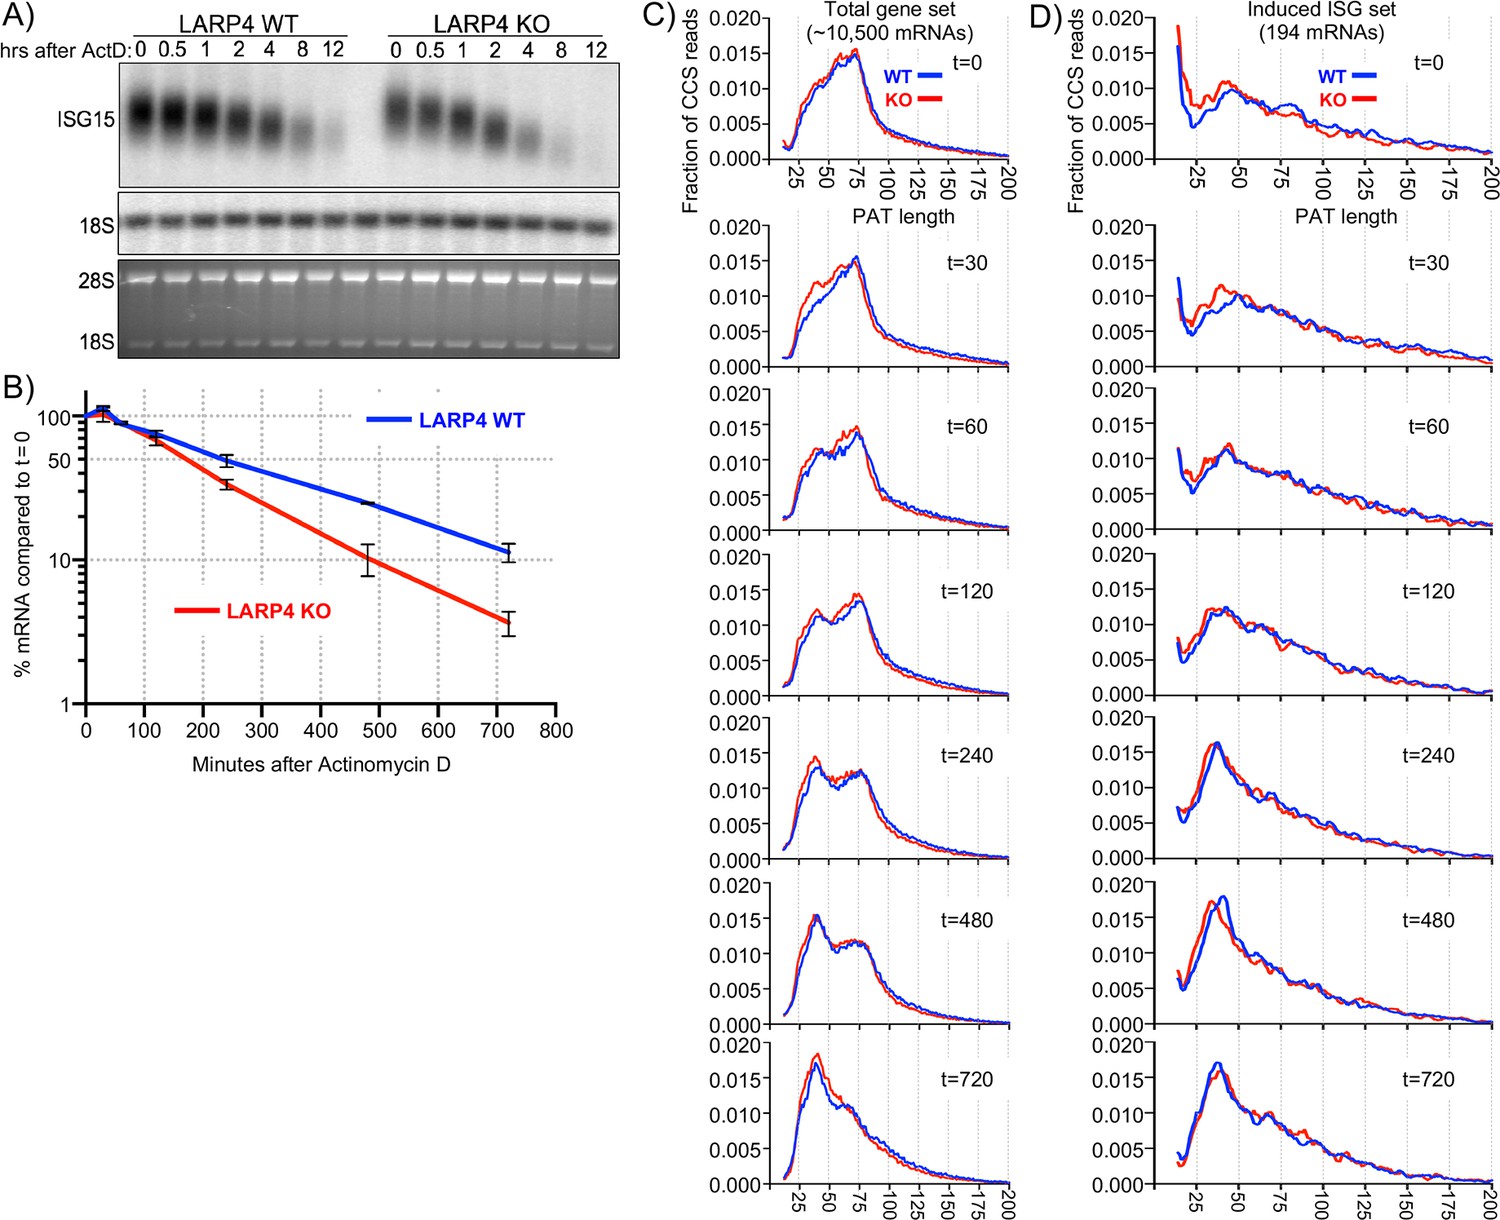
SM-PAT-seq decay analysis of total and ISG mRNAs.
Duplicate sets of LARP4 KO and WT MEFs were treated with IFNα, followed by transcription inhibition with actinomycin D, RNA isolation at multiple times thereafter, and analysis as follows. (A) Northern blot probed for ISG15 mRNA and 18S rRNA (top panel); stained gel prior to transfer (bottom panel). (B) Quantitation of biological duplicate northern data. ISG15 signal was normalized to 18S rRNA; t = 0 was set to 100%, error bars represent the spread. (C) Fraction of SM-PAT-seq CCS reads vs. PAT length for each time point after ActD addition for the gene set of ~10,500 mRNAs as in Figure 3A. (D) Fraction of SM-PAT-seq CCS reads vs. PAT length for each time point for the ISG set of 194 mRNAs. For C and D, the mitochondrial-encoded reads were filtered out.
Figure 5—figure supplement 1

Time course analysis of deadenylation by SM-PAT-seq.
(A) Box plots of median PAT lengths for total nuclear-encoded mRNAs in LARP4 KO and WT MEFs at various times after ActD as indicated above the tracks; boxes show 95% confidence intervals. (B) Box plots of median PAT lengths for ISG mRNAs in KO and WT as in A. (C) Box plots of median PAT lengths for the ISG mRNAs after sorting of reads based on PAT length as described in the text.
Figure 6
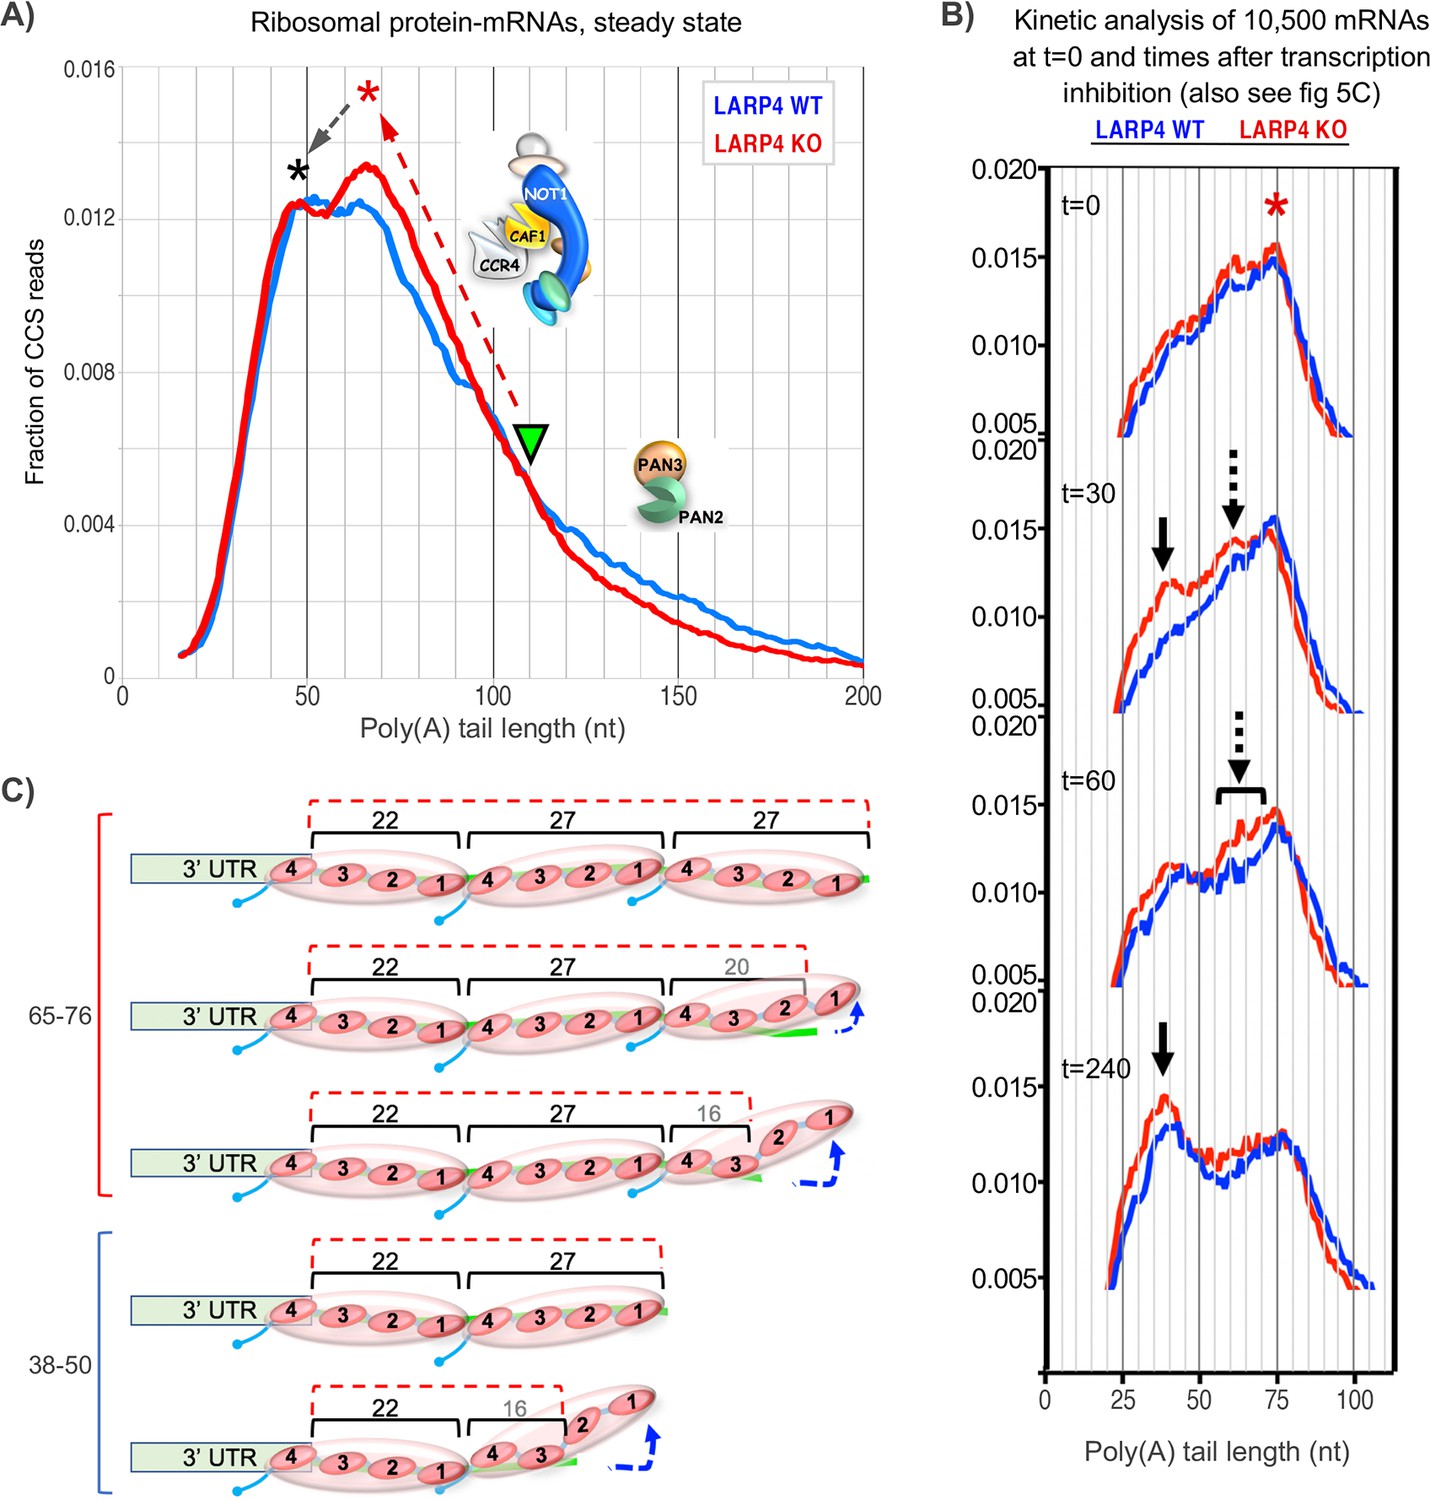
Proposed working models for differential deadenylation profiles in LARP4 KO and WT MEFs (derived from Figure 3A and select panels of 5C).
(A) LARP4 effects on phasing of a set of ~80 ribosomal protein mRNAs at steady state was revealed by plotting the fraction of CCS reads vs. PAT lengths. A green triangle points to where the KO and WT transitions from long to short PATs intersect, at ~110 nt. The upward red dashed arrow denotes a steeper incline in KO as compared to WT of long to short PAT length transition. The red asterisk denotes the ~60–75 nt PATs whose peak is comprised of a substantially higher fraction of reads in KO as compared to WT cells. The black dashed arrow denotes conversion of longer to shorter PAT complexes in the peaks denoted by the corresponding asterisks. In this model, the peak denoted by the red asterisk would correspond to PATs bound by three PABPs that include peeling off/dissociation intermediates schematized in the upper part of panel C, and the peak denoted the black asterisk would correspond to PATs bound by two PABPs. As the two profiles transition from long to shorter PATs they begin to overlap at PAT lengths of ~110 nt which would correspond to mRNP complexes containing four PABPs or two PABP-dimers. These profiles suggest that as PATs shorten from this transition point and the distal PABP would begin to dissociate, CNOT may be less impeded in the absence of LARP4 (see text). Thus LARP4 may exert a stabilizing effect at this point. (B) Transcriptome-wide dynamic PAT phasing observed in SM-PAT-seq profiles in Figure 5C illustrating a deadenylation time course after transcription inhibition by actinomycin D. Red asterisk denotes the 75 nt PAT peak at t = 0; panels depicting t = 30, 60 and 240 min are also shown as labeled. Solid black arrow denotes a ~ 38 nt PAT peak, dashed arrows and bracket denote proposed intermediate (see text and Figure 5C). (C) Schematized depiction of potential PAT-PABP(3) and PAT-PABP(2) complexes and intermediate binding forms thereof that might comprise the mRNA-PAT profile peaks in A and B, in various states of peeling off modes of PABP dissociation, modeled after Webster et al., 2018 and discussed in the text.
Additional files
-
Supplementary file 1
HEK293 mRNA PAT data (E, WT and CS corresponds to 1X, 3X and 11X) triplicate, for Figure 2.
- https://cdn.elifesciences.org/articles/59186/elife-59186-supp1-v2.xlsx
-
Supplementary file 2
WT and KO MEF mRNA PAT data, for Figure 3.
- https://cdn.elifesciences.org/articles/59186/elife-59186-supp2-v2.xlsx
-
Supplementary file 3
128 ISG mRNAs induced to ≥1.5 fold higher in HEK293 by 3X LARP4 relative to 1X.
- https://cdn.elifesciences.org/articles/59186/elife-59186-supp3-v2.xlsx
-
Supplementary file 4
194 ISG mRNAs induced to ≥2 fold higher levels in MEFs by IFNα.
- https://cdn.elifesciences.org/articles/59186/elife-59186-supp4-v2.xlsx
-
Supplementary file 5
Primers and adapters used for SM-PAT-seq.
- https://cdn.elifesciences.org/articles/59186/elife-59186-supp5-v2.xlsx
-
Supplementary file 6
Oligo probe sequences and hybridization temperatures used for northern blots.
- https://cdn.elifesciences.org/articles/59186/elife-59186-supp6-v2.docx
-
Transparent reporting form
- https://cdn.elifesciences.org/articles/59186/elife-59186-transrepform-v2.docx
Download links
A two-part list of links to download the article, or parts of the article, in various formats.
Downloads (link to download the article as PDF)
Open citations (links to open the citations from this article in various online reference manager services)
Cite this article (links to download the citations from this article in formats compatible with various reference manager tools)
Single molecule poly(A) tail-seq shows LARP4 opposes deadenylation throughout mRNA lifespan with most impact on short tails
eLife 9:e59186.
https://doi.org/10.7554/eLife.59186


