Inference from longitudinal laboratory tests characterizes temporal evolution of COVID-19-associated coagulopathy (CAC)
- nference, inc, United States
- Mayo Clinic, United States
- Mayo Clinic Laboratories, United States
- Mayo Clinic Platform, United States
- Janssen pharmaceutical companies of Johnson & Johnson (J&J), United States
Figures
Figure 1
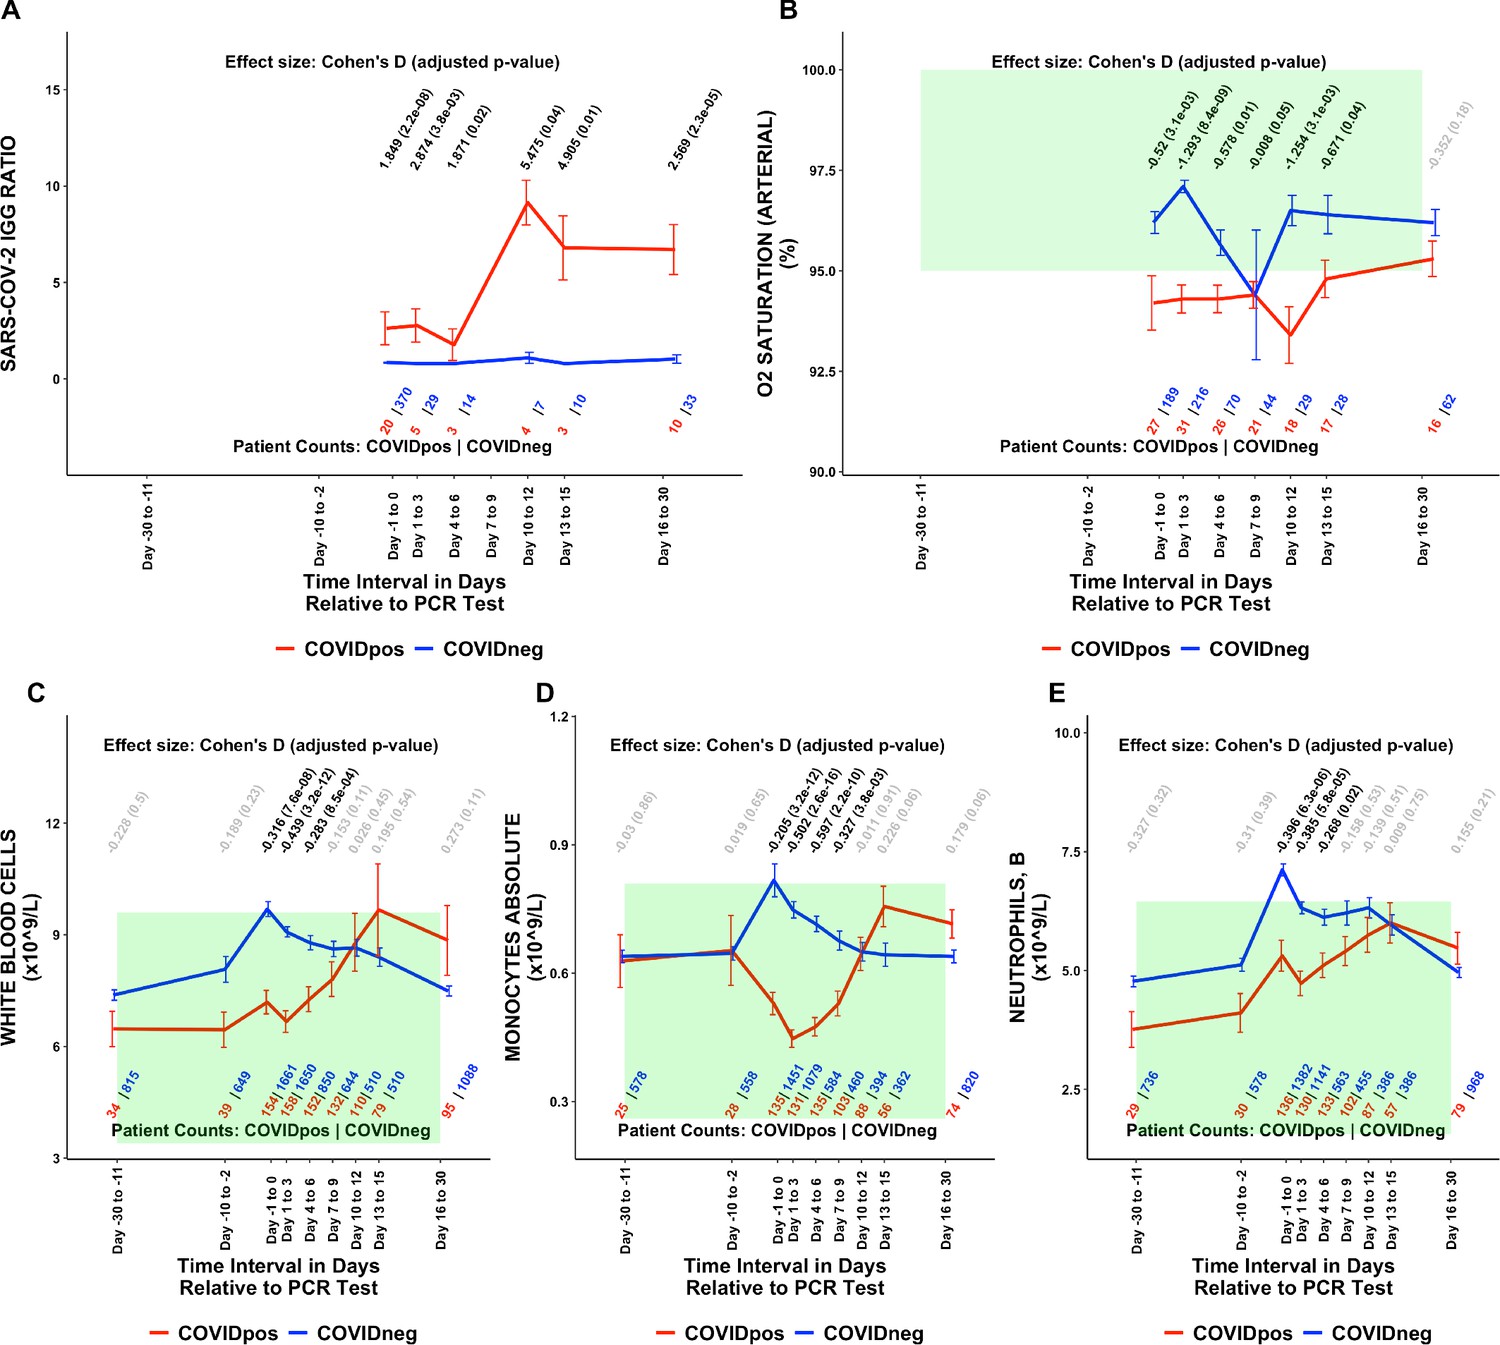
Longitudinal and temporally resolved analysis highlights positive control lab tests elevated in COVIDpos patients along with distinctive immune signatures.
Longitudinal trends in COVIDpos versus COVIDneg (matched) patients for the following lab tests: (A) SARS-CoV-2 IGG ratio, (B) oxygen saturation in arterial blood, (C) white blood cells, (D) monocytes absolute, and (E) neutrophils, blood. For any window of time during which at least three patients in each cohort had test results, data are shown as mean with standard errors. The normal range for each lab test is shaded in green. Values given horizontally along the top of the plot are Cohen’s D statistics comparing the COVIDpos and COVIDneg (matched) cohorts along with the BH-adjusted Mann-Whitney test p-values. Significant differences (adjusted p-value <0.05) are shown in black, while non-significant values are shown in gray. Values given horizontally along the bottom of the plot are the numbers of patients in the COVIDpos and COVIDneg cohorts, respectively (i.e. # COVIDpos | # COVIDneg). For certain lab tests, some data points are missing because these time windows had fewer than three data points in the COVIDpos cohort.
Figure 2
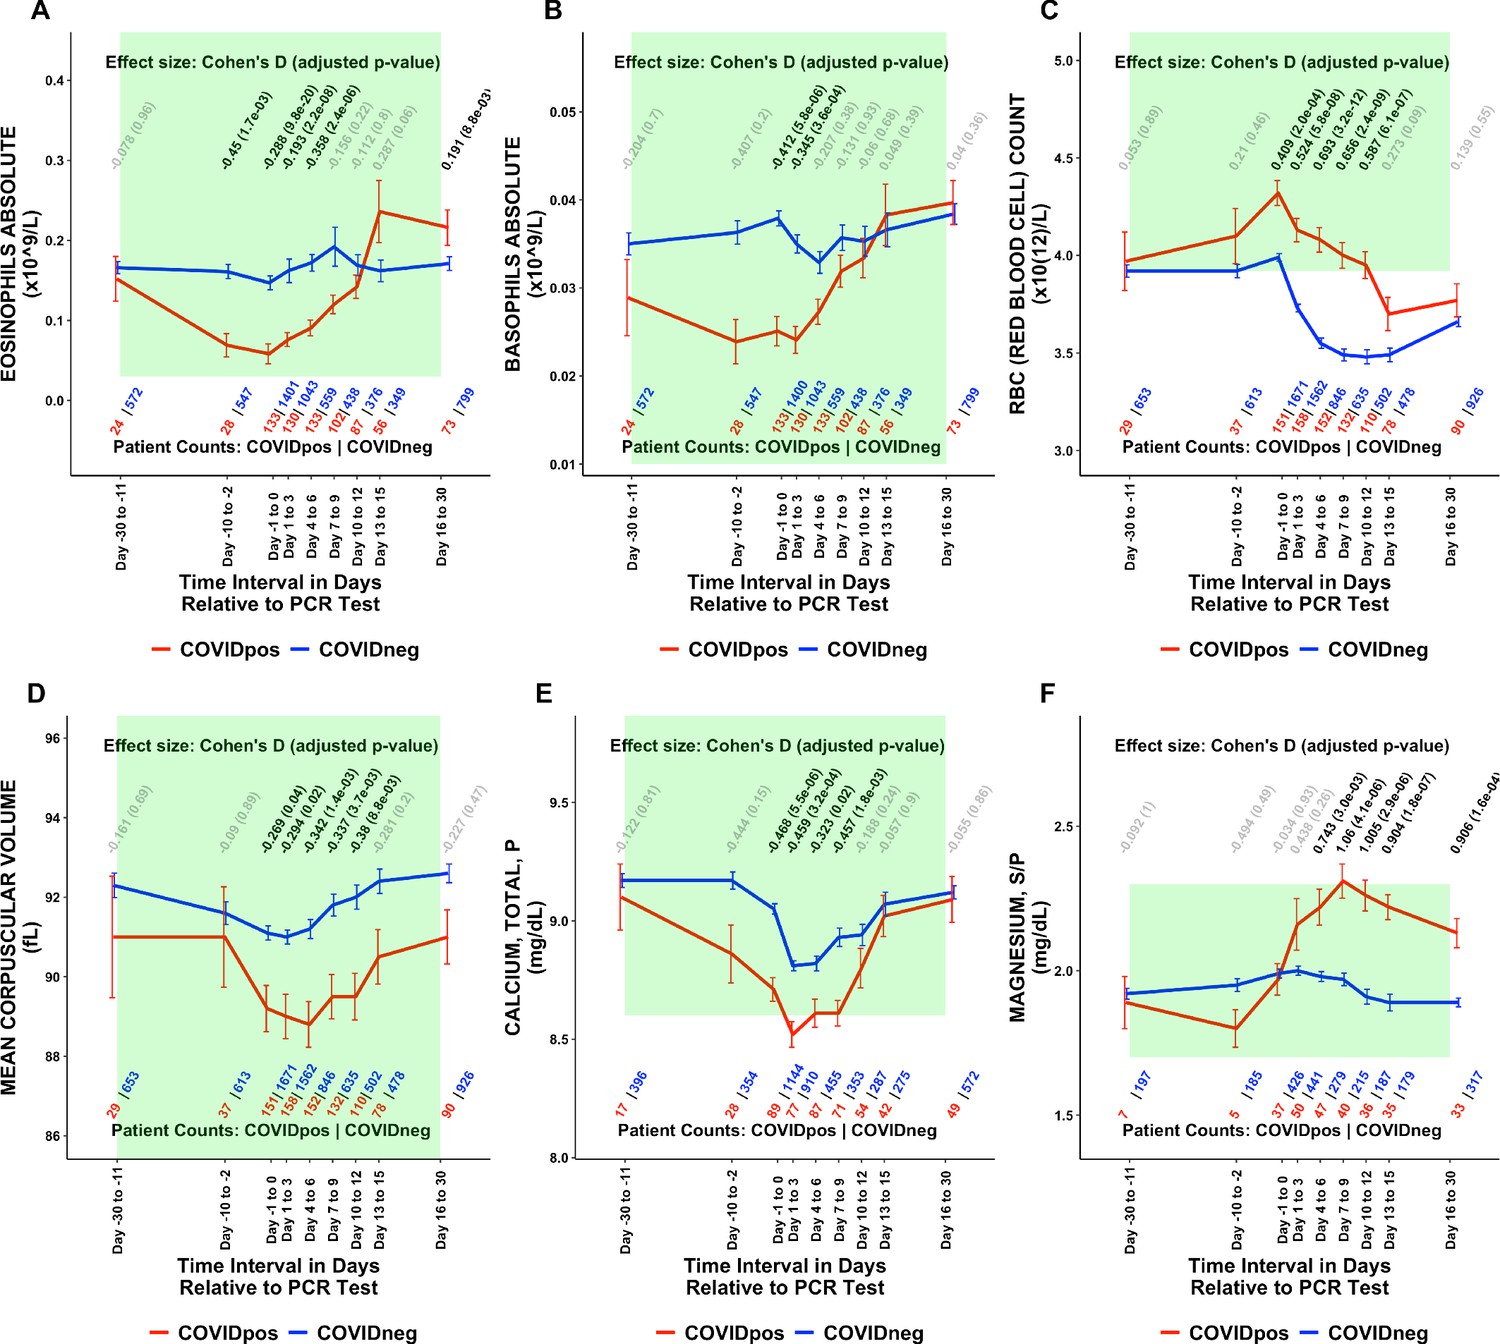
Longitudinal trends of COVIDpos patients’ lab tests show distinctive immune, hematologic, and serum chemistry signatures within normal ranges.
Longitudinal trends in COVIDpos versus COVIDneg (matched) patients for the following lab tests: (A) eosinophils absolute, (B) basophils absolute, (C) red blood cell count, (D) mean corpuscular volume, (E) calcium total, plasma, and (F) magnesium total, serum/plasma. For any window of time during which at least three patients in each cohort had test results, data are shown as mean with standard errors. The normal range for each lab test is shaded in green. Values given horizontally along the top of the plot are Cohen’s D statistics comparing the COVIDpos and COVIDneg (matched) cohorts along with the BH-adjusted Mann-Whitney test p-values. Significant differences (adjusted p-value <0.05) are shown in black, while non-significant values are shown in gray. Values given horizontally along the bottom of the plot are the numbers of patients in the COVIDpos and COVIDneg cohorts, respectively (i.e. # COVIDpos | # COVIDneg). For certain lab tests, some data points are missing because these time windows had fewer than three data points in the COVIDpos cohort.
Figure 3

COVIDpos patients show distinctly opposite temporal trends in fibrinogen and platelet counts starting at the time of diagnosis.
Longitudinal trends of COVIDpos versus COVIDneg (matched) patients for the following lab tests: (A) fibrinogen, plasma, (B) platelets, and (C) other coagulation-related tests including prothrombin time (PT), activated partial thromboplastic time (aPTT), and D-dimers. For any window of time during which at least three patients in each cohort had test results, data are shown as mean with standard errors. The normal range for each lab test is shaded in green. Values given horizontally along the top of the plot are Cohen’s D statistics comparing the COVIDpos and COVIDneg (matched) cohorts along with the BH-adjusted Mann-Whitney test p-values. Significant differences (adjusted p-value <0.05) are shown in black, while non-significant values are shown in gray. Values given horizontally along the bottom of the plot are the numbers of patients in the COVIDpos and COVIDneg cohorts, respectively (i.e. # COVIDpos | # COVIDneg). For certain lab tests, some data points are missing because these time windows had fewer than three data points in the COVIDpos cohort.
Figure 4
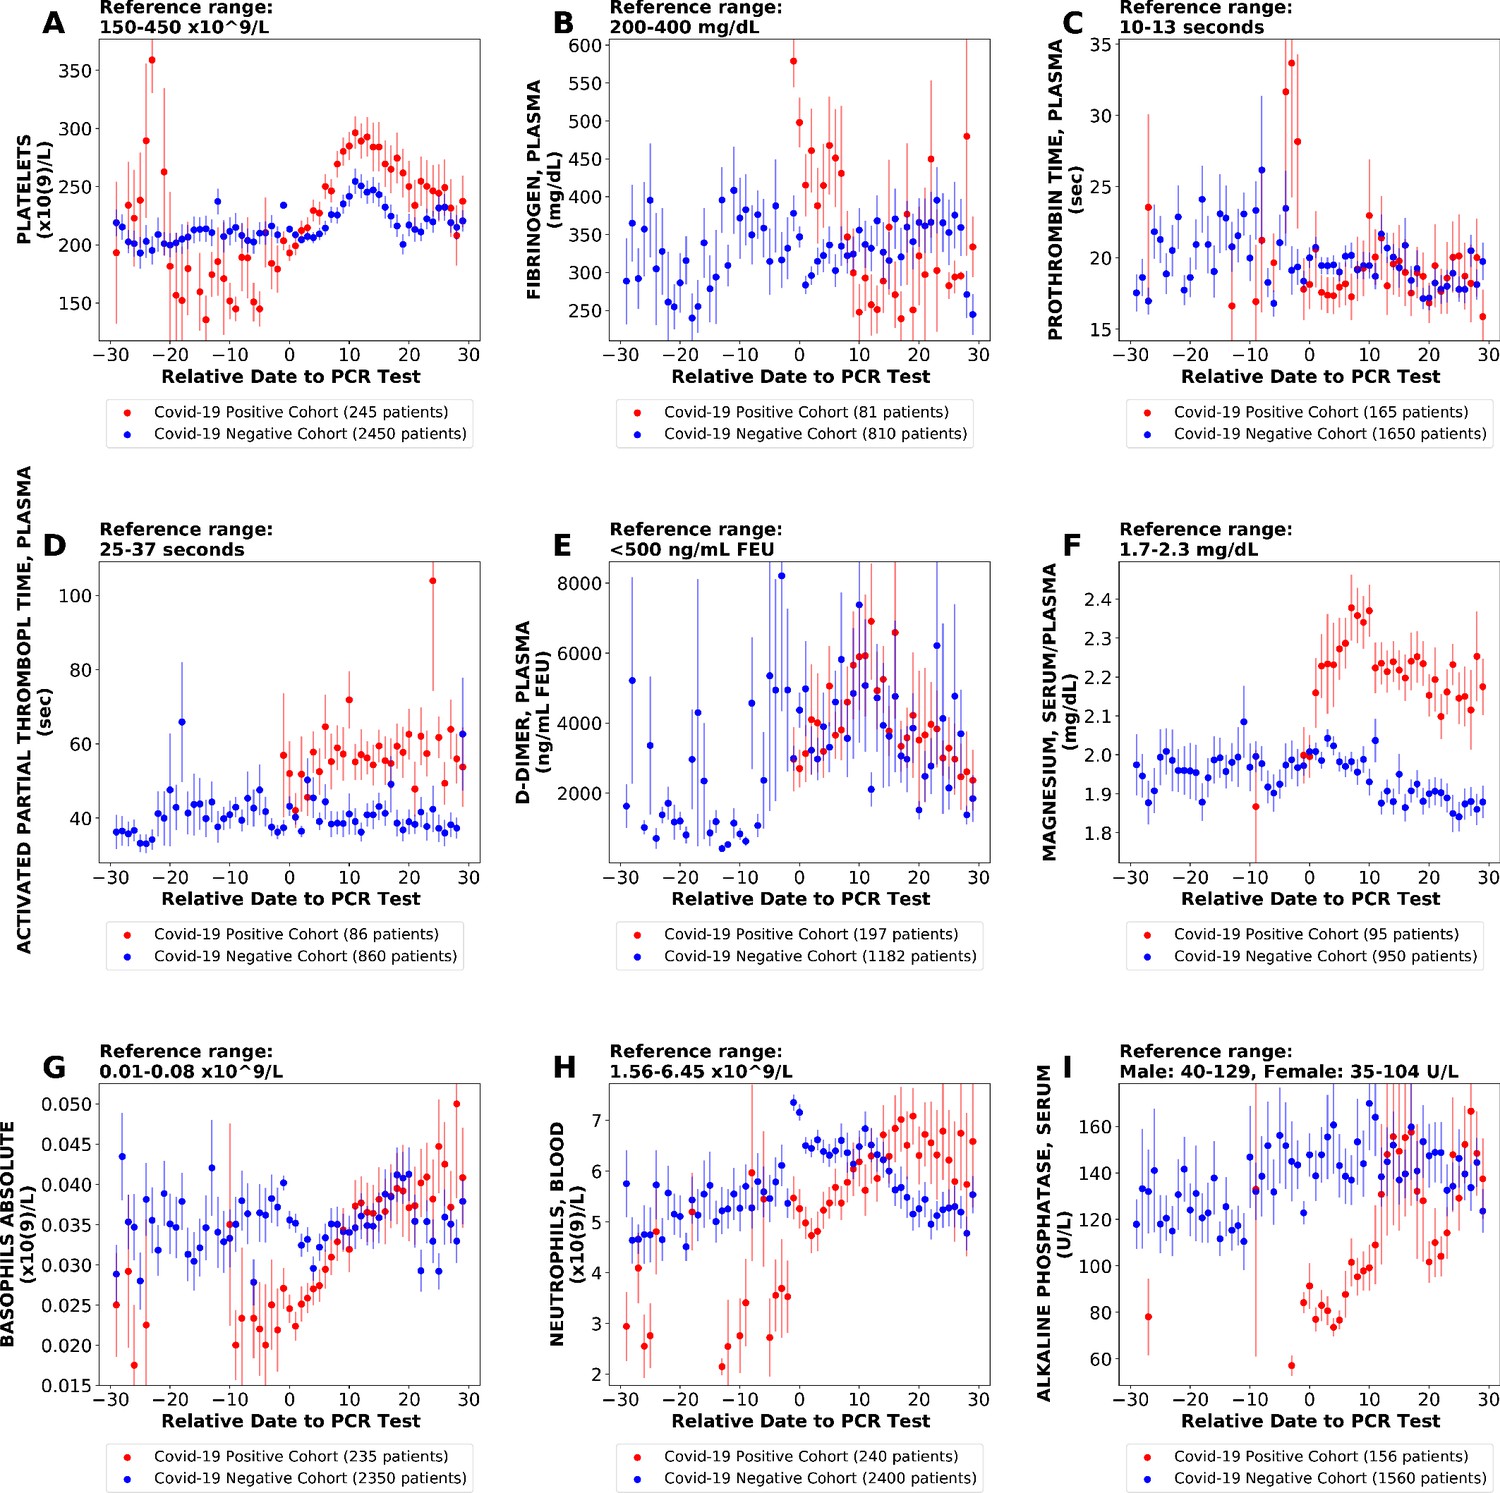
Longitudinal trends of lab tests with daily resolution.
Longitudinal trends of COVIDpos versus COVIDneg (matched) patients for the following lab tests: (A) platelets; (B) fibrinogen, plasma; (C) prothrombin time, plasma; (D) activated partial thromboplastin time; (E) D-dimer; (F) magnesium, serum/plasma; (G) basophils absolute; (H) neutrophils, blood; (I) alkaline phosphatase, serum. The reference ranges are shown at the top of each plot. For each cohort, average lab values and standard errors are shown for each day with at least three observations. For certain lab tests, some data points are missing because these days had fewer than three data points in the COVIDpos cohort.
Figure 5
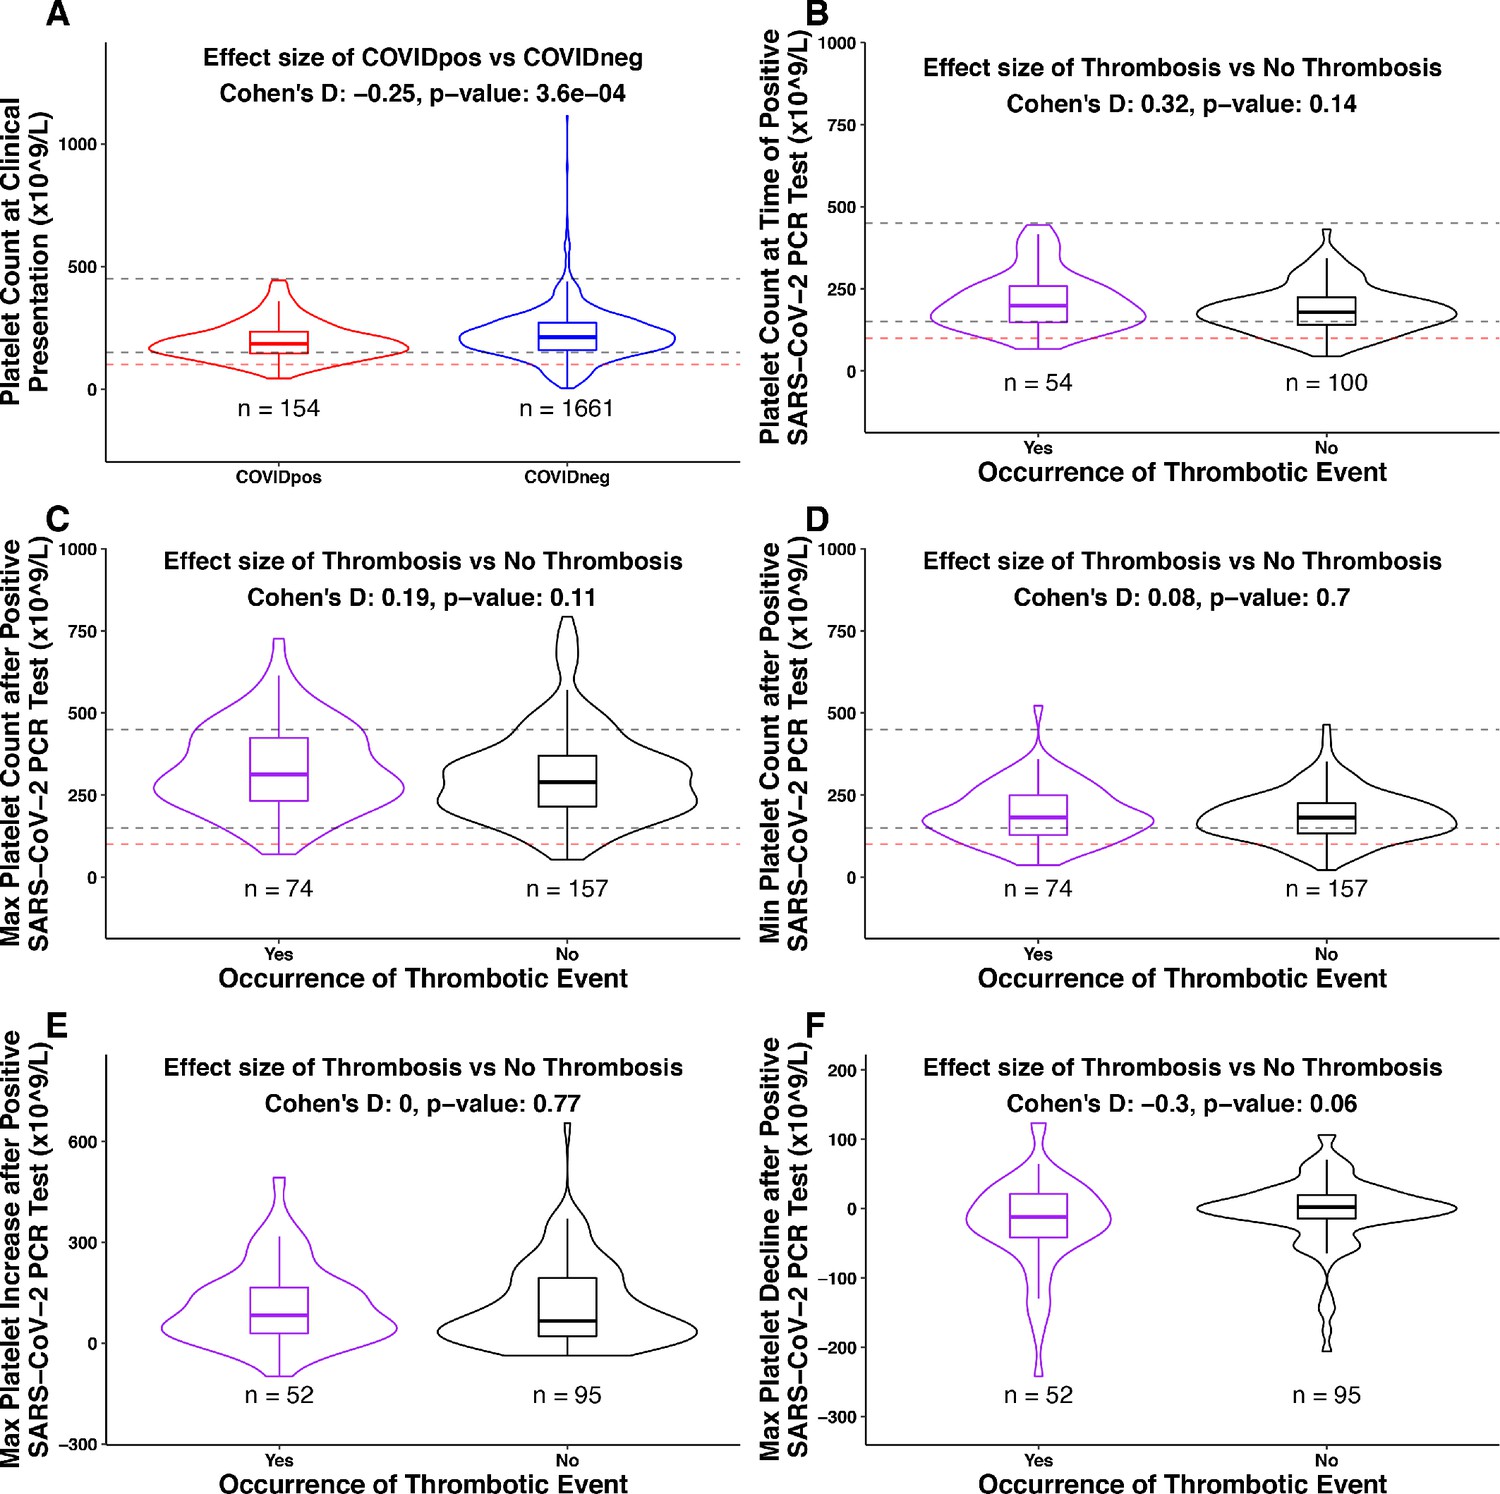
Association between platelet counts and thrombosis in the COVIDpos cohort.
Box plots of platelet counts, min/max values, and maximum levels of increase/decline at specific time intervals for COVIDpos and COVIDneg cohorts and subgroups of the COVIDpos cohort with and without thrombotic events after SARS-CoV-2 diagnosis. In the subplot (A), we show platelet counts for COVIDpos (red) and COVIDneg (blue) cohorts. In subplots (B-F), we show platelet counts for COVIDpos patients who did and did not subsequently develop thromboses (purple and black, respectively). Horizontal dotted gray lines correspond to upper and lower limits of normal platelet counts (150−450 × 109/L), and horizontal red line shows 100 × 109/L. At the top of each plot, Cohen’s D effect size and p-value from the Mann-Whitney statistical test are shown. (A) Platelet counts at the time of PCR testing for COVIDpos and COVIDneg cohorts. (B) Platelet counts at the time of PCR testing for COVIDpos patients who did and did not subsequently develop thromboses. (C) Maximum platelet counts (considering counts at and after positive PCR test date) for COVIDpos patients who did and did not subsequently develop thromboses. (D) Minimum platelet counts (considering counts at and after positive PCR test date) for COVIDpos patients who did and did not subsequently develop thromboses. (E) Maximum degree of platelet increases after positive PCR test date for COVIDpos patients who did and did not subsequently develop thromboses. (F) Maximum degree of platelet declines after positive PCR test date for COVIDpos patients who did and did not subsequently develop thromboses.
Figure 6
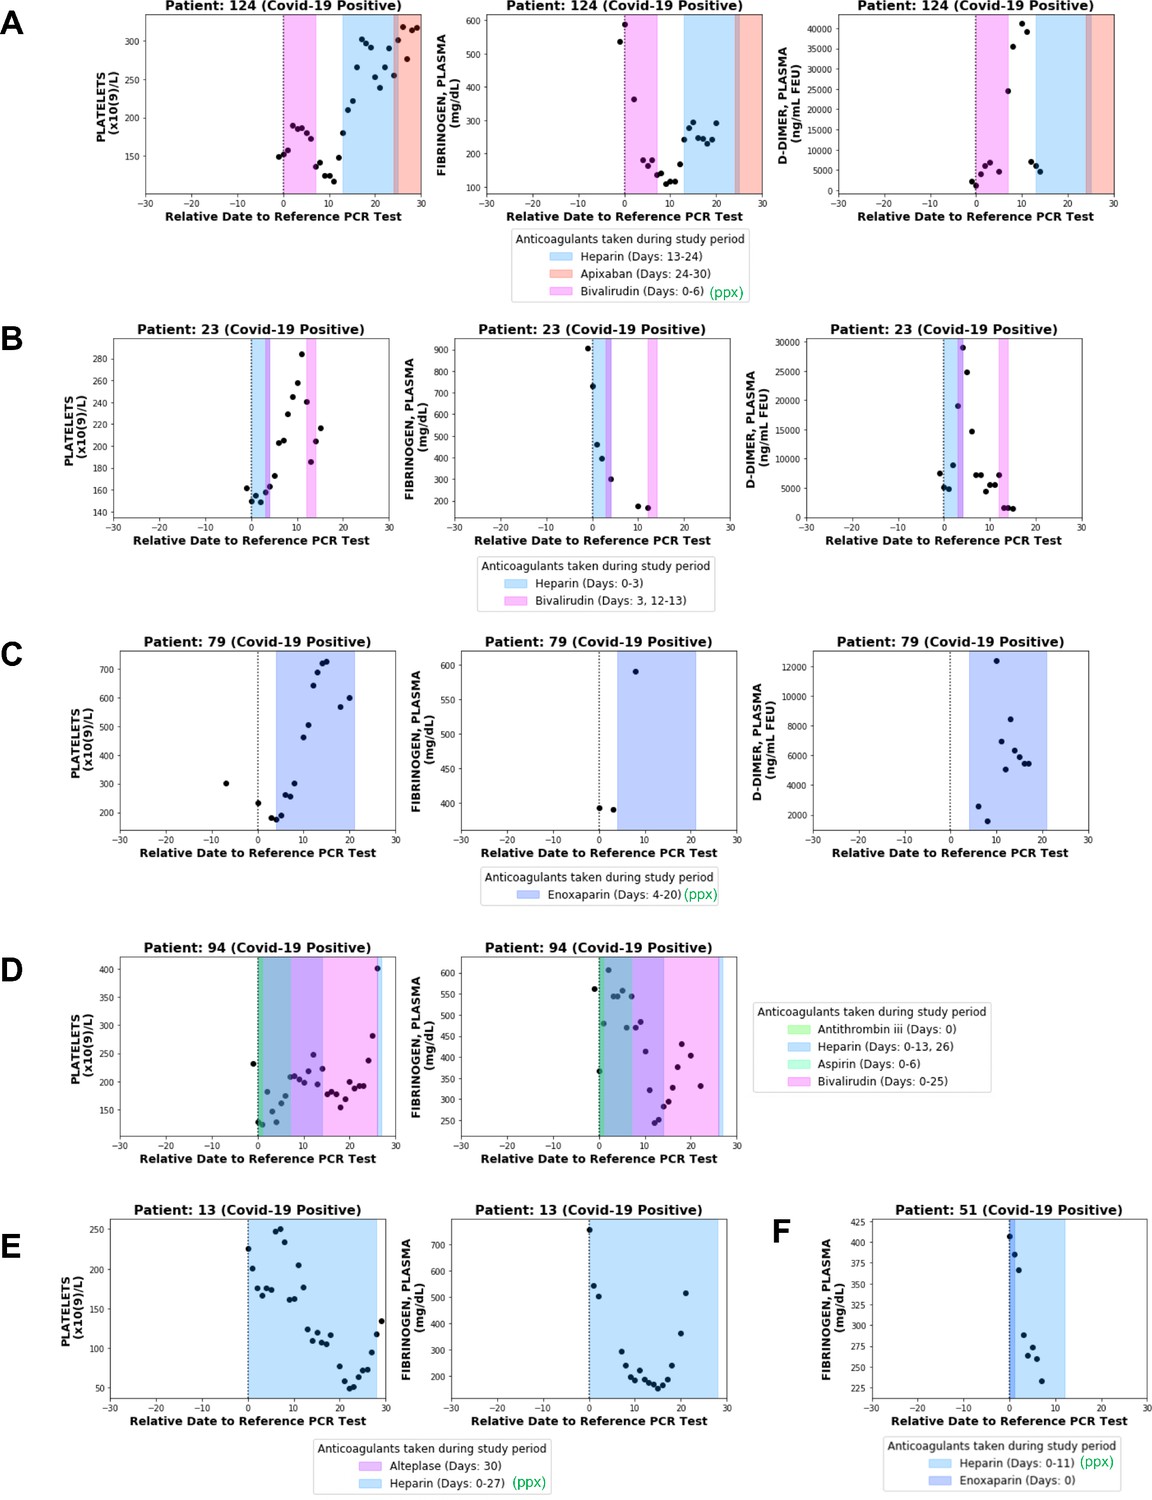
Longitudinal analyses of platelet counts, plasma fibrinogen, and D-dimer levels in individual patients with or without thrombotic disease.
In each plot, shaded regions represent time periods when the patient was taking a specific anticoagulant or antiplatelet medication. Medications taken for prophylaxis are denoted in the legend with (ppx). (A) Patient 124 developed hemorrhagic and thrombotic phenotypes in the context of declining fibrinogen, declining platelets, and increasing D-dimers. This is consistent with a DIC-like coagulopathy. (B) Patient 23 developed clots in the setting of declining fibrinogen and elevated D-dimers but stable platelet counts which increased shortly thereafter. (C) Patient 79 developed clots while showing increases in platelet counts along with plasma fibrinogen and D-dimers. (D) Patient 94 developed clots with relatively stable platelet counts and steadily declining plasma fibrinogen. (E) Patient 13 did not develop clots or bleeding despite a coordinate decrease in platelet counts and fibrinogen which may be mistaken for a DIC-like coagulopathy. (F) Patient 51 did not develop clots despite showing a post-diagnosis decline in plasma fibrinogen similar to several patients in the thrombotic cohort.
Tables
Table 1
Summary of patient characteristics for the overall COVIDpos, COVIDneg (matched), and COVIDneg cohorts.
The COVIDneg (matched) cohort was constructed using 1:10 propensity score matching to balance each of the clinical covariates, including demographics (age, gender, race), medication use (anticoagulant/antiplatelet use in the preceding 30 days/1 year of PCR testing date), medical history of thrombotic events from the past year, and hospitalization status in the month prior to the date of PCR testing.
| Patient characteristics | COVIDpos | COVIDneg (matched) | COVIDneg |
|---|---|---|---|
| Number of patients | 246 | 2460 | 13,666 |
| Age in years | 60.8 | 60.9 | 64.1 |
| Gender: | |||
| Male | 137 (56%) | 1388 (56%) | 7129 (52%) |
| Race: | |||
| White | 154 (63%) | 1540 (63%) | 12,241 (90%) |
| Black | 24 (9.8%) | 313 (13%) | 569 (4.2%) |
| Asian | 18 (7.3%) | 207 (8.4%) | 274 (2.0%) |
| American Indian | 23 (9.3%) | 81 (3.3%) | 81 (0.59%) |
| Other | 27 (11%) | 319 (13%) | 501 (3.7%) |
| Medication use in the preceding 30 days of PCR testing date: | |||
| Anticoagulants | 63 (26%) | 596 (24%) | 5171 (38%) |
| Antiplatelets | 30 (12%) | 298 (12%) | 2230 (16%) |
| Medication use in the preceding 1 year of PCR testing date: | |||
| Anticoagulants | 86 (35%) | 819 (33%) | 7476 (55%) |
| Antiplatelets | 40 (16%) | 419 (17%) | 3620 (26%) |
| Medical history of thrombotic events in 1 year prior to study period: | |||
| Deep vein thrombosis | 15 (6.1%) | 153 (6.2%) | 2,110 (15%) |
| Pulmonary embolism | 12 (4.9%) | 112 (4.6%) | 1258 (9.2%) |
| Myocardial infarction | 11 (4.5%) | 142 (5.8%) | 1468 (11%) |
| Venous thromboembolism | 4 (1.6%) | 44 (1.8%) | 615 (4.5%) |
| Thrombotic stroke | 1 (0.41%) | 3 (0.12%) | 143 (1.0%) |
| Cerebral venous thrombosis | 0 | 1 (0.04%) | 7 (0.05%) |
| Disseminated intravascular coagulation | 0 | 1 (0.04%) | 30 (0.22%) |
| Any thrombotic event | 31 (13%) | 308 (13%) | 3901 (29%) |
| Hospitalized in the month prior to PCR testing date | 41 (17%) | 304 (12%) | 1247 (9%) |
Table 2
Summary of lab tests significantly different between COVIDpos and propensity score-matched COVIDneg cohorts during at least one clinical time window.
Data from individual patients were averaged over the defined time windows, and the mean values were compared between COVIDpos and COVIDneg patients. The lab test-time window pairs shown are those which met our defined thresholds for statistical significance and substantial effect (BH-adjusted Mann-Whitney p-value <0.05 and Cohen’s D absolute value >0.35). In particular, 130 of the initial 1709 (test, time window) pairs with at least one patient met these thresholds. Rows are sorted alphabetically by test and then time window (from earliest to latest). Coagulation-related tests of particular interest (fibrinogen, platelets, prothrombin time, activated partial thromboplastin time, and D-dimer) are highlighted in gray. Sample sources are denoted as: P = plasma, S = serum, S/P = serum/plasma, B = blood, U = urine.
| Test | Units | Time window | Count COVIDpos | Count COVIDneg | Mean COVIDpos | Mean COVIDneg | Cohen's D | BH-adj M-W p-value |
|---|---|---|---|---|---|---|---|---|
| ABGRS pH Arterial | pH | Days 16–30 Post-Dx | 18 | 91 | 7.45 | 7.4 | 0.775 | 0.02 |
| ABGRS PO2 Arterial | mm Hg | Days 1–3 Post-Dx | 16 | 204 | 81.9 | 129.6 | −0.797 | 3.1E-03 |
| ABGRS PO2 Arterial | mm Hg | Days 4–6 Post-Dx | 25 | 82 | 78.1 | 113.2 | −0.712 | 8.8E-03 |
| ABGRS PO2 Arterial | mm Hg | Days 7–9 Post-Dx | 23 | 58 | 77.2 | 121.9 | −0.807 | 1.0E-03 |
| ABGRS PO2 Arterial | mm Hg | Days 10–12 Post-Dx | 18 | 37 | 76.4 | 104.2 | −0.965 | 2.6E-03 |
| ABGRS PO2 Arterial | mm Hg | Days 13–15 Post-Dx | 15 | 31 | 73.1 | 112.3 | −0.964 | 6.0E-03 |
| Activated Partial Thrombopl Time, P | sec | Days 7–9 Post-Dx | 22 | 66 | 50.5 | 36.7 | 0.727 | 0.026 |
| Activated Partial Thrombopl Time, P | sec | Days 10–12 Post-Dx | 14 | 54 | 63.3 | 39.2 | 1.085 | 2.4E-03 |
| Activated Partial Thrombopl Time, P | sec | Days 13–15 Post-Dx | 16 | 48 | 53.1 | 37.6 | 1.065 | 5.6E-03 |
| Activated Partial Thrombopl Time, P | sec | Days 16–30 Post-Dx | 19 | 149 | 56.2 | 37.5 | 0.884 | 0.027 |
| Alanine Aminotransferase (ALT), P | U/L | Days 10–12 Post-Dx | 27 | 104 | 77.3 | 46 | 0.512 | 0.015 |
| Albumin, P | g/dL | Days 7–9 Post-Dx | 42 | 188 | 3.06 | 3.41 | −0.54 | 5.6E-03 |
| Albumin, S/P | g/dL | Clinical presentation | 85 | 812 | 3.43 | 3.81 | −0.591 | 4.8E-06 |
| Albumin, S/P | g/dL | Days 1–3 Post-Dx | 77 | 525 | 3.26 | 3.6 | −0.541 | 3.8E-05 |
| Albumin, S/P | g/dL | Days 10–12 Post-Dx | 61 | 254 | 3.35 | 3.66 | −0.47 | 2.6E-03 |
| Alkaline Phosphatase, P | U/L | Days 4–6 Post-Dx | 42 | 139 | 88.8 | 126.7 | −0.395 | 3.7E-03 |
| Arterial O2 PP Diff | None | Clinical presentation | 21 | 106 | 268.1 | 152.1 | 0.924 | 9.7E-03 |
| Arterial O2 PP Diff | None | Days 1–3 Post-Dx | 22 | 112 | 225.9 | 147.4 | 0.639 | 0.017 |
| Arterial O2 PP Diff | None | Days 4–6 Post-Dx | 17 | 49 | 271.4 | 155 | 0.891 | 4.8E-03 |
| Aspartate Aminotransferase (AST), P | U/L | Days 10–12 Post-Dx | 27 | 107 | 67.6 | 44.7 | 0.404 | 3.6E-04 |
| Basophils Absolute | ×10(9)/L | Clinical presentation | 133 | 1400 | 0.0251 | 0.0379 | −0.412 | 5.8E-06 |
| Bicarbonate [MMOL/L] in Arterial Blood | mmol/L | Days 16–30 Post-Dx | 18 | 91 | 28.6 | 24.3 | 0.857 | 7.6E-03 |
| Bicarbonate in Arterial Blood | mmol/L | Days 1–3 Post-Dx | 26 | 193 | 23.2 | 21.4 | 0.513 | 0.027 |
| BUN, P | mg/dL | Days 16–30 Post-Dx | 49 | 562 | 31.4 | 21.9 | 0.555 | 3.9E-03 |
| C-reactive Protein Quantative, S | mg/L | Clinical presentation | 85 | 666 | 100.2 | 68.2 | 0.375 | 6.8E-05 |
| Calcium, Ionized, B | mg/dL | Clinical presentation | 14 | 201 | 4.36 | 4.77 | −0.67 | 0.015 |
| Calcium, Ionized, B | mg/dL | Days 1–3 Post-Dx | 18 | 270 | 4.42 | 4.73 | −0.783 | 8.5E-04 |
| Calcium, Total, P | mg/dL | Clinical presentation | 89 | 1144 | 8.71 | 9.05 | −0.468 | 5.5E-06 |
| Calcium, Total, P | mg/dL | Days 1–3 Post-Dx | 77 | 910 | 8.52 | 8.81 | −0.459 | 3.2E-04 |
| Calcium, Total, P | mg/dL | Days 7–9 Post-Dx | 71 | 353 | 8.61 | 8.93 | −0.457 | 1.8E-03 |
| Calcium, Total, S | mg/dL | Clinical presentation | 83 | 941 | 8.29 | 8.91 | −0.854 | 1.9E-13 |
| Calcium, Total, S | mg/dL | Days 1–3 Post-Dx | 98 | 1025 | 8.28 | 8.77 | −0.717 | 2.2E-10 |
| Calcium, Total, S | mg/dL | Days 4–6 Post-Dx | 87 | 568 | 8.4 | 8.69 | −0.435 | 2.3E-03 |
| Calcium, Total, S | mg/dL | Days 7–9 Post-Dx | 82 | 433 | 8.49 | 8.76 | −0.384 | 0.011 |
| Carboxyhemoglobin, ARTERIAL | % | Clinical presentation | 34 | 356 | 0.507 | 0.991 | −0.71 | 2.0E-04 |
| Carboxyhemoglobin, Arterial | % | Days 1–3 Post-Dx | 44 | 436 | 0.535 | 0.9 | −0.711 | 5.9E-05 |
| Carboxyhemoglobin, Arterial | % | Days 4–6 Post-Dx | 58 | 166 | 0.678 | 0.974 | −0.544 | 3.0E-03 |
| Carboxyhemoglobin, Arterial | % | Days 7–9 Post-Dx | 45 | 102 | 0.704 | 0.97 | −0.472 | 0.048 |
| Carboxyhemoglobin, Venous | % | Days 1–3 Post-Dx | 10 | 73 | 0.701 | 1.16 | −0.862 | 0.02 |
| Carboxyhemoglobin, Venous | % | Days 4–6 Post-Dx | 14 | 47 | 0.725 | 1.29 | −0.837 | 3.7E-03 |
| Chloride, P | mmol/L | Days 1–3 Post-Dx | 77 | 906 | 100.1 | 101.9 | −0.363 | 7.7E-03 |
| Eosinophils Absolute | ×10(9)/L | Pre-diagnosis | 28 | 547 | 0.0689 | 0.161 | −0.45 | 1.7E-03 |
| Esosinophils Absolute | ×10(9)/L | Days 4–6 Post-Dx | 133 | 559 | 0.0906 | 0.172 | −0.358 | 2.4E-06 |
| Fibrinogen, P | mg/dL | Clinical presentation | 51 | 233 | 528.9 | 360.7 | 0.859 | 8.9E-07 |
| Fibrinogen, P | mg/dL | Days 1–3 Post-Dx | 18 | 319 | 432.6 | 297.4 | 0.836 | 1.7E-03 |
| Fibrinogen, P | mg/dL | Days 4–6 Post-Dx | 26 | 116 | 477.8 | 333.7 | 0.744 | 0.014 |
| Glucose, Random, S | mg/dL | Days 13–15 Post-Dx | 49 | 314 | 150 | 126.5 | 0.544 | 0.013 |
| Hematocrit, B | % | Days 1–3 Post-Dx | 158 | 1582 | 36.5 | 33.8 | 0.433 | 9.6E-06 |
| Hematocrit, B | % | Days 4–6 Post-Dx | 152 | 851 | 36 | 32.1 | 0.621 | 2.2E-10 |
| Hematocrit, B | % | Days 7–9 Post-Dx | 132 | 639 | 35.5 | 31.8 | 0.587 | 5.8E-08 |
| Hematocrit, B | % | Days 10–12 Post-Dx | 110 | 505 | 35.1 | 31.8 | 0.511 | 1.7E-05 |
| Hemoglobin Arterial | g/dL | Days 1–3 Post-Dx | 31 | 208 | 12.1 | 10.8 | 0.651 | 0.025 |
| Hemoglobin, B | g/dL | Days 1–3 Post-Dx | 158 | 1682 | 11.9 | 11.1 | 0.358 | 2.2E-04 |
| Hemoglobin, B | g/dL | Days 4–6 Post-Dx | 152 | 873 | 11.8 | 10.4 | 0.636 | 1.4E-10 |
| Hemoglobin, B | g/dL | Days 7–9 Post-Dx | 132 | 653 | 11.6 | 10.4 | 0.56 | 2.0E-07 |
| Hemoglobin, B | g/dL | Days 10–12 Post-Dx | 110 | 516 | 11.4 | 10.3 | 0.49 | 2.6E-05 |
| Ionized Calcium, Arterial | mg/dL | Days 16–30 Post-Dx | 8 | 36 | 4.93 | 4.48 | 1.561 | 0.022 |
| Lactate Dehydrogenase, S | U/L | Days 10–12 Post-Dx | 21 | 88 | 406.2 | 295.2 | 0.463 | 1.4E-03 |
| Lactate, P | mmol/L | Clinical presentation | 89 | 954 | 1.37 | 1.93 | −0.462 | 3.1E-06 |
| Lymphocytes Percent | % | Days 13–15 Post-Dx | 5 | 66 | 33.2 | 15 | 1.514 | 0.048 |
| Lymphs Absolute | ×10(9)/L | Days 13–15 Post-Dx | 56 | 349 | 3.12 | 1.11 | 0.44 | 0.018 |
| Magnesium, Plasma | mg/dL | Days 10–12 Post-Dx | 20 | 87 | 2.14 | 1.91 | 0.772 | 0.015 |
| Magnesium, S/P | mg/dL | Days 4–6 Post-Dx | 47 | 279 | 2.22 | 1.98 | 0.743 | 3.0E-03 |
| Magnesium, S/P | mg/dL | Days 7–9 Post-Dx | 40 | 215 | 2.31 | 1.97 | 1.06 | 4.1E-06 |
| Magnesium, S/P | mg/dL | Days 10–12 Post-Dx | 36 | 187 | 2.26 | 1.91 | 1.005 | 2.9E-06 |
| Magnesium, S/P | mg/dL | Days 13–15 Post-Dx | 35 | 179 | 2.22 | 1.89 | 0.904 | 1.8E-07 |
| Magnesium, S/P | mg/dL | Days 16–30 Post-Dx | 33 | 317 | 2.13 | 1.89 | 0.906 | 1.6E-04 |
| Manual Diff Promyelocytes | % | Days 1–3 Post-Dx | 6 | 55 | 0.25 | 0 | 1.402 | 0.027 |
| Mean Corpuscular Volume | fL | Days 10–12 Post-Dx | 110 | 502 | 89.5 | 92 | −0.38 | 8.8E-03 |
| Methemoglobin, ABG | % | Clinical presentation | 34 | 356 | 0.335 | 0.571 | −0.629 | 6.0E-03 |
| Methemoglobin, ABG | % | Days 1–3 Post-Dx | 44 | 436 | 0.425 | 0.697 | −0.463 | 1.5E-03 |
| Monocytes Absolute | ×10(9)/L | Days 1–3 Post-Dx | 131 | 1079 | 0.447 | 0.748 | −0.502 | 2.6E-16 |
| Monocytes Absolute | ×10(9)/L | Days 4–6 Post-Dx | 135 | 584 | 0.475 | 0.715 | −0.597 | 2.2E-10 |
| N-terminal-PRO-Brain Type Natriuretic Peptide, S | pg/mL | Days 4–6 Post-Dx | 10 | 63 | 415.6 | 7609.7 | −0.525 | 2.9E-03 |
| Neutrophils, B | ×10(9)/L | Clinical presentation | 136 | 1382 | 5.31 | 7.12 | −0.396 | 6.3E-06 |
| Neutrophils, B | ×10(9)/L | Days 1–3 Post-Dx | 130 | 1141 | 4.73 | 6.32 | −0.385 | 5.8E-05 |
| NT-PRO BNP, P | pg/mL | Clinical presentation | 25 | 372 | 1372.4 | 5327.9 | −0.385 | 0.046 |
| NT-PRO BNP, P | pg/mL | Days 4–6 Post-Dx | 14 | 20 | 815.3 | 4388.8 | −0.929 | 0.02 |
| Nucleated RBC | /100 WBC | Days 13–15 Post-Dx | 23 | 189 | 1.24 | 0.447 | 0.561 | 1.7E-03 |
| O2 HB | % | Days 1–3 Post-Dx | 13 | 242 | 88.6 | 95 | −1.37 | 2.2E-03 |
| O2 HB | % | Days 4–6 Post-Dx | 32 | 90 | 92.1 | 93.7 | −0.356 | 0.013 |
| O2 HB | % | Days 7–9 Post-Dx | 24 | 46 | 91.5 | 94.5 | −0.701 | 3.3E-04 |
| Osmolality, U | mOsm/kg | Pre-diagnosis | 4 | 80 | 231.5 | 478.8 | −1.509 | 0.044 |
| Oxygen Content, Arterial | vol % | Days 4–6 Post-Dx | 32 | 89 | 16 | 13.7 | 0.839 | 2.4E-03 |
| Oxygen Saturation (%) in Arterial Blood | % | Clinical presentation | 27 | 189 | 94.2 | 96.2 | −0.52 | 3.1E-03 |
| Oxygen Saturation (%) in Arterial Blood | % | Days 1–3 Post-Dx | 31 | 216 | 94.3 | 97.1 | −1.293 | 8.4E-09 |
| Oxygen Saturation (%) in Arterial Blood | % | Days 4–6 Post-Dx | 26 | 70 | 94.3 | 95.7 | −0.578 | 0.014 |
| Oxygen Saturation (%) in Arterial Blood | % | Days 10–12 Post-Dx | 18 | 29 | 93.4 | 96.5 | −1.254 | 3.1E-03 |
| Oxygen Saturation (%) in Arterial Blood | % | Days 13–15 Post-Dx | 17 | 28 | 94.8 | 96.4 | −0.671 | 0.043 |
| pH Blood Arterial | None | Days 1–3 Post-Dx | 26 | 193 | 7.42 | 7.39 | 0.539 | 0.035 |
| pH Blood Venous | pH | Days 1–3 Post-Dx | 10 | 82 | 7.42 | 7.36 | 0.963 | 0.031 |
| pH, POCT, B | None | Clinical presentation | 13 | 202 | 7.41 | 7.33 | 0.708 | 0.042 |
| Platelets | ×10(9)/L | Pre-diagnosis | 39 | 649 | 184.8 | 225.9 | −0.393 | 0.024 |
| PO2 | mm Hg | Days 1–3 Post-Dx | 8 | 145 | 67.2 | 179.7 | −1.301 | 1.7E-03 |
| PO2 | mm Hg | Days 7–9 Post-Dx | 14 | 16 | 71.1 | 121.1 | −0.949 | 0.027 |
| PO2 Arterial | mm Hg | Days 1–3 Post-Dx | 26 | 193 | 100.4 | 150.9 | −0.87 | 8.2E-05 |
| PO2 Arterial | mm Hg | Days 10–12 Post-Dx | 17 | 25 | 93.6 | 134 | −0.755 | 0.019 |
| Potassium, S | mmol/L | Pre-diagnosis | 10 | 398 | 3.93 | 4.35 | −0.836 | 0.049 |
| RABG Calculated O2 Hemoglobin | % | Days 1–3 Post-Dx | 22 | 109 | 93.6 | 95 | −0.464 | 2.9E-03 |
| RABG Calculated O2 Hemoglobin | % | Days 4–6 Post-Dx | 16 | 49 | 93.2 | 95.3 | −0.859 | 2.3E-03 |
| RABG Calculated O2 Hemoglobin | % | Days 10–12 Post-Dx | 13 | 22 | 94 | 96.3 | −1.269 | 0.038 |
| RABG PF Ratio | None | Days 4–6 Post-Dx | 17 | 49 | 1.46 | 2.68 | −1.489 | 6.9E-05 |
| RABG PF Ratio | None | Days 7–9 Post-Dx | 13 | 22 | 1.75 | 2.56 | −1.006 | 0.038 |
| RABG PF Ratio | None | Days 10–12 Post-Dx | 13 | 22 | 1.83 | 3.22 | −1.518 | 3.9E-03 |
| RBC (Red Blood Cell) Count | ×10(12)/L | Clinical presentation | 151 | 1671 | 4.32 | 3.99 | 0.409 | 2.0E-04 |
| RBC (Red Blood Cell) Count | ×10(12)/L | Days 1–3 Post-Dx | 158 | 1562 | 4.13 | 3.73 | 0.524 | 5.8E-08 |
| RBC (Red Blood Cell) Count | ×10(12)/L | Days 4–6 Post-Dx | 152 | 846 | 4.08 | 3.55 | 0.693 | 3.2E-12 |
| RBC (Red Blood Cell) Count | ×10(12)/L | Days 7–9 Post-Dx | 132 | 635 | 4 | 3.49 | 0.656 | 2.4E-09 |
| RBC (Red Blood Cell) Count | ×10(12)/L | Days 10–12 Post-Dx | 110 | 502 | 3.95 | 3.48 | 0.587 | 6.1E-07 |
| Red Cell Distribution Width CV | % | Days 4–6 Post-Dx | 137 | 722 | 14.1 | 15.1 | −0.373 | 3.4E-04 |
| Red Cell Distribution Width CV | % | Days 7–9 Post-Dx | 119 | 552 | 14.2 | 15.4 | −0.431 | 9.8E-05 |
| Red Cell Distribution Width CV | % | Days 10–12 Post-Dx | 97 | 429 | 14.5 | 15.7 | −0.394 | 1.2E-03 |
| Sodium, P | mmol/L | Clinical presentation | 89 | 1141 | 135.6 | 137.3 | −0.375 | 7.3E-03 |
| Sodium, P | mmol/L | Days 1–3 Post-Dx | 77 | 927 | 136.6 | 138.1 | −0.377 | 4.7E-03 |
| Sodium, S | mmol/L | Days 10–12 Post-Dx | 69 | 334 | 140.8 | 138.3 | 0.651 | 2.0E-04 |
| Spont. Breaths/min | None | Days 4–6 Post-Dx | 23 | 67 | 25 | 20.2 | 0.767 | 0.016 |
| Tacrolimus, B | ng/mL | Days 7–9 Post-Dx | 8 | 81 | 4.22 | 8.12 | −1.102 | 8.8E-03 |
| Tacrolimus, B | ng/mL | Days 10–12 Post-Dx | 8 | 79 | 3.8 | 9.24 | −1.468 | 2.5E-03 |
| Tacrolimus, B | ng/mL | Days 13–15 Post-Dx | 7 | 71 | 3.7 | 8.52 | −1.47 | 7.5E-03 |
| Tacrolimus, B | ng/mL | Days 16–30 Post-Dx | 10 | 110 | 4.93 | 7.8 | −1.094 | 0.022 |
| Temperature | None | Clinical presentation | 23 | 136 | 37 | 36.7 | 0.591 | 0.042 |
| Temperature | None | Days 1–3 Post-Dx | 23 | 189 | 37 | 36.4 | 0.765 | 4.8E-04 |
| Triglycerides, S/P | mg/dL | Days 4–6 Post-Dx | 16 | 41 | 326.2 | 173 | 1.196 | 7.3E-03 |
| Triglycerides, S/P | mg/dL | Days 7–9 Post-Dx | 17 | 24 | 310.6 | 191.5 | 0.945 | 0.016 |
| Triglycerides, S/P | mg/dL | Days 10–12 Post-Dx | 17 | 35 | 364.5 | 174.4 | 1.217 | 4.0E-03 |
| Triglycerides, S/P | mg/dL | Days 16–30 Post-Dx | 10 | 77 | 276.1 | 166.4 | 0.83 | 0.024 |
| Troponin T, 5TH GEN, P | ng/L | Days 4–6 Post-Dx | 18 | 54 | 21.4 | 245.3 | −0.499 | 7.5E-03 |
| Troponin T, Baseline, 5TH Gen, P | ng/L | Days 7–9 Post-Dx | 11 | 43 | 15.1 | 53.7 | −0.538 | 0.037 |
| VBGRS HGB | g/dL | Days 4–6 Post-Dx | 36 | 99 | 12.3 | 10.5 | 0.932 | 3.6E-04 |
| White Blood Cells | ×10(9)/L | Days 1–3 Post-Dx | 158 | 1650 | 6.67 | 9.08 | −0.439 | 3.2E-12 |
Table 3
Sensitivity analysis of clinical time intervals for significant coagulation-related lab test trends.
Results from sensitivity analysis perturbing the time intervals for the significant (coagulation-related lab test, time interval) pairs (i.e. highlighted rows of Table 2). Perturbed results that met both of the significance thresholds (BH-adjusted Mann-Whitney p-value <0.05 and Cohen’s D absolute value >0.35) are highlighted in light green, and perturbed results that only met one of the thresholds for either effect size or statistical significance are highlighted in yellow.
| Test | Units | Perturbation | Original time window | Count COVIDpos | Count COVIDneg | Mean COVIDpos | Mean COVIDneg | Cohen's D | BH-adjusted M-W p-value |
|---|---|---|---|---|---|---|---|---|---|
| Activated Partial Thrombopl Time, P | sec | −1 day | Days 7−9 Post-Dx | 26 | 72 | 50.1 | 38 | 0.57 | 0.034 |
| Activated Partial Thrombopl Time, P | sec | +1 day | Days 7−9 Post-Dx | 17 | 58 | 55 | 37.5 | 0.81 | 0.014 |
| Activated Partial Thrombopl Time, P | sec | −1 day | Days 10−12 Post-Dx | 16 | 57 | 56.9 | 38.4 | 0.808 | 9.10E-03 |
| Activated Partial Thrombopl Time, P | sec | +1 day | Days 10−12 Post-Dx | 15 | 60 | 56.9 | 38 | 1.106 | 2.60E-03 |
| Activated Partial Thrombopl Time, P | sec | −1 day | Days 13−15 Post-Dx | 15 | 52 | 55.5 | 37.8 | 1.041 | 0.014 |
| Activated Partial Thrombopl TIME, P | sec | +1 day | Days 13−15 Post-Dx | 14 | 48 | 51.8 | 37.1 | 0.962 | 0.015 |
| Activated Partial Thrombopl Time, P | sec | −1 day | Days 16−30 Post-Dx | 22 | 156 | 55.2 | 37 | 0.913 | 5.70E-03 |
| Activated Partial Thrombopl Time, P | sec | +1 day | Days 16−30 Post-Dx | 19 | 139 | 56 | 38.2 | 0.725 | 3.80E-02 |
| Fibrinogen, P | mg/dL | −1 day | Clinical presentation | 25 | 92 | 584.9 | 370.7 | 1.067 | 1.20E-04 |
| Fibrinogen, P | mg/dL | +1 day | Clinical presentation | 37 | 292 | 488.2 | 326.2 | 0.885 | 8.80E-06 |
| Fibrinogen, P | mg/dL | −1 day | Days 1−3 Post-Dx | 41 | 381 | 494.5 | 318 | 1.023 | 3.90E-07 |
| Fibrinogen, P | mg/dL | +1 day | Days 1−3 Post-Dx | 21 | 244 | 420.3 | 312.2 | 0.616 | 7.90E-03 |
| Fibrinogen, P | mg/dL | −1 day | Days 4−6 Post-Dx | 27 | 156 | 432.2 | 336 | 0.495 | 0.045 |
| Fibrinogen, P | mg/dL | +1 day | Days 4−6 Post-Dx | 24 | 105 | 472.2 | 333.2 | 0.712 | 0.025 |
| Platelets | x10(9)/L | −1 day | Pre-diagnosis | 34 | 575 | 187.3 | 225.6 | -0.357 | 0.057 |
| Platelets | x10(9)/L | +1 day | Pre-diagnosis | 118 | 1533 | 201.3 | 234.4 | -0.328 | 7.30E-04 |
Table 4
Prevalence of thrombotic phenotypes after the clinical presentation in COVIDpos patients with and without available longitudinal lab testing data.
For each clotting phenotype listed, a BERT-based neural network was used to extract diagnostic sentiment from individual EHR patient notes in which the phenotype (or a synonym thereof) was present. This automated curation was applied to clinical notes for each patient from day = −1 (clinical presentation) to day = 30 (end of the study period) relative to the PCR testing date. In this table, we show the absolute number of patients with each phenotype along with the percentage of patients in each cohort with the given specific thrombotic phenotype in parentheses.
| Clotting phenotype | Cohort 1: COVIDpos with longitudinal data | Cohort 2: COVIDpos without longitudinal data | Cohort 3: Complete COVIDpos cohort |
|---|---|---|---|
| Deep vein thrombosis | 47 (19%) | 6 (0.30%) | 53 (2.4%) |
| Pulmonary embolism | 22 (8.9%) | 9 (0.45%) | 31 (1.4%) |
| Myocardial infarction | 10 (4.1%) | 8 (0.40%) | 18 (0.81%) |
| Venous thromboembolism | 7 (2.8%) | 0 | 7 (0.31%) |
| Thrombotic stroke | 2 (0.81%) | 2 (0.10%] | 4 (0.18%) |
| Cerebral venous thrombosis | 0 | 0 | 0 |
| Disseminated intravascular coagulation | 5 (2.0%) | 0 | 5 (0.22%) |
| Total unique patients with clot | 76 (31%) | 25 (1.3%) | 101 (4.5%) |
| Total patients | 246 | 1986 | 2232 |
Table 5
Enrichment of thrombotic phenotypes among COVIDpos patients with longitudinal lab testing data.
Contingency table to calculate hypergeometric enrichment significance of thrombosis among patients with longitudinal lab testing data. The 246 patients with longitudinal testing data are those considered in this study, while the 1986 patients who did not have at least three results from one lab test over the defined 60-day window were excluded from this longitudinal analysis.
| Patient has longitudinal data | Patient does NOT have longitudinal data | Total | |
|---|---|---|---|
| Thrombosis | 76 | 25 | 101 |
| No thrombosis | 170 | 1961 | 2131 |
| Total | 246 | 1986 | 2232 |
-
Hypergeometric enrichment: p-value <1×10−50.
Table 6
Validation of the BERT model to identify the sentiment of thrombotic phenotypes in clinical notes.
Out-of-sample accuracy results of the BERT model to identify thrombotic phenotypes in 1000 randomly selected sentences from clinical notes which contained at least one mention of a thrombotic phenotype. The columns are (1) Clotting phenotype: thrombotic phenotype identified in the sentence, (2) TP (true positives): count of sentences in which the BERT model correctly identified the sentiment as ‘Yes’, (3) TN (true negatives): count of sentences in which the BERT model correctly identified the sentiment as not ‘Yes’, (4) FP (false positives): count of sentences in which the BERT model incorrectly identified the sentiment as ‘Yes’, (5) FN: (false negatives): count of sentences in which the BERT model incorrectly identified the sentiment as not ‘Yes’, (6) Recall: recall of the BERT model, equal to TP/(TP+FN), (7) Precision: precision of the BERT model, equal to TP/(TP+FP), (8) Accuracy: accuracy of the BERT model, equal to (TP+TN)/(TP+TN+FP+FN).
| Clotting phenotype | TP | TN | FP | FN | Recall | Precision | Accuracy |
|---|---|---|---|---|---|---|---|
| Deep vein thrombosis | 136 | 178 | 24 | 3 | 98% | 85% | 92% |
| Pulmonary embolism | 164 | 78 | 7 | 6 | 96% | 96% | 95% |
| Myocardial infarction | 212 | 65 | 3 | 3 | 99% | 99% | 98% |
| Venous thromboembolism | 3 | 97 | 7 | 0 | 100% | 30% | 93% |
| Thrombotic stroke | 5 | 0 | 0 | 0 | 100% | 100% | 100% |
| Cerebral venous thrombosis | 1 | 0 | 0 | 0 | 100% | 100% | 100% |
| Disseminated intravascular coagulation | 4 | 4 | 0 | 0 | 100% | 100% | 100% |
| Overall | 525 | 422 | 41 | 12 | 97.8% | 92.8% | 94.7% |
Table 7
General characteristics of patients with SARS-CoV-2 PCR testing.
General demographic characteristics of all patients who underwent SARS-CoV-2 PCR testing in the Mayo Clinic EHR database from February 15, 2020 to May 28, 2020. Includes summary characteristics for: (A) all patients with at least one SARS-CoV-2 PCR test, and (B) patients with at least one SARS-CoV-2 PCR test and longitudinal testing data available (i.e. patient received the same lab test on 3 separate days within + / − 30 days of PCR testing date).
| (A) Demographics of all patients with PCR testing data | |||||||||
|---|---|---|---|---|---|---|---|---|---|
| COVIDpos | COVIDneg | ||||||||
| Total number of patients | 2232 | 72,354 | |||||||
| Gender: | |||||||||
| Male | 1153 (52%) | 31,613 (44%) | |||||||
| Female | 1074 (48%) | 40,714 (56%) | |||||||
| Race: | |||||||||
| White | 1115 (50%) | 62,605 (87%) | |||||||
| Black | 420 (19%) | 2792 (3.9%) | |||||||
| Asian | 151 (6.8%) | 1719 (2.4%) | |||||||
| American Indian | 29 (1.3%) | 302 (0.42%) | |||||||
| Other | 517 (23%) | 4936 (6.8%) | |||||||
| (B) Demographics of patients with PCR testing data and longitudinal testing data | |||||||||
| Test | Units | Perturbation | Original time window | Count COVIDpos | Count COVIDneg | Mean COVIDpos | Mean COVIDneg | Cohen's D | BH-adjusted M-W p-value |
| Activated Partial Thrombopl Time, P | sec | −1 day | Days 7–9 Post-Dx | 26 | 72 | 50.1 | 38 | 0.57 | 0.034 |
| Activated Partial Thrombopl Time, P | sec | +1 day | Days 7–9 Post-Dx | 17 | 58 | 55 | 37.5 | 0.81 | 0.014 |
| Activated Partial Thrombopl Time, P | sec | −1 day | Days 10–12 Post-Dx | 16 | 57 | 56.9 | 38.4 | 0.808 | 9.10E-03 |
| Activated Partial Thrombopl Time, P | sec | +1 day | Days 10–12 Post-Dx | 15 | 60 | 56.9 | 38 | 1.106 | 2.60E-03 |
| Activated Partial Thrombopl Time, P | sec | −1 day | Days 13–15 Post-Dx | 15 | 52 | 55.5 | 37.8 | 1.041 | 0.014 |
| Activated Partial Thrombopl Time, P | sec | +1 day | Days 13–15 Post-Dx | 14 | 48 | 51.8 | 37.1 | 0.962 | 0.015 |
| Activated Partial Thrombopl Time, P | sec | −1 day | Days 16–30 Post-Dx | 22 | 156 | 55.2 | 37 | 0.913 | 5.70E-03 |
| Activated Partial Thrombopl Time, P | sec | +1 day | Days 16–30 Post-Dx | 19 | 139 | 56 | 38.2 | 0.725 | 3.80E-02 |
| Fibrinogen, P | mg/dL | −1 day | Clinical presentation | 25 | 92 | 584.9 | 370.7 | 1.067 | 1.20E-04 |
| Fibrinogen, P | mg/dL | +1 day | Clinical presentation | 37 | 292 | 488.2 | 326.2 | 0.885 | 8.80E-06 |
| Fibrinogen, P | mg/dL | −1 day | Days 1–3 Post-Dx | 41 | 381 | 494.5 | 318 | 1.023 | 3.90E-07 |
| Fibrinogen, P | mg/dL | +1 day | Days 1–3 Post-Dx | 21 | 244 | 420.3 | 312.2 | 0.616 | 7.90E-03 |
| Fibrinogen, P | mg/dL | −1 day | Days 4–6 Post-Dx | 27 | 156 | 432.2 | 336 | 0.495 | 0.045 |
| Fibrinogen, P | mg/dL | +1 day | Days 4–6 Post-Dx | 24 | 105 | 472.2 | 333.2 | 0.712 | 0.025 |
| Platelets | ×10(9)/L | −1 day | Pre-diagnosis | 34 | 575 | 187.3 | 225.6 | −0.357 | 0.057 |
| Platelets | ×10(9)/L | +1 day | Pre-diagnosis | 118 | 1533 | 201.3 | 234.4 | −0.328 | 7.30E-04 |
Table 8
Lab test data availability in patients with SARS-CoV-2 PCR testing.
Lab test data availability for all patients who underwent SARS-CoV-2 PCR testing in the Mayo Clinic EHR database from February 15, 2020 to May 28, 2020. Includes counts of lab tests and counts of patients with 1+ and 3+ lab tests both overall and for selected coagulation-related lab tests (activated partial thromboplastin time, D-dimer, fibrinogen, platelets, and prothrombin time).
| COVIDpos | COVIDneg | |
|---|---|---|
| Total number of patients | 2232 | 72,354 |
| Number of patients with 1+ lab test | 566 (25%) | 35,188 (49%) |
| Number patents with 1+ test from day −30 to day −1 | 299 (13%) | 23,116 (32%) |
| Number patents with 1+ test from day 0 to day 30 | 452 (20%) | 28,666 (40%) |
| Number of patients with 3+ lab tests of the same type | 246 (11%) | 13,666 (19%) |
| Total number of lab tests | 98,753 | 32,40,491 |
| Number of lab tests from day −30 to day −1 | 12,120 | 10,33,762 |
| Number of lab tests from day 0 to day 30 | 86,633 | 22,06,729 |
| ACTIVATED PTT | ||
| Number of lab tests | 362 | 6042 |
| Number of patients with 1+ lab test | 93 (4.0%) | 3544 (4.9%) |
| Number of patients with 3+ lab tests | 20 (0.86%) | 406 (0.56%) |
| D-DIMER, P | ||
| Number of lab tests | 911 | 2846 |
| Number of patients with 1+ lab test | 247 (11%) | 2395 (3.3%) |
| Number of patients with 3+ lab tests | 99 (4.4%) | 56 (0.077%) |
| FIBRINOGEN, P | ||
| Number of lab tests | 278 | 3,017 |
| Number of patients with 1+ lab test | 84 (3.8%) | 1217 (1.7%) |
| Number of patients with 3+ lab tests | 18 (0.81%) | 273 (0.38%) |
| PLATELETS | ||
| Number of lab tests | 2646 | 1,08,722 |
| Number of patients with 1+ lab test | 500 (22%) | 30,732 (42%) |
| Number of patients with 3+ lab tests | 231 (10%) | 11544 (16%) |
| PROTHROMBIN TIME, P | ||
| Number of lab tests | 711 | 28,007 |
| Number of patients with 1+ lab test | 197 (8.8%) | 10,446 (14%) |
| Number of patients with 3+ lab tests | 46 (2.1%) | 2502 (3.5%) |
Table 9
Lab test data availability in patients with SARS-CoV-2 PCR testing and longitudinal lab data.
Lab test data availability for all patients who underwent SARS-CoV-2 PCR testing in the Mayo Clinic EHR database from February 15, 2020 to May 28, 2020 with longitudinal testing data available (i.e. patient received the same lab test on three separate days within + / − 30 days of PCR testing date). Includes counts of lab tests and counts of patients with 1+ and 3+ lab tests both overall and for selected coagulation-related lab tests (activated partial thromboplastin time, D-dimer, fibrinogen, platelets, and prothrombin time).
| COVIDpos | COVIDneg | |
|---|---|---|
| Total number of patients | 246 | 13,666 |
| Number patents with 1+ test from day −30 to day −1 | 150 (61%) | 11,567 (85%) |
| Number patents with 1+ test from day 0 to day 30 | 240 (98%) | 13,501 (99%) |
| Total number of lab tests | 89,587 | 2,634,070 |
| Number of lab tests from day −30 to day −1 | 8698 | 763,808 |
| Number of lab tests from day 0 to day 30 | 80,889 | 1,870,262 |
| ACTIVATED PTT | ||
| Number of lab tests | 355 | 5186 |
| Number of patients with 1+ lab test | 86 (35%) | 2722 (20%) |
| Number of patients with 3+ lab tests | 20 (8.1%) | 406 (3.0%) |
| D-DIMER, P | ||
| Number of lab tests | 855 | 1720 |
| Number of patients with 1+ lab test | 197 (80%) | 1293 (9.5%) |
| Number of patients with 3+ lab tests | 99 (40%) | 56 (0.41%) |
| FIBRINOGEN, P | ||
| Number of lab tests | 275 | 2965 |
| Number of patients with 1+ lab test | 81 (33%) | 1168 (8.5%) |
| Number of patients with 3+ lab tests | 18 (7.3%) | 273 (2%) |
| PLATELETS | ||
| Number of lab tests | 2343 | 87,517 |
| Number of patients with 1+ lab test | 245 (100%) | 13,399 (98%) |
| Number of patients with 3+ lab tests | 231 (94%) | 11,544 (84%) |
| PROTHROMBIN TIME, P | ||
| Number of lab tests | 676 | 24,489 |
| Number of patients with 1+ lab test | 165 (67%) | 7209 (53%) |
| Number of patients with 3+ lab tests | 46 (19%) | 2502 (18%) |
Additional files
Download links
A two-part list of links to download the article, or parts of the article, in various formats.
Downloads (link to download the article as PDF)
Open citations (links to open the citations from this article in various online reference manager services)
Cite this article (links to download the citations from this article in formats compatible with various reference manager tools)
Inference from longitudinal laboratory tests characterizes temporal evolution of COVID-19-associated coagulopathy (CAC)
eLife 9:e59209.
https://doi.org/10.7554/eLife.59209


