An hourglass circuit motif transforms a motor program via subcellularly localized muscle calcium signaling and contraction
- Howard Hughes Medical Institute, Department of Biology, McGovern Institute for Brain Research, Massachusetts Institute of Technology, United States
- Miller Institute, Helen Wills Neuroscience Institute, Department of Molecular and Cellular Biology, University of California, Berkeley, United States
- Department of Brain and Cognitive Sciences, Massachusetts Institute of Technology, United States
Figures
Figure 1 with 1 supplement
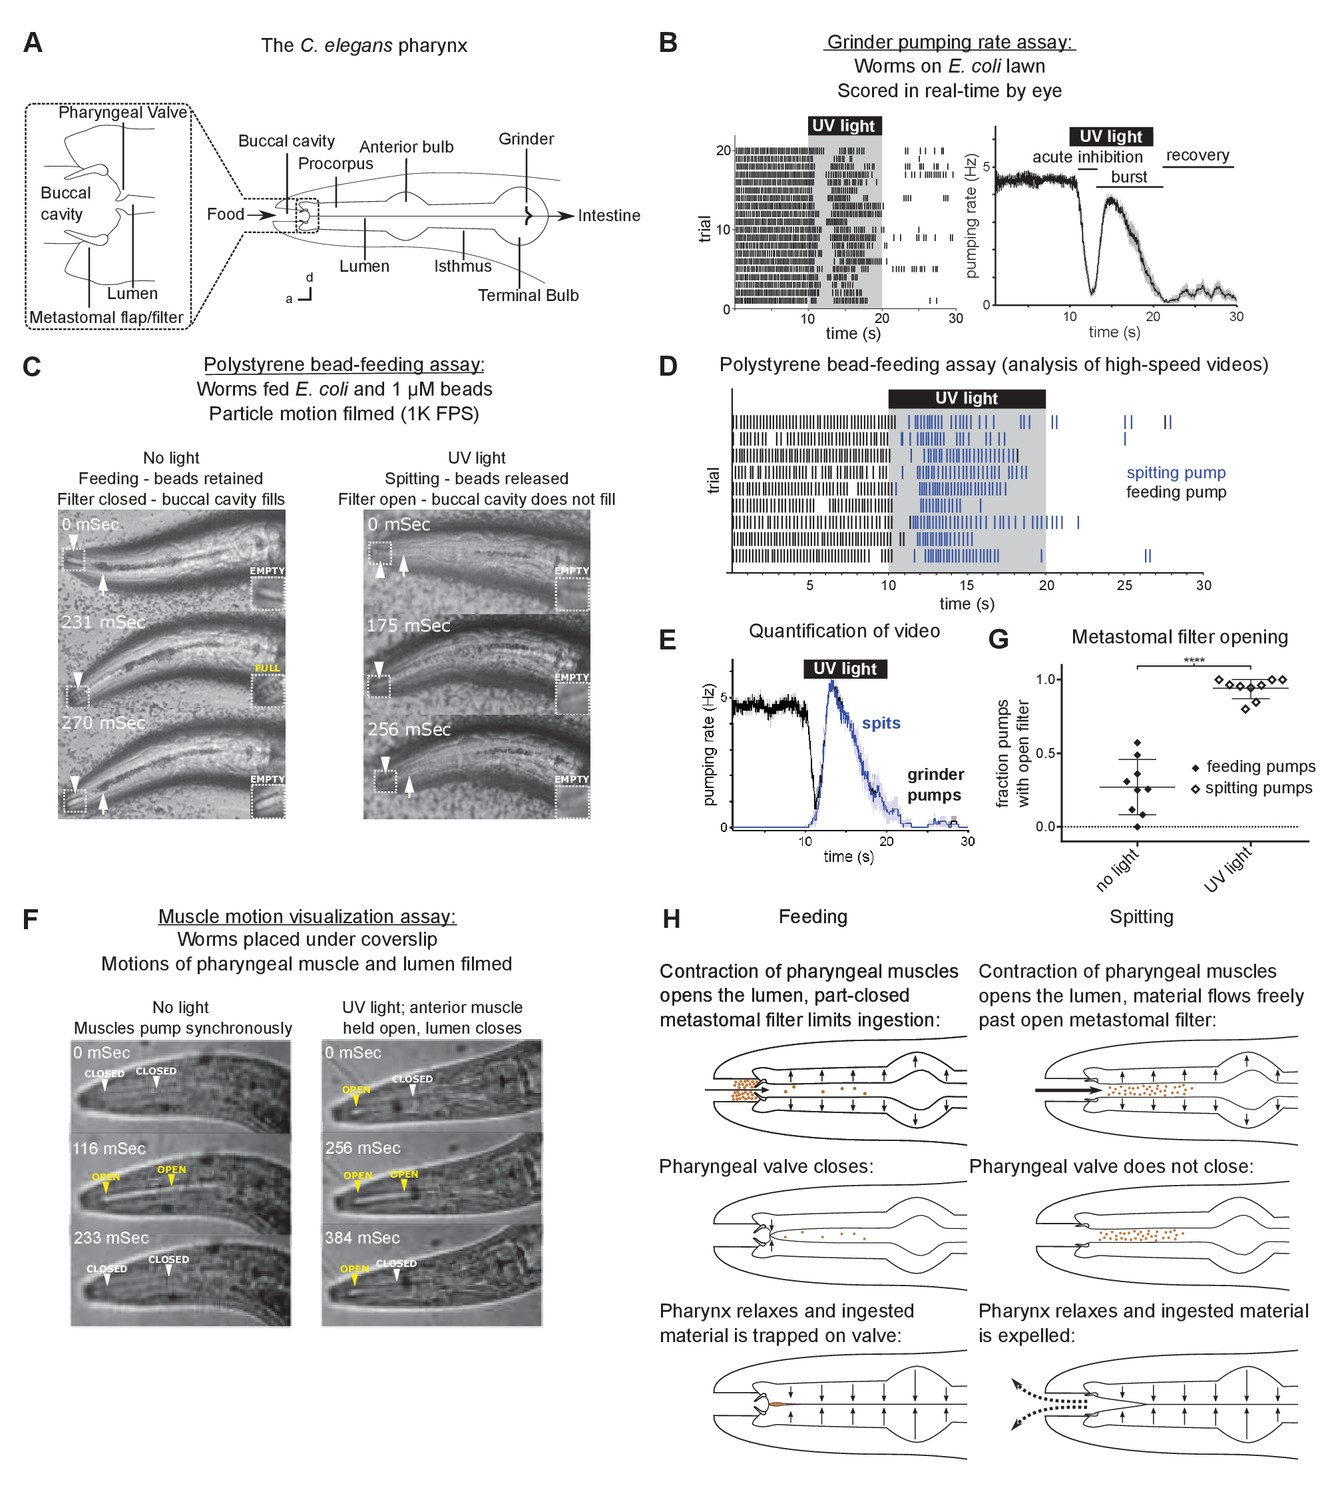
Worms spit as a consequence of the sustained contraction of anterior pharyngeal muscles.
(A) Anatomy of the C. elegans pharynx; a, anterior; d, dorsal. (B) Grinder pumping response to 365 nm UV light. Left, raster plot of individual animals, each grinder contraction shown by a tick; right, backward moving average of the pumping rate of the same animals. Labels indicate the ‘acute inhibition,’ ‘burst,’ and ‘recovery’ phases of the response. Phases previously described by Bhatla and Horvitz, 2015. Scale bar, 20 µm. (C) Representative images of worms feeding and spitting in the polystyrene bead feeding assay. Pumps were scored as ‘feeding’ if they resulted in the retention of particles in the anterior pharynx (arrows), while pumps were scored as ‘spitting’ if they released beads from the procorpus into the environment or if beads ingested during a procorpus contraction were not retained. In feeding pumps, the metastomal filter was typically partially closed, such that food accumulated in the buccal cavity (arrowheads and inset). Spitting pumps involved the opening of the metastomal filter such that the buccal cavity did not fill. (D) Raster plot of representative results from polystyrene bead feeding assay. Animals carried the transgene nIs678 (M1promoter::gcamp6s). ‘M1promoter’ refers to the glr-2 promoter. (E) Quantification of average grinder pumping and spitting rates of animals shown in (D). (F) Representative images of the pumping cycles of feeding (left column) and spitting worms (right column). When open, the lumen of the pharynx (arrowheads) is visible as a white line. The food-trapping pharyngeal valve (left arrowhead) is located at the anterior end of the lumen. In the absence of UV light (left column), the lumen and pharyngeal valve open (yellow arrowheads) and close (white arrowheads) nearly synchronously, enabling the trapping and eventual ingestion of food (Fang-Yen et al., 2009). By contrast, in the presence of UV light (right column) the opening of the lumen and the pharyngeal valve become uncoupled. While the lumen continues to open and close, the muscle region at the site of the pharyngeal valve undergoes sustained contraction and thus opens the valve such that the conclusion of a pump ejects material from the pharynx. Animals were unc-29(e1072) mutants to facilitate video capture. (G) Quantification of frequencies at which the metastomal filter was open in feeding and spitting pumps in (D). Center bar, mean; error bars, standard deviation (SD). ****, p < 0.0001; t test. (H) Diagrammatic summary of feeding and spitting behavior. Shading around traces indicates standard error of the mean (SEM).
-
Figure 1—source data 1
Source data for Figure 1.
- https://cdn.elifesciences.org/articles/59341/elife-59341-fig1-data1-v2.zip
Figure 1—figure supplement 1
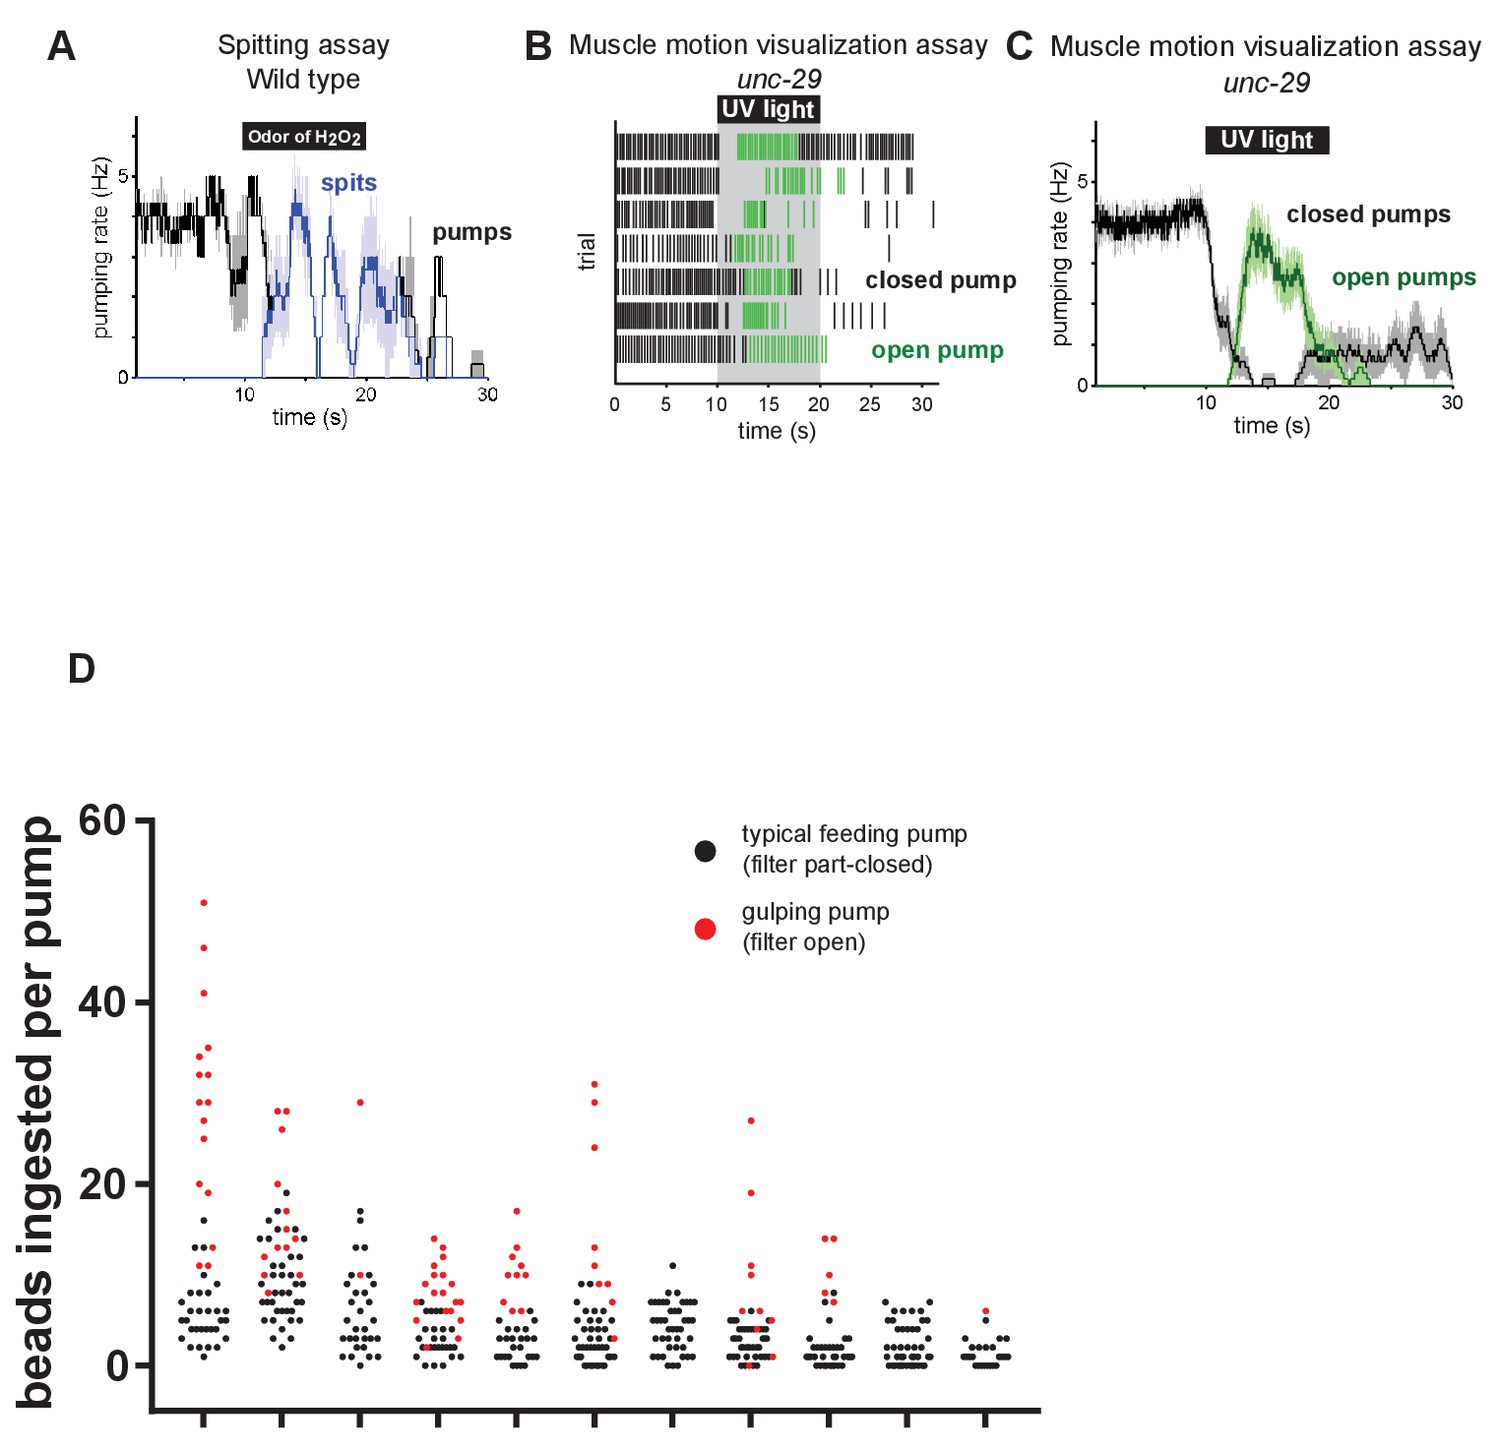
The odor of hydrogen peroxide induces spitting.
(A) The odor of 9M hydrogen peroxide induces spitting. Animals are unc-29(e1072) mutants to facilitate video capture. n = four animals. (B) Raster plot showing occurrence of ‘closed’ (black) and ‘open’ (green) pumps in pharyngeal muscle motion visualization assay. n = seven animals. (C) Moving averages of animals from (B), indicating that the burst pumping phase consists almost completely of ‘open’ pumps. Shading around traces indicates SEM. (D) Comparison of bead intake in typical feeding (filter part-closed) and gulping (filter open) pumps. Each grouping represents a separate animal and each circle represents a single pump. Gulping pumps capture more particles than typical feeding pumps. n = 11 animals.
-
Figure 1—figure supplement 1—source data 1
Source data for Figure 1—figure supplement 1.
- https://cdn.elifesciences.org/articles/59341/elife-59341-fig1-figsupp1-data1-v2.zip
Figure 2 with 2 supplements
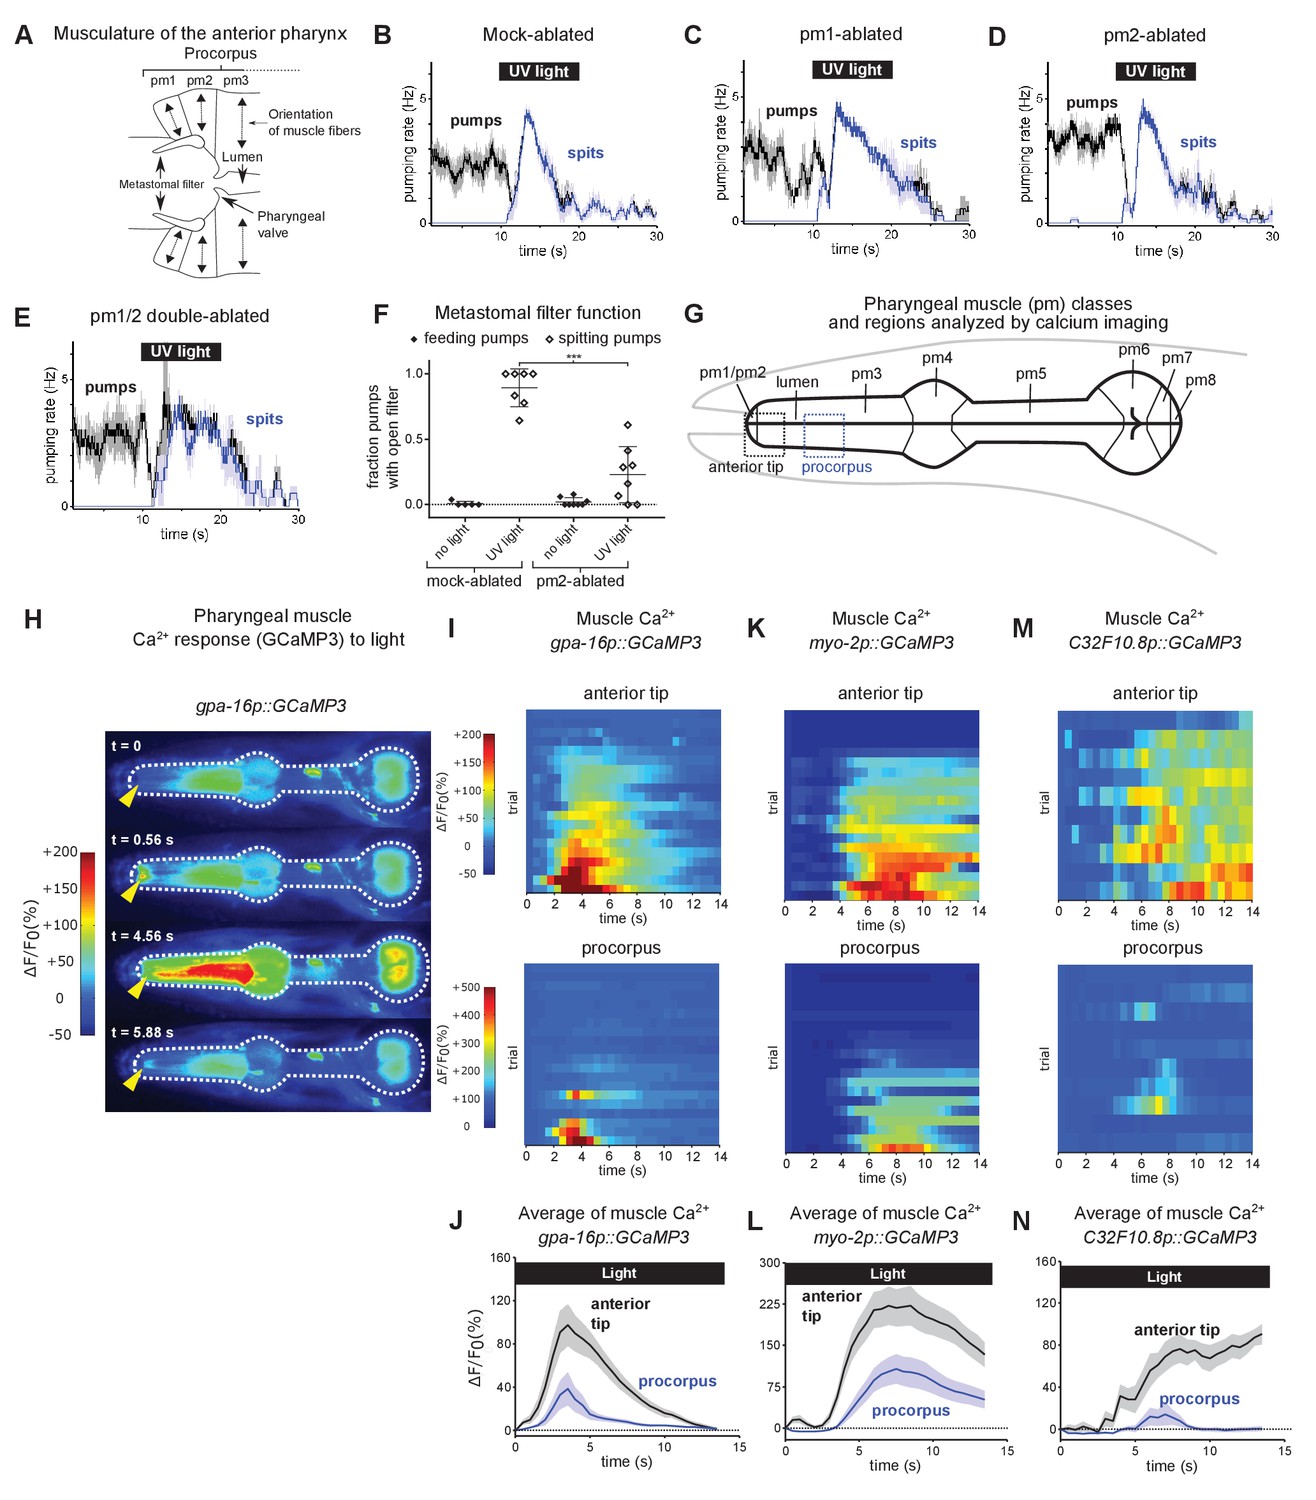
Subcellularly localized muscle contractions and calcium increases open the pharyngeal valve to produce spitting.
(A) Anatomy of the anterior pharynx showing pharyngeal muscles pm1, pm2, and pm3. Double-headed arrows indicate orientation of muscle fibers. (B–E) Mock-ablated (n = nine animals), pm1-ablated (n = 5), pm2-ablated (n = 8), and pm1/pm2 double-ablated animals (n = 4) spit in response to light. All animals carried transgene nIs507 (pm1promoter::gfp) to mark pm1. ‘pm1promoter’ refers to the inx-4 promoter. (F) Laser ablation of the pm2 pharyngeal muscles partially suppresses the light-induced opening of the metastomal filter. Center bar, mean; error bars, SD. ***, p < 0.001; t test. n ≥ five animals. (G) Diagram of the eight classes of pharyngeal muscle (pm1-8; borders indicated by thin solid black lines; lumen indicated with thick solid black lines). Dashed boxes indicate regions analyzed for GCaMP3 fluorescence changes. (H) Representative images from video of pharyngeal muscle GCaMP3 calcium imaging. Light induces subcellularly localized increases in pharyngeal muscle GCaMP fluorescence at the anterior end of the pharynx. Yellow arrowhead indicates spatially restricted calcium increases. Images false-colored based on the intensity of fluorescence changes. See also Video 11. (I) Pharyngeal muscle GCaMP responses of individual animals to light. Each row represents a different animal; ΔF/F0 over time is indicated according to the heatmap at left. Light induces subcellularly localized increases in pharyngeal muscle GCaMP fluorescence at the anterior end of the pharynx. Animals carried transgene nIs686 (gpa-16p::GCaMP3), which expresses GCaMP in pharyngeal muscle under the gpa-16 promoter. Each line indicates an independent trial from a different animal. Regions analyzed are indicated in (G). n = 20 animals. (J) Average GCaMP response of animals shown in (I). (K) GCaMP responses to light of pm3 muscles in individual animals. Light induces subcellularly localized increases in pm3 GCaMP fluorescence at the anterior end of pm3. Animals carried transgene cuIs36 (myo-2p::GCaMP3), which expresses GCaMP in pm3 under the myo-2 promoter. Each line represents an independent trial of a different animal. Regions analyzed are indicated in (G). n = 20 animals. (L) Average GCaMP response of animals shown in (K). (M) GCaMP responses to light of pm3 muscle cells in individual mosaic animals. Light induces subcellularly localized increases in pm3 GCaMP fluorescence at the anterior end of pm3. Animals carried transgene nEx3045 (C32F10.8p::GCaMP3), which expresses GCaMP in pm3 under the C32F10.8 promoter. Each line represents an independent trial of a different animal. Regions analyzed are indicated in (G). n = 10 animals. (N) Average GCaMP response of animals shown in (M). Shading around traces indicates SEM.
-
Figure 2—source data 1
Source data for Figure 2.
- https://cdn.elifesciences.org/articles/59341/elife-59341-fig2-data1-v2.zip
Figure 2—figure supplement 1
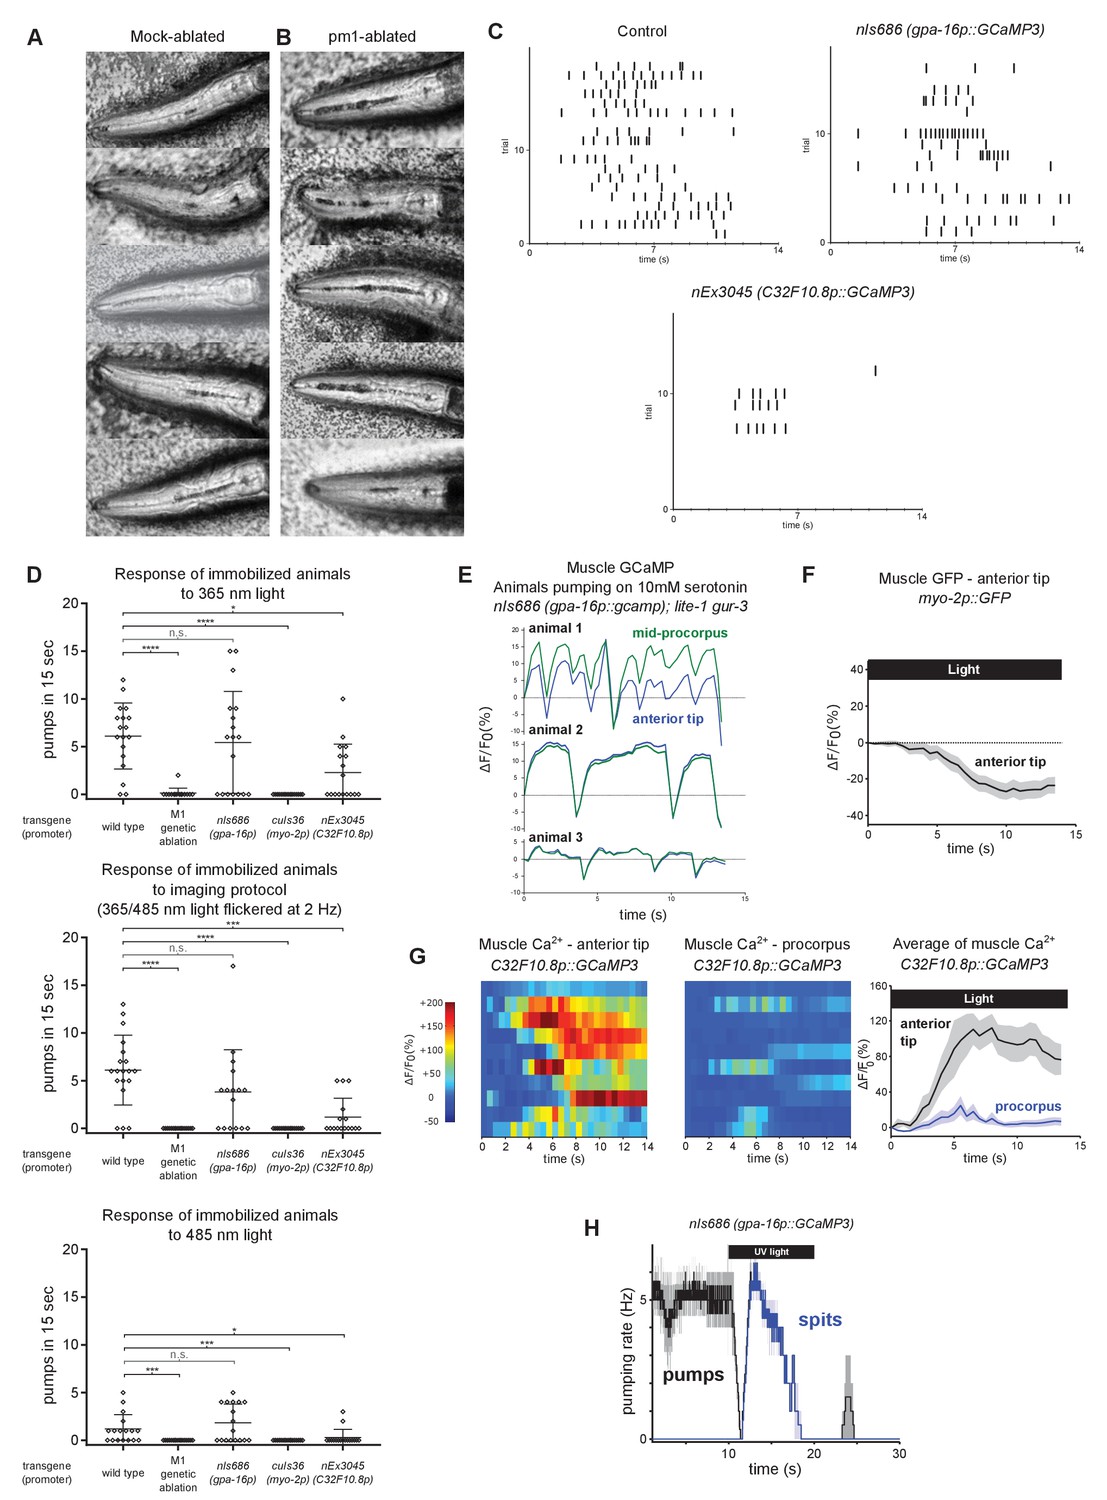
Additional characterization of the effects of pm1 ablation and of the immobilized muscle calcium imaging assay.
(A–B) pm1-ablated animals lack the metastomal filter and thus ingest more material into the procorpus than mock-ablated controls do. Images were obtained from the first frame of the videos used to make Figure 2B and C. Each panel shows a different animal. Dark material in the pharyngeal lumen is a mixture of E. coli and 1 µm polystyrene beads. In mock-ablated animals, accumulation is visible in the pharyngeal isthmus but is minimal in the procorpus of most animals. pm1-ablated animals accumulate markedly more material in the procorpus. We also noticed qualitatively that pm1-ablated animals often spit material less efficiently than control animals, but this difference could stem from the differences in the average amount of ingested material in the pharynx in each condition. All animals carry transgene nIs507 (pm1promoter::gfp). ‘pm1promoter’ refers to the inx-4 promoter. (C) Raster plots of the pumping response of immobilized animals to calcium imaging protocol (365/485 nm light flickered at 2 Hz) derived from analysis of behavioral videos. Each row represents an individual animals and each tick represents a contraction of the grinder. n ≥ 16 animals. (D) Quantification of pumping by immobilized worms induced by 365 nm, 365/485 nm 2 Hz flickered (i.e. pharyngeal muscle/M1 calcium imaging protocol stimulus), or 485 nm light. All light-induced pumping depends on M1. Animals carrying the nEx2045 (C32F10.8p::gcamp3) transgene exhibited reduced light-induced pumping, and animals carrying the cuIs36 (myo-2p::gcamp3) transgene were completely defective in light-induced pumping. Center bar, mean; error bars, SD. ****, approximate adjusted p value < 0.0001; ***, adjusted p value < 0.001; *, adjusted p value < 0.05; n.s., not significant; Kruskal-Wallis test, followed by Dunn’s multiple comparison test. n ≥ 15 animals. (E) Animals induced to pump using 10 mM serotonin do not exhibit sustained anteriorly localized calcium signals; GCaMP signal increases synchronously in the anterior tip and procorpus regions. Animals were lite-1 gur-3 double mutants carrying the gpa-16p::gcamp3 transgene nIs686. Fluorescence changes during pumping were recorded from three separate animals. See also Video 12. (F) No anteriorly localized fluorescence increase was detected in animals expressing GFP in pm3. Animals carried transgene vkEx1241 (myo-2p::GFP), which expresses GFP in pm3 under the myo-2 promoter. n = 20 animals. (G) Pharyngeal muscle GCaMP responses to light of individual mosaic animals selected for bright transgene expression in the anterior pharynx. Each row represents a different animal; ΔF/F0 over time is indicated according to the heatmap at left. Light induces subcellularly localized increases in pharyngeal muscle GCaMP fluorescence at the anterior end of the pharynx. Animals carried transgene nEx3045 (C32F10.8p::GCaMP3), which expresses GCaMP in the pm3 pharyngeal muscles and mc1 marginal cells under the C32F10.8 promoter. Each line indicates an independent trial from a different animal. Regions analyzed are indicated in Figure 2G. n = 10 animals. Average GCaMP response of animals shown to right of individual traces. (H) The light-induced spitting behavior of animals carrying the transgene nIs686 (pharyngeal musclepromoter – gpa-16p::gcamp3) resembles that of wild-type animals. n = three animals.
-
Figure 2—figure supplement 1—source data 1
Source data for Figure 2—figure supplement 1.
- https://cdn.elifesciences.org/articles/59341/elife-59341-fig2-figsupp1-data1-v2.zip
Figure 2—figure supplement 2
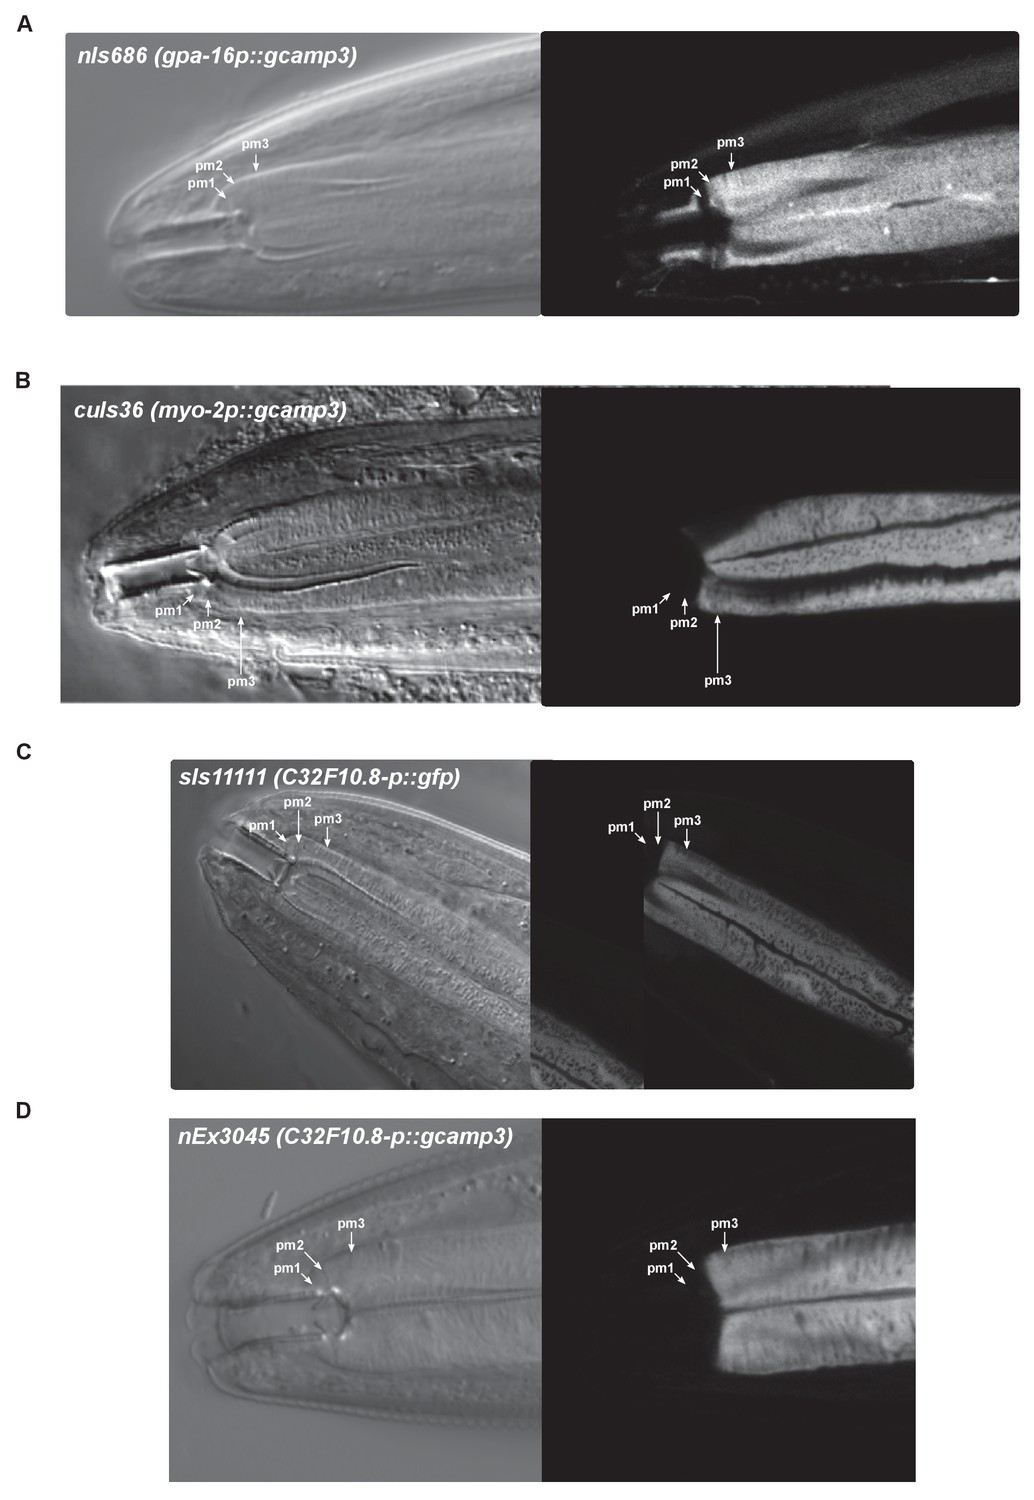
Characterization of the pharyngeal expression pattern of transgenes used in calcium imaging.
(A) Transgene nIs686 (gpa-16p::gcamp3) drives GCaMP expression in pharyngeal muscles pm2 and pm3 and in the mc1 marginal cells (not shown). Occasional dim expression was observed in pm1 (not shown). (B) Transgene cuIs36 (myo-2p::gcamp3) drives GCaMP expression in the pm3 pharyngeal muscles but not pm1, pm2, or the mc1 marginal cells (not shown). (C) Transgene sIs11111 (C32F10.8p::gfp) drives GFP expression in the pm3 pharyngeal muscles and the mc1 marginal cells (not shown) but not pm1 or pm2. (D) Transgene nEx3045 (C32F10.8p::gcamp3) drives GCaMP expression in the pm3 pharyngeal muscles and the mc1 marginal cells (not shown) but not pm1 or pm2.
-
Figure 2—figure supplement 2—source data 1
Source data for Figure 2—figure supplement 2.
- https://cdn.elifesciences.org/articles/59341/elife-59341-fig2-figsupp2-data1-v2.zip
Figure 3 with 1 supplement
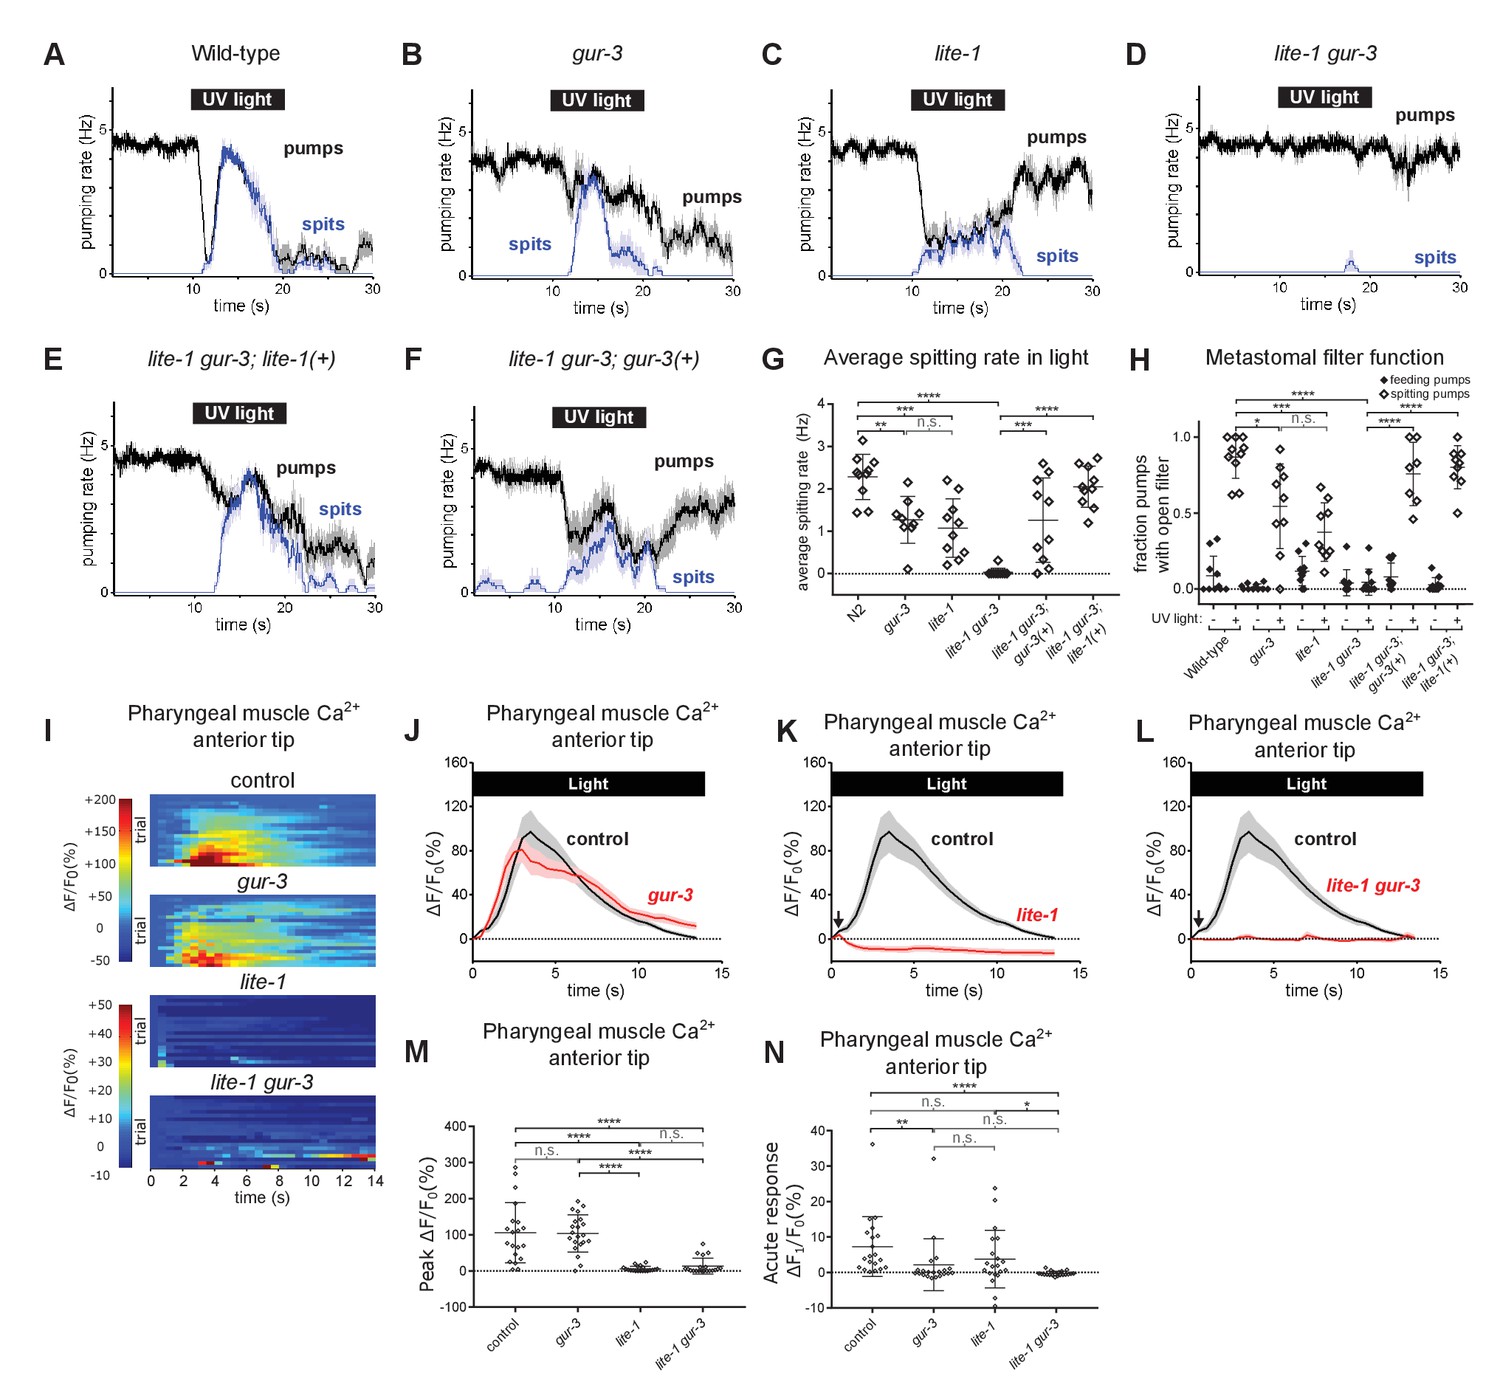
Pharyngeally expressed gustatory receptor orthologs lite-1 and gur-3 play major and minor roles, respectively, in the light-induced spitting reflex.
(A–D) Light-induced spitting is reduced in gur-3 and lite-1 single mutants and eliminated in lite-1 gur-3 double mutants. n = 10 animals except ngur-3 = 9. (E–F) Expression of wild-type lite-1 (transgene nEx2281; lite-1promoter::lite-1::gfp) or gur-3 (transgene nEx2157; gur-3promoter::gur-3 gDNA) respectively restores wild-type or partial spitting to lite-1 gur-3 double mutants. n = 10 animals. (G) Quantification of average spitting rate during light exposure of animals from (H–M). ****, approximate adjusted p value < 0.0001; ***, adjusted p value < 0.0005, **, adjusted p value < 0.005; n.s., not significant; ordinary one-way ANOVA. (H) Quantification of the frequencies at which the metastomal filter was open in feeding and spitting pumps in (H–M). ****, approximate adjusted p value < 0.0001; ***, adjusted p value < 0.0005, *, adjusted p value < 0.05; n.s., not significant; ordinary one-way ANOVA. (I) Pharyngeal muscle GCaMP responses of individual animals to light. Each row represents a different animal; ΔF/F0 over time is indicated according to the heatmap at left. n ≥ 20 animals. Control data duplicated from Figure 2I–J. (J–L) Light-induced pharyngeal muscle calcium increases depend on lite-1 (which accounts for 99% of the response) and gur-3 (which makes a small contribution to the initial activation of pharyngeal muscle; black arrows). n ≥ 20 animals. Control data duplicated from Figure 2I–J. (M) Quantification of peak GCaMP ΔF/F0 from (Q–T). lite-1, but not gur-3, is required for the amplitude of the pharyngeal muscle response to light. ****, approximate adjusted p value < 0.0001; n.s., not significant; Kruskal-Wallis test, followed by Dunn’s multiple comparison test. (N) Quantification of acute (Ft = 0.5 sec/F0) GCaMP response from (Q–T). gur-3, but not lite-1, is required for the acute GCaMP response of pharyngeal muscle to light. ****, approximate adjusted p value < 0.0001; **, adjusted p value < 0.001; *, adjusted p value < 0.05; n.s., not significant; Kruskal-Wallis test, followed by Dunn’s multiple comparison test. Shading around traces indicates SEM. All gur-3 alleles are null allele gur-3(ok2245) and all lite-1 alleles are null allele lite-1(ce314). Center bar, mean; error bars, SD. ****, approximate adjusted p value < 0.0001; ***, adjusted p value < 0.0005, **, adjusted p value < 0.005; *, adjusted p value < 0.05; n.s., not significant; ordinary one-way ANOVA.
-
Figure 3—source data 1
Source data for Figure 3.
- https://cdn.elifesciences.org/articles/59341/elife-59341-fig3-data1-v2.zip
Figure 3—figure supplement 1
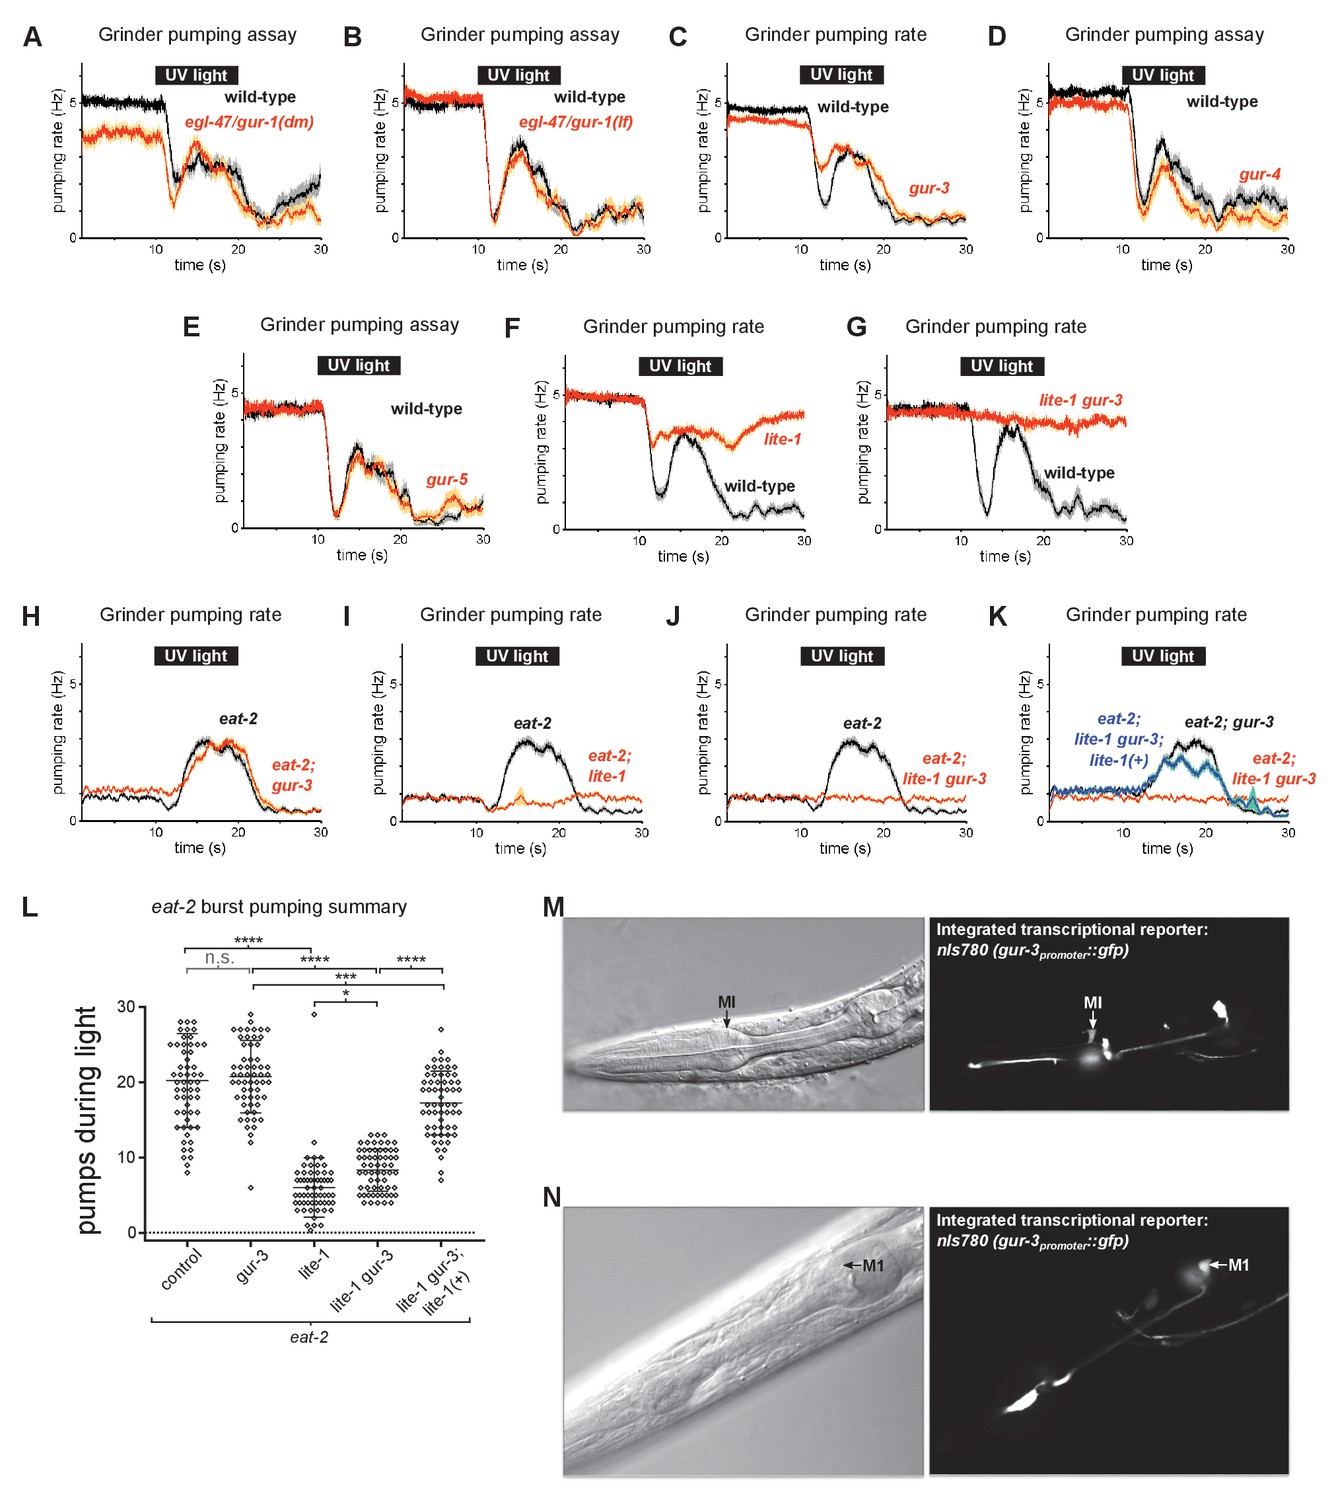
Additional characterization of gustatory receptor ortholog function and expression.
(A) egl-47/gur-1(n1082dm) mutants were normal in burst pumping. n = 20 animals. (B) egl-47/gur-1(ok677) mutants were normal in burst pumping. n = 20 animals. (C) gur-3 is not required for light-induced burst pumping. n = 3 biological replicates (60 animals total). (D) gur-4(ok672) mutants were normal in burst pumping. n = 20 animals. (E) gur-5(tm6169) mutants were normal in burst pumping. n = 20 animals. (F–G) The contribution of lite-1 to burst pumping cannot be evaluated directly because lite-1 mutants are partially defective in pumping inhibition. nlite-1 = 2 biological replicates (40 animals total); nlite-1 gur-3 = 20 animals. (H–J) Burst pumping of eat-2(ad1113) mutants depends on lite-1 but not gur-3. n = three biological replicates (60 animals total). (K) lite-1 rescuing transgene nIs687 (lite-1promoter::gfp::lite-1) rescues the burst pumping defect of eat-2; lite-1 gur-3 mutants. n = three biological replicates (60 animals total). (L) Quantification of burst pumping from (D–G). ****, approximate adjusted p value < 0.0001; ***, adjusted p value < 0.0005, *, adjusted p value < 0.05; n.s., not significant; ordinary one-way ANOVA. (M–N) Integrated gur-3 transcriptional reporter transgene nIs780 (gur-3promoter::gfp) is expressed in the MI and M1 pharyngeal neurons and an unidentified head neuron (not shown), in addition to being expressed in the I2, I4, and AVD neurons as previously reported by Bhatla and Horvitz, 2015.
-
Figure 3—figure supplement 1—source data 1
Source data for Figure 3—figure supplement 1.
- https://cdn.elifesciences.org/articles/59341/elife-59341-fig3-figsupp1-data1-v2.zip
Figure 4 with 2 supplements
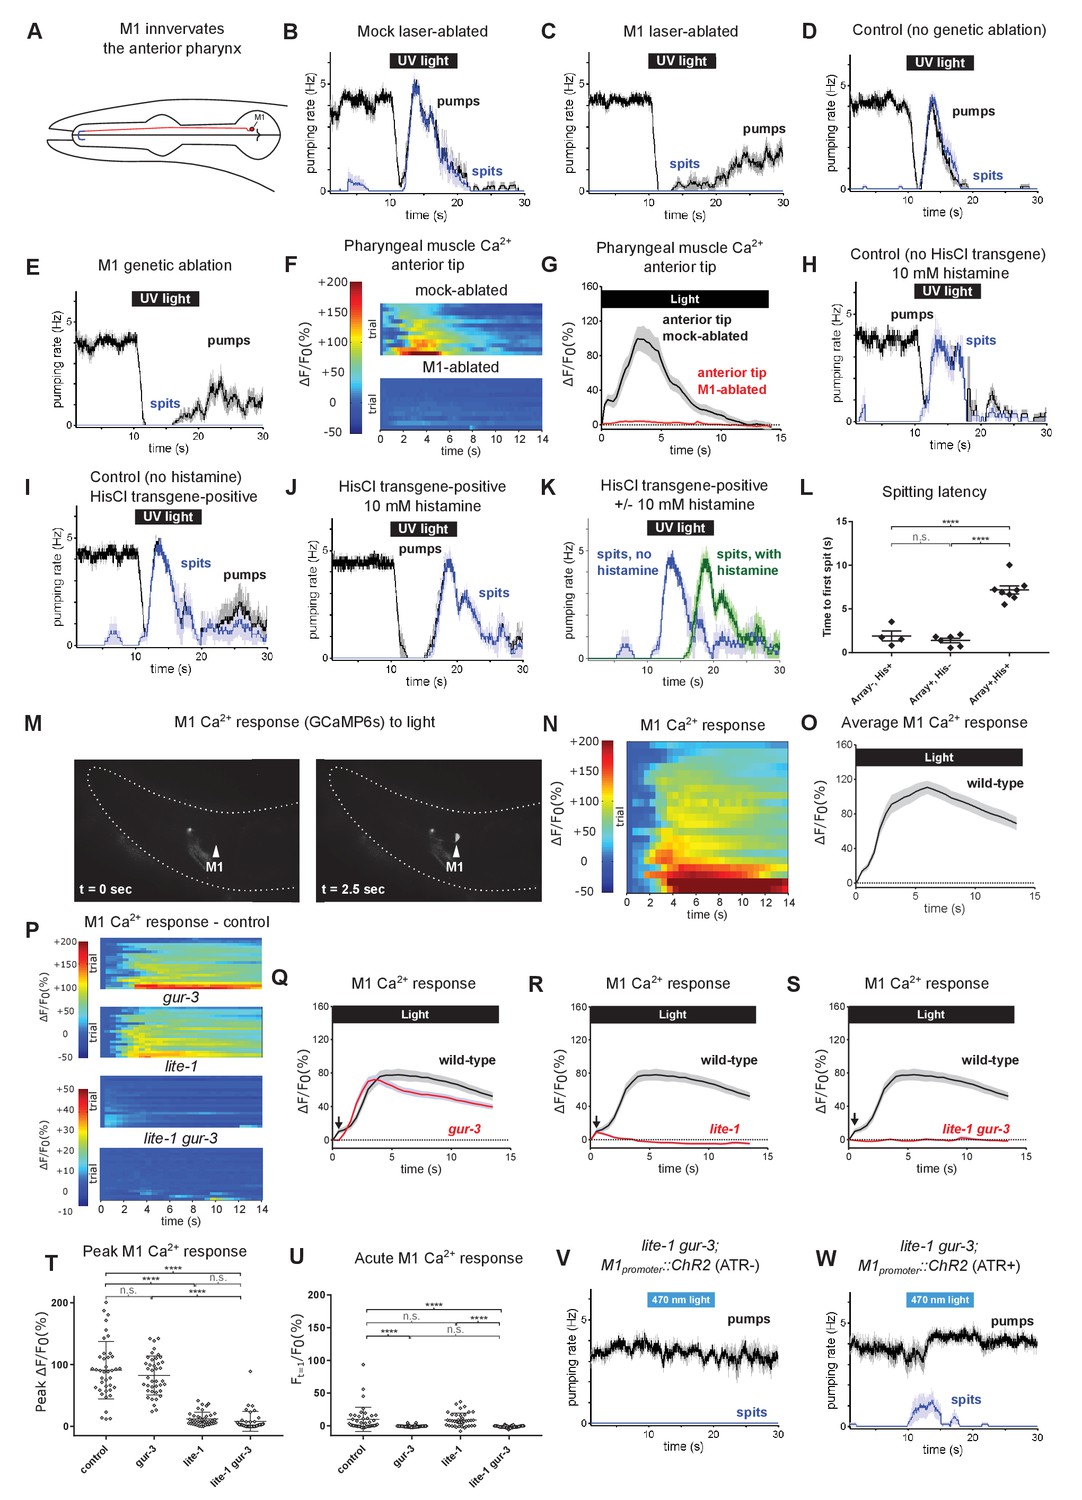
The pharyngeal neuron M1 controls the spitting reflex.
(A) The anatomy of M1 (red) suggests that it controls spitting directly, as it is the only neuron to make neuromuscular junctions (bolded blue segment) with the region of pharyngeal muscle that undergoes sustained contraction during spitting. (B–C) M1 laser-ablated, but not mock-ablated, animals are completely defective in light-induced spitting and burst pumping. Animals carried GFP reporter transgene nIs864 (M1promoter::gfp) to mark M1. ‘M1promoter’ refers to the glr-2 promoter. n ≥ 12 animals. (D–E) M1 genetically-ablated animals, but not transgene-negative sibling controls, are completely defective in light-induced spitting and burst pumping. Ablated animals carried genetic-ablation transgene nEx2905 (M1promoter::ice::sl2::mcherry) and all animals carried GFP reporter transgene nIs864. ‘M1promoter’ refers to the lury-1 promoter. n = 10 animals. (F) Pharyngeal muscle GCaMP responses of individual animals to light. Each row represents a different animal; ΔF/F0 over time is indicated according to the heatmap at left. n ≥ 11 animals. (G) Average response of animals from (F). Spatially restricted calcium signals depend on M1. ‘Anterior tip’ region analyzed is indicated in Figure 2G. Animals carried pharyngeal muscle GCaMP3 transgene nIs686 (gpa-16p::GCaMP3). (H–J) Histamine-exposed animals expressing the inhibitory histamine-gated chloride channel HisCl1 in M1 (n = 8) but neither of histamine-exposed animals lacking HisCl1 expression in M1 (n = 4) or non-histamine-exposed animals expressing HisCl1 in M1 (n = 6) exhibited significantly delayed spitting in response to light. (K) Comparison of the light-induced spitting behavior of animals from (I–J). (L) Quantification of H-J. Histamine-exposed animals expressing HisCl1 in M1 exhibit significantly greater spitting latencies than control animals. ****, adjusted p value < 0.0001; n.s., not significant; ordinary one-way ANOVA. (M) Representative example of light-induced GCaMP6s fluorescence increase in M1. Animal carried transgene nIs678 (M1promoter::gcamp6s). ‘M1promoter’ refers to the glr-2 promoter. The unchanging signal common to both images was caused by GCaMP6s fluorescence in additional glr-2-expressing neurons in the nerve ring. See also Video 15. (N) M1 somatic GCaMP responses of individual animals to light; n = 20. (O) Average response of animals shown in (N). (P) M1 somatic GCaMP responses of individual control, gur-3, lite-1, and lite-1 gur-3 mutant animals to light. n = two biological replicates (40 animals total). (Q–S) Light-induced calcium increases in the M1 neuron depend on lite-1 (which accounts for 99% M1’s response) and gur-3 (which makes a small but consistent contribution to M1’s initial activation; black arrows). n = two biological replicates (40 animals total). (T) Quantification of peak GCaMP ΔF/F0 from (P–S). lite-1, but not gur-3, is required for the amplitude of the M1 GCaMP response to light. ****, approximate adjusted p value < 0.0001; n.s., not significant; Kruskal-Wallis test, followed by Dunn’s multiple comparison test. (U) Quantification of acute (Ft = 0.5 sec/F0) GCaMP response from (P–S). gur-3, but not lite-1, is required for the acute M1 GCaMP response to light. ****, approximate adjusted p value < 0.0001; n.s., not significant; Kruskal-Wallis test, followed by Dunn’s multiple comparison test. (V–W) A subset (~25%) of lite-1 gur-3 animals expressing an M1-specific ChR2 transgene nEx2815 (M1promoter::chr2::sl2::mcherry) grown in the presence, but not the absence, of ATR spit in response to 470 nm light. ‘M1promoter’ refers to the lury-1 promoter. n ≥ 10 animals. Shading around traces indicates SEM. All gur-3 alleles are null allele gur-3(ok2245), and all lite-1 alleles are null allele lite-1(ce314).
-
Figure 4—source data 1
Source data for Figure 4.
- https://cdn.elifesciences.org/articles/59341/elife-59341-fig4-data1-v2.zip
Figure 4—figure supplement 1
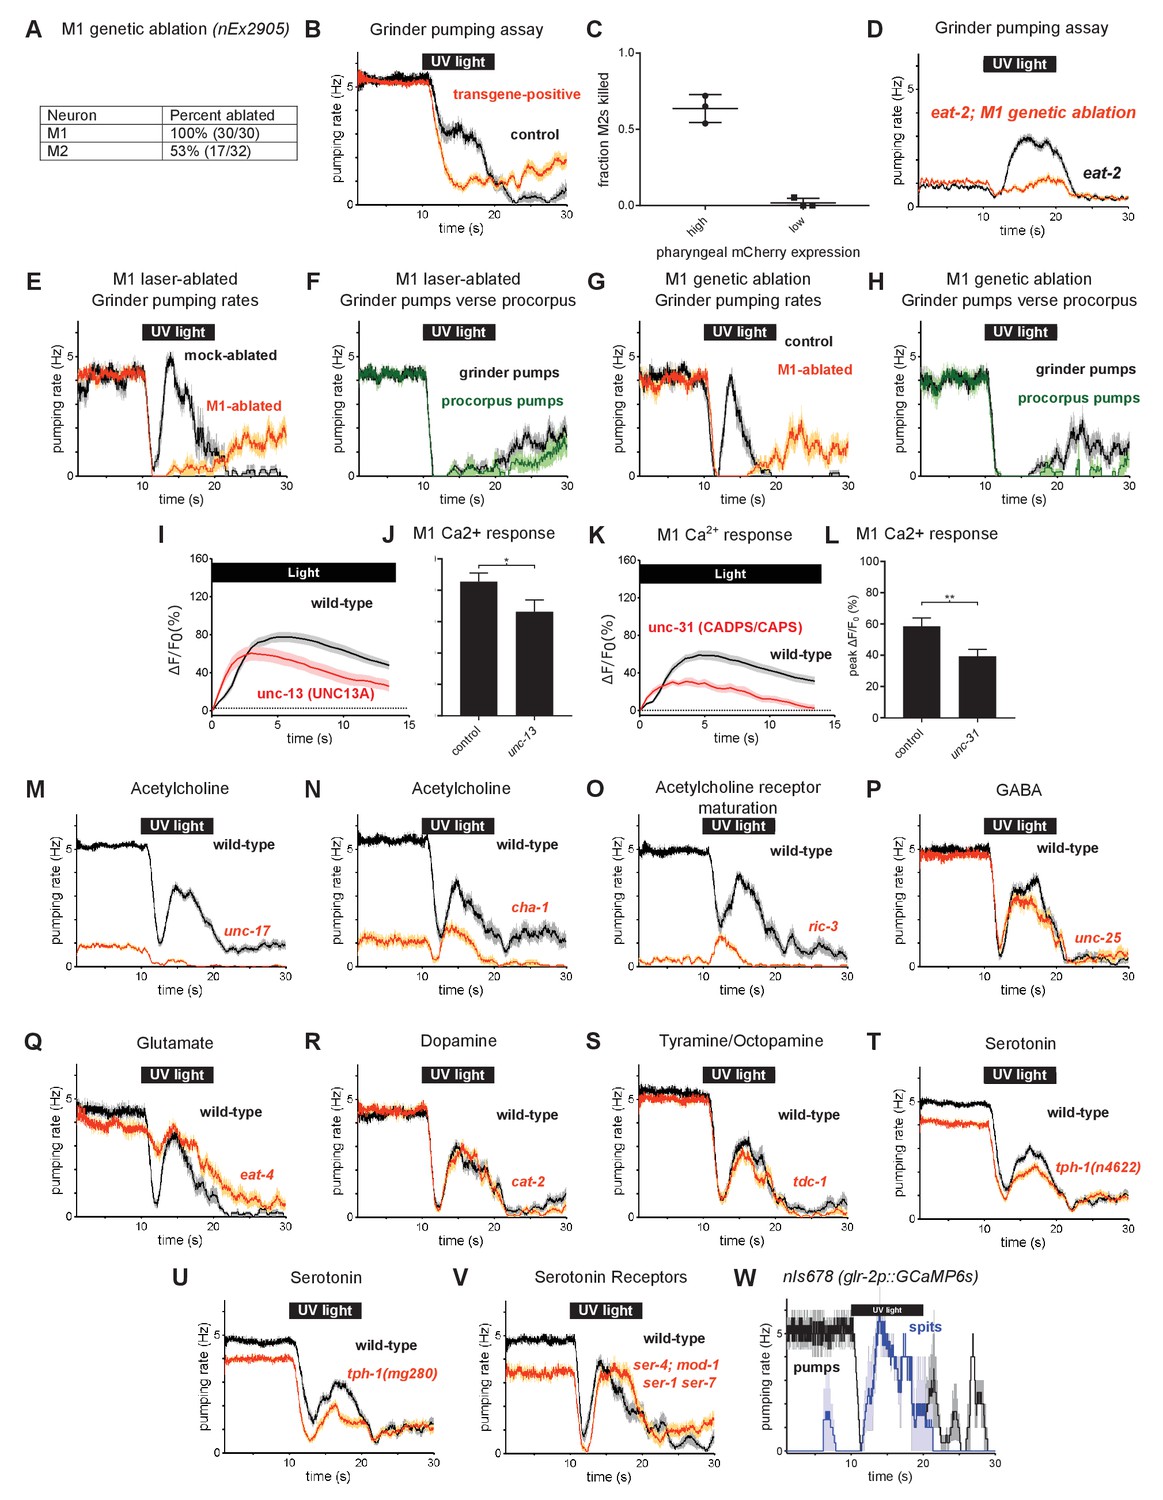
Additional characterization of the function of the M1 pharyngeal neuron in spitting and burst pumping.
(A) Overexpression of the mammalian caspase ICE in M1 via the transgene nEx2905 (M1promoter – lury-1::ice::sl2::mCherry) kills M1 with high efficiency and the M2 pharyngeal neurons with moderate efficiency. The presence of M1 and the M2s was determined by the expression of transgenes nIs864 (M1promoter – glr-2::gfp) and nIs310 (nlp-13promoter::gfp), respectively. (B) M1 genetic-ablation transgene eliminates burst pumping in the grinder pumping assay. Ablation animals carried transgene nEx2905 (M1promoter - lury-1::ice::sl2::mcherry); all animals carried nIs864 (M1promoter – glr-2::gfp). n = 40 animals. (C) Screening animals based on the brightness of pharyngeal mCherry expression allows the selection of animals lacking the M1 neuron but not the M2 neurons. When pharyngeal muscle mCherry expression is high, animals are more likely to lack the M2s. Animals with dim pharyngeal muscle mCherry expression very rarely lack M2s; thus dim mCherry expression can be used to enrich for animals lacking only M1. Center bar, mean; error bars, SEM. n = three biological replicates (more than 65 animals total). (D) Genetic ablation of M1 eliminates burst pumping in eat-2 mutants. Ablation animals carried transgene nIs865 (M1promoter – lury-1::ice::sl2::mCherry). n = three biological replicates (60 animals total). (E) Comparison of grinder pumping rates of mock and M1 laser-ablated animals from Figure 4B and C. In addition to eliminating burst pumping and spitting, M1 ablation enhances the rate of pumping recovery after illumination. n ≥ 12 animals. (F) Laser-ablated animals from Figure 4B exhibit abnormal ‘uncoupled’ pumps, during which the grinder pumps while the procorpus does not. n ≥ 12 animals. (G) Comparison of grinder pumping rates of control and M1 genetic-ablated animals from Figure 4D and E. In addition to eliminating burst pumping and spitting, M1 ablation enhances the rate of pumping recovery after illumination. n = 10 animals. (H) M1 genetic-ablation animals from Figure 4E exhibit abnormal ‘uncoupled’ pumps, during which the grinder pumps while the procorpus does not. n = 10 animals. (I) Light-induced calcium increases in M1 are reduced but still significant in unc-13(s69) mutants. n = two biological replicates (greater than 41 animals total). (J) Quantification of M1’s calcium response to light in unc-13(s69) mutants in (M). Error bars, SEM; *, p < 0.05; t test. (K) Light-induced calcium increases in M1 are reduced but still significant in unc-31(u280) mutants. n = 20 animals. (L) Quantification of M1’s calcium response to light in unc-31(u280) mutants in (O). Error bars, SEM; **, p < 0.01; t test. (M) unc-17(e245) vesicular acetylcholine transporter mutants defective in vesicular acetylcholine transport were severely defective in both feeding and burst pumping. n = three biological replicates (60 animals total). (N) cha-1(p1152) choline acetyltransferase mutants defective in acetylcholine synthesis were severely defective in both feeding and burst pumping. n = 20 animals. (O) ric-3(md158) mutants defective in nicotinic acetylcholine receptor maturation were severely defective in both feeding and burst pumping. n = 20 animals. (P) unc-25(e156) glutamate decarboxylase mutants defective in GABA synthesis were normal in burst pumping. n = 20 animals. (Q) eat-4(ky5) vesicular glutamate transporter mutants defective in vesicular glutamate transport were defective in acute inhibition (Bhatla and Horvitz, 2015) but normal in burst pumping. n = 20 animals. (R) cat-2(e1113) tyrosine hydroxylase mutants defective in dopamine synthesis were normal in burst pumping. n = 20 animals. (S) tdc-1(n3420) tyrosine decarboxylase mutants defective in tyramine and octopamine synthesis were normal in burst pumping. n = 20 animals. (T) tph-1(n4622) tryptophan hydroxylase mutants defective in serotonin synthesis were mildly defective in both feeding and burst pumping. n = three biological replicates (60 animals total). (U) tph-1(mg280) tryptophan hydroxylase mutants defective in serotonin synthesis were mildly defective in both feeding and burst pumping. n = three biological replicates (60 animals total). (V) ser-4(ok512); mod-1(ok103); ser-1(ok345) ser-7(tm1325) quadruple serotonin receptor mutants were defective in feeding but normal in burst pumping. n = 20 animals. (W) The light-induced spitting behavior of animals carrying the transgene nIs678 (M1promoter - glr-2p::gcamp6s) resembles that of wild-type animals. n = three animals. Shading around traces indicates SEM. ‘M1promoter – lury-1’ refers to the lury-1 promoter and ‘M1promoter – glr-2’ refers to the glr-2 promoter. (1E-H and 1W) are derived from videos of bead feeding assays, (1I-1L) are derived from calcium imaging videos, and all other behavior plots were grinder pumping assays scored in real time.
-
Figure 4—figure supplement 1—source data 1
Source data for Figure 4—figure supplement 1.
- https://cdn.elifesciences.org/articles/59341/elife-59341-fig4-figsupp1-data1-v2.zip
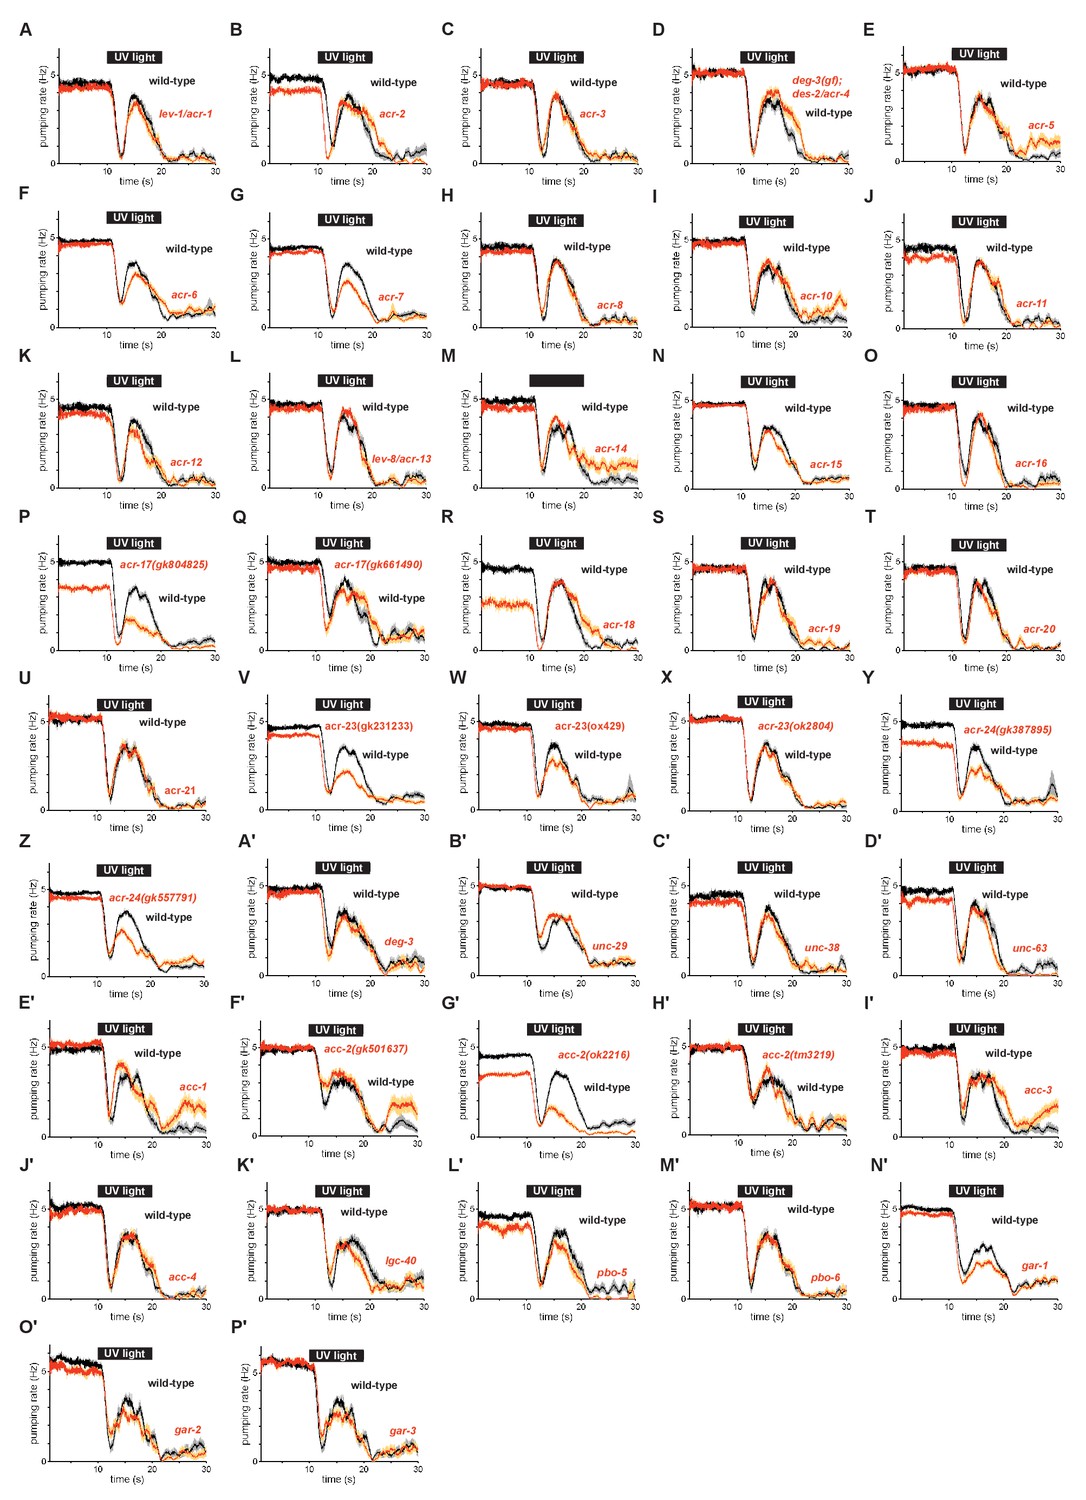
Figure 4—figure supplement 2
Burst pumping responses of acetylcholine receptor mutants to UV light.
(A) lev-1/acr-1(e211) nicotinic acetylcholine receptor mutants were normal in burst pumping. n = 20 animals. (B) acr-2(n2595 n2420) nicotinic acetylcholine receptor mutants were normal in burst pumping. n = 20 animals. (C) acr-3(ok2049) nicotinic acetylcholine receptor mutants were normal in burst pumping. n = 20 animals. (D) deg-3(u662); des-2/acr-4(u695) nicotinic acetylcholine receptor mutants were normal in burst pumping. n = 20 animals. (E) acr-5(ok180) nicotinic acetylcholine receptor mutants were normal in burst pumping. n = 20 animals. (F) acr-6(tm3723) nicotinic acetylcholine receptor mutants were subtly defective in burst pumping. n = three biological replicates (60 animals total). (G) acr-7(tm863) nicotinic acetylcholine receptor mutants were modestly defective in burst pumping. n = three biological replicates (60 animals total). (H) acr-8(ok1240) nicotinic acetylcholine receptor mutants were normal in burst pumping. n = three biological replicates (60 animals total). (I) acr-10(tm2515) nicotinic acetylcholine receptor mutants were normal in burst pumping. n = 20 animals. (J) acr-11(gk827759) nicotinic acetylcholine receptor mutants were normal in burst pumping. n = 20 animals. (K) acr-12(ok367) nicotinic acetylcholine receptor mutants were normal in burst pumping. n = 20 animals. (L) lev-8/acr-13(x15) nicotinic acetylcholine receptor mutants were normal in burst pumping. n = 20 animals. (M) acr-14(tm5819) nicotinic acetylcholine receptor mutants were normal in burst pumping. n = 20 animals. (N) acr-15(ok1214) nicotinic acetylcholine receptor mutants were normal in burst pumping. n = 20 animals. (O) acr-16(ok789) nicotinic acetylcholine receptor mutants were normal in burst pumping. n = 20 animals. (P) acr-17(gk804825) nicotinic acetylcholine receptor mutants were defective in both feeding and burst pumping. n = two biological replicates (40 animals total). (Q) acr-17(gk661490) nicotinic acetylcholine receptor mutants were normal in burst pumping. n = 20 animals. (R) acr-18(gk324494) nicotinic acetylcholine receptor mutants were defective in feeding but normal in burst pumping. n = 20 animals. (S) acr-19(ok967) nicotinic acetylcholine receptor mutants were normal in burst pumping. n = 20 animals. (T) acr-20(gk161737) nicotinic acetylcholine receptor mutants were normal in burst pumping. n = 20 animals. (U) acr-21(ok1314) nicotinic acetylcholine receptor mutants were normal in burst pumping. n = 20 animals. (V) acr-23(gk231233) nicotinic acetylcholine receptor mutants were subtly defective in feeding and defective in burst pumping. n = three biological replicates (60 animals total). (W) acr-23(ox429) nicotinic acetylcholine receptor mutants were subtly defective in burst pumping. n = three biological replicates (60 animals total). (X) acr-23(ok2804) nicotinic acetylcholine receptor mutants were normal in burst pumping. n = 20 animals. (Y) acr-24(gk387895) nicotinic acetylcholine receptor mutants were defective in both feeding and burst pumping. n = two biological replicates (40 animals total). (Z) acr-24(gk557791) nicotinic acetylcholine receptor mutants were defective in burst pumping. n = three biological replicates (60 animals total). (A’) deg-3(u773) nicotinic acetylcholine receptor mutants were normal in burst pumping. n = 20 animals. (B’) unc-29(e1072) nicotinic acetylcholine receptor mutants were normal in burst pumping. n = three biological replicates (60 animals total). (C’) unc-38(e264) nicotinic acetylcholine receptor mutants were normal in burst pumping. n = 20 animals. (D’) lev-7/unc-63(x13) nicotinic acetylcholine receptor mutants were normal in burst pumping. n = 20 animals. (E’) acc-1(tm3268) acetylcholine-gated chloride channel mutants were normal in burst pumping. n = 20 animals. (F’) acc-2(gk501637) acetylcholine-gated chloride channel mutants were normal in burst pumping. n = 20 animals. (G’) acc-2(ok2216) acetylcholine-gated chloride channel mutants were defective in feeding and burst pumping. n = three biological replicates (60 animals total). (H’) acc-2(tm3219) acetylcholine-gated chloride channel mutants were normal in burst pumping. n = 20 animals. (I’) acc-3(tm3174) acetylcholine-gated chloride channel mutants were normal in burst pumping. n = 20 animals. (J’) acc-4(ok2371) acetylcholine-gated chloride channel mutants were normal in burst pumping. n = 20 animals. (K’) lgc-40(tm3377) acetylcholine-gated chloride channel mutants were normal in burst pumping. n = 20 animals. (L’) pbo-5(gk963058) nicotinic acetylcholine receptor family mutants were normal in burst pumping. n = 20 animals. (M’) pbo-6(ok1564) nicotinic acetylcholine receptor family mutants were normal in burst pumping. n = 20 animals. (N’) gar-1(ok755) muscarinic acetylcholine receptor mutants were subtly defective in burst pumping. n = three biological replicates (60 animals total). (O’) gar-2(ok520) muscarinic acetylcholine receptor mutants were normal in burst pumping. n = 20 animals. (P’) gar-3(gk337) muscarinic acetylcholine receptor mutants were normal in burst pumping. n = 20 animals.
-
Figure 4—figure supplement 2—source data 1
Source data for Figure 4—figure supplement 2.
- https://cdn.elifesciences.org/articles/59341/elife-59341-fig4-figsupp2-data1-v2.zip
Figure 5
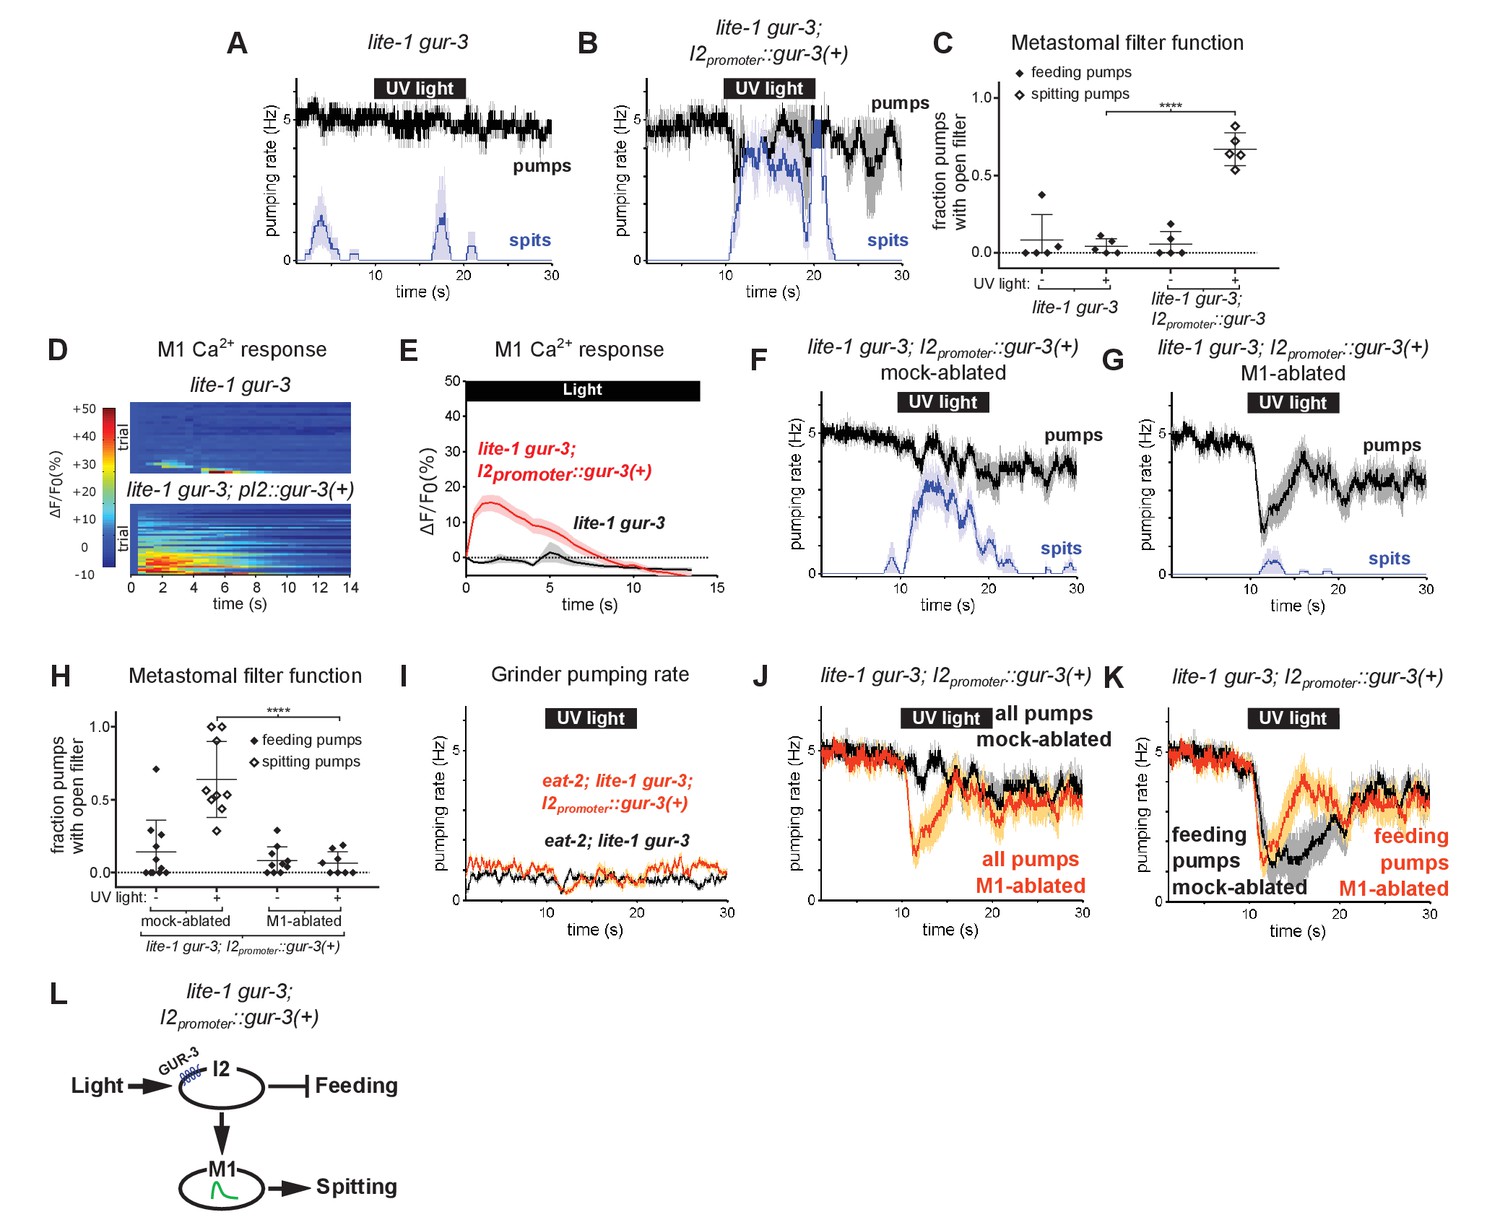
The gur-3-Expressing I2 Neurons Can Activate M1 to Produce an Attenuated Form of Spitting.
(A–B) I2-specific expression of gur-3 restores light-induced spitting to lite-1 gur-3 mutants. n = five animals. (C) Quantification of the frequencies at which the metastomal filter was open in feeding and spitting pumps in (A) and (B). Center bar, mean; error bars, SEM; ****, p < 0.0001; t test. n = five animals. (D) I2-specific expression of gur-3 restores the light-induced M1 calcium response of lite-1 gur-3 mutants. M1 somatic GCaMP responses of individual animals to light. Each row is a different animal; ΔF/F0 over time is indicated according to the heatmap at left. n ≥ 26 animals. (E) Average of (D). (F–G) Laser ablation of M1 suppresses the I2-specific gur-3 rescue of lite-1 gur-3 spitting defects. n = 11 animals. (H) Quantification of the frequencies at which the metastomal filter was open in feeding and spitting pumps in (F) and (G). Center bar, mean; error bars, SEM; ****, p < 0.0001; t test. n ≥ 8 animals. (I) I2-specific expression of gur-3 via transgene nIs791 (I2promoter::mcherry::gur-3(+)) does not rescue the burst pumping defect of eat-2; lite-1 gur-3 animals in the grinder pumping assay. n = 20 animals. (J) Comparison of grinder pumping rates in (F) and (G). While mock-ablated animals from (F) do not inhibit pumping in response to light, M1-ablated animals from (G) exhibit robust light-induced inhibition, indicating that the I2s’ promotion of pumping via M1 outweighs their inhibition of pumping. (K) Comparison of feeding pumping rates from (F) and (G). (L) Model for the effects of the I2 neurons on M1 and pumping. The I2 neurons reduce overall feeding by two mechanisms: direct inhibition of feeding pumps and M1-dependent promotion of spitting pumps. Shading around traces indicates SEM. Unless indicated otherwise, ‘I2-specific expression of gur-3’ refers to transgene nEx2144 (I2promoter::mcherry::gur-3(+)). ‘Genetic ablation of the I2 neurons’ refers to transgene nIs569 (I2promoter::csp-1b) (Bhatla and Horvitz, 2015). ‘I2promoter’ refers to the flp-15 promoter.
-
Figure 5—source data 1
Source data for Figure 5.
- https://cdn.elifesciences.org/articles/59341/elife-59341-fig5-data1-v2.zip
Figure 6 with 1 supplement
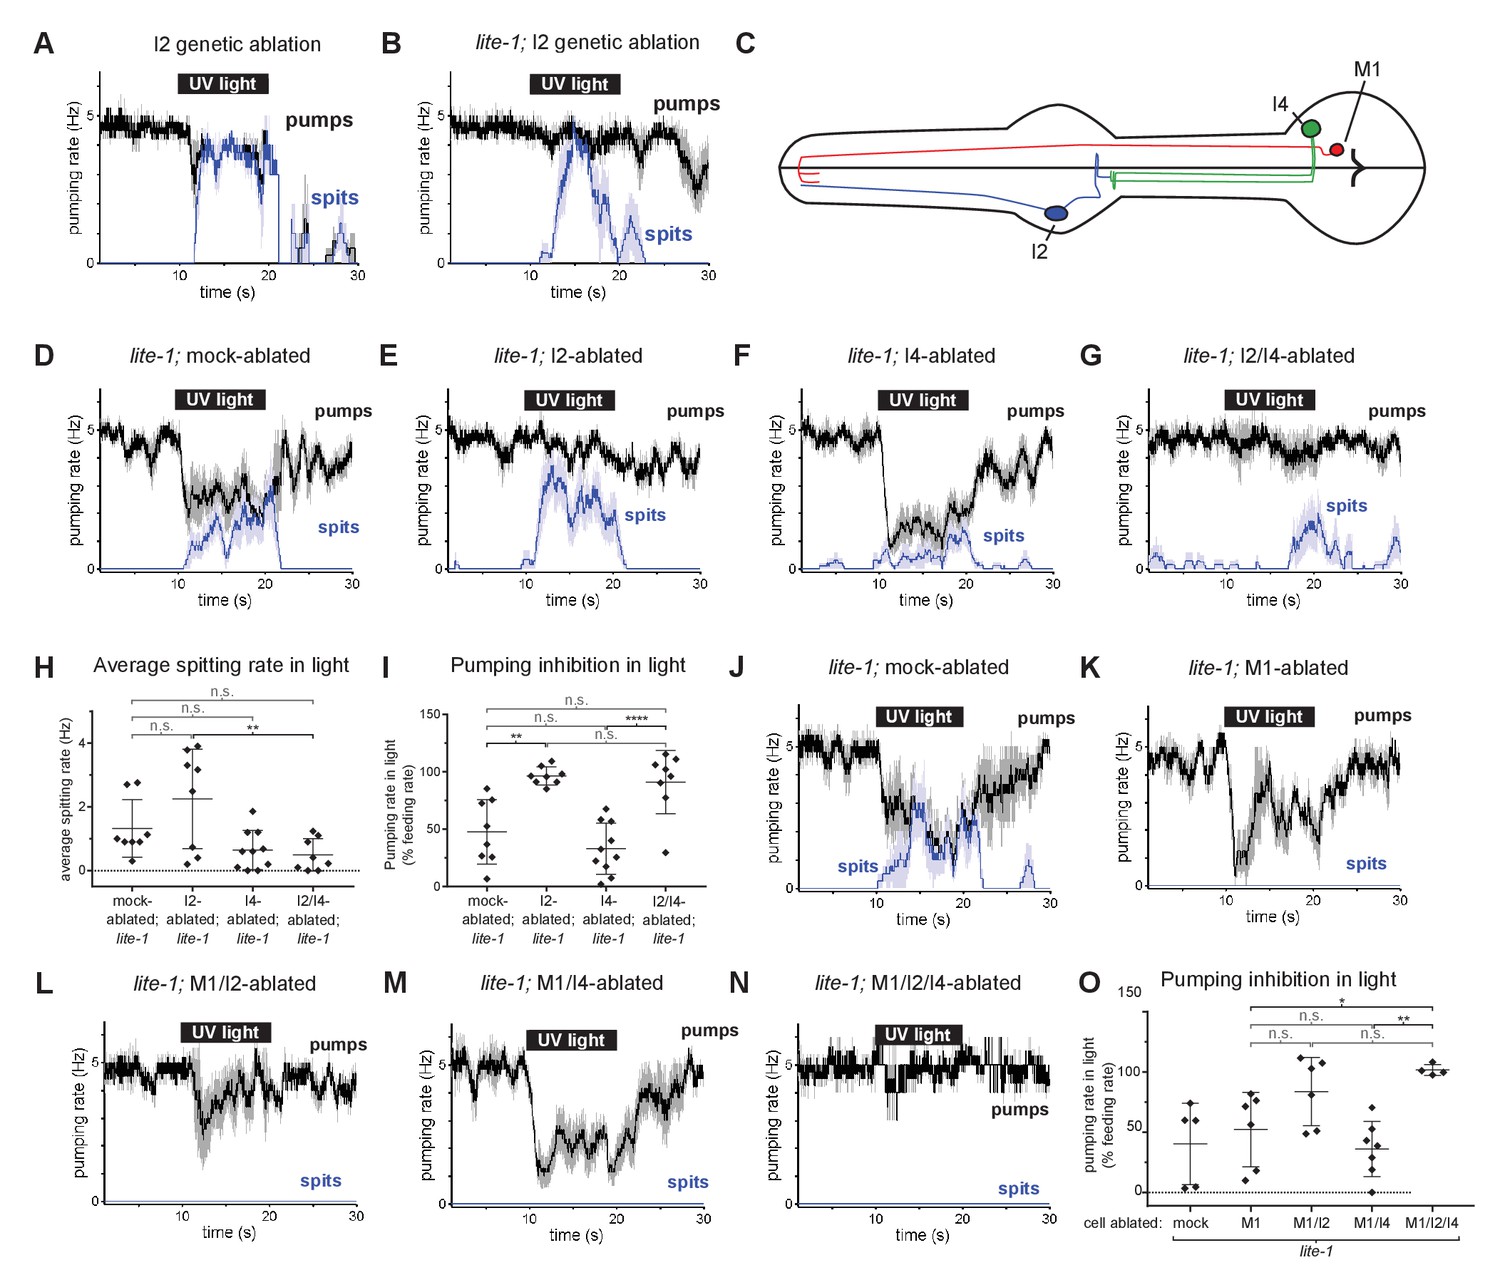
The I4 neuron functions with the I2 neurons to promote spitting and inhibit feeding.
(A) Genetic ablation of the I2 neurons in a wild-type background does not eliminate light-induced spitting. n = five animals. (B) Genetic ablation of the I2 neurons of lite-1(ce314) mutants does not eliminate light-induced spitting. n = six animals. (C) Diagram indicating the cellular morphology of M1 and the gur-3-expressing I2 and I4 pharyngeal neurons. The I2 neurons are bilaterally symmetric; only one I2 neuron is depicted. (D) Mock-ablated lite-1 animals inhibit pumping and spit in response to light. n = eight animals. (E) I2-ablated lite-1 animals spit in response to light but do not inhibit pumping. n = eight animals. (F) I4-ablated lite-1 animals inhibit pumping and spit in response to light. n = 10 animals. (G) I2/I4 double-ablated lite-1 animals exhibit delayed spitting and do not inhibit pumping in response to light. n = eight animals. (H) Quantification of average spitting rate during light exposure of animals from (C–D). **, adjusted p value < 0.005; n.s., not significant; ordinary one-way ANOVA. (I) Quantification of pumping inhibition during light exposure of animals from (D–G). ****, approximate adjusted p value < 0.0001; **, adjusted p value < 0.005; n.s., not significant; ordinary one-way ANOVA. (J) Mock-ablated lite-1 animals inhibit pumping and spit in response to light. n = five animals. (K–M) M1-ablated (n = six animals), M1/I2-ablated (n = 6), and M1/I4-ablated (n = 7) lite-1 animals inhibit pumping, but do not spit, in response to light. (N) M1/I2/I4 triple-ablated lite-1 animals neither inhibit pumping nor spit in response to light. n = four animals. (O) Quantification of pumping inhibition in (J–N). Ablation of the I2 neurons eliminates light-induced pumping inhibition by M1/I4-ablated animals. **, adjusted p value < 0.005; *, adjusted p value < 0.05; n.s., not significant; ordinary one-way ANOVA. Shading around traces indicates SEM. All animals were lite-1(ce314) null mutants and carried transgene nIs678 (M1promoter::gcamp6s). ‘M1promoter’ refers to the glr-2 promoter. Center bar, mean; error bars, SD.
-
Figure 6—source data 1
Source data for Figure 6.
- https://cdn.elifesciences.org/articles/59341/elife-59341-fig6-data1-v2.zip
Figure 6—figure supplement 1
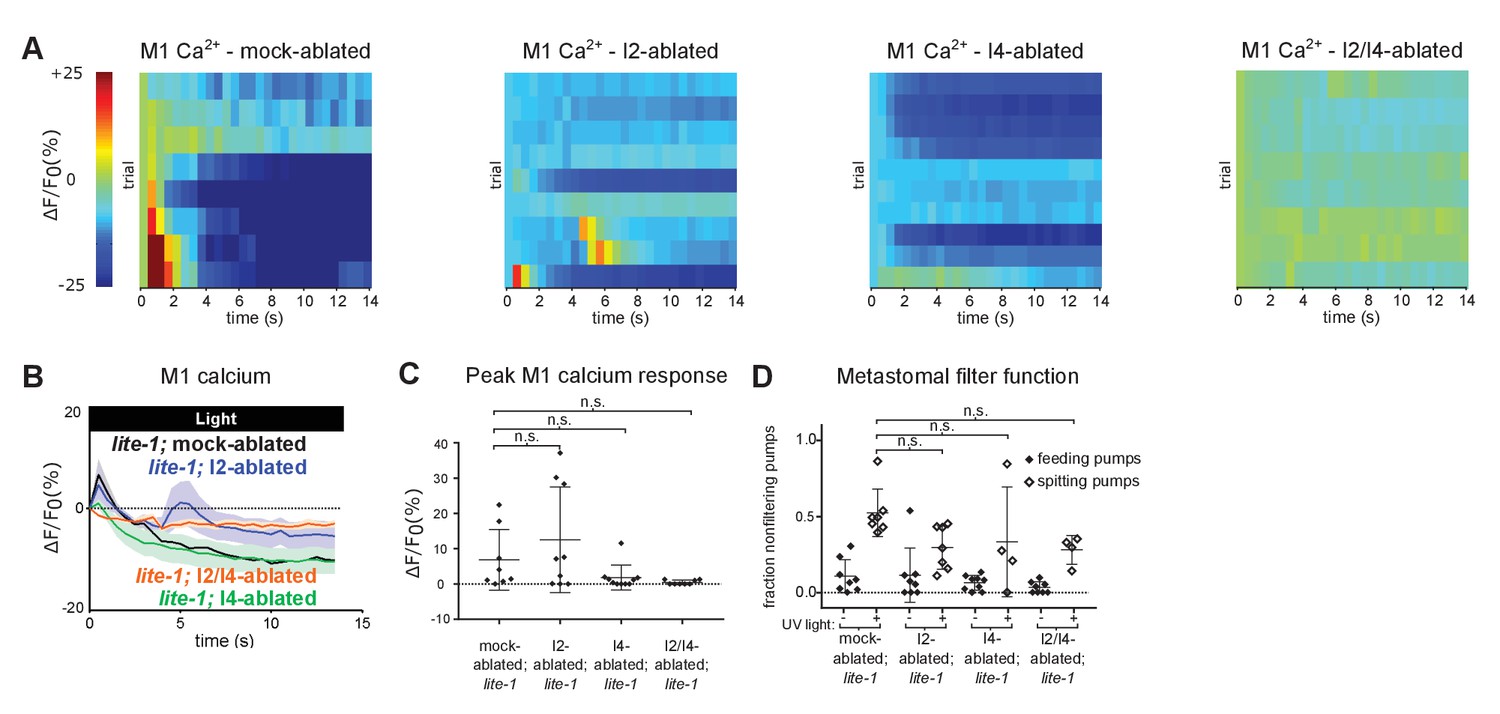
Additional characterization of the effects of ablating the I2 and/or I4 neurons inlite-1mutant animals.
(A) M1 somatic GCaMP responses to light of individual mock-, I2-, I4-, and I2/I4-ablated animals. Each row represents a different animal; ΔF/F0 over time is indicated according to the heatmap at left. I2- and I4-ablated lite-1 animals exhibit small M1 calcium responses; I2/I4 double-ablated animals do not have detectable M1 calcium responses. Animals carried transgene nIs686 (gpa-16p::gcamp3). n ≥ 8 animals. (B) Average GCaMP responses of animals shown in (A). (C) Quantification of (A). Center bar, mean; error bars, SD. n.s., not significant; ordinary one-way ANOVA. (D) Quantification of the frequencies at which the metastomal filter was open in feeding and spitting pumps in (B–E). Center bar, mean; error bars, SD. n.s., not significant; ordinary one-way ANOVA. n ≥ 4 animals.
-
Figure 6—figure supplement 1—source data 1
Source data for Figure 6—figure supplement 1.
- https://cdn.elifesciences.org/articles/59341/elife-59341-fig6-figsupp1-data1-v2.zip
Figure 7

Models of spitting behavior and neural circuitry.
(A) Model for feeding and spitting. During feeding, the M1 neuron is inactive. Thus, the metastomal filter is partially closed, restricting particle influx, and the pharyngeal valve closes at the end of each pump, trapping food. During spitting induced by light or reactive oxygen species (ROS), M1 is active, thus inducing spitting of ingested material by opening the pharyngeal valve and facilitating rinsing of the pharynx by opening the metastomal filter. (B) Model for neural circuitry controlling light- and ROS-induced spitting. Light or ROS stimulate the M1, I2, and I4 neurons via LITE-1 and GUR-3. The I2 and I4 neurons excite M1, which is situated in the ‘waist’ of an ‘hourglass’ circuit motif. In turn, M1 makes diverging outputs to multiple pharyngeal muscle classes, each driving distinct aspects of the spitting reflex: the pm1 and pm2 muscles open the metastomal filter, a subcellular compartment of the pm3 muscles opens the pharyngeal valve, and the remainder of pm3 pumps. The M1 and I2 neurons each also inhibit pumping.
-
Figure 7—source data 1
Source data for Figure 7.
- https://cdn.elifesciences.org/articles/59341/elife-59341-fig7-data1-v2.zip
Videos
Video 1
Feeding pumps in polystyrene bead feeding assay.
High frame rate video of C. elegans feeding in polystyrene bead feeding assay. The small, dark particles are polystyrene beads. During typical feeding pumps, beads accumulate in the buccal cavity. Beads filter gradually from the buccal cavity into the pharyngeal lumen, where they are trapped by the closure of the pharyngeal valve at the front of the pharynx upon the conclusion of each pump. Video was recorded at 1000 frames per second. Playback is at 3% of original speed.
Video 2
Spitting pumps in polystyrene bead feeding assay.
High frame rate video of C. elegans spitting in response to light in polystyrene bead feeding assay. During spitting pumps, beads no longer accumulate in the buccal cavity, but instead freely enter the pharyngeal lumen. At the end of the pump, all material ingested during the pump is expelled. Video was recorded at 1000 frames per second. Playback is at 3% of original speed.
Video 3
Feeding pumps in muscle motion visualization assay.
Video of C. elegans feeding beneath a coverslip. The pharyngeal lumen is visible as a white space when it is opened by the contraction of pharyngeal muscle. In feeding, the musculature of the anterior pharynx relaxes at the end of each pump, closing the pharyngeal valve and thereby trapping ingested material. Animals are slow-moving unc-29(e1072) mutants to facilitate video capture. Video was recorded at 86 frames per second. Playback is at 50% of original speed.
Video 4
Spitting pumps in muscle motion visualization assay.
Video of C. elegans beneath a coverslip spitting in response to light. In contrast to feeding pumps, spitting pumps are characterized by the sustained contraction of the anterior musculature of the pharynx, which remains contracted open as the rest of the pharynx continues to contract and relax. Animals are slow-moving unc-29(e1072) mutants to facilitate video capture. Video was recorded at 86 frames per second. Playback is at 50% of original speed.
Video 5
‘Gulping’ pumps in polystyrene bead feeding assay.
High frame rate video of C. elegans ‘gulping’ in polystyrene bead feeding assay.
As in spitting pumps, beads pass freely through the buccal cavity and into the pharyngeal lumen. As in feeding pumps, this material is subsequently trapped and retained by the pharyngeal valve, resulting in ingestion. Video was recorded at 1000 frames per second. Playback is at 3% of original speed.
Video 6
pm2-ablated animals are defective in opening the metastomal filter during spitting behavior in polystyrene bead feeding assay.
High frame rate video of pm2-ablated C. elegans spitting in response to light in polystyrene bead feeding assay. In contrast to typical spitting pumps, beads accumulate in the buccal cavity, indicating that the metastomal filter is partially closed. At the end of the pump, ingested material is still expelled, indicating that the pharyngeal valve is open. Animals carried transgene nIs507 [inx-4promoter::gfp; lin-15(+)], which was used to mark the pm1 muscle for ablation. Video was recorded at 1000 frames per second. Playback is at 3% of original speed.
Video 7
A subset of pm1-ablated animals spit less efficiently.
High frame rate video of pm1-ablated C. elegans spitting in response to light in polystyrene bead feeding assay. At the end of the pump, ingested material is expelled, indicating that the pharyngeal valve is open, but material already held in procorpus is ejected less efficiently in comparison to mock-ablated animals. Animals carried transgene nIs507 [inx-4promoter::gfp; lin-15(+)], which was used to mark the pm1 muscle for ablation. Video was recorded at 1000 frames per second. Playback is at 3% of original speed.
Video 8
A subset of pm1-ablated animals exhibit normal spitting behavior.
High frame rate video of pm1-ablated C. elegans spitting in response to light in polystyrene bead feeding assay. Spitting behavior is comparable to that of mock-ablated animals. Animals carried transgene nIs507 [inx-4promoter::gfp; lin-15(+)], which was used to mark the pm1 muscle for ablation. Video was recorded at 1000 frames per second. Playback is at 3% of original speed.
Video 9
pm1/pm2 double-ablated animals can hold open the pharyngeal valve and spit.
High frame rate video of pm1/pm2 double-ablated C. elegans spitting in response to light in polystyrene bead feeding assay. At the end of the pump, the material ingested during the pump is spat out, indicating that the pharyngeal valve is open and that animals lacking both pm1 and the pm2s can spit. Animals carried transgene nIs507 [inx-4promoter::gfp; lin-15(+)], which was used to mark the pm1 muscle for ablation. Video was recorded at 1000 frames per second. Playback is at 3% of original speed.
Video 10
Light induces immobilized animals to spit.
Video of immobilized C. elegans spitting in response to 2 Hz flickered 365/485 nm light (i.e. the same as delivered to animals during calcium imaging). Animal was selected based on its ingestion of mineral oil into the anterior pharynx. Oil is visible as dark liquid that is ejected from the anterior pharynx over the course of several pumps. Animals carried the calcium-imaging transgene nIs686 [gpa-16p::gcamp3; lin-15(+)]. Video was recorded at 50 frames per second. Playback is at 100% of original speed.
Video 11
Pharyngeal muscle calcium response to light (gpa-16p::gcamp3 transgene).
The pharyngeal muscle calcium response to light, as reported by fluorescence of GCaMP3 transgene nIs686 (gpa-16p::gcamp3), which is expressed in the pm2 and pm3 pharyngeal muscles, the mc1 marginal cells, and occasionally/dimly in the pm1 pharyngeal muscle. Pumps result in fluorescence increases across the entirety of the anterior pharynx. Before and between pumps, localized and sustained calcium increases occur at the anterior tip of the pharynx. Animals carried the calcium-imaging transgene nIs686 [gpa-16p::gcamp3; lin-15(+)]. Video was recorded at 15 frames per second and false-colored based on the intensity of fluorescence changes (blue, low intensity; red, high intensity). Playback is at 100% of original speed.
Video 12
Sustained, anteriorly localized calcium signals do not occur when animals are induced to pump using serotonin.
Animals carrying the muscle-GCaMP transgene nIs686 [gpa-16p::gcamp3; lin-15(+)] were immobilized in the presence of 10 mM serotonin and filmed at the onset of pumping. Video was recorded at four frames per second and false-colored based on the intensity of fluorescence changes (blue, low intensity; red, high intensity). Playback is at 100% of original speed.
Video 13
Pharyngeal muscle calcium response to light (myo-2p::gcamp3 transgene).
The pharyngeal muscle calcium response to light as reported by fluorescence of GCaMP3 transgene cuIs36 (myo-2p::gcamp3), which is expressed specifically in the pm3s but not the pm2s and pm1. Localized and sustained calcium increases occur at the anterior tip of the pharynx. Video was recorded at two frames per second and false-colored based on the intensity of fluorescence changes (blue, low intensity; red, high intensity). Playback is at 100% of original speed.
Video 14
Pharyngeal muscle calcium response to light (C32F10.8p::gcamp3 transgene).
The pharyngeal muscle calcium response to light, as reported by fluorescence of GCaMP3 transgene nEx3045 [C32F10.8p::gcamp3; lin-15(+)], which is expressed specifically in the pm3 pharyngeal muscles and mc1 marginal cells. Localized and sustained calcium increases occur at the anterior tip of the pharynx. Video was recorded at two frames per second and false-colored based on the intensity of fluorescence changes (blue, low intensity; red, high intensity). Playback is at 100% of original speed.
Video 15
The pharyngeal neuron M1 is activated by light (glr-2p::gcamp6s transgene).
The pharyngeal neuron M1 is acutely activated by light, as reported by fluorescence of GCaMP6s calcium imaging transgene nIs678 [glr-2p::gcamp6s; lin-15(+)]. Video was recorded at two frames per second and false-colored based on the intensity of fluorescence changes (blue, low intensity; red, high intensity). Playback is at 100% of original speed.
Tables
Appendix 1—key resources table
| Reagent type (species) or resource | Designation | Source or reference | Identifiers | Additional information |
|---|---|---|---|---|
| Strain, strain background (Caenorhabditis elegans) | N2 (wild type) | Horvitz lab collection | WBStrain00000001 | Laboratory reference strain Figure 1B–G; Figure 1—figure supplement 1A; Figure 2—figure supplement 1C and D; Figures 3A, G and H; Videos 1, 2 and 5 |
| Strain, strain background (C. elegans) | CB1072 | Horvitz lab collection | WBStrain00004240 | unc-29(e1072) Figure 1—figure supplement 1B and C; Videos 3 and 4 |
| Strain, strain background (C. elegans) | MT26279 | this study | n/a | lin-15(n765ts); nIs507 [inx-4promoter::gfp; lin-15(+)] 8x outcrossed to MT8189 Figure 2B–E; Figure 2—figure supplement 1A and B; Videos 6, 7 and 8, and 9 |
| Strain, strain background (C. elegans) | MT8189 | Horvitz lab collection | WBStrain00027314 | lin-15(n765ts) Used to outcross MT26279, MT23338, and MT24110 |
| Strain, strain background (C. elegans) | MT23338 | this study | n/a | nIs686 [gpa-16promoter::gcamp3::unc-54 3’ UTR; lin-15(+)] III; lin-15AB(n765ts) 5x outcrossed to MT8189 Figure 2H–J; Figure 2—figure supplement 1C, D and H; Figure 3I–N; Figure 4F and G, Videos 10 and 11 |
| Strain, strain background (C. elegans) | MT26375 | this study | n/a | lin-15AB(n765ts); nEx3045 [C32F10.8p::GCaMP3; lin-15(+)] Figure 2—figure supplement 1C, D and G; Figure 2—figure supplement 1D; Figure 2M and N; Video 14 |
| Strain, strain background (C. elegans) | MT25732 | this study | n/a | lin-15(n765ts); nIs864; nEx2905 [lury-1promoter::ice::sl2::mcherry::unc-54 3’ UTR; ttx-3promoter::mcherry] Figure 1—figure supplement 1D; Figure 4D and E; Figure 4—figure supplement 1B, G and H |
| Strain, strain background (C. elegans) | OK1020 | Kozlova et al., 2019 | n/a | cuIs36 X Figure 2—figure supplement 1D; Figure 2K and L; Video 13 |
| Strain, strain background (C. elegans) | MT23370 | this study | n/a | nIs686 III; lite-1(ce314) gur-3(ok2245) lin-15(n765ts) Figure 2—figure supplement 1E; Figure 3I and L–N; Video 12 |
| Strain, strain background (C. elegans) | VK1241 | CGC | WBStrain00040040 | vkEx1241 [nhx-2p::mCherry::lgg-1 + myo-2p::gfp] Figure 2—figure supplement 1F |
| Strain, strain background (C. elegans) | MT26333 | CGC (not outcrossed); this study (outcrossed) | WBStrain00002254 (not outcrossed); n/a (outcrossed) | sIs11111 [rCesC32F10.8::gfp + pCeh361] 8x outcrossed to N2 Figure 2—figure supplement 2C |
| Strain, strain background (C. elegans) | MT2249 | Horvitz laboratory collection | n/a | egl-47(n1082dm) Figure 3—figure supplement 1A |
| Strain, strain background (C. elegans) | RB850 | CGC | WBStrain00031563 | egl-47(ok677) Figure 3—figure supplement 1B |
| Strain, strain background (C. elegans) | MT21783 | Bhatla and Horvitz, 2015 | n/a | gur-3(ok2245) Figure 3—figure supplement 1C; Figure 3B and G and H |
| Strain, strain background (C. elegans) | RB845 | CGC | WBStrain00031558 | gur-4(ok672) Figure 3—figure supplement 1D |
| Strain, strain background (C. elegans) | FX06169 | Dr. S. Mitani/NBRP | WBVar01474061 (tm6169) | gur-5(tm6169) Figure 3—figure supplement 1E |
| Strain, strain background (C. elegans) | KG1180 | CGC | WBStrain00023485 | lite-1(ce314) 5x outcrossed Figure 3—figure supplement 1F; Figures 3C, G and H; Figure 5A and C; Figure 6J-O |
| Strain, strain background (C. elegans) | MT21793 | Bhatla and Horvitz, 2015 | WBStrain00027622 | lite-1(ce314) gur-3(ok2245) Figure 3—figure supplement 1G; Figure 3D and G and H |
| Strain, strain background (C. elegans) | DA1113 | CGC | WBStrain00005547 | eat-2(ad1113) 2x outcrossed Figure 3—figure supplement 1H and L |
| Strain, strain background (C. elegans) | MT25982 | this study | n/a | eat-2(ad1113); gur-3(ok2245) Figure 3—figure supplement 1H and L |
| Strain, strain background (C. elegans) | MT22899 | this study | n/a | eat-2(ad1113); lite-1(ce314) Figure 3—figure supplement 1I and L |
| Strain, strain background (C. elegans) | MT25983 | this study | n/a | eat-2(ad1113); lite-1(ce314) gur-3(ok2245) Figure 3—figure supplement 1J–1L |
| Strain, strain background (C. elegans) | MT25999 | this study | n/a | eat-2(ad1113); lite-1(ce314) gur-3(ok2245); nIs687 [lite-1promoter::gfp::lite-1; lin-15(+)] nIs687 was outcrossed 8x to MT22499 Figure 3—figure supplement 1K and L |
| Strain, strain background (C. elegans) | MT22499 | this study | n/a | lite-1(ce314) gur-3(ok2245) lin-15AB(n765ts) Used to outcross MT25999 |
| Strain, strain background (C. elegans) | MT25809 | this study | n/a | lite-1(ce314) gur-3(ok2245) lin-15(n765ts); nEx2281 [lite-1promoter::lite-1(+)::gfp; lin-15(+)] Figure 3E and Gand H |
| Strain, strain background (C. elegans) | MT25810 | this study | n/a | lite-1(ce314) gur-3(ok2245) lin-15(n765ts); nEx2157 [gur-3 gDNA; lin-15(+)] Figure 3F-H |
| Strain, strain background (C. elegans) | MT23415 | this study | n/a | nIs686 III; gur-3(ok2245) lin-15(n765ts) Figure 3I, J and M, N |
| Strain, strain background (C. elegans) | MT23417 | this study | n/a | nIs686 III; lite-1(ce314) lin-15(n765ts) Figure 3I, K and M, N |
| Strain, strain background (C. elegans) | MT25631 | this study | n/a | lin-15(n765ts); nIs864 [glr-2promoter::gfp::unc-54 3’ UTR; lin-15(+)] 6x outcrossed Figure 2—figure supplement 1D; Figure 4B and C;Figure 4—figure supplement 1E and F |
| Strain, strain background (C. elegans) | MT25804 | this study | n/a | oxIs322 [myo-2promoter::mcherry::h2b; myo-3promoter::mcherry::h2b] II; nIs310 [nlp-13promoter::gfp] V; nEx2905 Figure 4—figure supplement 1A and C |
| Strain, strain background (C. elegans) | MT25950 | this study | n/a | eat-2(ad1113); nIs865 (integrated transgene derived from nEx2905 [lury-1promoter::ice::sl2::mcherry::unc-54 3’ UTR; ttx-3promoter::mcherry]; outcrossed 8x to N2) Figure 4—figure supplement 1D |
| Strain, strain background (C. elegans) | MT25823 | this study | n/a | lin-15AB(n765ts); nEx2917 [glr-2promoter::hiscl::SL2::mcherry::unc-54 3’ UTR; lin-15(+)] Figure 4H-L |
| Strain, strain background (C. elegans) | MT23192 | this study | n/a | lin-15(n765ts); nIs678 [glr-2promoter::gcamp6s::unc-54 3’ UTR; lin-15(+)] 5x outcrossed. Figure 4M–U, Figure 4—figure supplement 1W; Video 15 |
| Strain, strain background (C. elegans) | MT24110 | this study | n/a | lin-15(n765ts); nIs780 [gur-3promoter::gfp; lin-15(+)] 7x outcrossed to MT8189 Figure 3—figure supplement 1M and N |
| Strain, strain background (C. elegans) | MT23250 | this study | n/a | gur-3(ok2245) lin-15(n765ts); nIs678 Figures 4P, Q, T and U |
| Strain, strain background (C. elegans) | MT23230 | this study | n/a | lite-1(ce314) lin-15(n765ts); nIs678 Figures 4P, R, T and U; Figure 6D–I; Figure 6—figure supplement 1B–D |
| Strain, strain background (C. elegans) | MT23369 | this study | n/a | lite-1(ce314) gur-3(ok2245) lin-15(n765ts); nIs678 Figures 4T and U; Figure 5D and E |
| Strain, strain background (C. elegans) | MT23343 | this study | n/a | unc-13(s69); lin-15(n765ts); nIs678 Figure 4—figure supplement 1I and J |
| Strain, strain background (C. elegans) | MT23410 | this study | n/a | unc-31(u280); lin-15(n765ts); nIs678 Figure 4—figure supplement 1K and L |
| Strain, strain background (C. elegans) | MT25468 | this study | n/a | lite-1(ce314) gur-3(ok2245) lin-15(n765ts); nEx2815 [lury-1promoter::chr2::sl2::mcherry::unc-54 3' UTR] Figure 4V and W |
| Strain, strain background (C. elegans) | CB933 | Horvitz laboratory collection | WBStrain00004216 | unc-17(e245) Figure 4—figure supplement 1M |
| Strain, strain background (C. elegans) | PR1152 | Horvitz laboratory collection | WBStrain00030801 | cha-1(p1152) Figure 4—figure supplement 1N |
| Strain, strain background (C. elegans) | RM509 | CGC | WBStrain00033372 | ric-3(md158) Figure 4—figure supplement 1O |
| Strain, strain background (C. elegans) | CB156 | Brenner, 1974; Takayanagi-Kiya and Jin, 2016 | WBStrain00004114 | unc-25(e156) dnj-17(ju1162) Figure 4—figure supplement 1P |
| Strain, strain background (C. elegans) | MT6308 | CGC | WBStrain00027259 | eat-4(ky5) Figure 4—figure supplement 1Q |
| Strain, strain background (C. elegans) | CB1112 | Horvitz laboratory collection | WBStrain00004246 | cat-2(e1112) Figure 4—figure supplement 1R |
| Strain, strain background (C. elegans) | MT10661 | Horvitz laboratory collection | WBStrain00027379 | tdc-1(n3420) Figure 4—figure supplement 1S |
| Strain, strain background (C. elegans) | MT14984 | Horvitz laboratory collection | WBStrain00027500 | tph-1(n4622) Figure 4—figure supplement 1T |
| Strain, strain background (C. elegans) | MT15434 | Horvitz laboratory collection | WBStrain00027519 | tph-1(mg280) Figure 4—figure supplement 1U |
| Strain, strain background (C. elegans) | MT22280 | Horvitz laboratory collection | MT22280 | ser-4(ok512); mod-1(ok103); ser-1(ok345) ser-7(tm1325) Figure 4—figure supplement 1V |
| Strain, strain background (C. elegans) | MT23606 | this study | n/a | lite-1(ce314) gur-3(ok2245) lin-15AB(n765ts); nEx2144 [flp-15promoter::mcherry::gur-3, lin-15(+)] Figure 5B and C |
| Strain, strain background (C. elegans) | MT23545 | this study | n/a | lite-1(ce314) gur-3(ok2245) lin-15AB(n765ts); nIs678; nEx2144 Figure 5D-H |
| Strain, strain background (C. elegans) | MT26001 | this study | n/a | eat-2(ad1113); lite-1(ce314) gur-3(ok2245) nIs791 X (integrated transgene derived from [nEx2144: flp-15promoter::mcherry::gur-3, lin-15(+)]) Figure 5I |
| Strain, strain background (C. elegans) | MT21421 | Bhatla and Horvitz, 2015 | WBStrain00044110 | nIs569 [flp-15promoter::csp-1b; ges-1promoter::gfp] Figure 6A |
| Strain, strain background (C. elegans) | MT21791 | Bhatla and Horvitz, 2015 | n/a | lite-1(ce314) nIs569 Figure 6B |
Additional files
-
Source data 1
Sequences for plasmids generated in this study.
- https://cdn.elifesciences.org/articles/59341/elife-59341-data1-v2.gb.zip
-
Source code 1
Matlab scripts.
- https://cdn.elifesciences.org/articles/59341/elife-59341-code1-v2.zip
-
Transparent reporting form
- https://cdn.elifesciences.org/articles/59341/elife-59341-transrepform-v2.pdf
Download links
A two-part list of links to download the article, or parts of the article, in various formats.
Downloads (link to download the article as PDF)
Open citations (links to open the citations from this article in various online reference manager services)
Cite this article (links to download the citations from this article in formats compatible with various reference manager tools)
An hourglass circuit motif transforms a motor program via subcellularly localized muscle calcium signaling and contraction
eLife 10:e59341.
https://doi.org/10.7554/eLife.59341


