Cell-state transitions and collective cell movement generate an endoderm-like region in gastruloids
- Aix-Marseille University, CNRS, UMR 7288, IBDM, Turing Center for Living Systems, France
- Novo Nordisk Foundation Center for Stem Cell Biology (DanStem), University of Copenhagen, Denmark
- Novo Nordisk Foundation Center for Stem Cell Medicine (reNEW), University of Copenhagen, Denmark
- Department of Genetics, University of Cambridge, United Kingdom
- Systems Bioengineering, DCEXS , Universidad Pompeu Fabra, ICREA, Spain
Figures
Figure 1 with 1 supplement
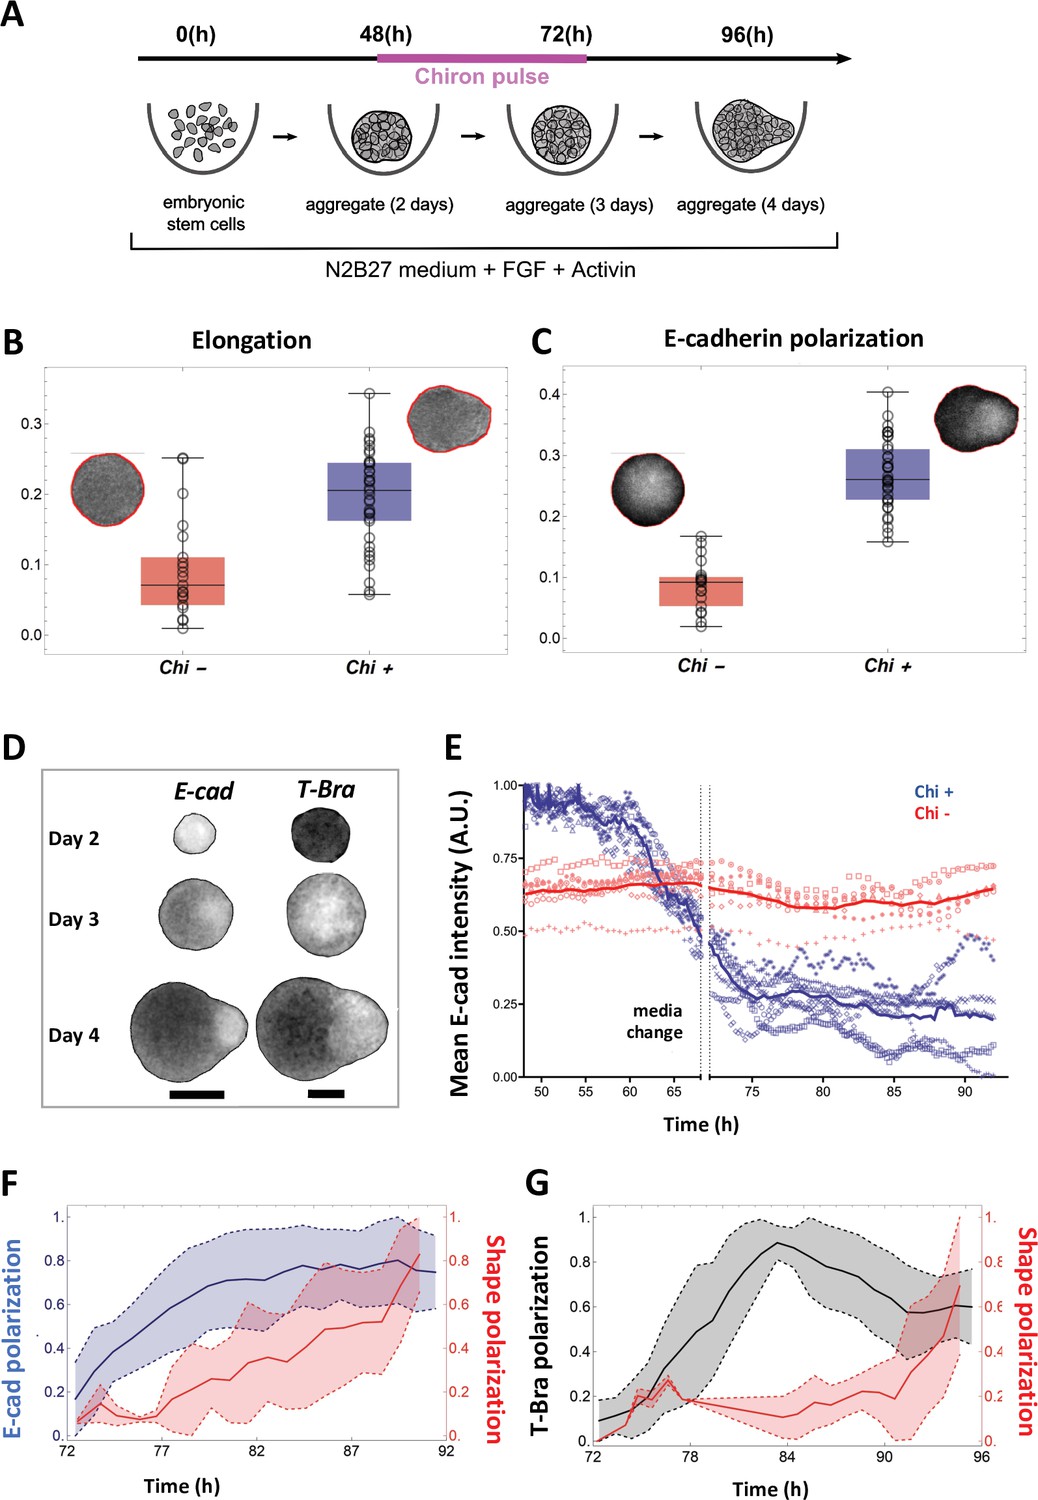
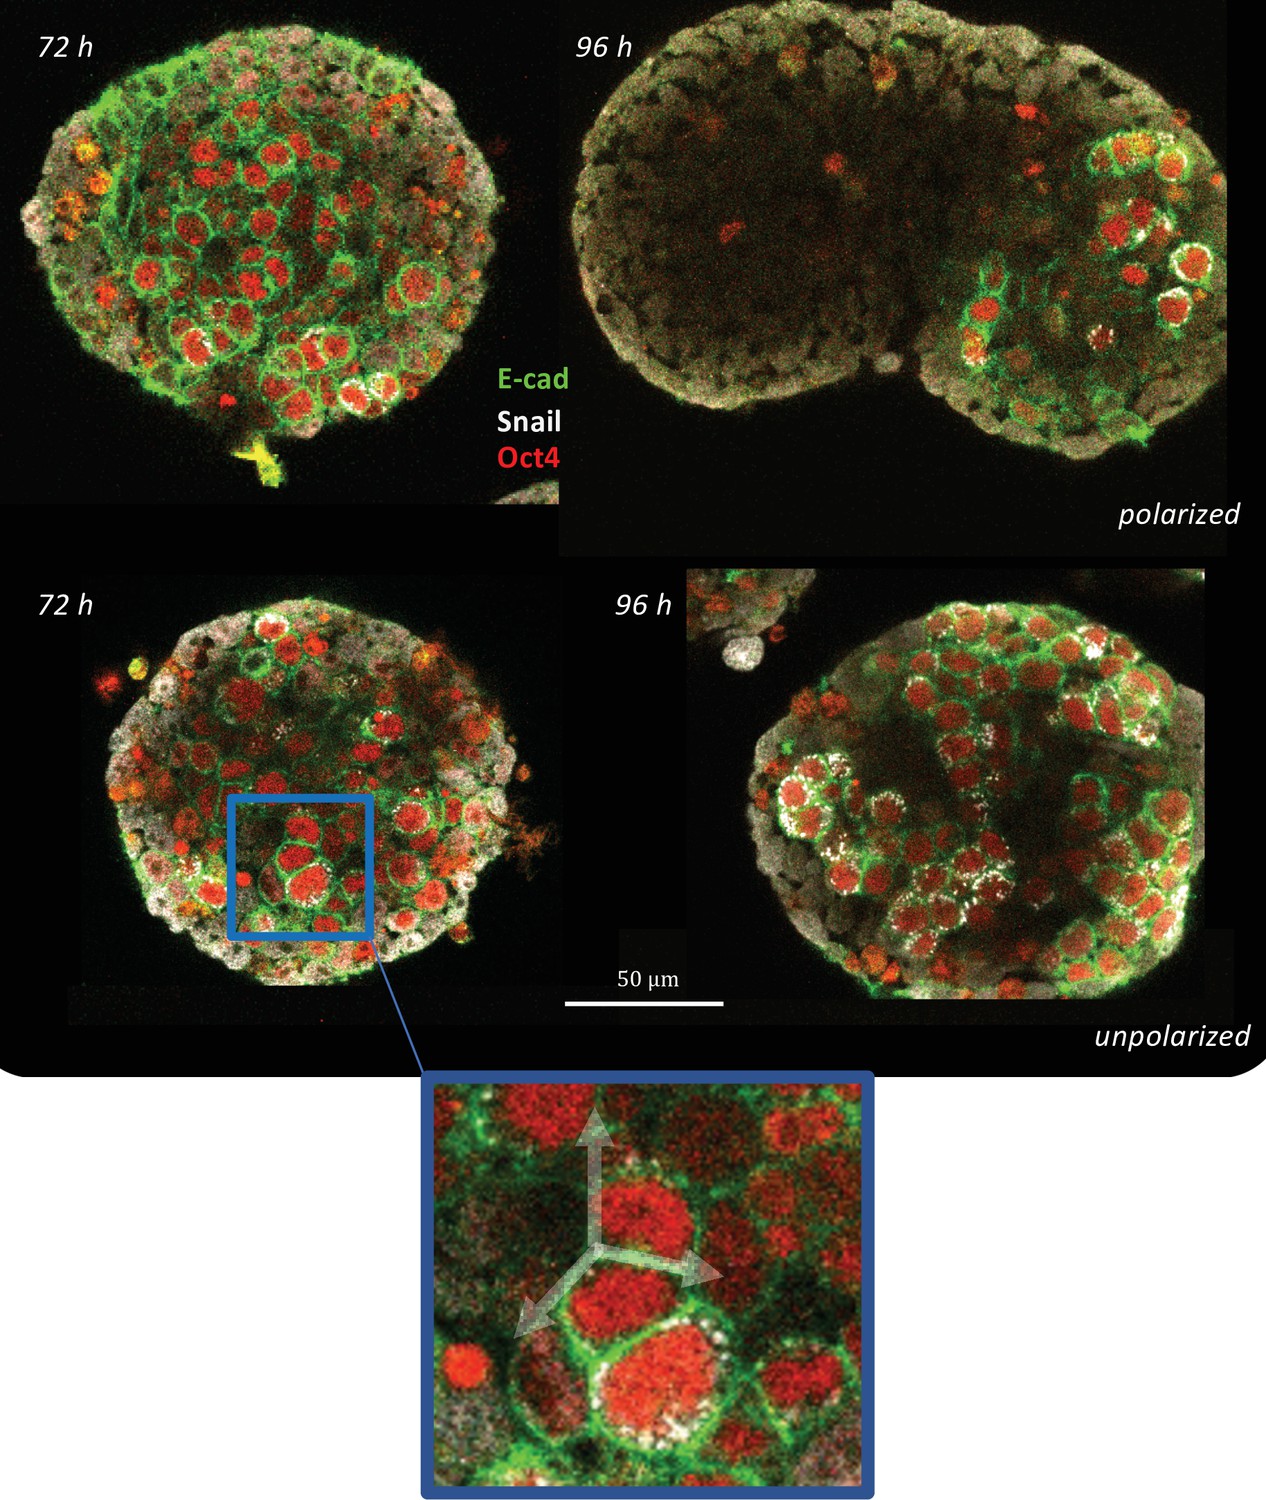
Signal and shape polarization of gastruloids.
(A) Schematic of the experimental protocol; mESCs seeded onto a low-adherence substrate form aggregates that are exposed to N2B27 medium, FGF and Act throughout the experiment. In addition, a pulse of Chi is provided for 24 hr - starting at 48 hr-post plating. (B) The box-whisker plot shows the distribution of elongation for Chi + (n = 37) and the control (Chi -) aggregates (n = 20) (Mann-Whitney test with correction, p-value = 3 x 10⁻⁵, N = 2 replicates). The insets delineate the contours of the two classes of aggregates. (C) Box-whisker plot showing the distribution of E-cad polarization in the Chi + (n = 37) and Chi - aggregates (n = 20). The polarization of the signal is defined by the maximum contrast between the two halves of the aggregate (Mann-Whitney test with correction, p = 7 x 10⁻¹⁰, N = 2 replicates). The insets display E-cad intensity within the aggregates. (D) Snapshots of aggregates (first column composed of E-cad-GFP/Oct4-mCherry and the second column composed of T-Bra-GFP/NE-mKate2 and E14Tg2a.4) exposed to Chi pulse at different developmental stages (scale bars for the columns represent 100 µm). The T-Bra-GFP/NE-mKate2 aggregate was generated from ~200 cells. (E) Temporal changes in the mean E-cad intensity profile between 48 and 92 hr for aggregates (Ecad-GFP/Oct4-mCherry) exposed to Chi (n = 7 aggregates, N = 3 replicates) and the control (n = 7 aggregates, N = 1 replicate). (F) The plot illustrates the polarization of E-cad (n = 14 aggregates, N = 3 replicates) with respect to the deformation of the aggregates between 72 and 92 hr; the thick and the dashed lines represent the mean and the mean ± SD, respectively. (G) T-Bra polarization (n = 11 aggregates) with respect to the aggregate deformation between 72 and 96 hr; the thick and the dashed lines represent the mean and the mean ± SD, respectively.
Figure 1—figure supplement 1
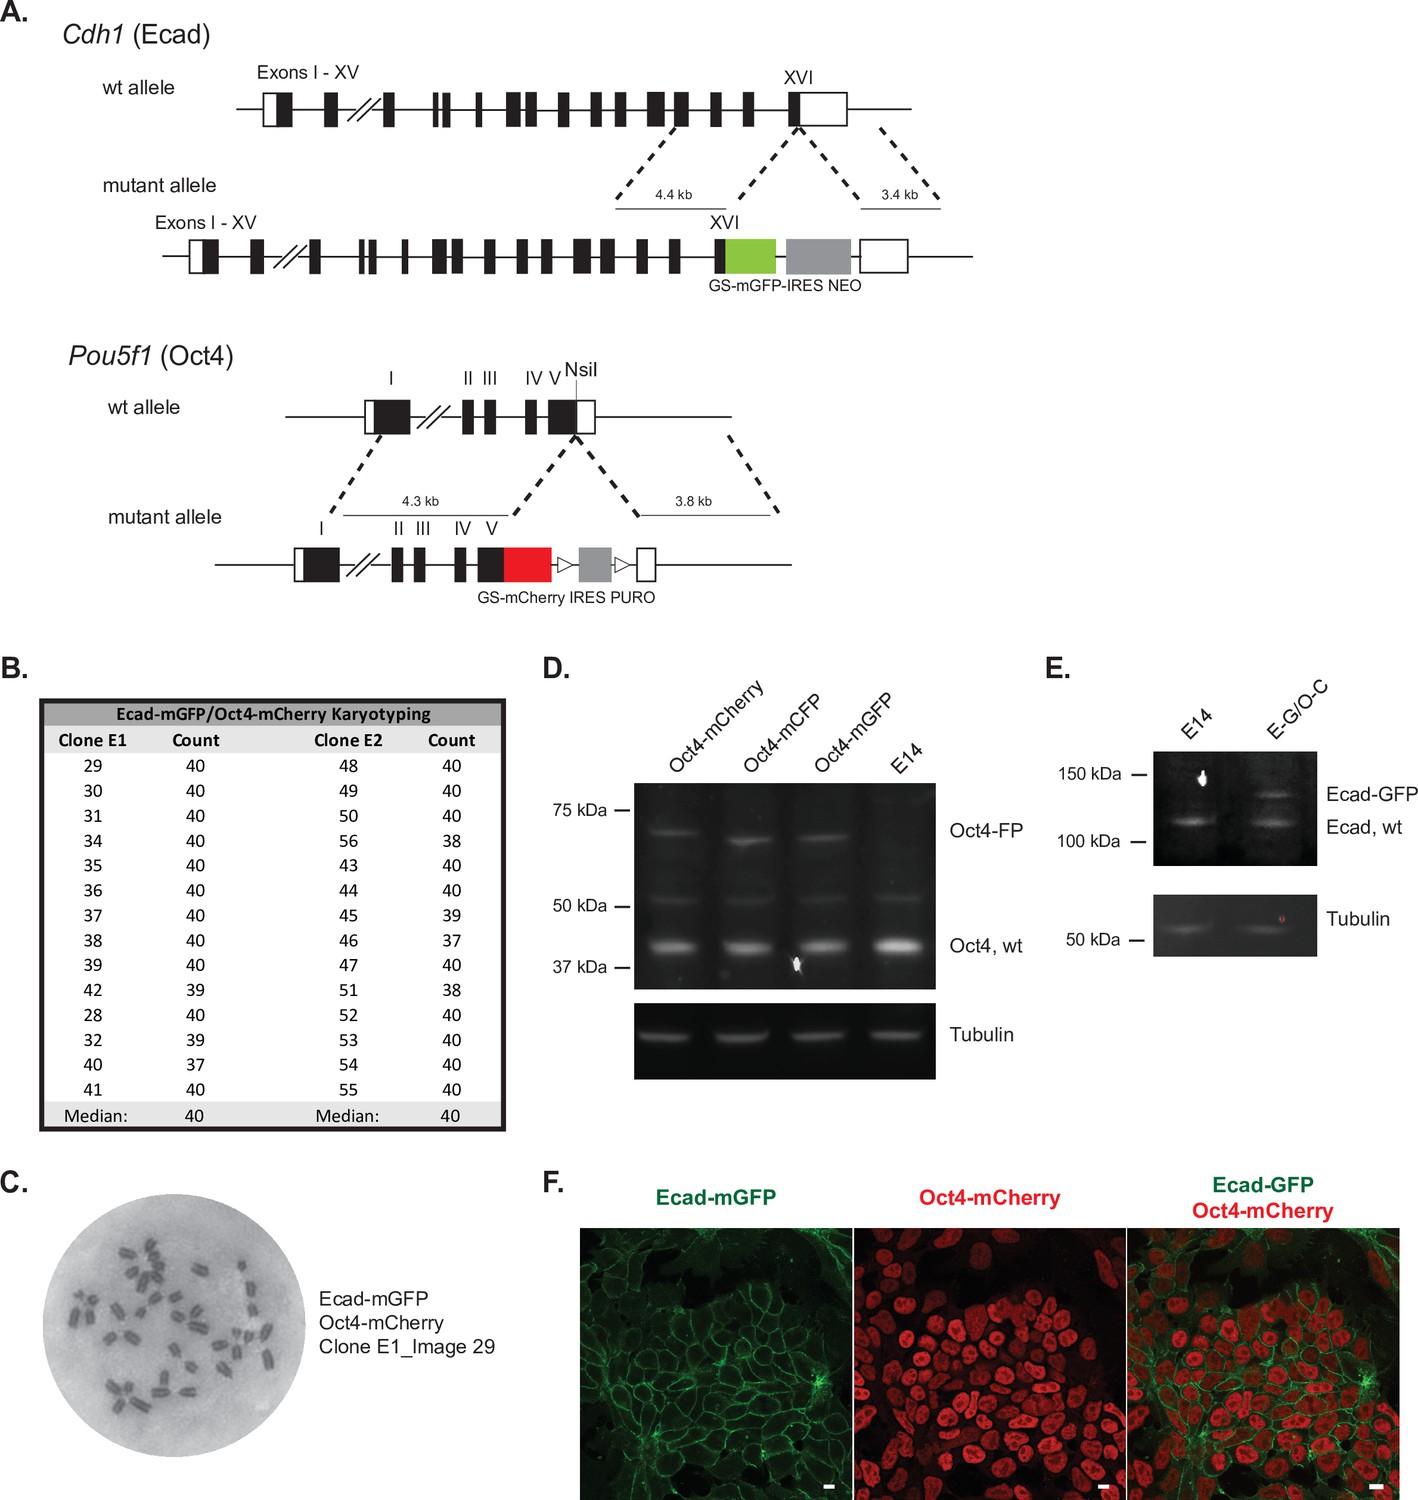
Ecad-mGFP/Oct4-mCherry ESC line validation.
(A) Targeting strategy for the generation of endogenously tagged fusion protein reporter lines by adding fluorecent proteins mGFP or mCherry to the C-terminus of Ecadherin (Cdh1) or Oct4 (Pou5f1), repectively. (B) Karyotype analysis of two Ecad-GFP/Oct4-mCherry clones, both with the expected number of chromosomes (40). (C) Representative image of the chromatin spread for karyotype analysis. (D) Western blot analysis of heterozygous reporter lines with one wildtype and one targeted Oct4 allele with a fluorecent protein (FP) tag (mCherry, mCFP or mGFP), compared to the E14 parental control. Oct4 staining shows the wildtype protein at the expected molecular weight (~38 kDa) and the fusion proteins at higher molecular weights, corresponding to the addition of the 37 kDa tags. Tubulin staining is shown as a loading control. (E) Western blot analysis of the heterozygous dual reporter Ecad-GFP/Oct4-mCherry line (E-G/O-C) compared to the E14 parental control. E-cadherin staining shows the wildtype protein at the expected molecular weight (~135 kDa) and the fusion protein (Ecad-GFP) at a higher molecular weight, with the addition of the 37 kDa GFP tag. Tubulin is shown as a loading control. (F) Confocal max projection images showing fusion reporter expression for Ecad-mGFP and Oct4-mCherry. Scale bar = 10 μm.
Figure 2 with 2 supplements
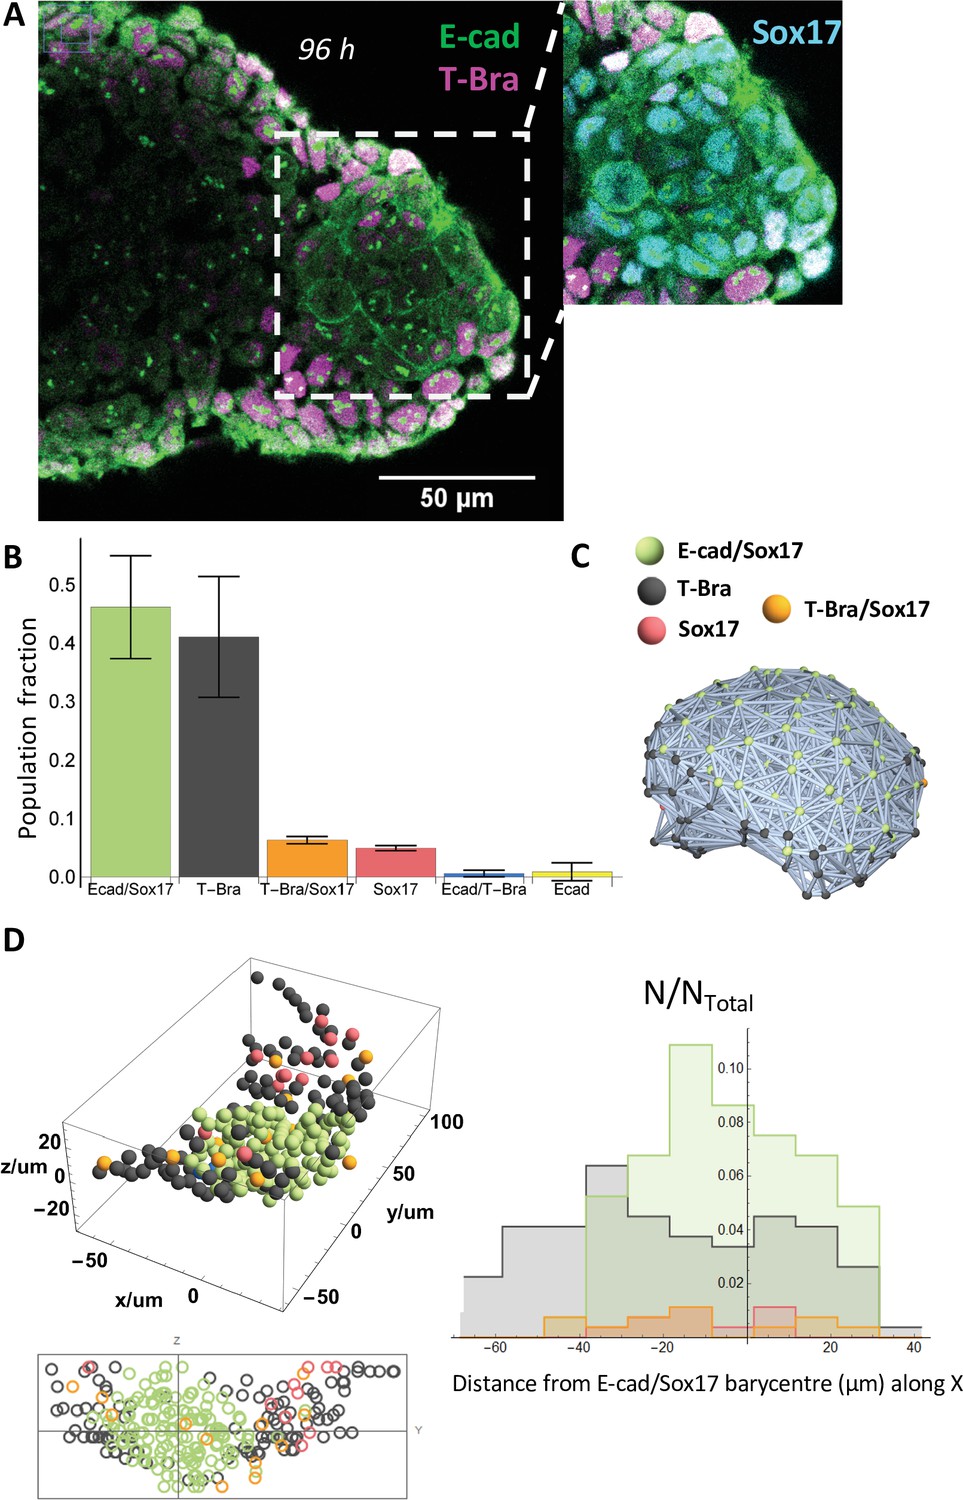
An endoderm-like tissue at the tip of the gastruloid.
(A) aggregate stained at 96 hrs-pp for E-cad and T-Bra; the inset shows the endoderm-like cells at the tip expressing both E-cad and Sox17, surrounded by T-Bra+ cells. (B) the bar chart delineates the population fraction of the different cell populations present near the tip (n = 3 aggregates: 268, 179, and 150 cells, N = 2 replicates) with the error bars indicating the SD. (C) Spatial connectivity graph (Delaunay Mesh) of the different cell populations in an aggregate fixed at 96 hr-pp (D) Spatial distribution of the different cell types near the tip of a representative aggregate (stained at 96 hr-pp), its projection and the respective population fractions as a function of the distance from the tip of the aggregate.
Figure 2—figure supplement 1
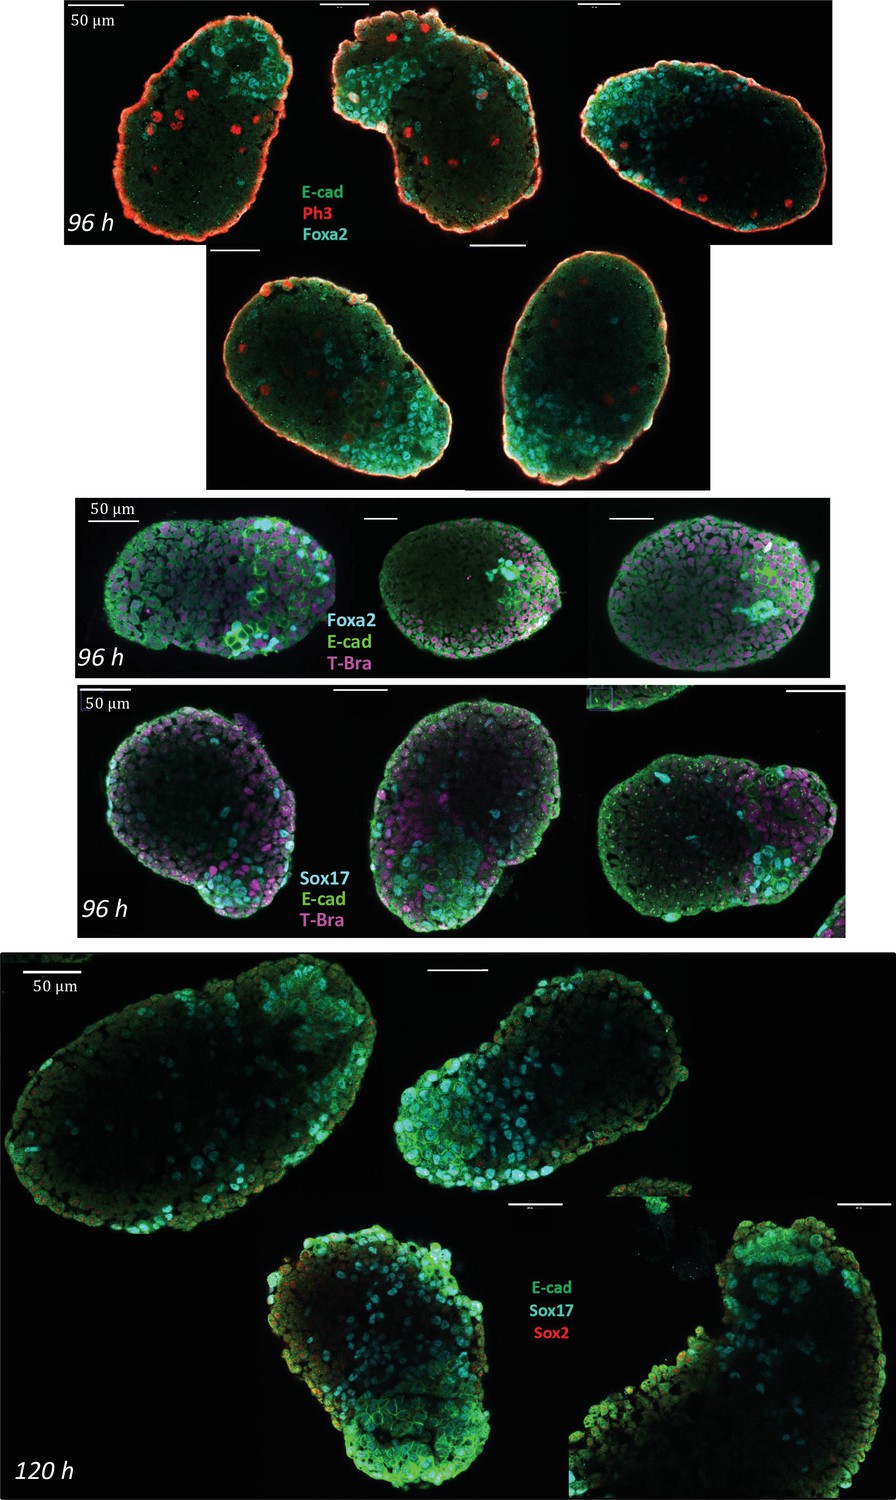
Characterization of the endoderm-like region in aggregates at 96 and 120 hrs-pp.
Immunostaining for E-cadherin, Sox17, Foxa2, Ph3, and Sox 2 in aggregates. At 96 hrs-pp, islands of E-cad+ cells express Foxa2 and Sox17. At 120 hr-pp (bottom images), E-cad+ cells are found to still express high levels of Sox17. Sox2 being an early marker of the endoderm is absent at this stage. E-cad/Ph3/Foxa2: n = 5 aggregates, N = 2 replicates; Foxa2/E-cad/T-Bra: n = 3, N = 2 replicates; Sox17/E-cad/T-Bra: n = 13 aggregates, N = 2 replicates; E-cad/Sox17/Sox 2: n = 5 aggregates, N = 1 replicate.
Figure 2—figure supplement 2
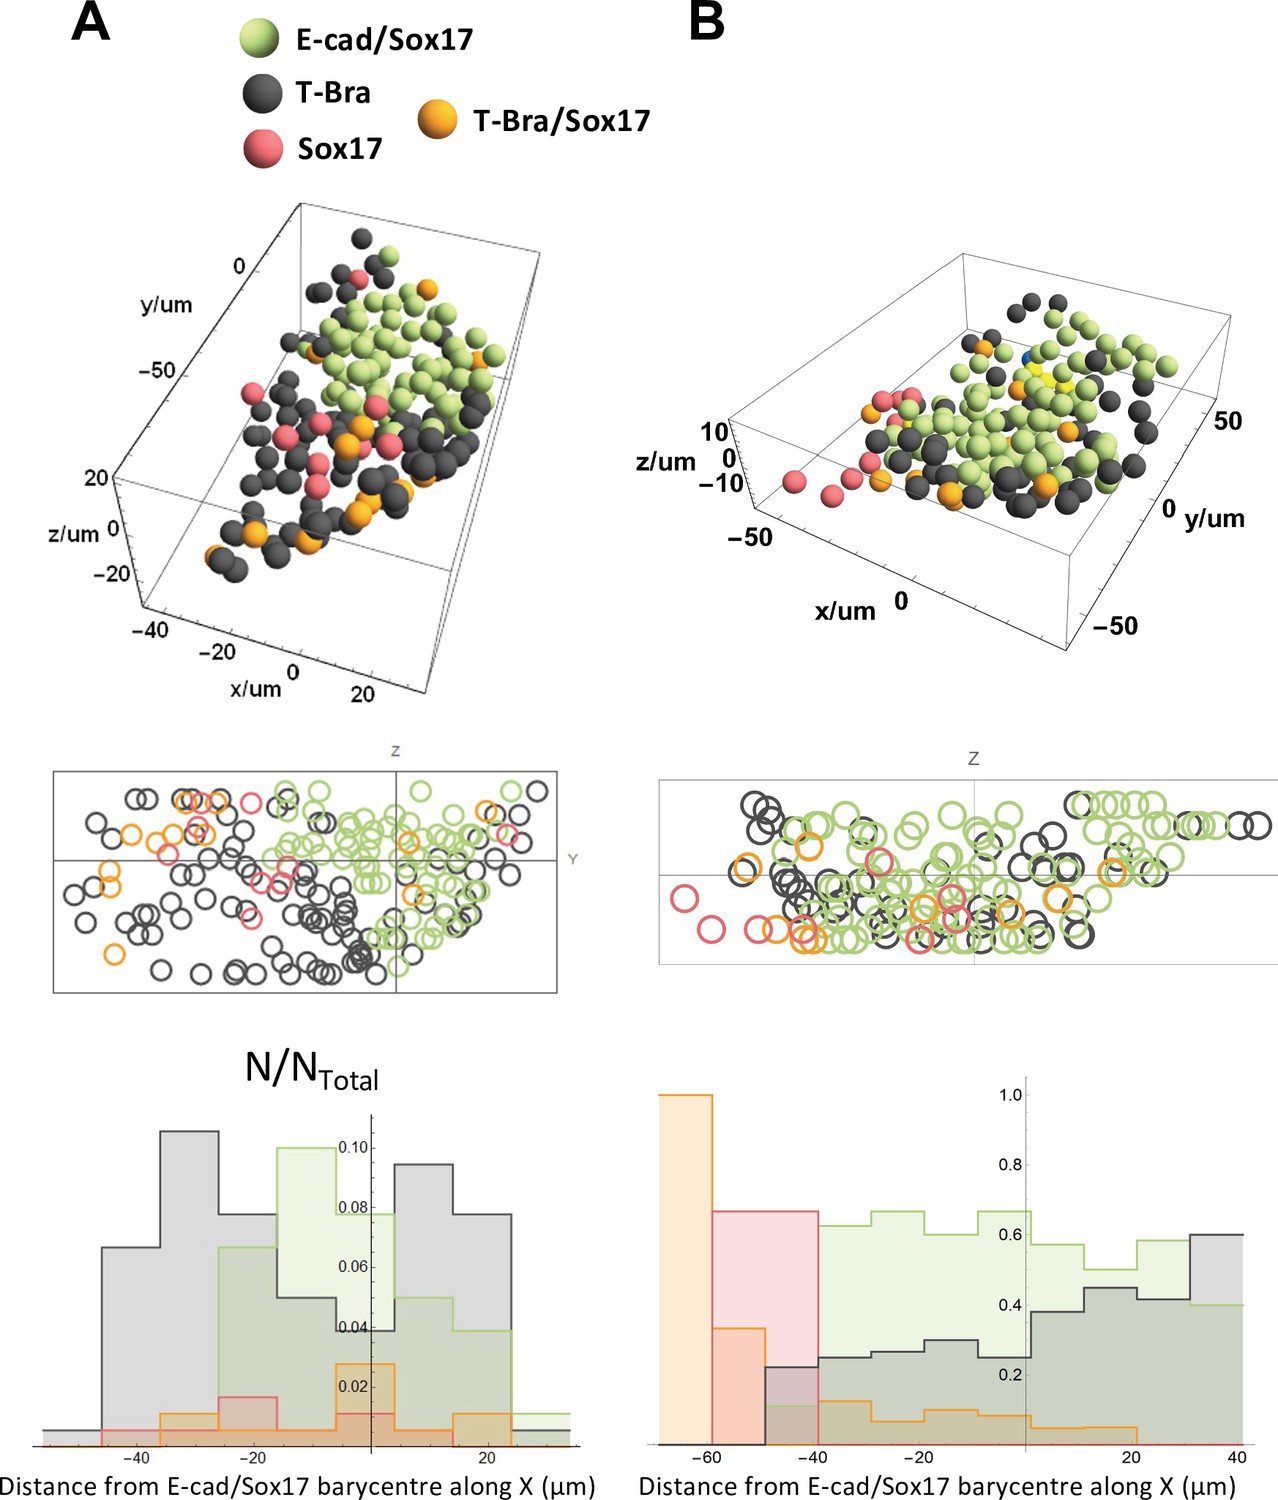
Spatial distribution of the different cell types near the tip.
Spatial distribution of E-cad/Sox17, T-Bra, Sox17, T-Bra/Sox17 expressing cells near the tip in two representative aggregates (stained at 96 hrs-pp), their projection and their respective population fractions as a function of the distance from the tip.
Figure 3 with 2 supplements

The endoderm-like region originates from islands of pluripotent and epithelial cells expressing E-cadherin.
(A) Time lapse images showing a gradual fragmentation and loss of E-cad network at 73, 80, 85, and 92 hrs-pp; scale bar represents 100 µm (B) (left) The three different cell populations in the aggregate are marked at 72 hrs-pp: namely cells that express only T-Bra, cells that express both T-Bra and E-cad, and cells that express only E-cad. (right) the fraction of the total population of cells for the three classes are provided in the histogram (n = 7 aggregates: 126, 116, 121, 102, 85, 184, and 163 cells, N = 2 replicates) with the SD shown by the error bars; inset shows the spatial distribution of the cells in one such aggregate (right) Spatial connectivity graph is generated for the aggregate at 72 hrs-pp. (C) Spatial distribution of the population fraction of the different cell types as a function of the radial distance from the aggregate centre (n = 7 aggregates: 126, 116, 121, 102, 85, 184, and 163 cells, N = 2 replicates). (D) Islands of E-cad/Oct4 expressing cells surrounded by T-Bra+ cells are present within the aggregate fixed at 92 hr-pp; the inset zooms on a few such islands. (E) Pixel intensity correlation plot between Oct4 and T-Bra (n = 6 aggregates, N = 2 replicates).
Figure 3—figure supplement 1
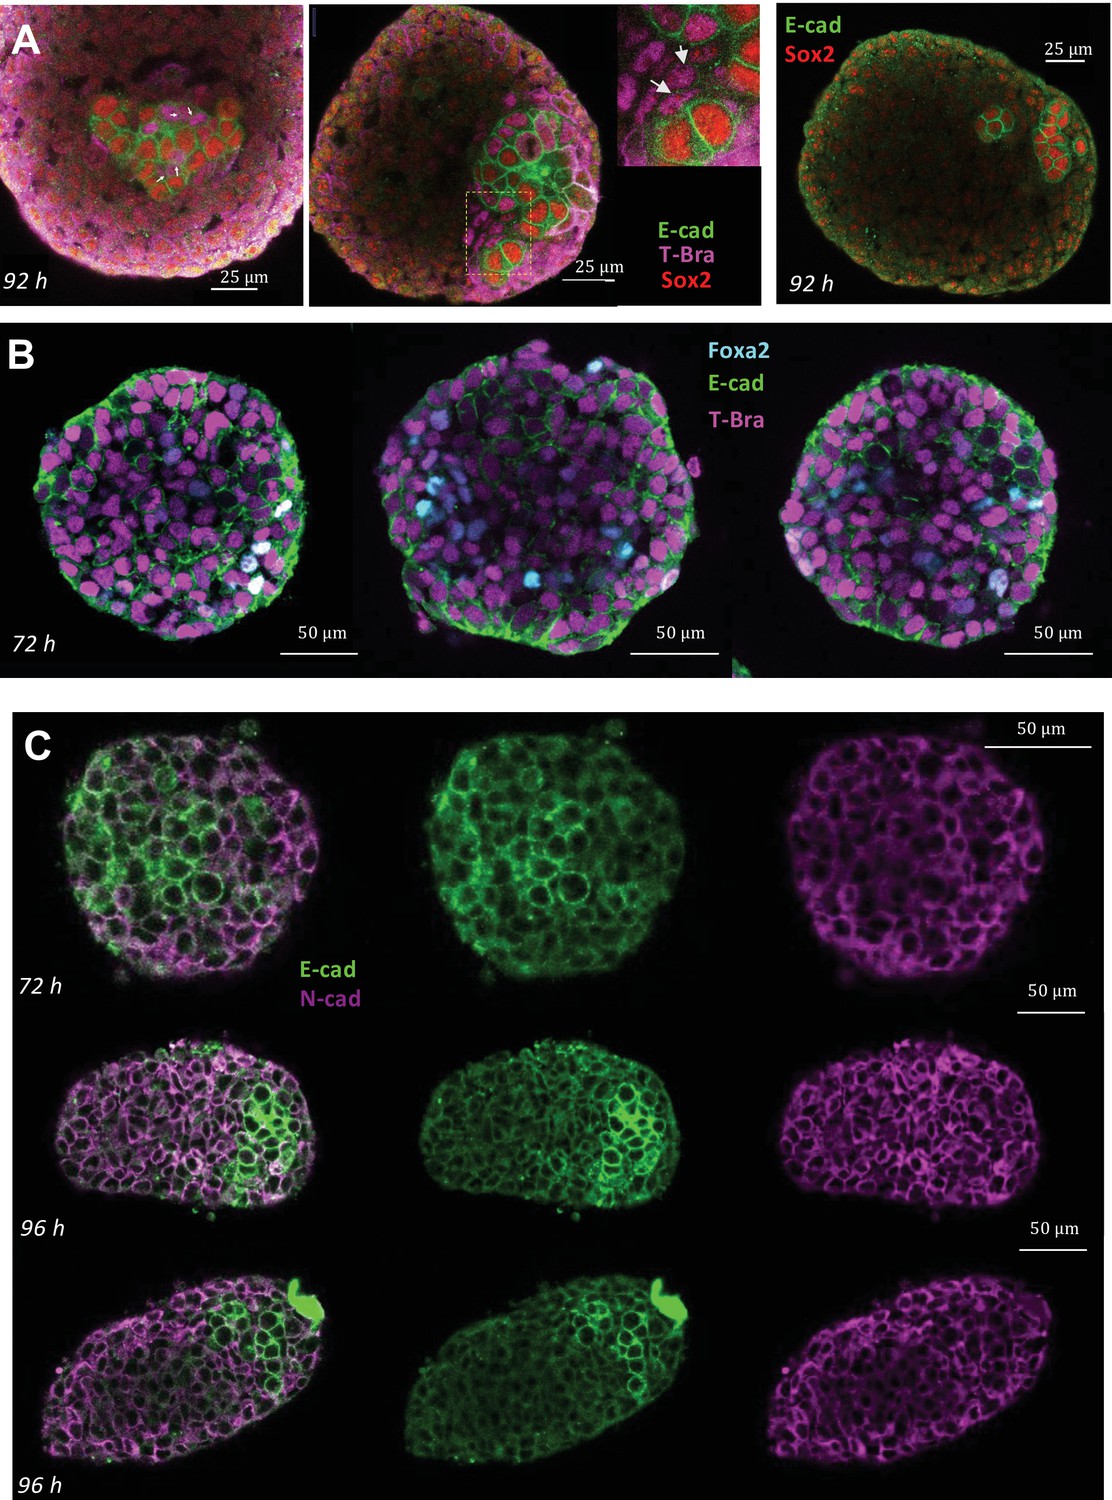
Immunostaining for E-cadherin, N-cadherin, T-Bra, Sox2, Foxa2 in aggregates at different stages.
(A) Staining for E-cadherin, T-Bra and Sox2 in aggregates at 92 hrs-pp. White arrows mark the junctions between cells that are expressing both E-cadherin and T-Bra. Notice that these cells do not express Sox2 and express E-cadherin only weakly compared to the cells that express E-cadherin/Sox2. (Right panel) Staining for E-cadherin and Sox2 in an aggregate at 92 hrs-pp. (B) Staining for E-cadherin, T-Bra and Foxa2 in aggregates at 72 hrs-pp. Few Foxa2-positive cells are found within the tissue which expresses in large majority T-Bra. (C) Staining for E-cadherin and N-cadherin in aggregates at 96 hrs-pp. n = 4, 7, and 5 aggregates (N = 1 replicate) for panels A, B, and C, respectively.
Figure 3—figure supplement 2
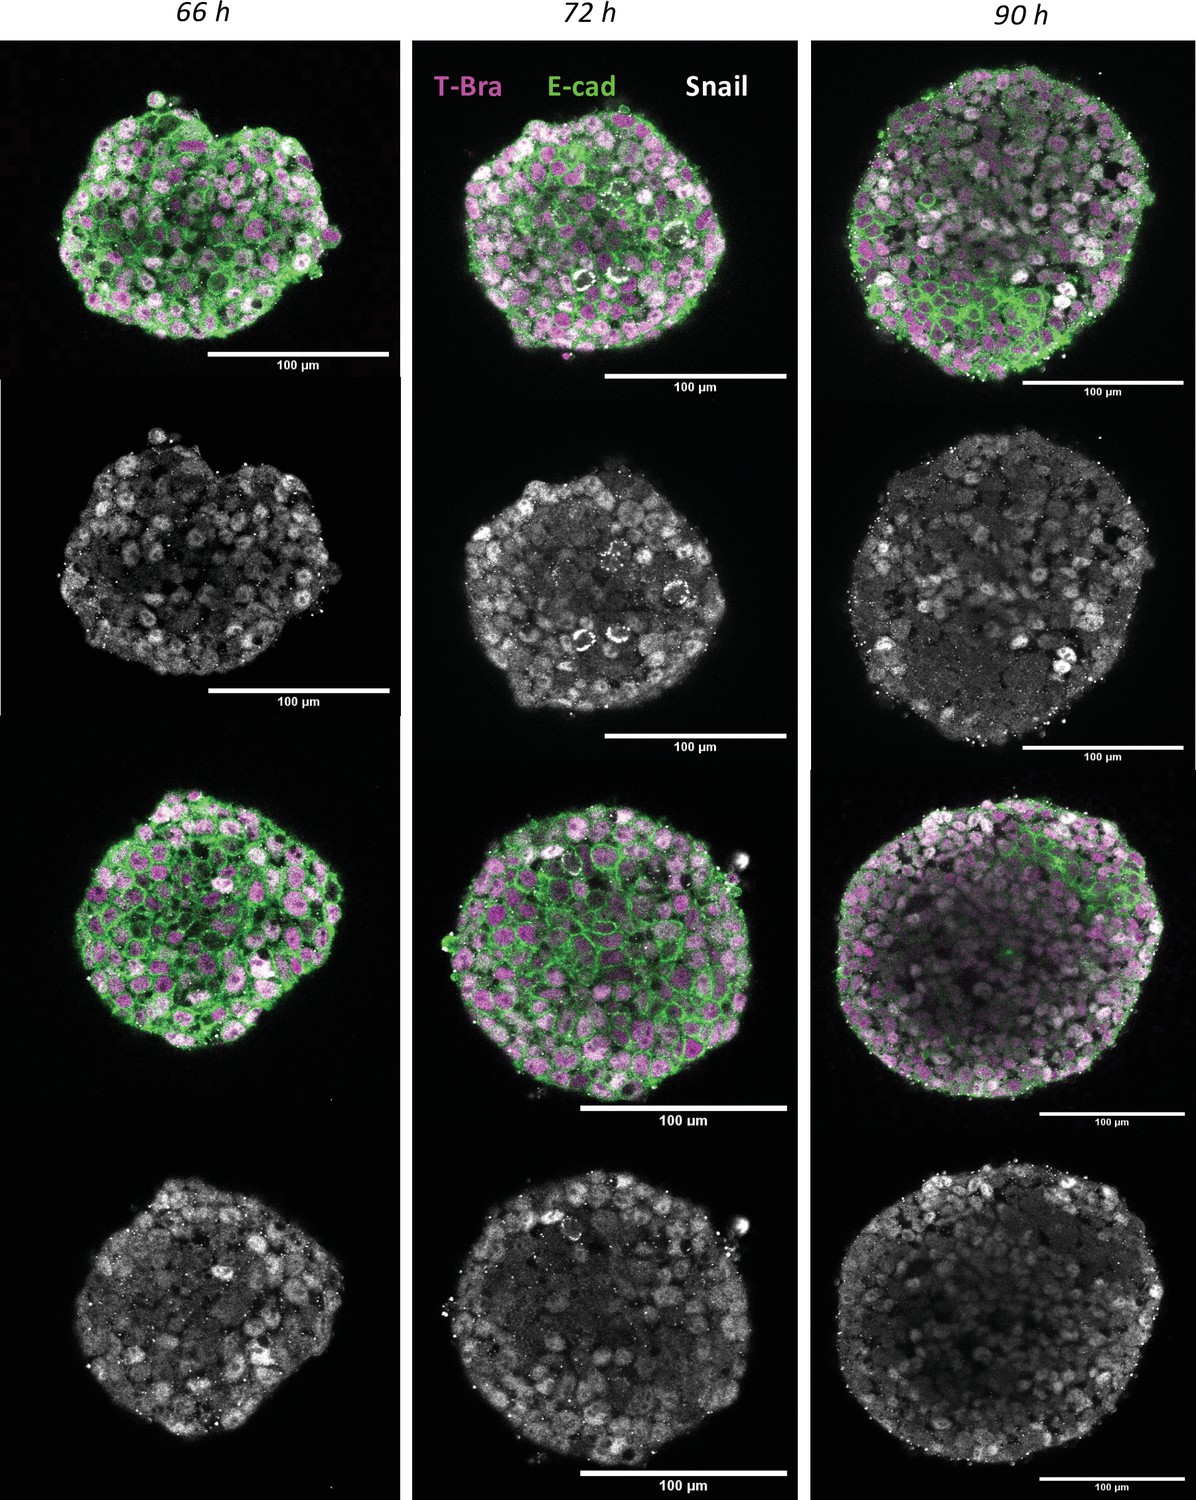
Immunostaining of E-cadherin and Snail in gastruloids at 66 hr, 72 hr, and 90 hr (n = 5 aggregates, N = 1 replicate).
Figure 4 with 2 supplements
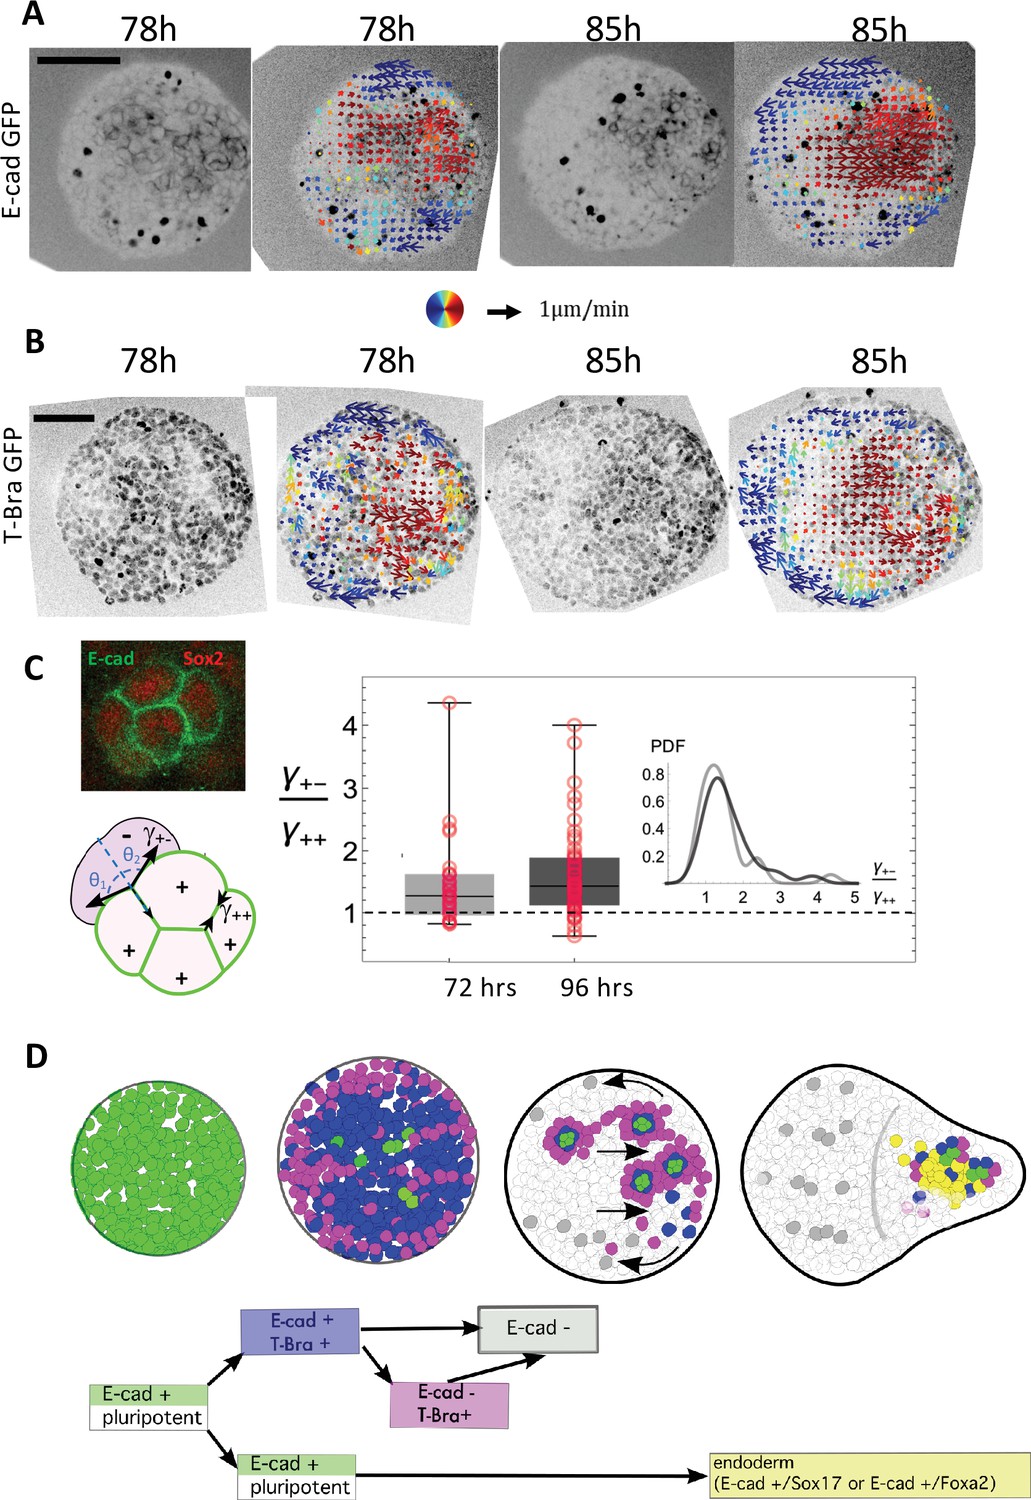
Tissue flows and a local sorting segregate islands of E-cadherin expressing cells.
(A–B) Cellular movements are quantified during the aggregate elongation using two-photon imaging of the aggregates with Sulforhodamine B (SRB) added in the medium, which enables to visualize cell contours. Optic flow measurements are performed on the SRB signal and the obtained velocity fields overlapped on the GFP signal corresponding to (A) E-cad and (B) T-Bra (N = 3 replicates). (C) Box-whisker plot shows the distribution of the ratio of the cell-junction tension heterogeneity between E-cad expressing cells (+), and between E-cad expressing cells and their neighbors (-) at 72 hr-pp (n = 28 junctions, N = 2 replicates) and 96 hr-pp (n = 54 junctions, N = 2 replicates); 25th and 75th quartiles together with the minimum and maximum values are shown; the insets to the left depict regions on the E-cad+ cell islands where the angle measurements were made. No significant statistical difference between the two time points (Kolmogorov-Smirnov Test; p-value = 0.37) (D) Cartoon depicting the different steps leading to the formation of an endoderm-like region within the gastruloid. Upon addition of Chi, majority of the E-cad expressing cells begin to express T-Bra. The transient expression of T-Bra represses E-cad expression in T-Bra+/E-cad+. Formation of islands of E-cad expressing cells surrounded by T-Bra+ cells; these islands are transported to one end of the aggregate via a tissue-scale movement. Islands of E-cad expressing cells segregate to give rise to the endoderm.
Figure 4—figure supplement 1
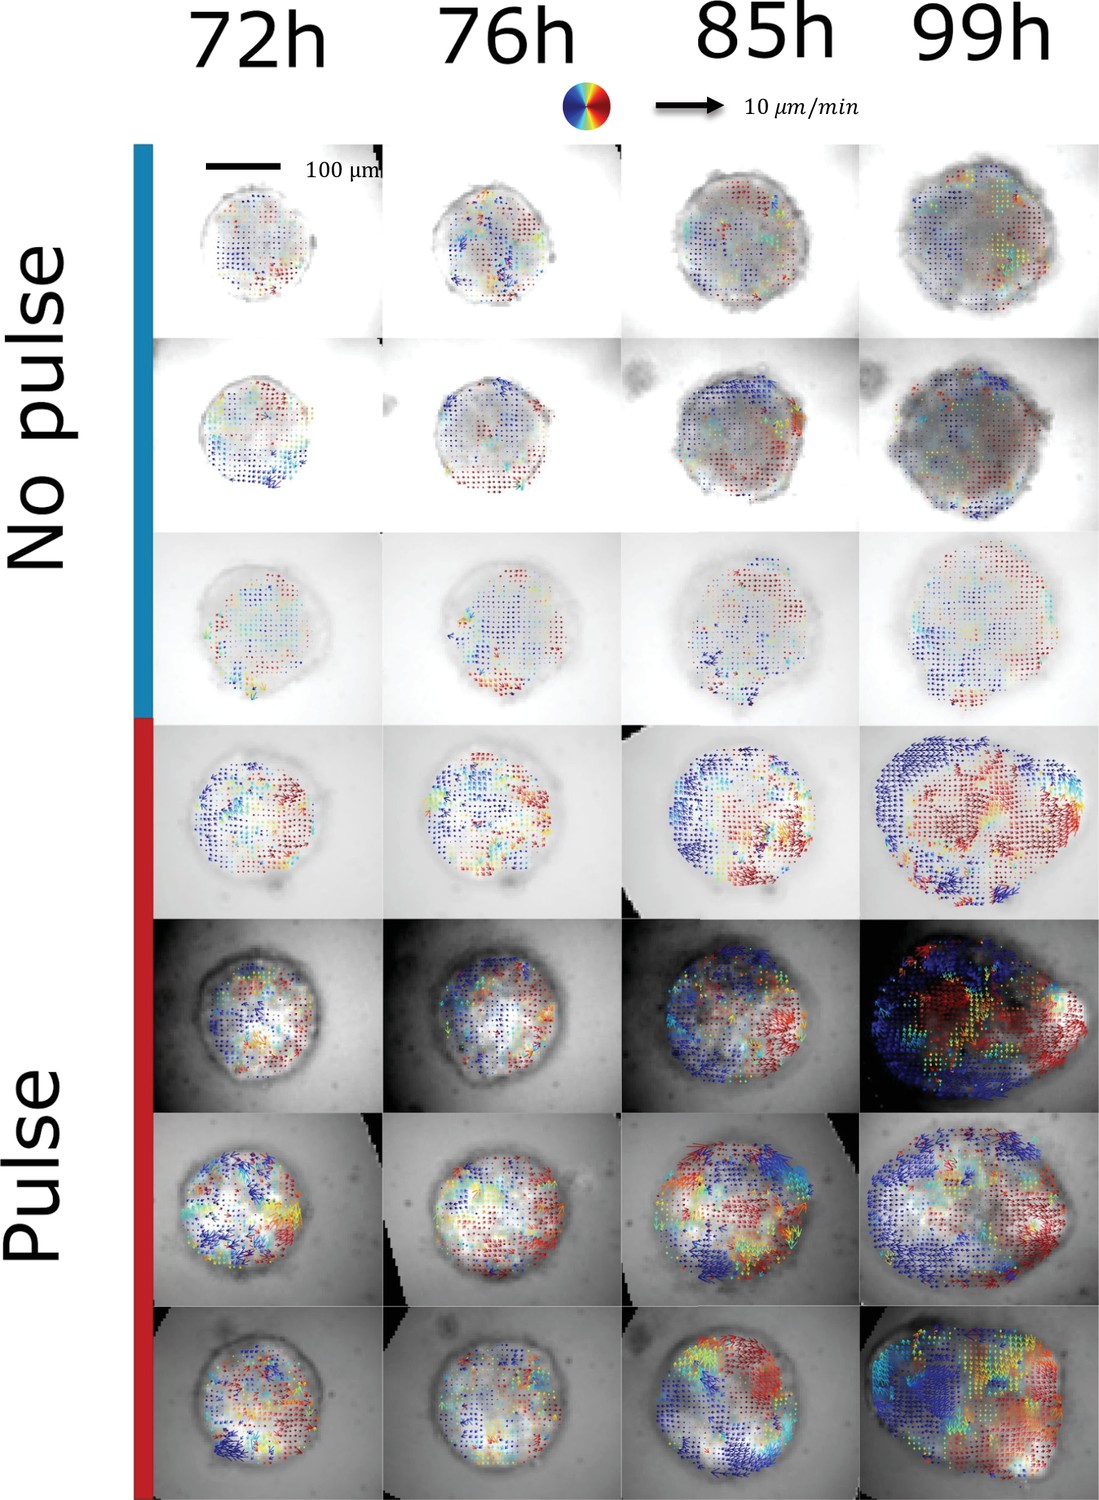
Characterization of tissue flows.
Cell collective movements are quantified in both aggregates cultured in normal conditions (with a chiron pulse between 48 hrand 72hr pp) and in non-pulsed aggregates. Mosaic aggregates are used (100 cells wild-type and 20 cells with T-Bra-GFP and nuclear membrane mKate) which enables to perform optic flow on the sparse nuclear membrane signal obtained by epifluorescence microscopy. Here, the velocity fields (averaged over 2 hr) are represented on the T-Bra-GFP signal. Collective anisotropic flows associated with a re-circulation of cells from the tip to the back are only observed in the chiron pulse case. Control: n = 4 aggregates, N = 2 replicates; pulsed: n = 3 aggregates, N = 2 replicates.
Figure 4—figure supplement 2
Islands of E-cadherin expressing cells.
Examples of E-cad islands used to measure relative tensions between junctions inside an E-cad island and the non-E-cad cells.
Videos
Video 1
Gastruloid polarization between 72 hr and 96 hr imaged with bright-field microscopy.
Video 2
Gastruloids polarization in a 96 wells plate between 72 hr and 100 hr after formation (mosaic aggregates made of 100 cells E14 +20 cells T-Bra-GFP) imaged by epifluorescence.
In magenta, aggregates were pulsed with Chi between 48 hr and 72 hr and have a T-Bra expression and polarization. In blue, control Gastruloids that were not pulsed and do not exhibit T-Bra expression.
Video 3
E-cadherin-GFP signal evolution during Gastruloid polarization between 72 hr and 96 hr imaged by epifluorescence.
Video 4
T-Bra-GFP signal apparition during the Chi pulse from 48 hr to 72 hr imaged by epifluorescence.
Video 5
E-cadherin-GFP progressive decay during the Chi pulse from 48 hr to 72 hr imaged by epifluorescence.
Video 6
T-Bra-GFP signal evolution during Gastruloid polarization between 72 hr and 96 hr imaged by epifluorescence.
Video 7
Z-stack (one slice every 10 microns) of a 96 hr Gastruloid (made of 150 T-Bra-GFP cells) immunostained with FoxA2 and E-cadherin.
Video 8
Two-photon time-lapse movie of Gastruloid polarization and elongation with E-cadherin-GFP and sulforhodamine B (SRB) tagging.
Video 9
Two-photon time-lapse movie of Gastruloid polarization and elongation with E-cadherin-GFP and sulforhodamine B (SRB) tagging.
Video 10
Two-photon time-lapse movie of Gastruloid polarization and elongation with E-cadherin-GFP and sulforhodamine B (SRB) tagging.
Four planes 12.5 µm apart are superimposed on the right panel.
Video 11
Two-photon rapid time-lapse movie of a Gastruloid at early phase of symmetry breaking (E-cadherin-GFP).
Video 12
Two-photon time-lapse movie of Gastruloid polarization and elongation with T-Bra-GFP and sulforhodamine B (SRB) tagging.
Video 13
Two-photon time-lapse movie of Gastruloid polarization and elongation with E-cadherin GFP and sulforhodamine B (SRB) tagging.
Video 14
Two-photon time-lapse movie of Gastruloid polarization and elongation with T-Bra::GFP and sulforhodamine B (SRB) tagging.
Video 15
Velocity field obtained by optical flow on the sulforhodamine B signal of the movie 12 superimposed on the T-Bra signal.
Video 16
Velocity field obtained by optical flow on the sulforhodamine B signal of the movie 8 superimposed on the E-cadherin signal.
Video 17
Velocity field obtained by optical flow on the sulforhodamine B signal of the movie 12 superimposed on the sulforhodamine B signal.
Additional files
-
Supplementary file 1
Table – Statistics: number of aggregates analyzed, number of independent experiments and statistical tests.
- https://cdn.elifesciences.org/articles/59371/elife-59371-supp1-v2.docx
-
Transparent reporting form
- https://cdn.elifesciences.org/articles/59371/elife-59371-transrepform1-v2.docx
Download links
A two-part list of links to download the article, or parts of the article, in various formats.
Downloads (link to download the article as PDF)
Open citations (links to open the citations from this article in various online reference manager services)
Cite this article (links to download the citations from this article in formats compatible with various reference manager tools)
Cell-state transitions and collective cell movement generate an endoderm-like region in gastruloids
eLife 11:e59371.
https://doi.org/10.7554/eLife.59371


