Structure and mechanism of the Mrp complex, an ancient cation/proton antiporter
- Institute of Science and Technology Austria, Austria
Figures
Figure 1 with 4 supplements
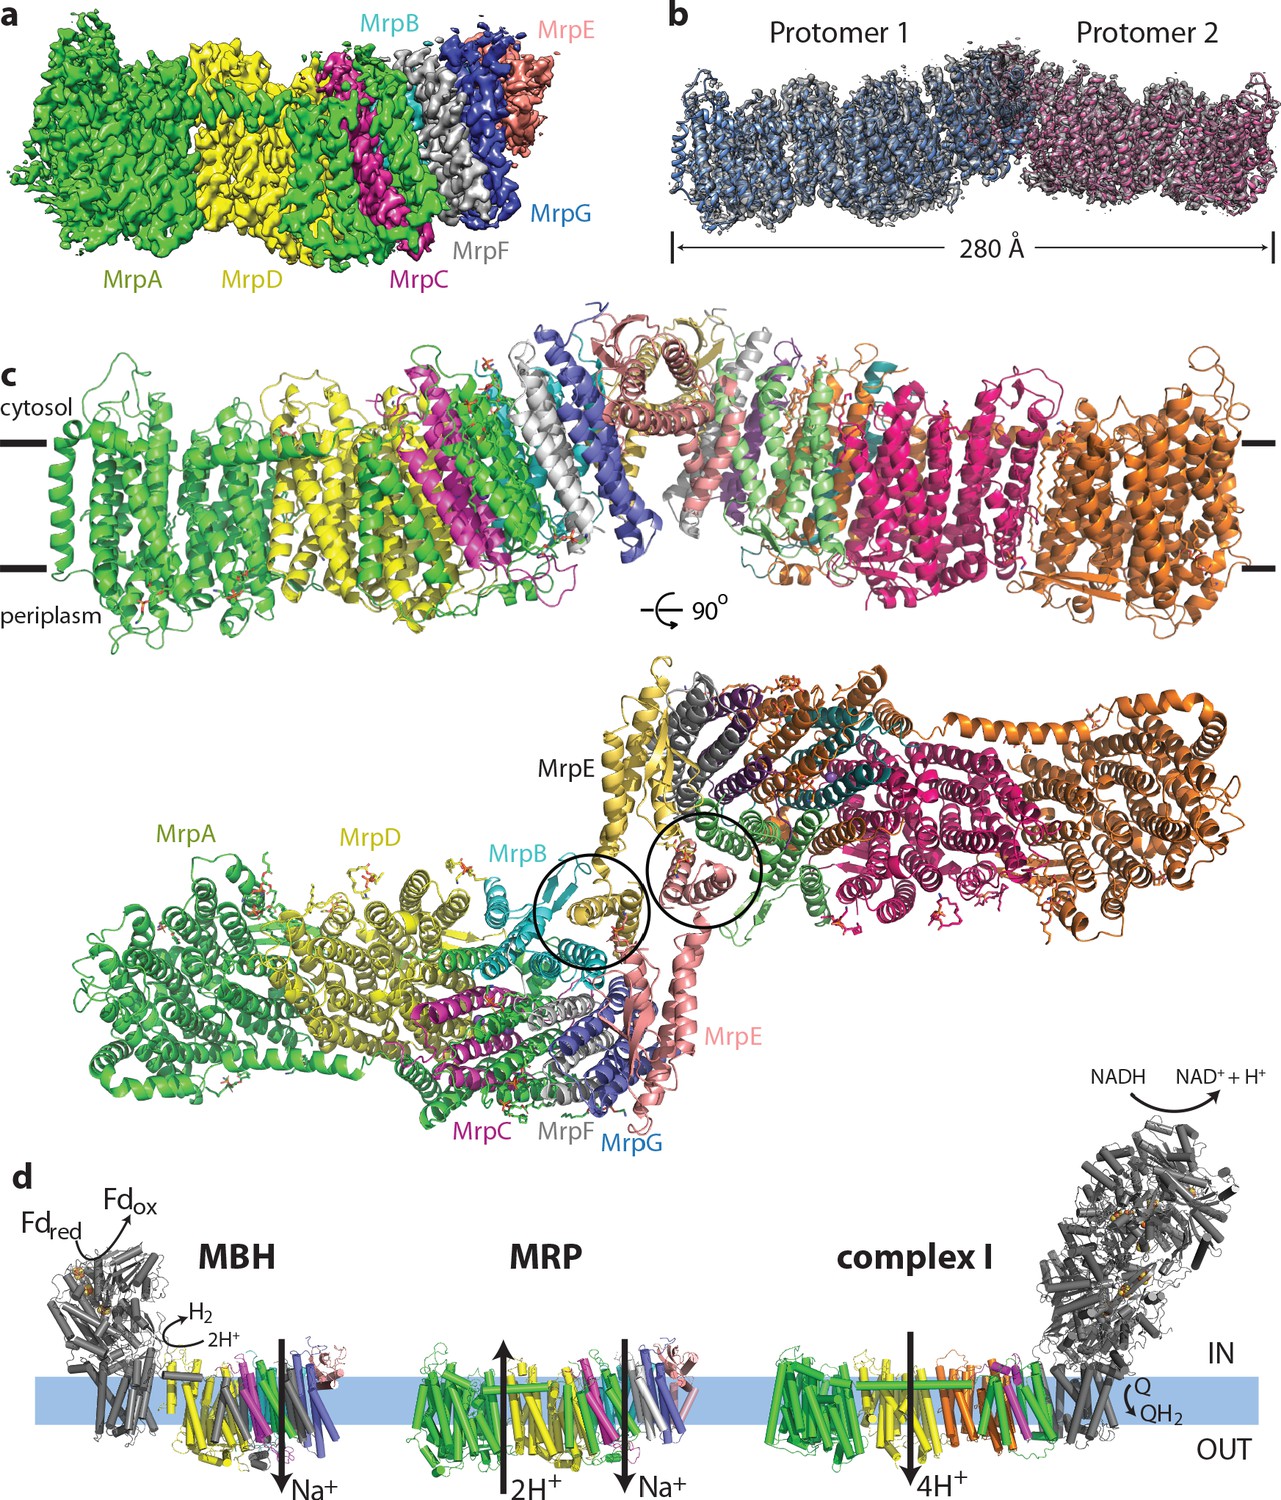
Overall structure of the Mrp complex.
(a) Cryo-EM density of a monomer, coloured by subunit as indicated. (b) Cryo-EM density of a dimer, with the model shown as a cartoon. (c) Model of the dimer, with each subunit coloured differently. Side view and view from the cytoplasm, where two N-terminal helices of subunit MrpE, forming most of the dimer interface, are circled. (d) Schematic view of the Mrp monomer, MBH complex and complex I. Homologs of Mrp subunits are coloured similarly as in c), with an additional MrpD-like subunit in complex I in orange.
Figure 1—figure supplement 1
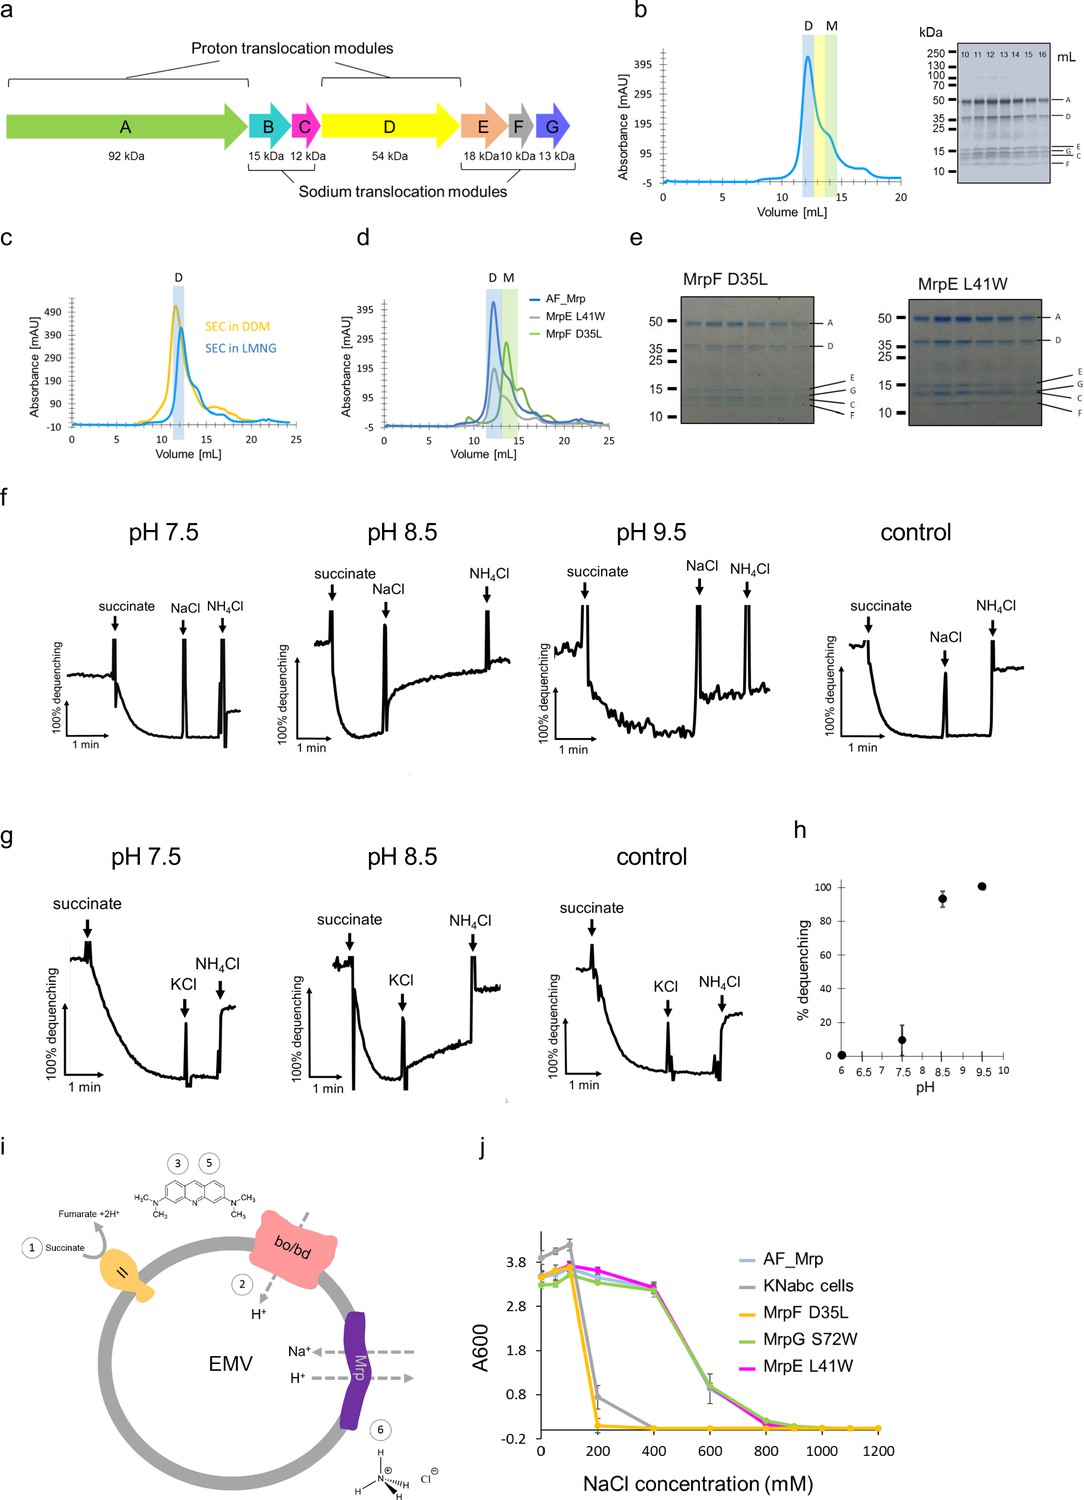
Purification and characterization of Anoxybacillus flavithermus Mrp.
(a) Operon encoding seven subunits (MrpA-MrpG) of Anoxybacillus flavithermus WK1 mrp. Two modules based on the Mrp structure are indicated. (b) Mrp was purified by affinity- and size exclusion chromatography as a final step. The size exclusion elution profile is shown, with LMNG as detergent. The fraction in the middle of the dimer peak (which eluted at around 12.5 ml) was diluted for cryo-EM sample preparation. The elution peaks of the dimer and monomer are highlighted in blue and green, respectively. SDS-PAGE shows the presence of all Mrp subunits, identified by mass-spectrometry. (c) Size exclusion chromatography of Mrp in two different detergents - DDM and LMNG. The elution of the dimer is highlighted in blue. (d) Size exclusion chromatography of non-mutated (AF_Mrp) and mutated Mrp (MrpE L41W and MrpF D35L). The elution peaks of the dimer and monomer are highlighted in blue and green, respectively. (e) SDS-PAGE of the size exclusion chromatography fractions for the mutants MrpF D35L and MrpE L41W shows that all subunits co-elute in a single peak in each case. (f) Na+/H+ antiport activity of AF_Mrp in everted membrane vesicles (EMV) using NaCl to initiate Mrp activity at pH 7.5, pH 8.5 and pH 9.5. Non-transformed KNabc vesicles were used as a control at pH 8.5. The addition of succinate, NaCl and NH4Cl is indicated with arrows. The 100% percentage of acridine orange fluorescence dequenching is shown when 10 mM NH4Cl was added. (g) Na+/H+ antiport activity of AF_Mrp in EMV using KCl to initiate Mrp activity at pH 7.5 and pH 8.5. Non-transformed KNabc vesicles were used as a control at pH 8.5. (h) Na+/H+ antiport activity of AF_Mrp using NaCl to initiate Mrp activity is shown as the percentage of dequenching at pH 6.0, pH 7.5, pH 8.5 and pH 9.5. The results are averages from three independent preparations. The error bars show the standard deviations of the means. (i) Schematic of the Na+/H+ antiport activity using EMV. 1 – Addition of succinate to initiate respiration. 2- Oxidases create a ΔpH. 3 – Quenching of acridine orange. 4- Addition of NaCl to initiate Mrp activity. 5 – Dequenching of acridine orange, which is a measure of the Na+/H+ activity. 6 – Addition of NH4Cl to establish a baseline. (j) Experiments of complementation capacity of AF_Mrp and AF_Mrp mutants MrpF D35L, MrpG S72W, MrpE L41W for the growth of sodium sensitive E. coli KNabc cells. Non-transformed KNabc cells were used as a control. The results are averages from three independent experiments. The error bars show the standard deviations of the means.
Figure 1—figure supplement 2
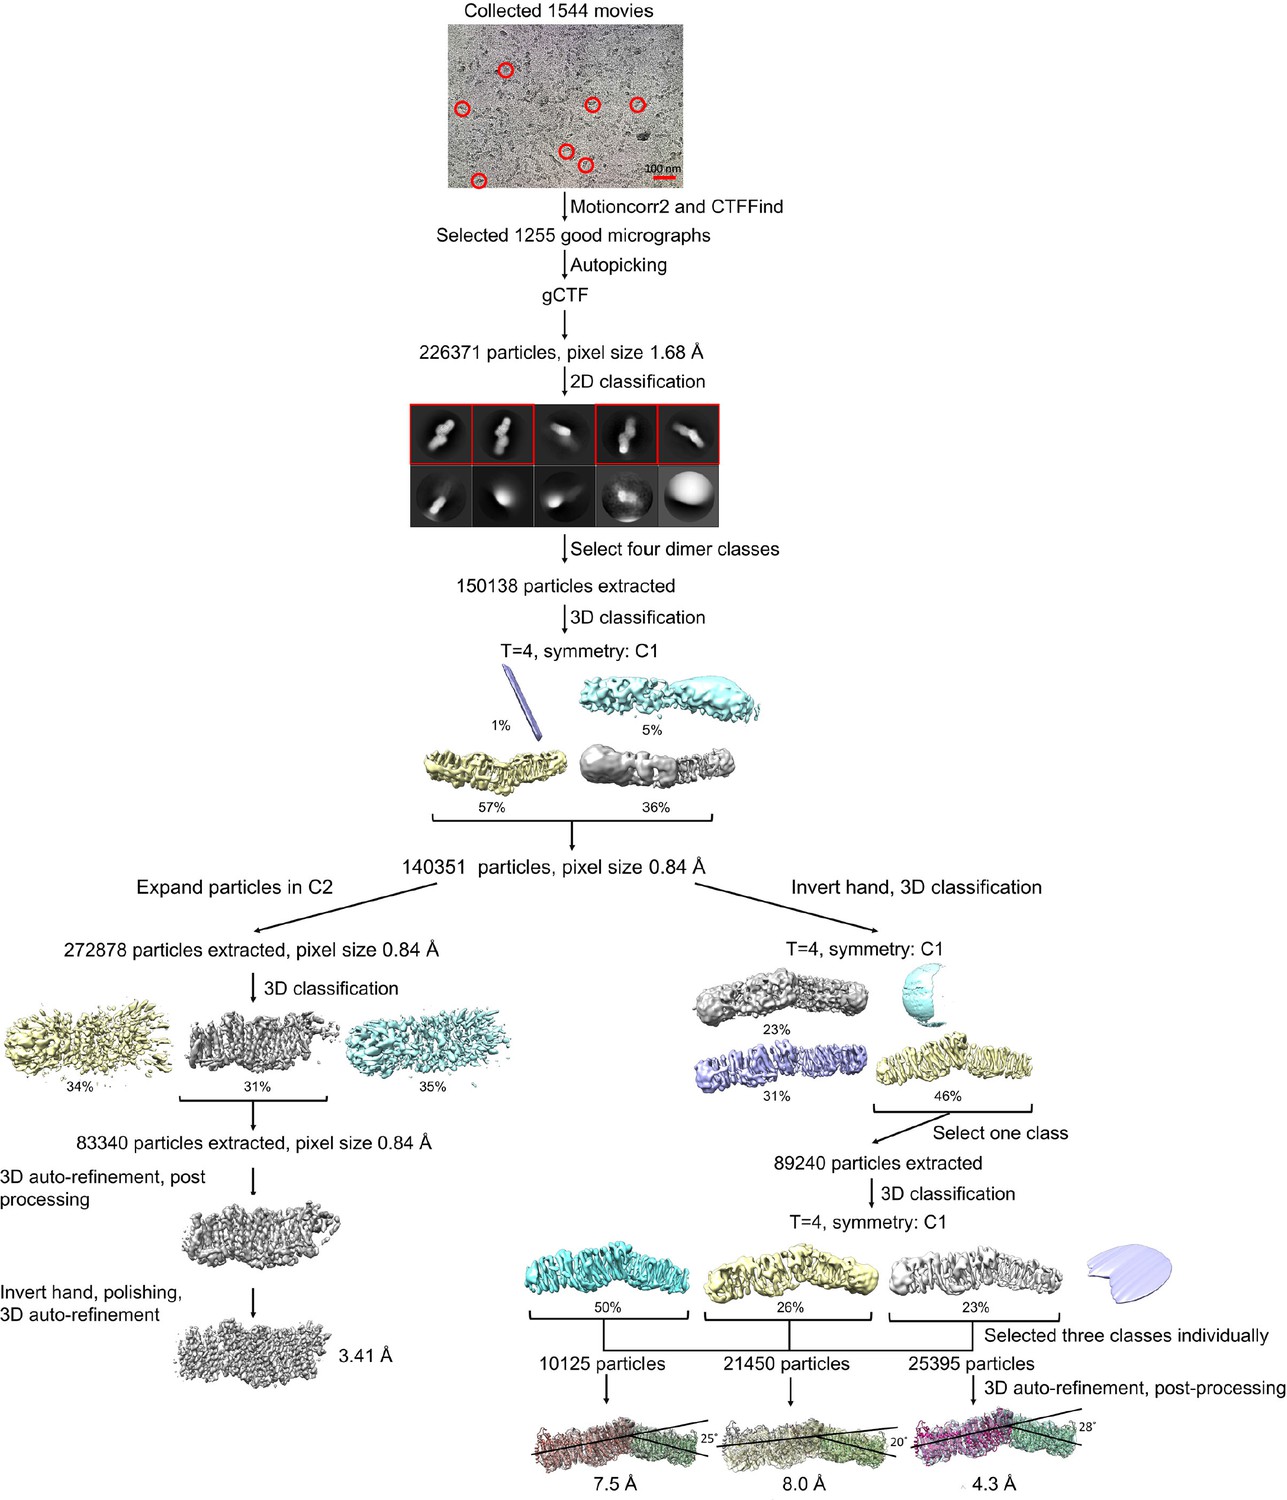
Processing of the Mrp-DDM dataset.
Representative raw micrograph is shown with some of picked particles circled. After classification, the two best classes were either further classified to process the Mrp dimer, or symmetry expanded according to the C2 point group to process the Mrp monomer. Further 3D classifications and 3D auto-refinements resulted in three different dimer classes with distinct angles between the monomers of the dimer and indicated resolutions. 3D auto-refinement, 3D classification, post processing and polishing of the symmetry expanded particles resulted in a reconstructed monomer map with a final resolution of 3.41 Å.
Figure 1—figure supplement 3
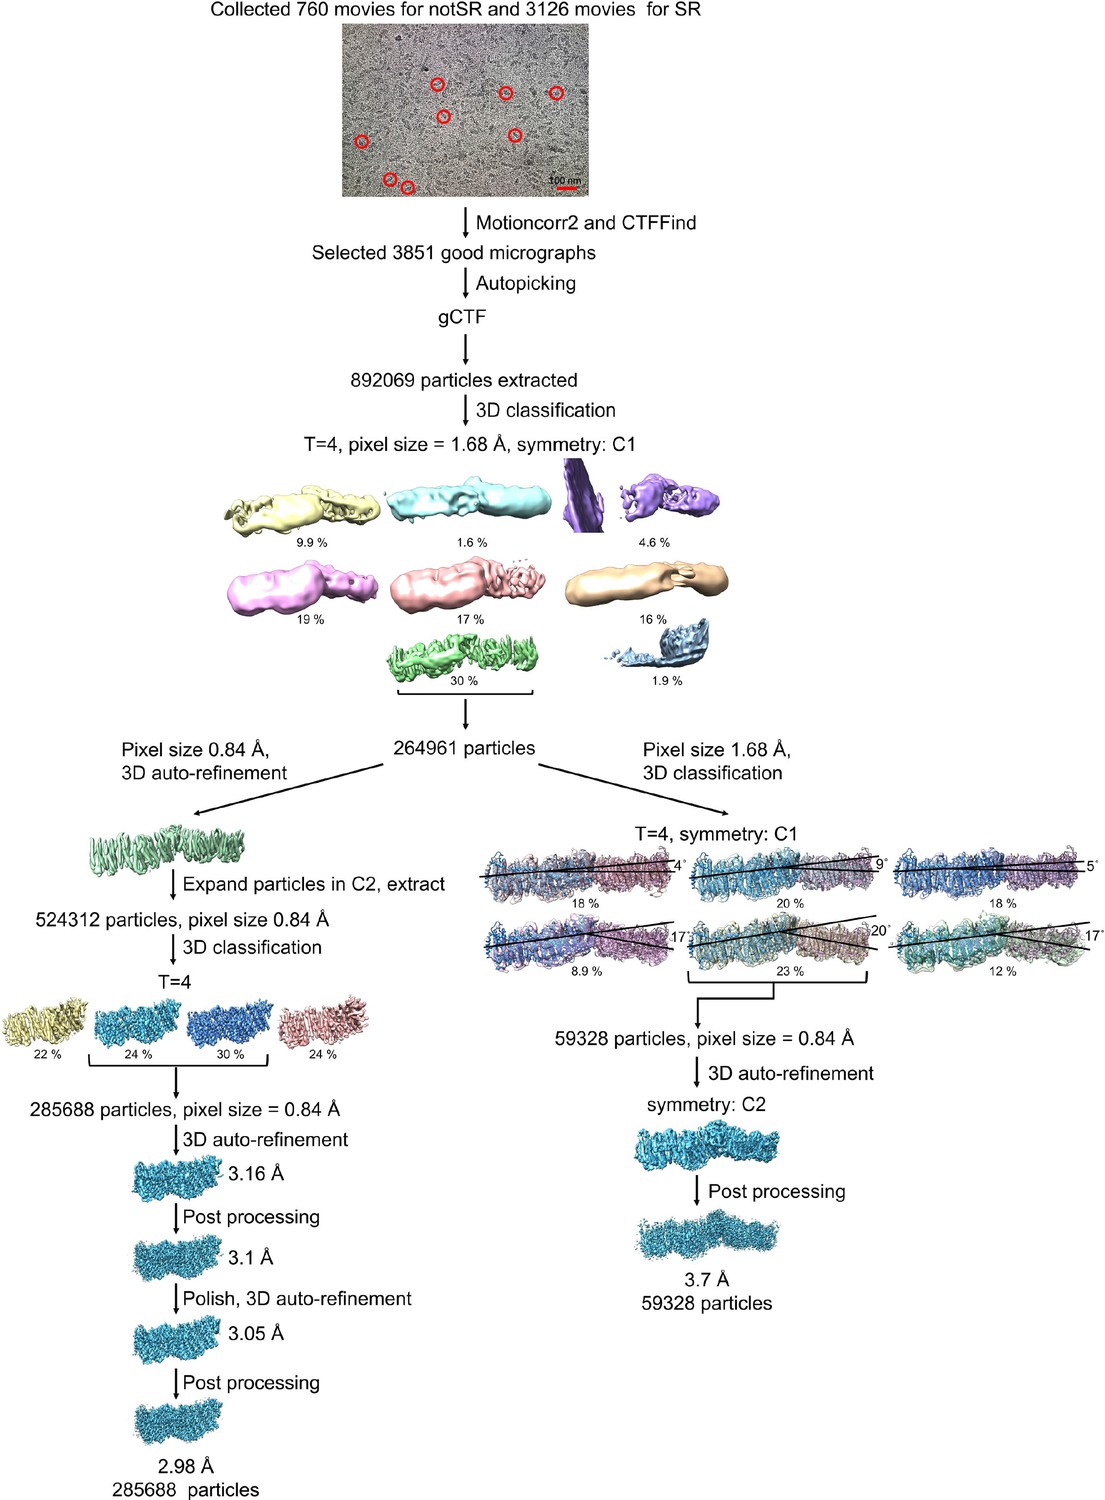
Processing of the Mrp-LMNG dataset.
Representative raw micrograph is shown with some of picked particles circled. After classification, the best class was either further classified to process the Mrp dimer, or 3D auto-refined and symmetry expanded according to the C2 point group to process the Mrp monomer. 3D classification to process Mrp dimer resulted in six classes with distinct angles between the monomers. 3D auto-refinement of the best class in C2 symmetry, resulted in a reconstructed dimer map with a resolution of 3.7 Å. The symmetry expanded particles were further classified to process the Mrp monomer, resulting in two good classes. 3D auto-refinement, post processing and polishing resulted in a reconstructed Mrp monomer map with a resolution of 2.98 Å.
Figure 1—figure supplement 4
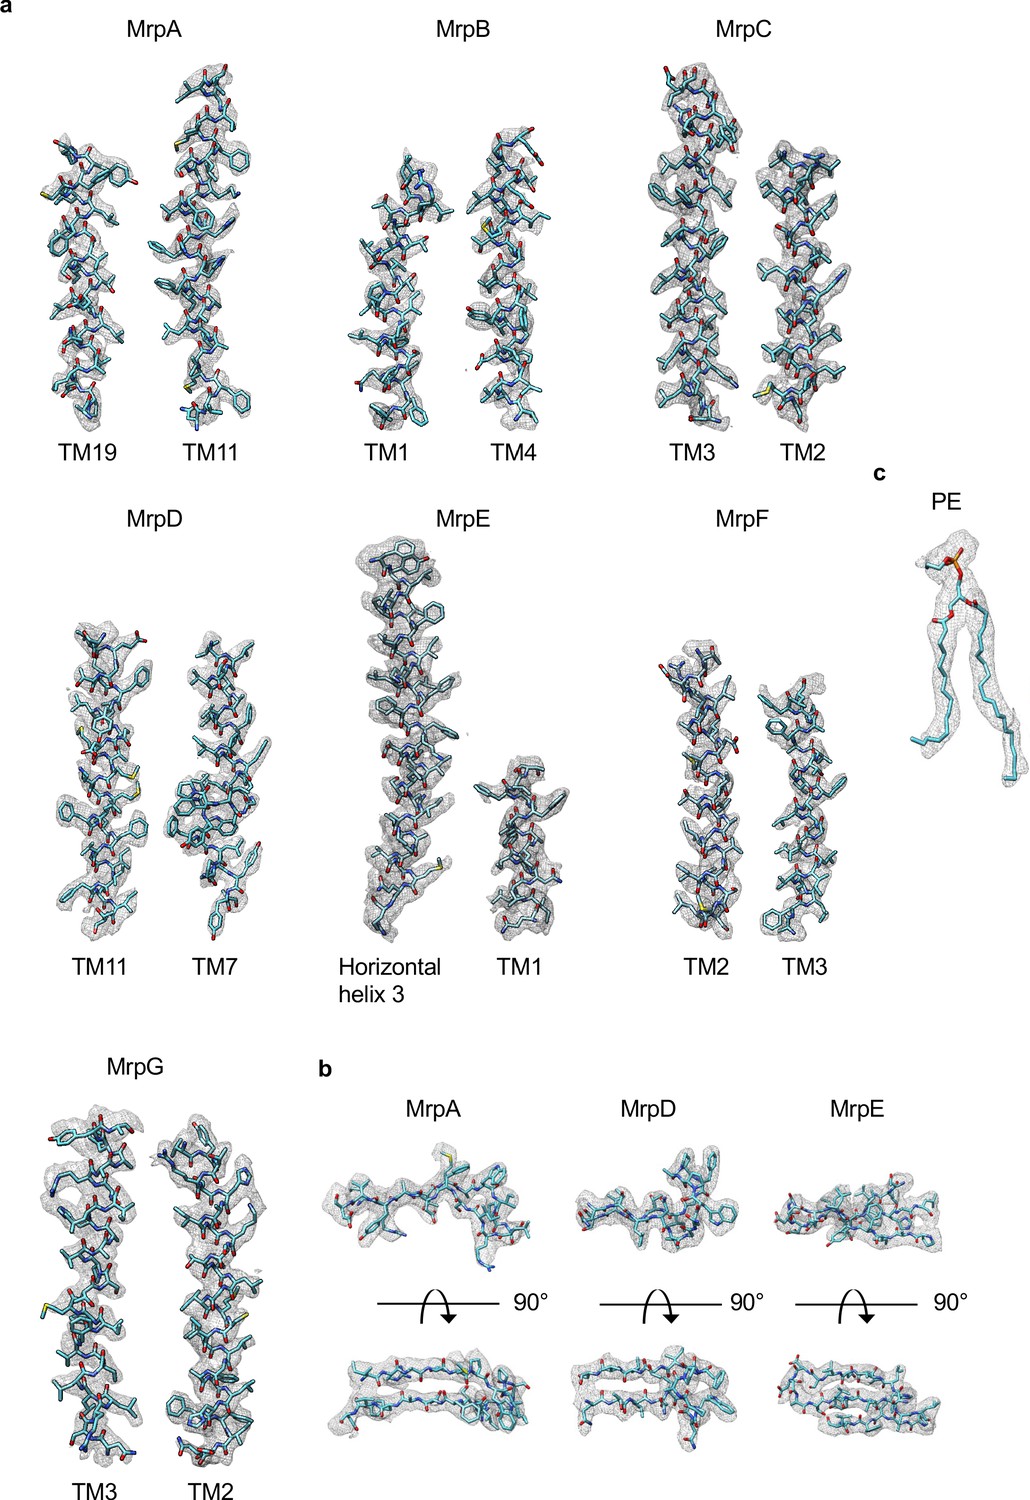
Examples of cryo-EM density of Mrp monomer in LMNG.
(a) Densities of transmembrane helices from MrpA-G. (b) Densities of β-sheets from MrpA, MrpD and MrpE. (c) Density of phosphatidylethanolamine.
Figure 2 with 1 supplement
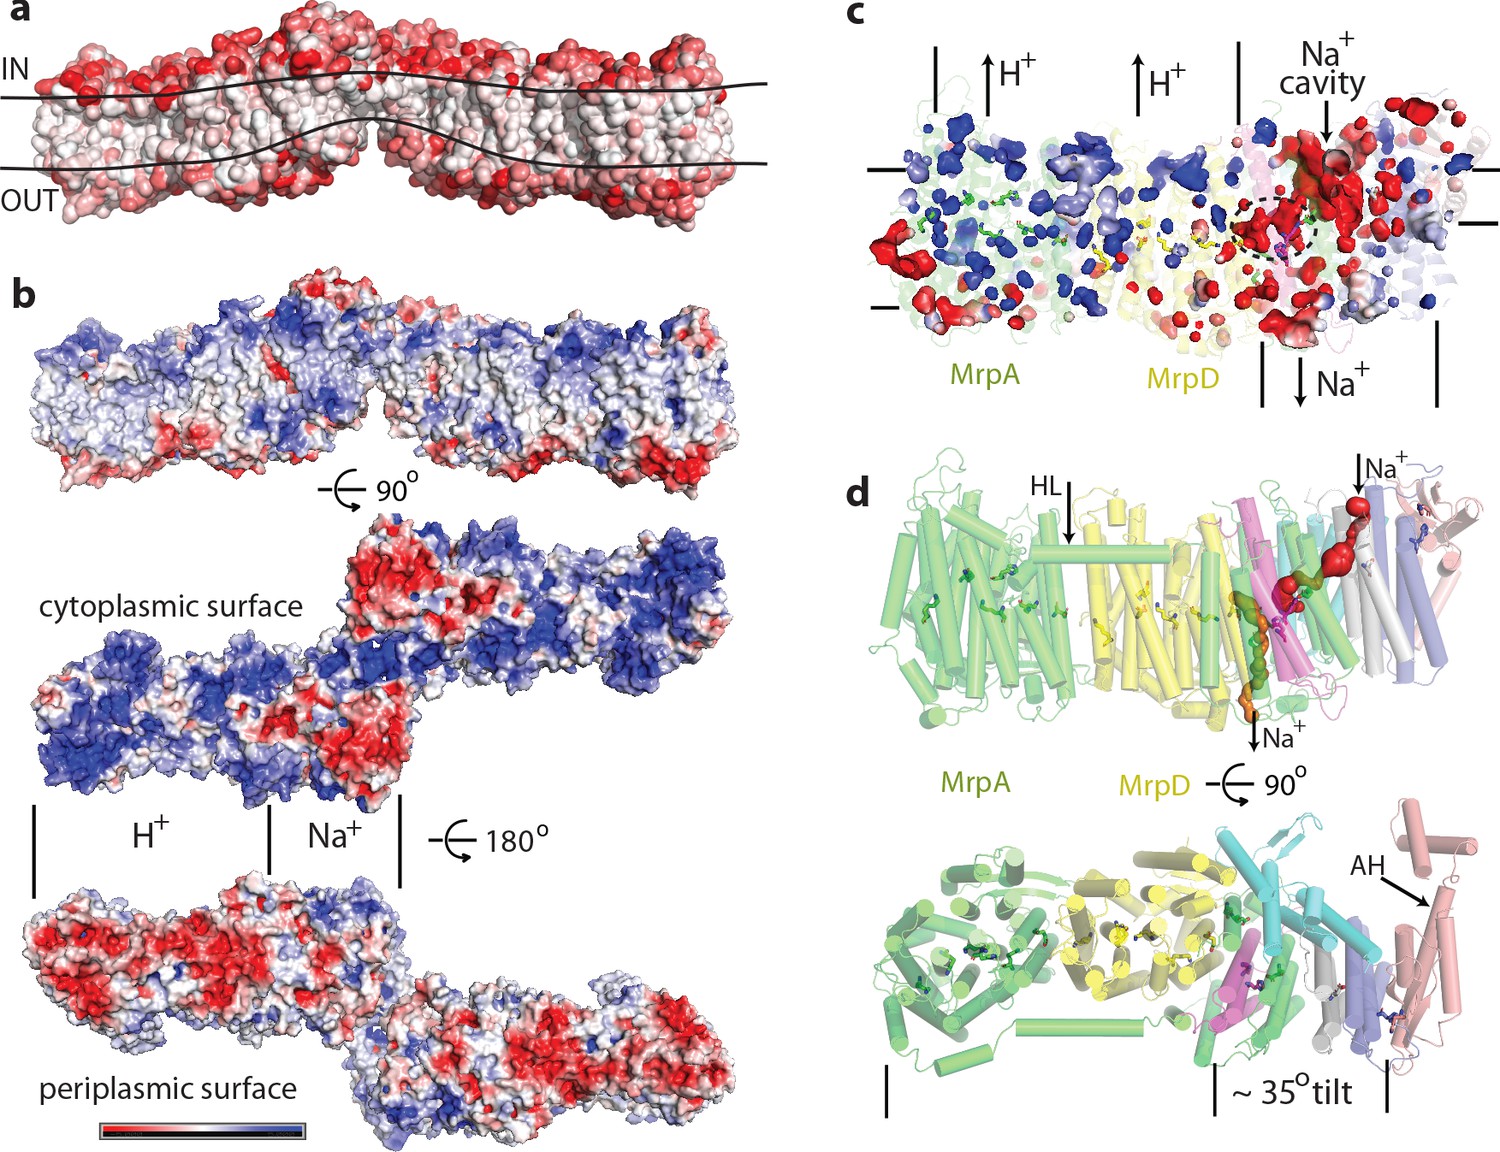
Physicochemical properties of the Mrp complex.
(a) Surface of the dimer is shown with residues coloured according to Eisenberg hydrophobicity scale from white (hydrophobic) to red (hydrophilic). Apparent extent of the lipid membrane is outlined. (b) Surface charge distribution of the dimer. Top is side view with cytosolic side up. Protein surface is shown coloured red for negative, white for neutral and blue for positive surface charges, with the scale (-5 to +5 kbT/e) shown below. Likely areas of interactions with protons and sodium and are indicated. (c) Internal cavities in the monomer, coloured according to charge. (d) Top, side view of the monomer with tunnels calculated in MOLE shown as red and orange surfaces. Amphipathic helix HL from subunit MrpA is indicated. Bottom, view from the cytoplasm illustrating the high degree of tilt of all helices in the putative Na+-translocating domain relative to helices in the H+-translocating domain (MrpAN/D). Amphipathic helix AH from subunit MrpE is indicated.
Figure 2—figure supplement 1

Local resolution, FSC curves, bound ions and membrane thinning.
(a) Local resolution of the Mrp monomer in LMNG. (b) Local resolution of the Mrp dimer in LMNG. (c) Fourier shell correlation (FSC) curves for the Mrp monomer. (d) FSC curve of the Mrp dimer. (e) K+ ions densities in the map of monomer in DDM. (f) K+ ions and water molecules densities in the map of monomer in LMNG. (g) A potential membrane-thinning area of short TMH1-2 and amphipathic helix AH from MrpE. The surface of one monomer is shown with surface-exposed residues coloured according to Eisenberg hydrophobicity scale from white (hydrophobic) to red (hydrophilic). The second monomer is shown in cartoon only. (h) Cryo-EM map of a representative dimer from the 3D classification run, at about 7 Å resolution. Protein density is in magenta, while the detergent belt is in grey.
Figure 3
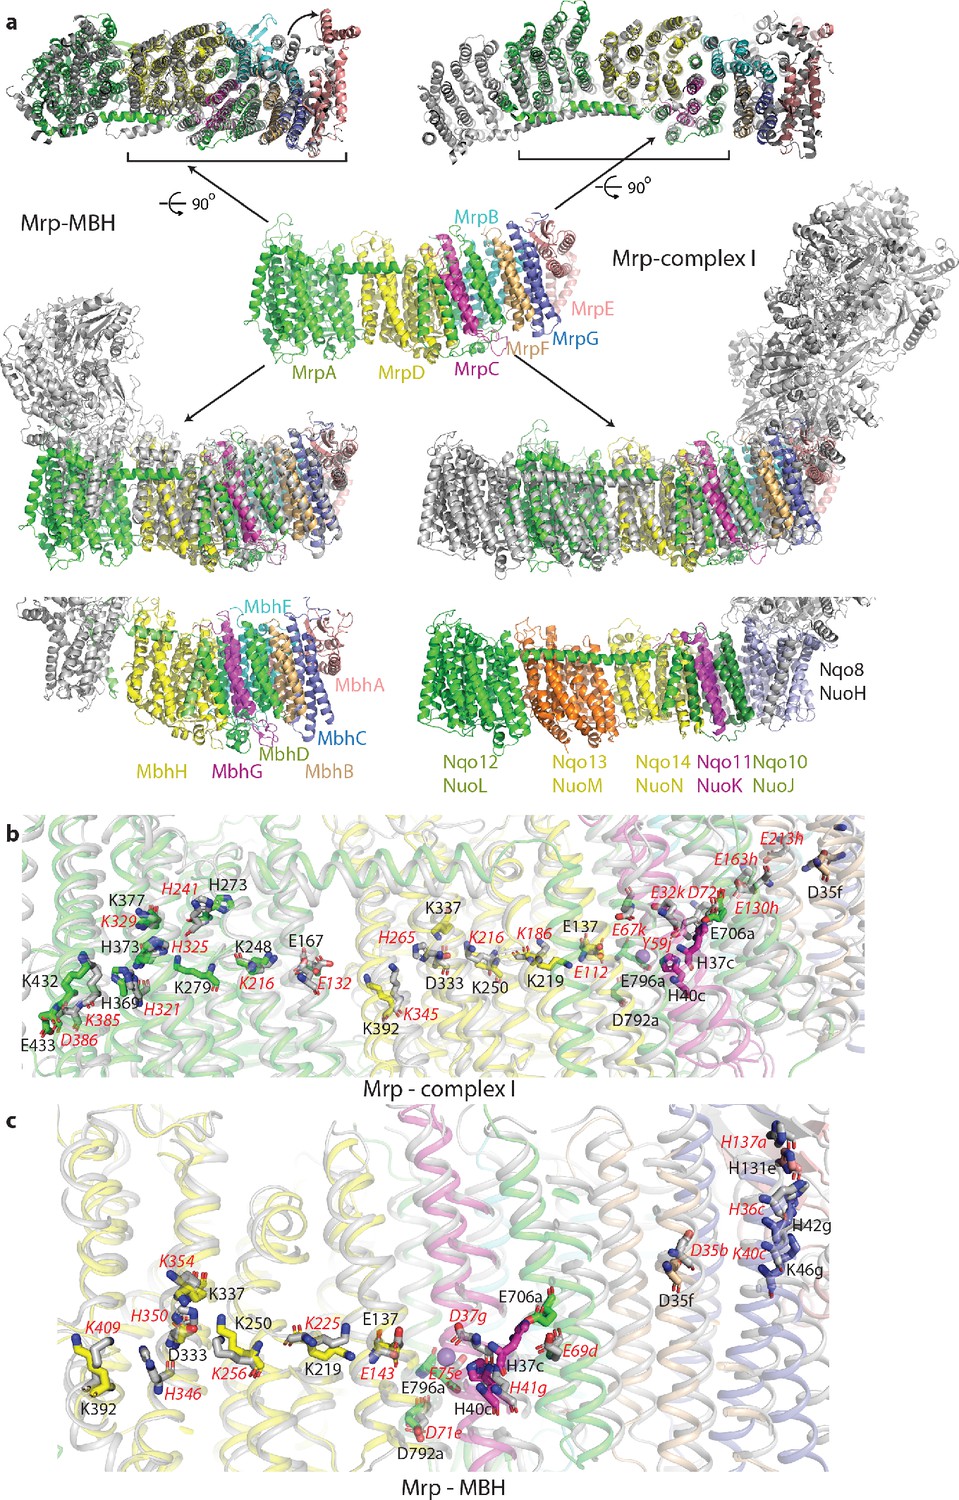
Overlay of Mrp with complex I and MBH complex.
(a) The Mrp monomer is shown in the centre in side view. Alignments to MBH are in the left column and to complex I in the right column. The top row shows view from the cytosol, with the conserved domains underlined. The arrow indicates ‘swinging out’ of the MrpE TMH1-2 in comparison to MBH. The second row shows the side view, with Mrp subunits coloured as in the centre and complex I/MBH in grey. In the bottom row only MBH and complex I are shown in the same orientation as above, with subunits homologous to Mrp coloured as in Mrp and the rest grey. Quinone-binding subunit in complex I (Nqo8/NuoH) is not present in Mrp and is highlighted in slate. Additional MrpD-like subunit in complex I (Nqo13/NuoM) is in orange. MBH has its redox module attached to the Mrp-like domain on the opposite side compared to complex I. MbhF is homologous to MrpB, MbhG to MrpC, MbhH to MrpD, MbhA to MrpE, MbhB to MrpF, MbhC to MrpG and MbhD together with MbhE to MrpAC. Nqo12/NuoL is homologous to MrpAN, Nqo13/NuoM and Nqo14/NuoN to MrpD, Nqo11/NuoK to MrpC and Nqo10/NuoJ to MrpAC. (b) Overlay of Mrp with the membrane domain of complex I. Key residues, important for H+ translocation and Na+ binding are shown in stick representation, with the residue number indicated in black for Mrp and the corresponding homologous residue of complex I indicated in red. Except for MrpAN and MrpD, suffixes indicate subunit (in E. coli nomenclature for complex I). (c) Overlay of Mrp with the homologous subunits of MBH. Key residues, important for H+ translocation and Na+ binding are shown in stick representation, with the residue number indicated in black for Mrp and the corresponding homologous residue of MBH shown in red. Except for MrpD, suffixes indicate subunit. The positions of two bound K+ ions in Mrp are indicated by purple spheres, with one of them being less visible behind H37c.
Figure 4 with 4 supplements
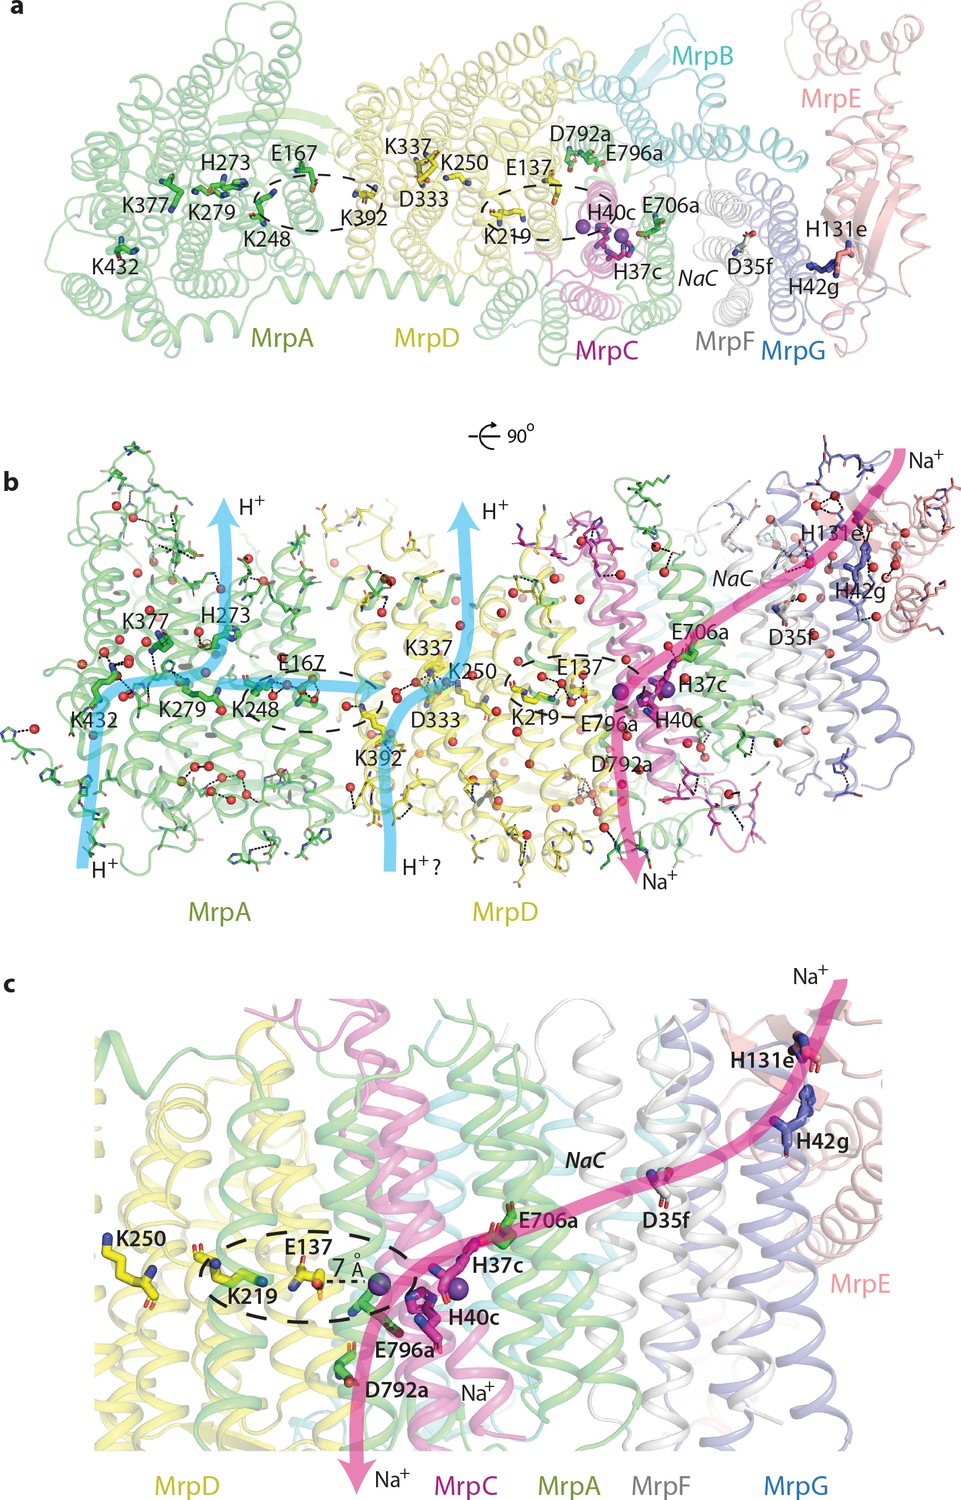
Proton and cation translocation pathways.
(a, b) View from the cytoplasm (a) and side view (b) with key residues proposed to be involved in both pathways indicated. Waters predicted in Dowser software are shown as red spheres and the hydrogen bonds involving protonatable residues and waters are shown as black dashes. Approximate pathways for H+ and Na+ translocation are indicated by arrows. Coupling points between MrpAN and MrpD, and between MrpD and Na+-binding site are indicated by dashed ovals. (c) Details of Na+ pathway. The two experimentally identified bound K+ ions are shown as violet spheres. The key distance between one of the ions and GluTMH5d in the Na+/H+ coupling point is indicated. A large cavity between MrpAC and MrpF is indicated as NaC.
Figure 4—figure supplement 1
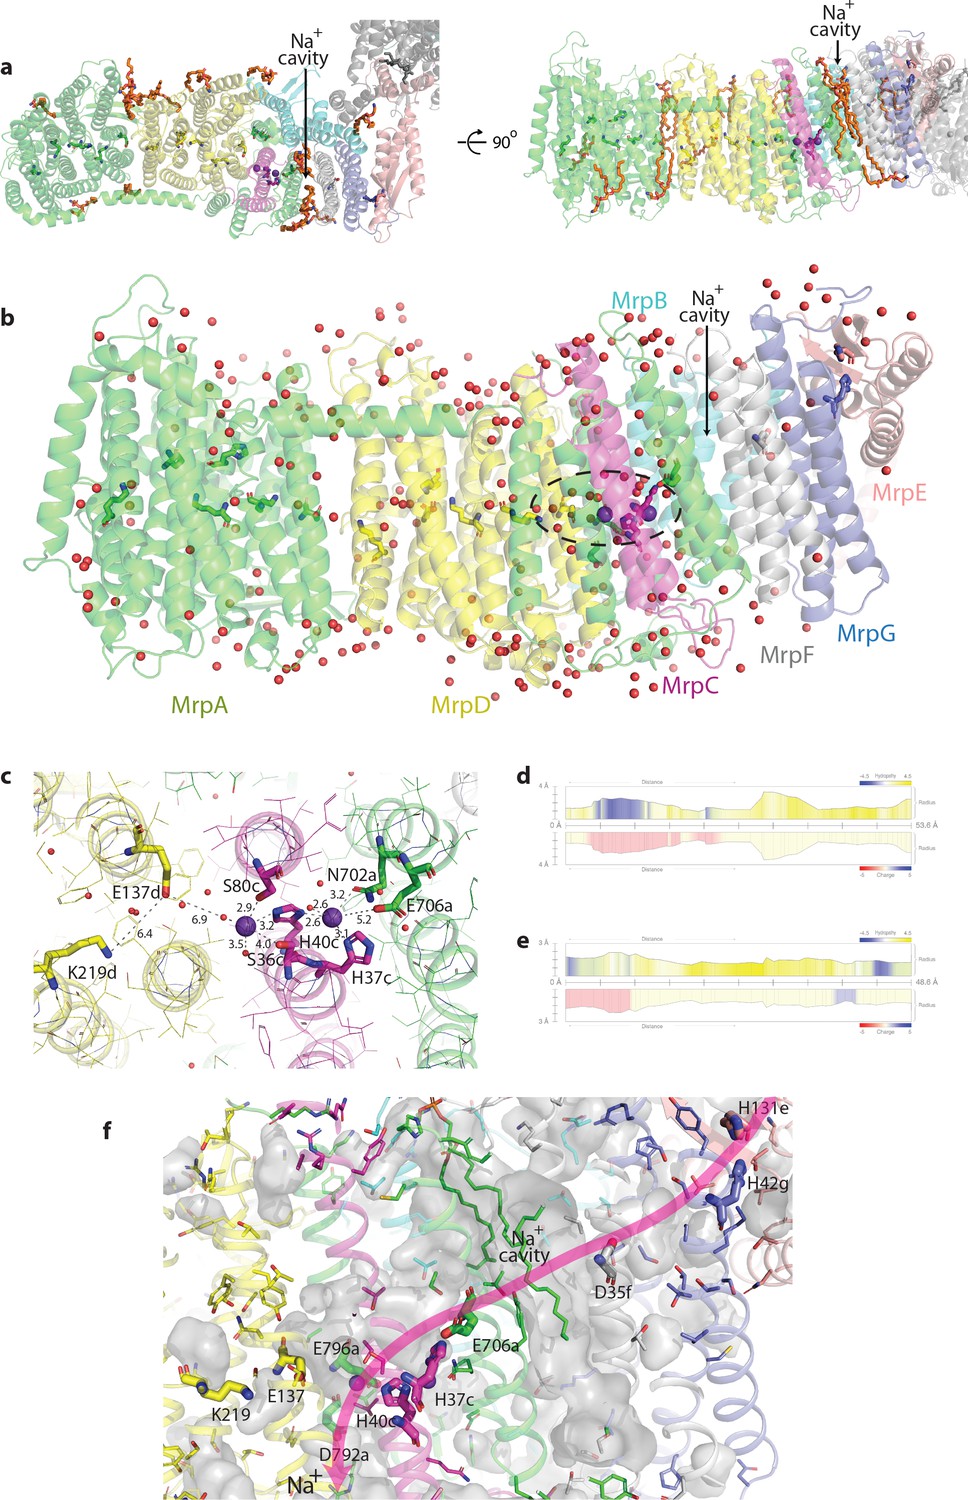
Bound lipids, waters and ions; Na+ pathway.
(a) Top and side view of Mrp showing the identified lipid molecules (depicted in orange stick representation), some of which partly fill the Na+ cavity between MrpAC and MrpF. Na+ ions bound in the neighbouring double cavity are depicted as violet spheres. (b) Experimentally identified (present in cryo-EM density) water molecules, shown as red spheres. Residues forming putative proton and Na+ translocation channels are shown in stick representation. Na+ ions are depicted as violet spheres. H+/Na+ coupling point is indicated by the dashed oval. (c) Detailed view of the Na+-binding sites in the double cavity. Experimentally observed K+ ions with coordinating bonds are shown. Distances for important electrostatic interactions with E706a, E137d and K219d are also indicated. (d and e) The profiles of the putative Na+ tunnels calculated in MOLE 2.5. (d) The first tunnel, shown in red in Figure 2d, starts near H37c (on the left in profile), passes through a negatively charged area (due to E706a) and a large cavity before exiting into the cytoplasm. (e) The second tunnel, shown in orange in Figure 2d, starts near H40c (on the left in profile) in the cavity negatively charged due to E137d and passes between MrpD and MrpC before exiting into the periplasm. (f) Detailed view of the Na+ path. Side-chains of additional polar residues lining the path are shown as thin sticks. Internal cavities are shown in grey, with lipids partially filling Na+ cavity shown as sticks. Key charged residues along the path are shown as thick sticks and labelled. H131e and H42g build the Na+ entrance site, D35f, the negatively charged Na+ cavity and E706a build the connection to H37c and H40c at the coupling point. The Na+ pathway is completed by E796a and D792a, which build the Na+ exit site.
Figure 4—figure supplement 2
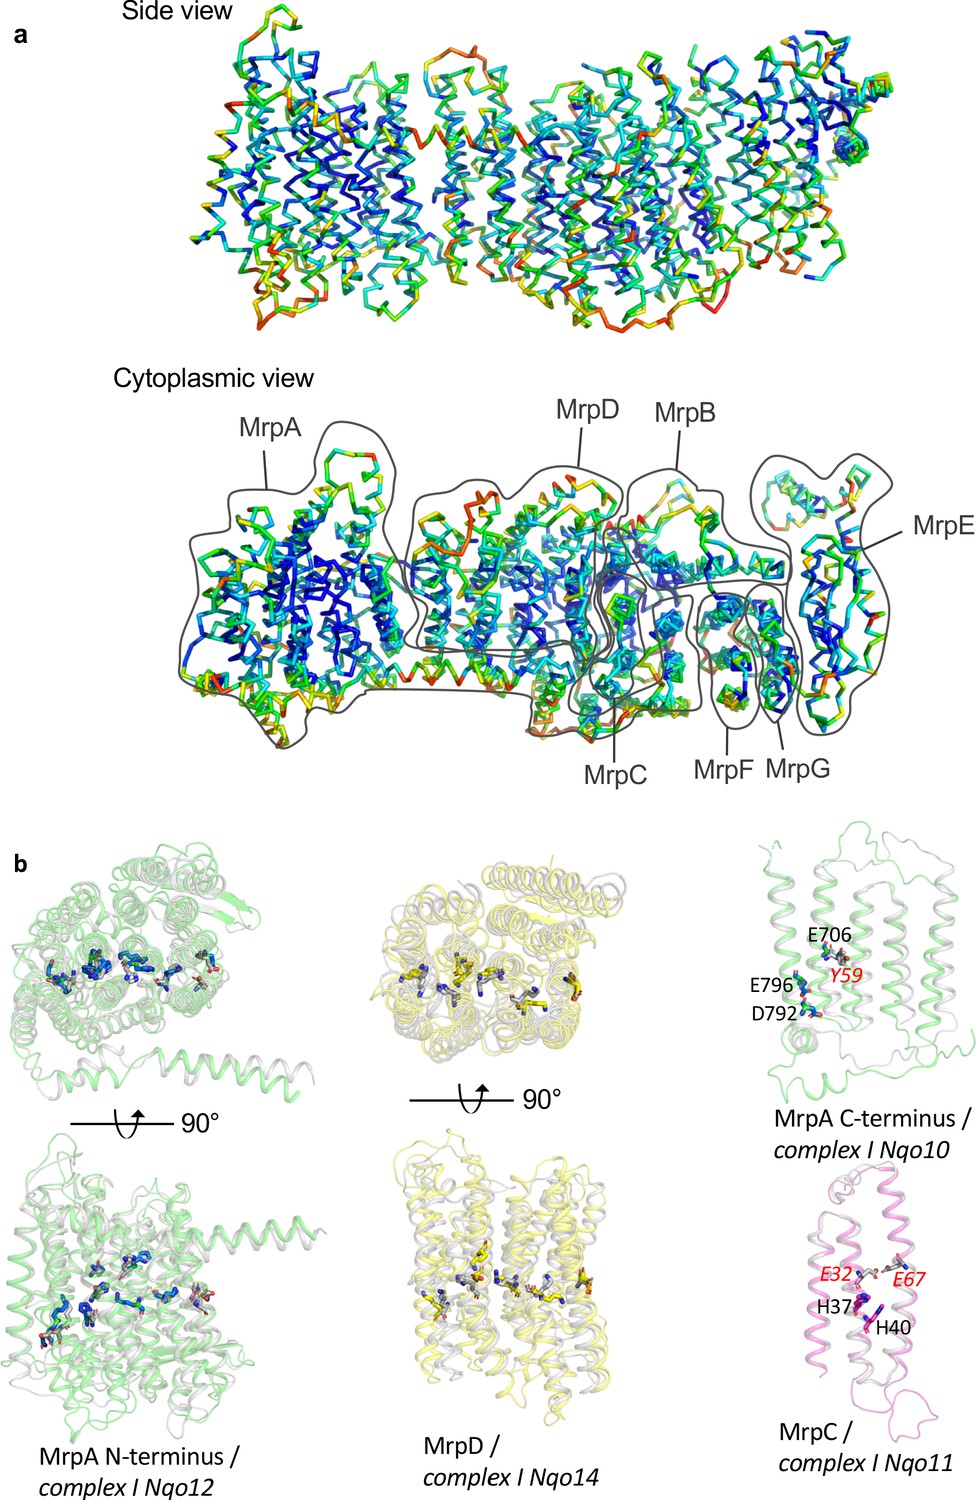
Conservation patterns.
(a) Mrp monomer structure coloured according to residue conservation scores calculated in Consurf, blue to red from high to low conservation. The highest conserved regions are the inner core of Mrp and the residues along the proposed Na+ pathway. (b) Overlay of Mrp subunits with homologous subunits from complex I. Mrp subunits are coloured while complex I subunits are in grey. MrpAN and MrpD are shown in top and side view, while MrpAC and MrpC only in side view. Key residues important for H+ translocation and Na+ binding in Mrp, as well as the corresponding homologous residues of complex I are depicted in stick representations.
Figure 4—figure supplement 3
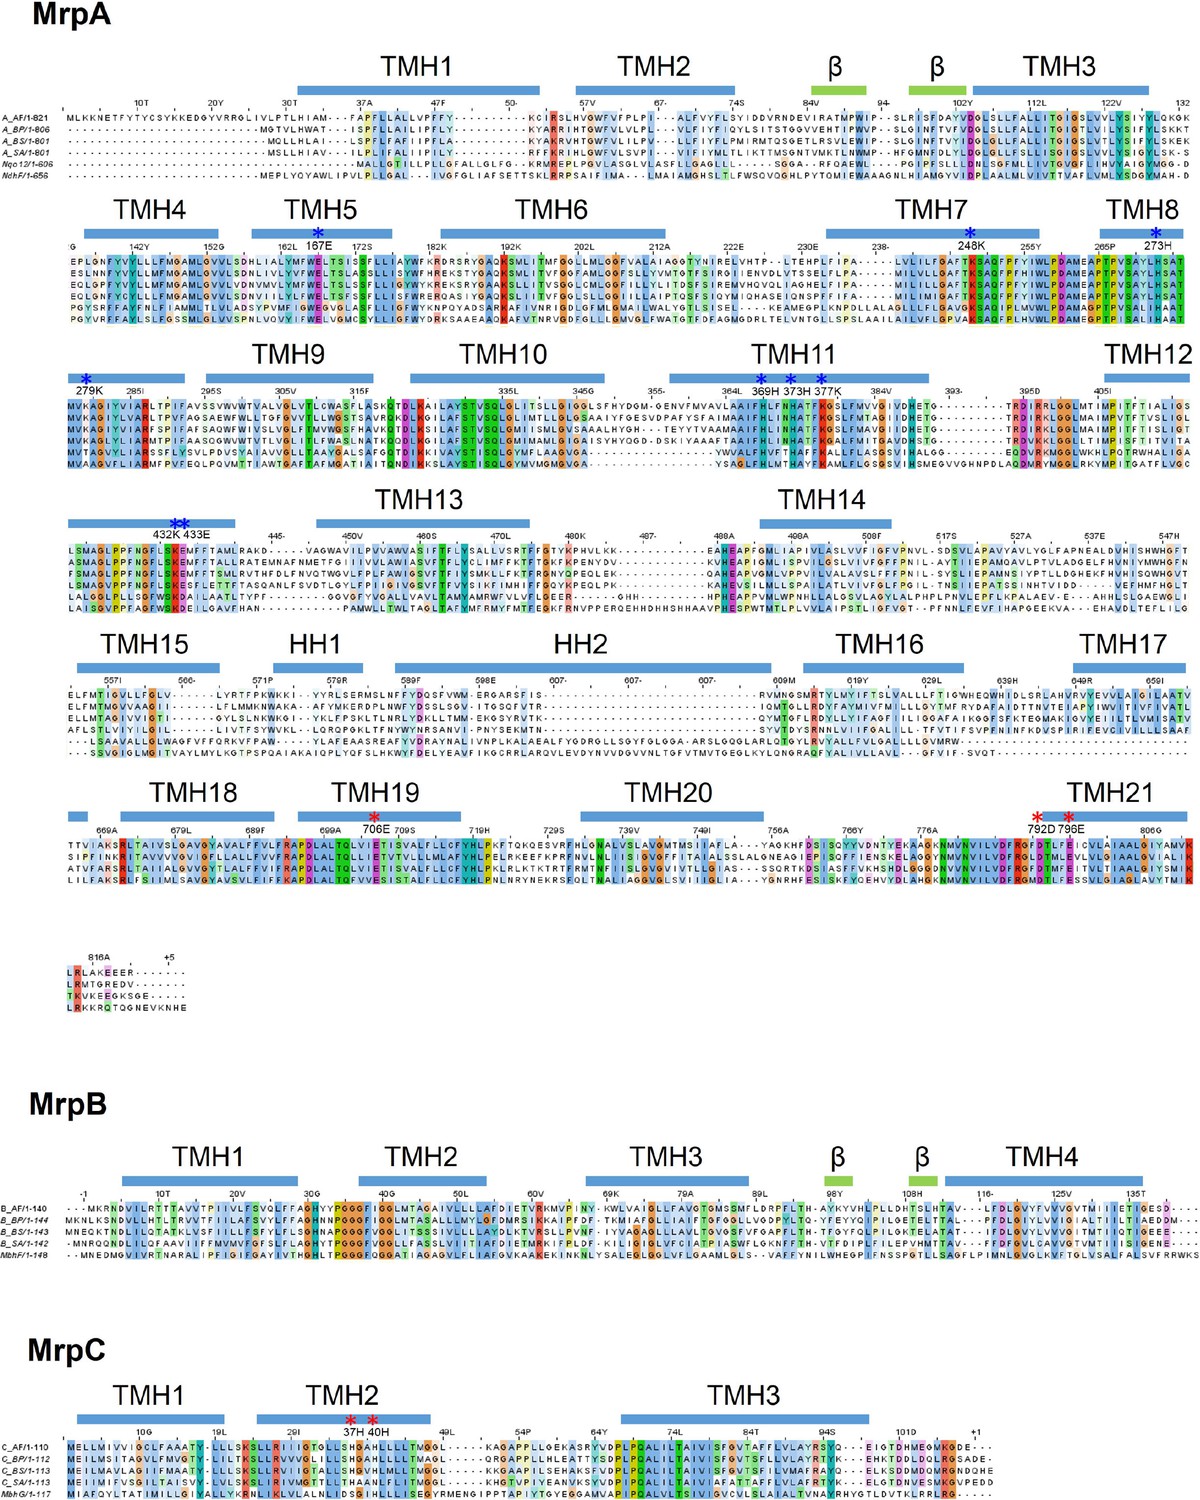
Sequence alignment of Mrp subunits.
Sequences from Anoxybacillus flavithermus WK1 (AF), Bacillus pseudofirmus OF4 (BP), Bacillus subtilis (BS) and Staphylococcus aureus (SA) are shown. Where applicable, subunits of T. thermophilus HB8 complex I (Nqo), Thermosynechococcus elongatus (strain BP-1) NDH complex (Ndh) and Pyrococcus furiosus COM1 MBH complex (Mbh) are also added. Transmembrane helices, beta strands and horizontal (amphipathic) helices are depicted as blue bars above the corresponding sequence. Residues which are involved in proton translocation are depicted with blue asterisks. Residues which form part of the proposed Na+ pathway are depicted with red asterisks.
Figure 4—figure supplement 4
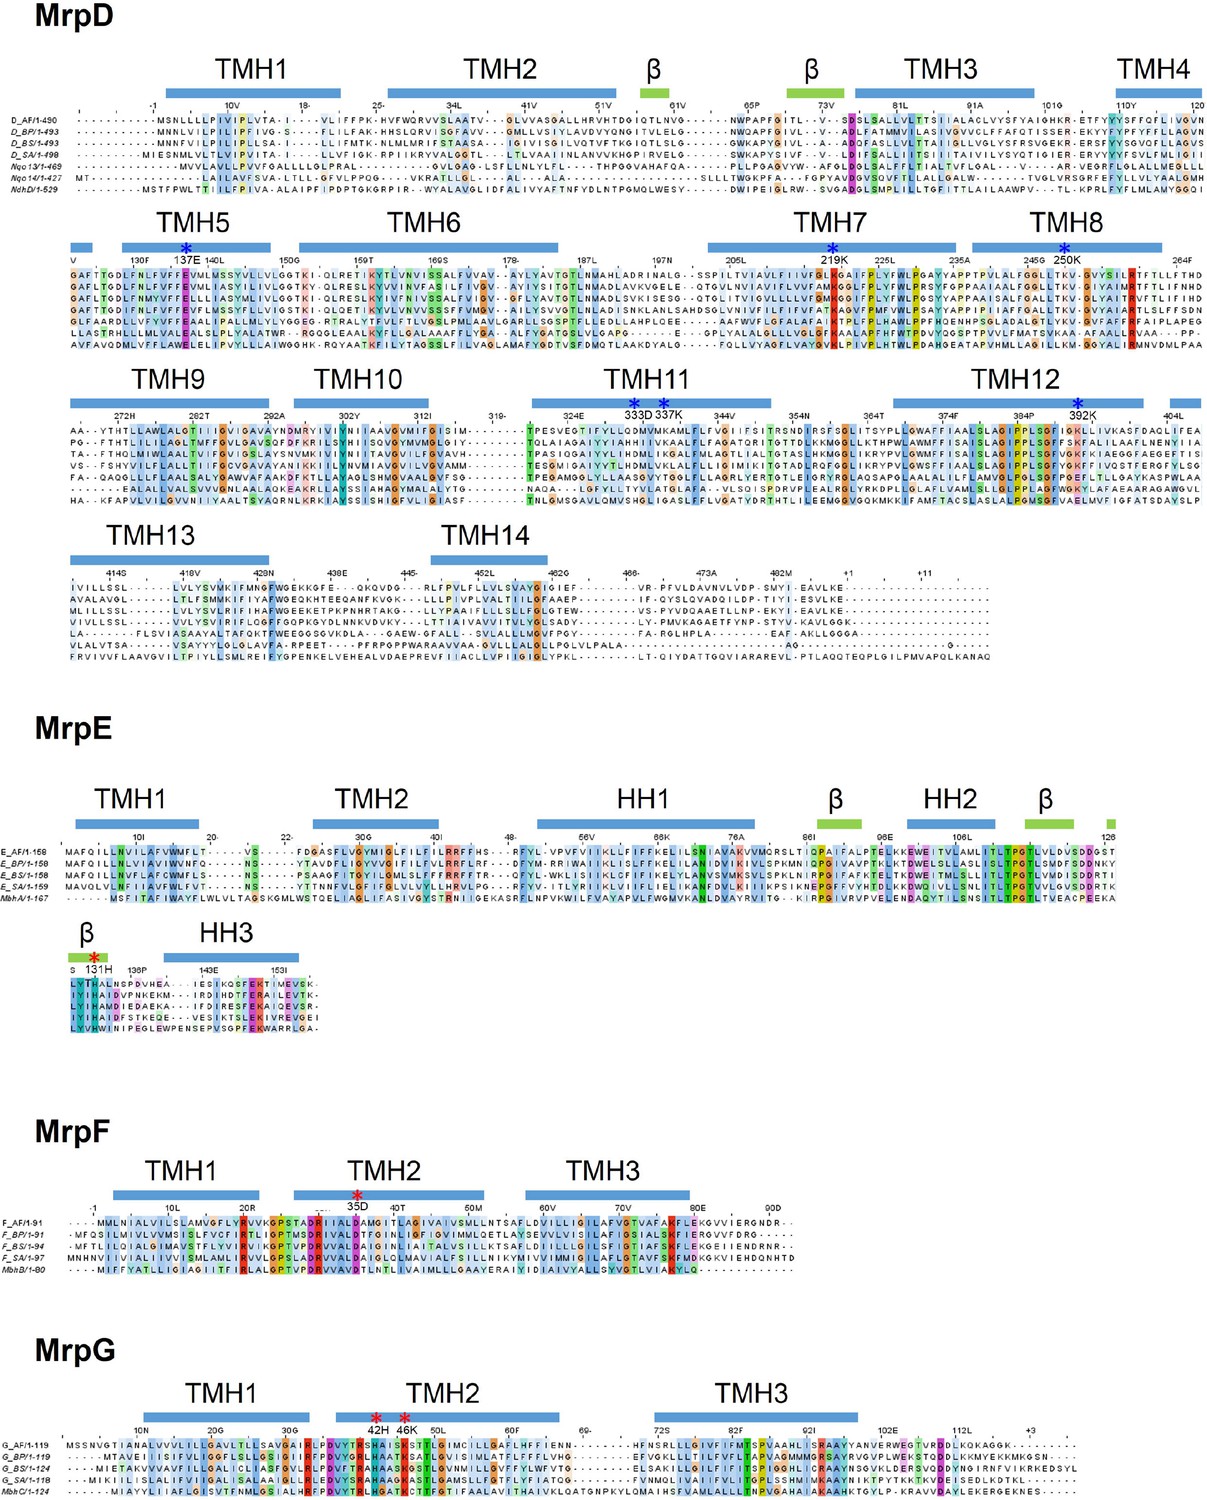
Sequence alignment of Mrp subunits.
Sequences from Anoxybacillus flavithermus WK1 (AF), Bacillus pseudofirmus OF4 (BP), Bacillus subtilis (BS) and Staphylococcus aureus (SA) are shown. Where applicable, subunits of T. thermophilus HB8 complex I (Nqo), Thermosynechococcus elongatus (strain BP-1) NDH complex (Ndh) and Pyrococcus furiosus COM1 MBH complex (Mbh) are also added. Transmembrane helices, beta strands and horizontal (amphipathic) helices are depicted as blue bars above the corresponding sequence. Residues which are involved in proton translocation are depicted with blue asterisks. Residues which form part of the proposed Na+ pathway are depicted with red asterisks.
Figure 5
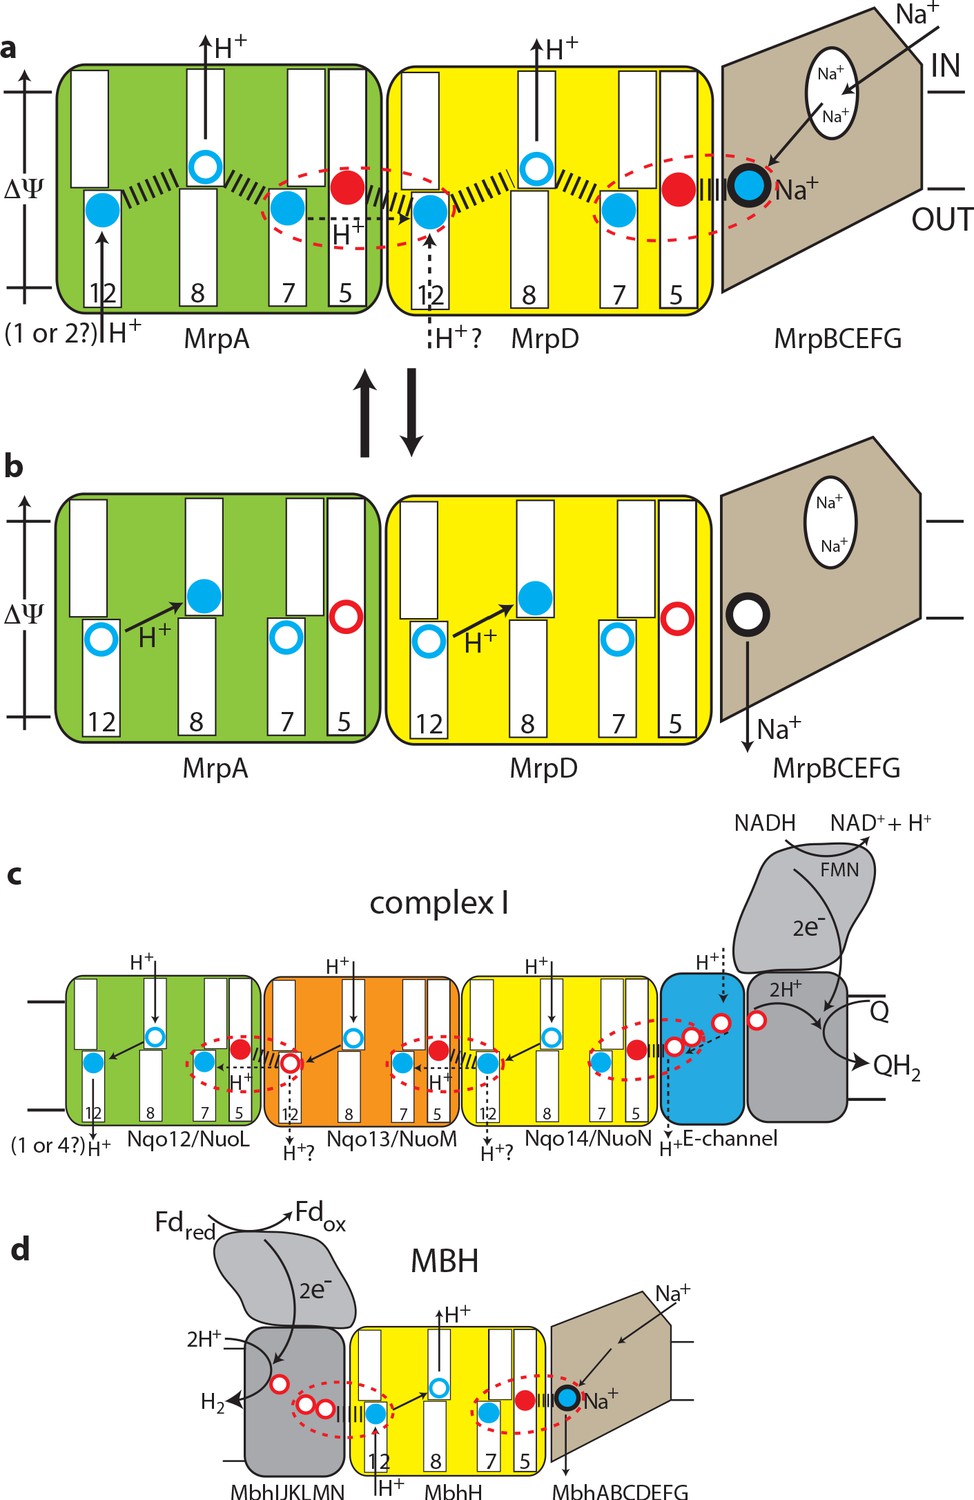
The antiport mechanism of the Mrp complex and its conservation in complex I and MBH.
(a) A likely state of the Mrp complex in the current structure, as a part of the catalytic cycle. Key glutamates from the central axis are shown as red circles and key lysines as blue circles, with charged state depicted by filled circle and neutral state by empty circle. Key helices where these residues sit are numbered and shown as broken where applicable. Coupling points are indicated by red dashed ovals. Electrostatic interactions are indicated as thick dashed lines. Possible lateral re-distribution of protons between MrpA and MrpD is indicated as alternative to the direct entry of protons to MrpD from the periplasm. Na+ ion (blue) is bound in the coupling point and the large Na+ cavity mid-pathway is indicated as an empty oval. A sequence of events leading up to this state is described in the text. (b) An alternative state of the Mrp complex as another part of the catalytic cycle. Na+ ion is expelled into the periplasm and coupling points become neutral. (c) Complex I contains one additional MrpD-like subunit (orange, Nqo13/NuoM), with the change of LysTMH12 to glutamate. The coupling points between the APLS are conserved and the coupling point with Na+ is replaced by coupling to the charge of glutamates in the E-channel. (d) MBH instead of a MrpA-like subunit contains a [NiFe] hydrogenase module, which oxidises ferredoxin and reduces protons to hydrogen. This module has a chain of glutamates similarly to complex I and their charge likely boosts proton translocation into the cell (opposite direction to complex I) via the modified coupling point (red dashed oval on the left). The H+/Na+ coupling point and mechanism are retained from the Mrp.
Tables
Table 1
Cryo-EM data collection, refinement and validation statistics.
| Data collection and processing | ||
|---|---|---|
| Magnification | 105000 | |
| Voltage (kV) | 300 | |
| Electron exposure (e-/Å2) | 85 | |
| Defocus range (μm) | 0.6–2.3 | |
| Pixel size (Å) | 0.84 | |
| Symmetry imposed | C1 | |
| Initial particle images (no.) | 889272 | |
| Final particle images (no.) | 285688 | |
| Map resolution (Å) | 2.98 | |
| FSC threshold | 0.143 | |
| Map resolution range (Å) | 2.85–4.2 | |
| Refinement | Monomer | Dimer |
| Initial model used (PDB code) | 6CFW, 4HEA | 6CFW, 4HEA |
| Model resolution (Å) | 2.97 | 3.04 |
| FSC threshold | 0.5 | 0.5 |
| Map sharpening B factor (Å) | −42, local resolution-filtered | −42 |
| Model composition | ||
| Non-hydrogen atoms | 15448 | 30250 |
| Protein residues | 1873 | 3730 |
| Ligands | 510 | 1020 |
| Waters | 242 | 0 |
| B factors (Å2) | ||
| Protein | 88.4 | 74.4 |
| Ligand | 139.1 | 123.4 |
| Waters | 89.8 | N/A |
| R.m.s. deviations | ||
| Bond lengths (Å) | 0.0080 | 0.0078 |
| Bond angles (°) | 1.32 | 1.33 |
| Validation | ||
| MolProbity score | 1.47 | 1.31 |
| Clashscore | 3.58 | 2.17 |
| Poor rotamers (%) | 0.13 | 0.10 |
| Ramachandran plot | ||
| Favoured (%) | 95.44 | 95.45 |
| Allowed (%) | 4.56 | 4.55 |
| Disallowed (%) | 0 | 0 |
| EMRinger score | 3.73 | 3.61 |
Key resources table
| Reagent type (species) or resource | Designation | Source or reference | Identifiers | Additional information |
|---|---|---|---|---|
| Gene (Thermus thermophilus) | HB8, ATCC 27634, DSM 579 | Uniprot | Nqo12: Q56227 Nqo13: Q56228 Nqo14: Q56229 | Multiple sequence alignments |
| Gene (Pyrococcus furiosus) | COM1, DSM 3638 | pdb FASTA sequence | 6CFW | Multiple sequence alignments |
| Gene (Bacillus pseudofirmus) | Strain OF4 | Uniprot | MrpA: Q9RGZ5 MrpB: Q9RGZ4 MrpC: Q9RGZ3 MrpD: Q9RGZ2 MrpE: Q9RGZ1 MrpF: Q9RGZ0 MrpG: Q9RGY9 | Multiple sequence alignments |
| Gene (Bacillus subtilis) | 168 | Uniprot | MrpA: Q9K2S2 MrpB: O05259 MrpC: O05260 MrpD: O05229 MrpE: Q7WY60 MrpF: O05228 MrpG: O05227 | Multiple sequence alignments |
| Gene (Staphylococcus aureus) | 1280 | Uniprot | MrpA: Q9ZNG6 MrpB: P60678 MrpC: P60682 MrpD: P60686 MrpE: P60690 MrpF: P60694 MrpG: P60698 | Multiple sequence alignments |
| Gene (Thermosynechococcus elongatus) | BP-1 | Uniprot | NdhF1: Q8DKX9 NdhD1: Q8DKY0 | Multiiple sequence alignments |
| Sequence-based reagent | MrpF D35L | This paper | PCR primers | Forward: CGCTTATTTTTTACTATATATGTTGAAAAAAAATGAAAC Reverse: GCAAGCGTAATGCCCATCGCTAAGAGCGCGATAATACGATCCG Forward: CGGATCGTATTATCGCGCTCTTAGCGATGGGCATTACGCTTGC Reverse: ATATAGTAAAAAATAAGCG |
| Sequence-based reagent | MrpG S72W | This paper | PCR primers | Forward: CGCTTATTTTTTACTATATATGTTGAAAAAAAATGAAAC Reverse: CACGATGCCAAGCAATAGACGCCAGTTGAAATGGTTATTTTCAATG Forward: CATTGAAAATAACCATTTCAACTGGCGTCTATTGCTTGGCATCGTG Reverse: ATATAGTAAAAAATAAGCG |
| Sequence-based reagent | MrpE L41W | This paper | PCR primers | Forward: CGCTTATTTTTTACTATATATGTTGAAAAAAAATGAAAC Reverse: GCGCGAATGGAAAAAGCGACGCCATATAAAAAGAATAAACAGCCCGATCATGTAC Forward: GTACATGATCGGGCTGTTTATTCTTTTTATATGGCGTCGCTTTTTCCATTCGCGC Reverse: ATATAGTAAAAAATAAGCG |
| Strain, strain background (Escherichia coli) | KNabc | doi:10.1073/pnas.84.9.2615 | Expression and assay strain | |
| Transfected construct (Anoxybacillus flavithermus) | DSM 21510/WK1 | Other | Uniprot MrpA: B7GL84 MrpB: B7GL83 MrpC: B7GL82 MrpD: B7GL98 MrpE: B7GL97 MrpF: B7GL96 MrpG: B7GIG3 | Prof. Masahiro Ito (Graduate School of Life Sciences, Toyo University, Japan) |
| Software, algorithm | SerialEM | doi:10.1016/j.jsb.2005.07.007 | Data Acquisition Software for a variety of data from electron microscopes | |
| Software, algorithm | Relion | doi:10.1016/j.jsb.2012.09.006 | Cryo-EM processing software | |
| Software, algorithm | CTFFIND4 | doi:10.1016/j.jsb.2015.08.008 | Defocus estimation software | |
| Software, algorithm | Gctf | doi:10.1016/j.jsb.2015.11.003 | Per-particle CTF estimation software | |
| Software, algorithm | USCF Chimera | doi:10.1002/jcc.20084 | Visualisation software of molecular structures and cryo-EM maps | |
| Software, algorithm | Coot | doi:10.1107/S0907444904019158 | Software for model building | |
| Software, algorithm | PHENIX | doi:10.1107/S0907444909052925 | Structure refinement software | |
| Software, algorithm | MotionCor2 | doi:10.1038/nmeth.4193 | Whole frame image motion correction software |
Additional files
-
Supplementary file 1
Supplementary tables 1–3.
- https://cdn.elifesciences.org/articles/59407/elife-59407-supp1-v2.docx
-
Transparent reporting form
- https://cdn.elifesciences.org/articles/59407/elife-59407-transrepform-v2.pdf
Download links
A two-part list of links to download the article, or parts of the article, in various formats.
Downloads (link to download the article as PDF)
Open citations (links to open the citations from this article in various online reference manager services)
Cite this article (links to download the citations from this article in formats compatible with various reference manager tools)
Structure and mechanism of the Mrp complex, an ancient cation/proton antiporter
eLife 9:e59407.
https://doi.org/10.7554/eLife.59407


