Specific Neuroligin3–αNeurexin1 signaling regulates GABAergic synaptic function in mouse hippocampus
- Brudnick Neuropsychiatric Research Institute, Department of Neurobiology, University of Massachusetts Medical School, United States
- Department of Cellular Neuropathology, Brain Research Institute, Niigata University, Japan
- Department of Anatomy, Faculty of Medicine, Hokkaido University, Japan
- Department of Biochemistry and Molecular Biology and Institute for Personalized Medicine, Pennsylvania State University College of Medicine, United States
- Department of Animal Model Development, Brain Research Institute, Niigata University, Japan
- Department of Comparative and Experimental Medicine, Brain Research Institute, Niigata University, Japan
- Division of Gene Research, Research Center for Supports to Advanced Science, Shinshu University, Japan
- Institute for Biomedical Sciences, Interdisciplinary Cluster for Cutting Edge Research, Shinshu University, Japan
- Department of Pharmacology Pennsylvania State University College of Medicine, United States
Figures
Figure 1 with 1 supplement
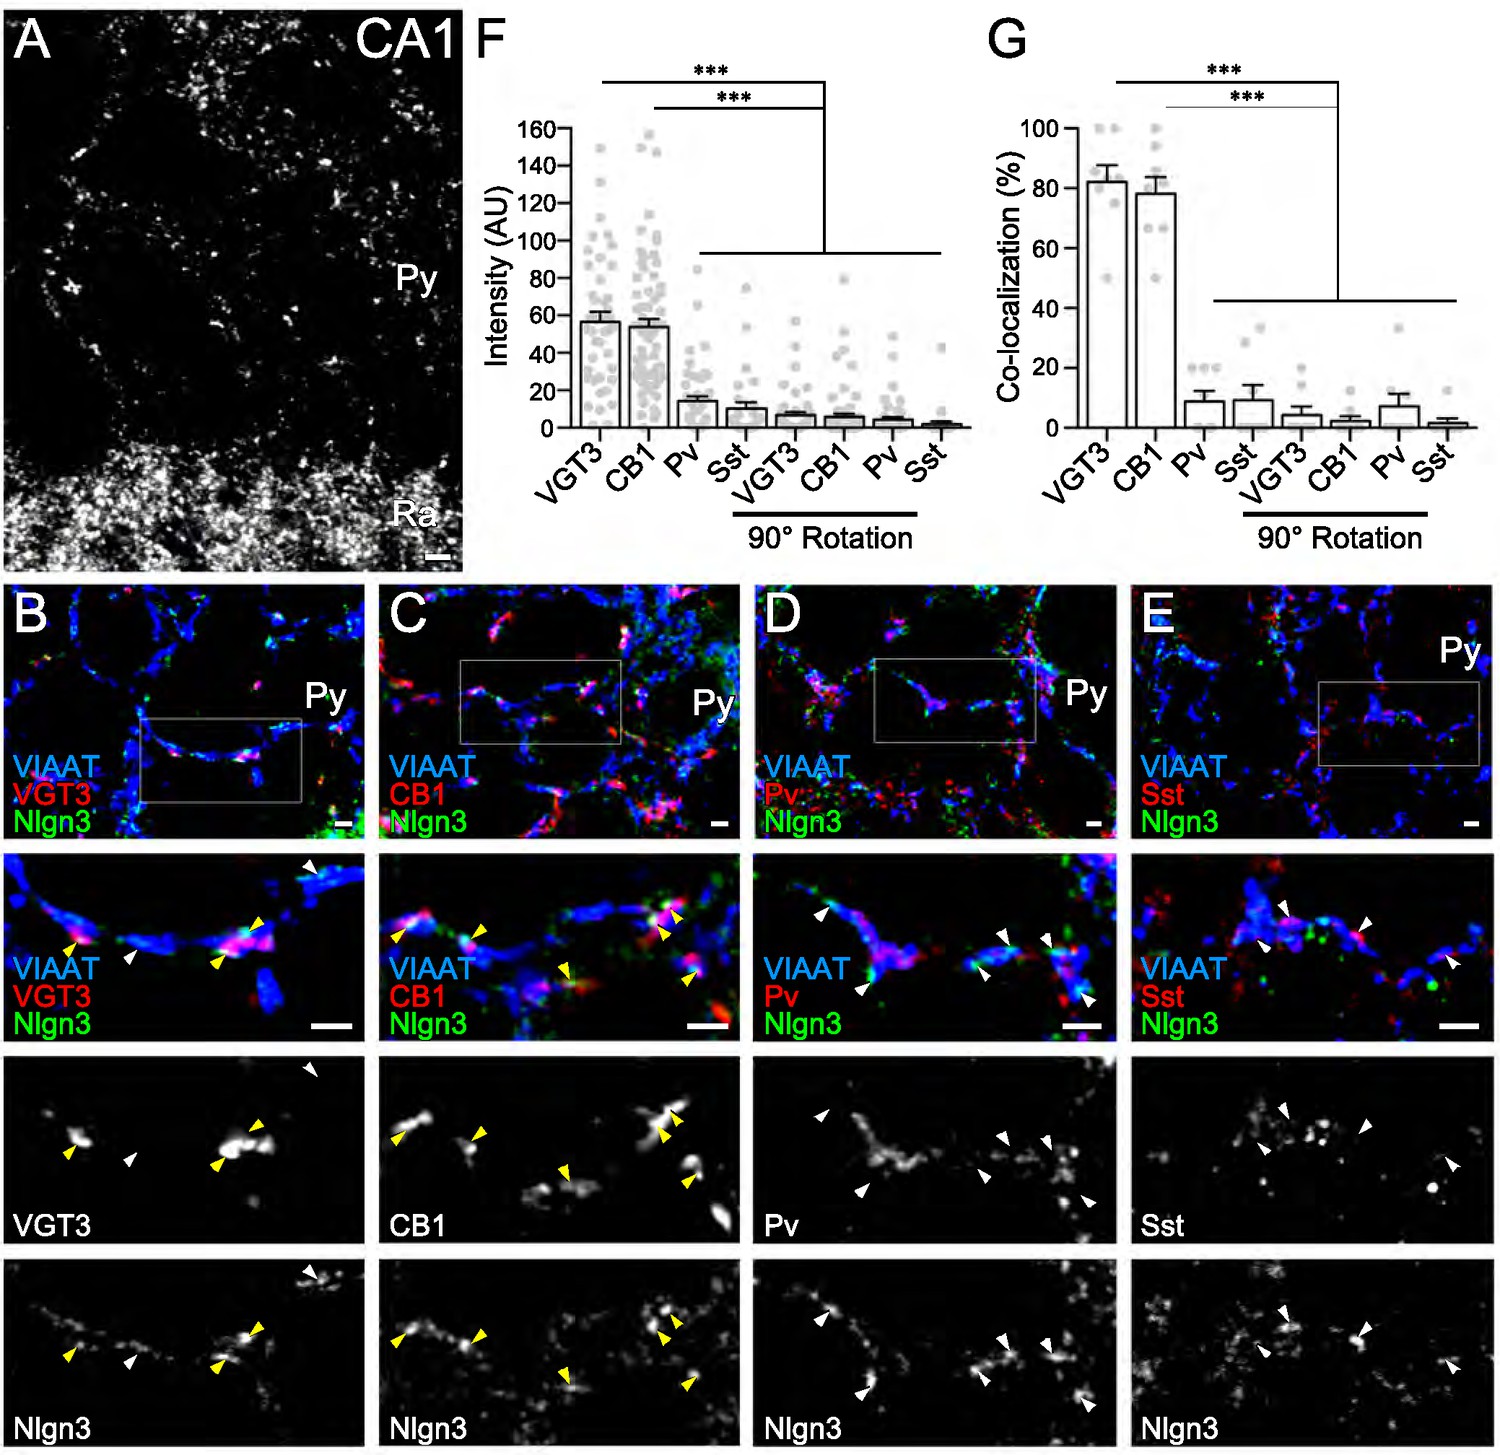
Nlgn3 is predominantly expressed in VGT3+ and CB1+ inhibitory synapses.
(A) Single immunofluorescence of Nlgn3 in the hippocampal CA1 region shows a basket-like clustering of Nlgn3 immunofluorescent signals around the somata of pyramidal cells. Py, st. pyramidale; Ra, st. radiatum. (B–E) Triple immunofluorescence for Nlgn3, VIAAT, and interneuron markers: VGT3 (B), CB1 (C), Pv (D), and Sst (E). The boxed area in low magnification images is enlarged in lower panels. Arrowheads indicate Nlgn3 immunofluorescent puncta associated with (yellow) or distant from (white) interneuron markers. (F and G) Summary of the relative intensity (F) and co-localization frequency (G) of Nlgn3 immunofluorescent signals at different inhibitory synapses. Plots are obtained from each synapse for intensities (F) or image for co-localizations (G). Noise levels for the intensity and co-localization were obtained from images with the Nlgn3 channel rotated 90° (90° rotation). ***p<0.001; n.s. not significant; One-way ANOVA with Sidak’s post hoc test. Bars on each column represent mean ± SEM. Scale bars, 100 μm (A) and 2 μm (B–E).
Figure 1—figure supplement 1
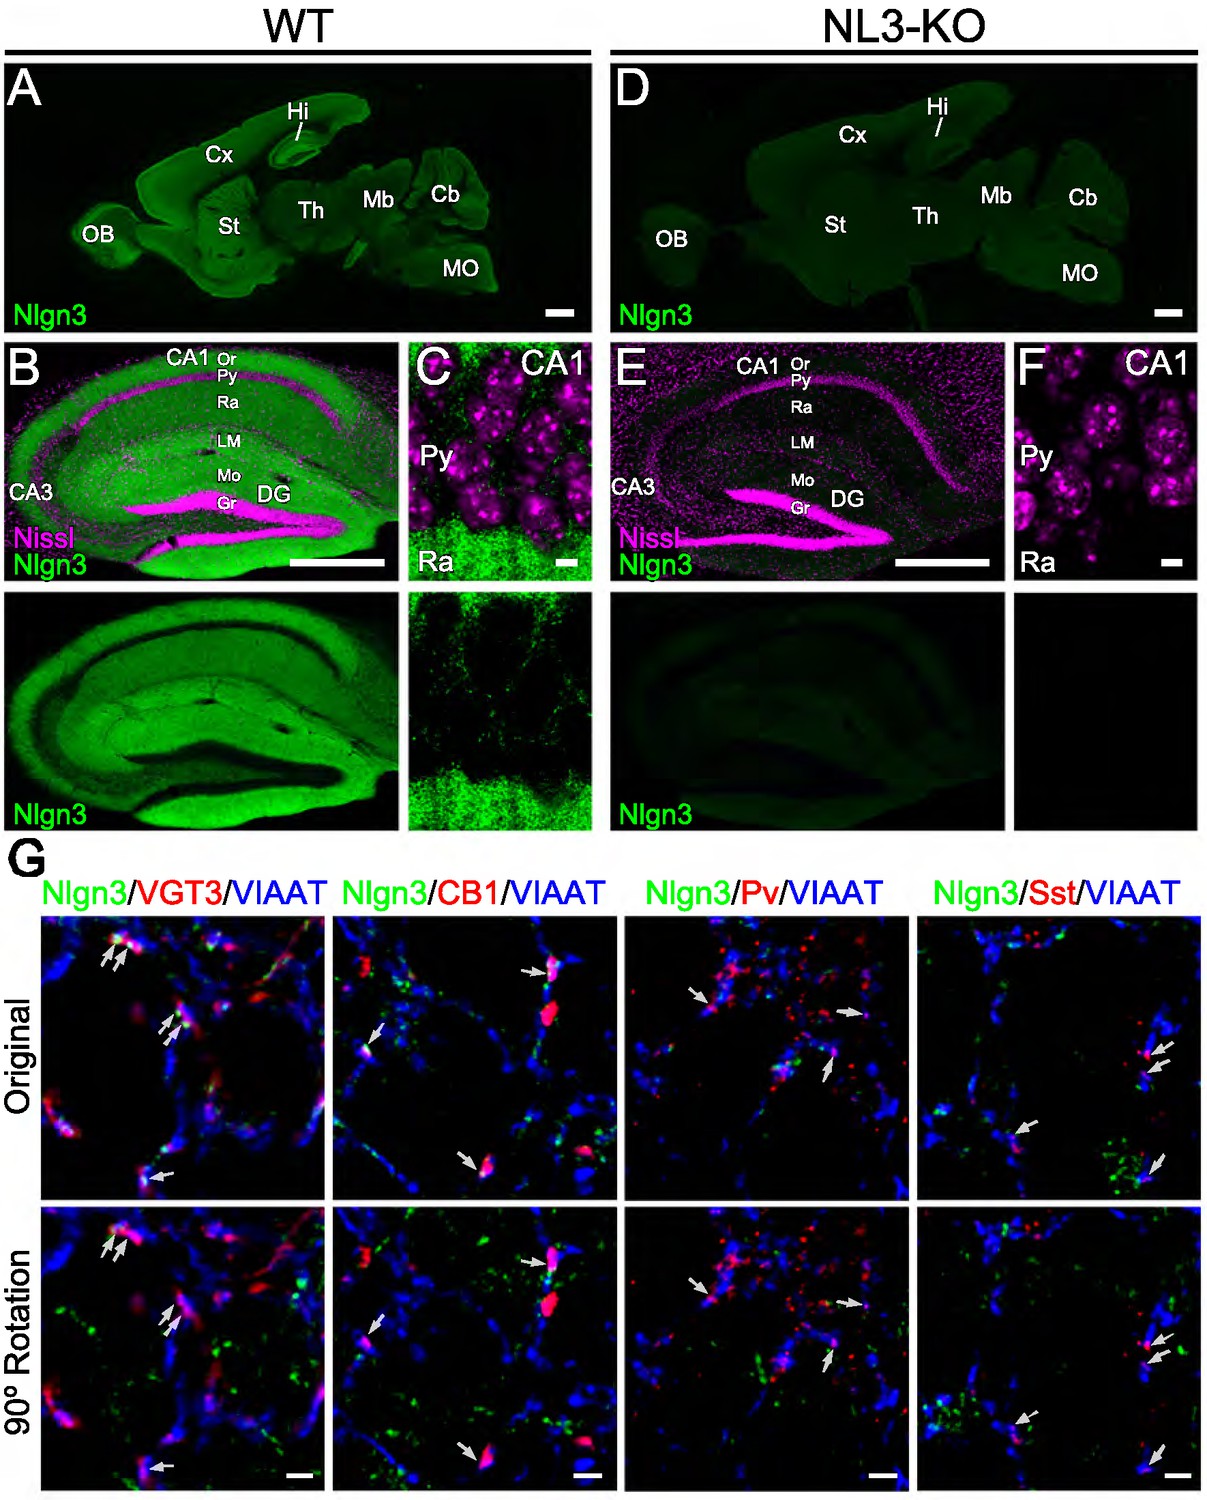
Validation of anti-Nlgn3 antibody.
Single immunofluorescent images of Nlgn3 (green) in the whole brain (A and D), hippocampal formation (B and E), and CA1 region (C and F) of P21 wild-type (A–C, WT) and Nlgn3 knockout (D–F, Nlgn3-KO) mice. Nissl staining is magenta. Higher levels are detected in the cortex (A, Cx), striatum (A, St), olfactory bulb (A), (OB), and hippocampal formation (A–C, Hi). In the hippocampus, intense labeling is noted in the st. lacunosum-moleculare (LM) of Ammon's horn and in the molecular layer (Mo) of dentate gyrus (B). This staining is not detected in Nlgn3-KO mice (D–F). (G) The noise levels for intensities and co-localizations of Nlgn3 signals obtained from immunofluorescent images for Nlgn3 (green), VIAAT (blue), and interneuron markers (red) including VGT3, CB1, Pv, and Sst with the Nlgn3 channel rotated 90°. Arrows indicate inhibitory synapses co-labeled with VIAAT and different interneuron markers. CA1–3, CA1–3 regions of the Ammon's horn; Cb, cerebellum; Cx, cerebral cortex; DG, dentate gyrus; Gr, granule cell layer; Hi, hippocampus; Mb, midbrain; MO, medulla oblongata; OB, olfactory bulb; Or, st. oriens; Py, pyramidale; Ra, st. radiatum; St, striatum; Th, thalamus. Scale bars, 1 mm (A and D), 500 µm (B and E), 5 µm (C and F), and 2 µm (G).
Figure 2 with 1 supplement
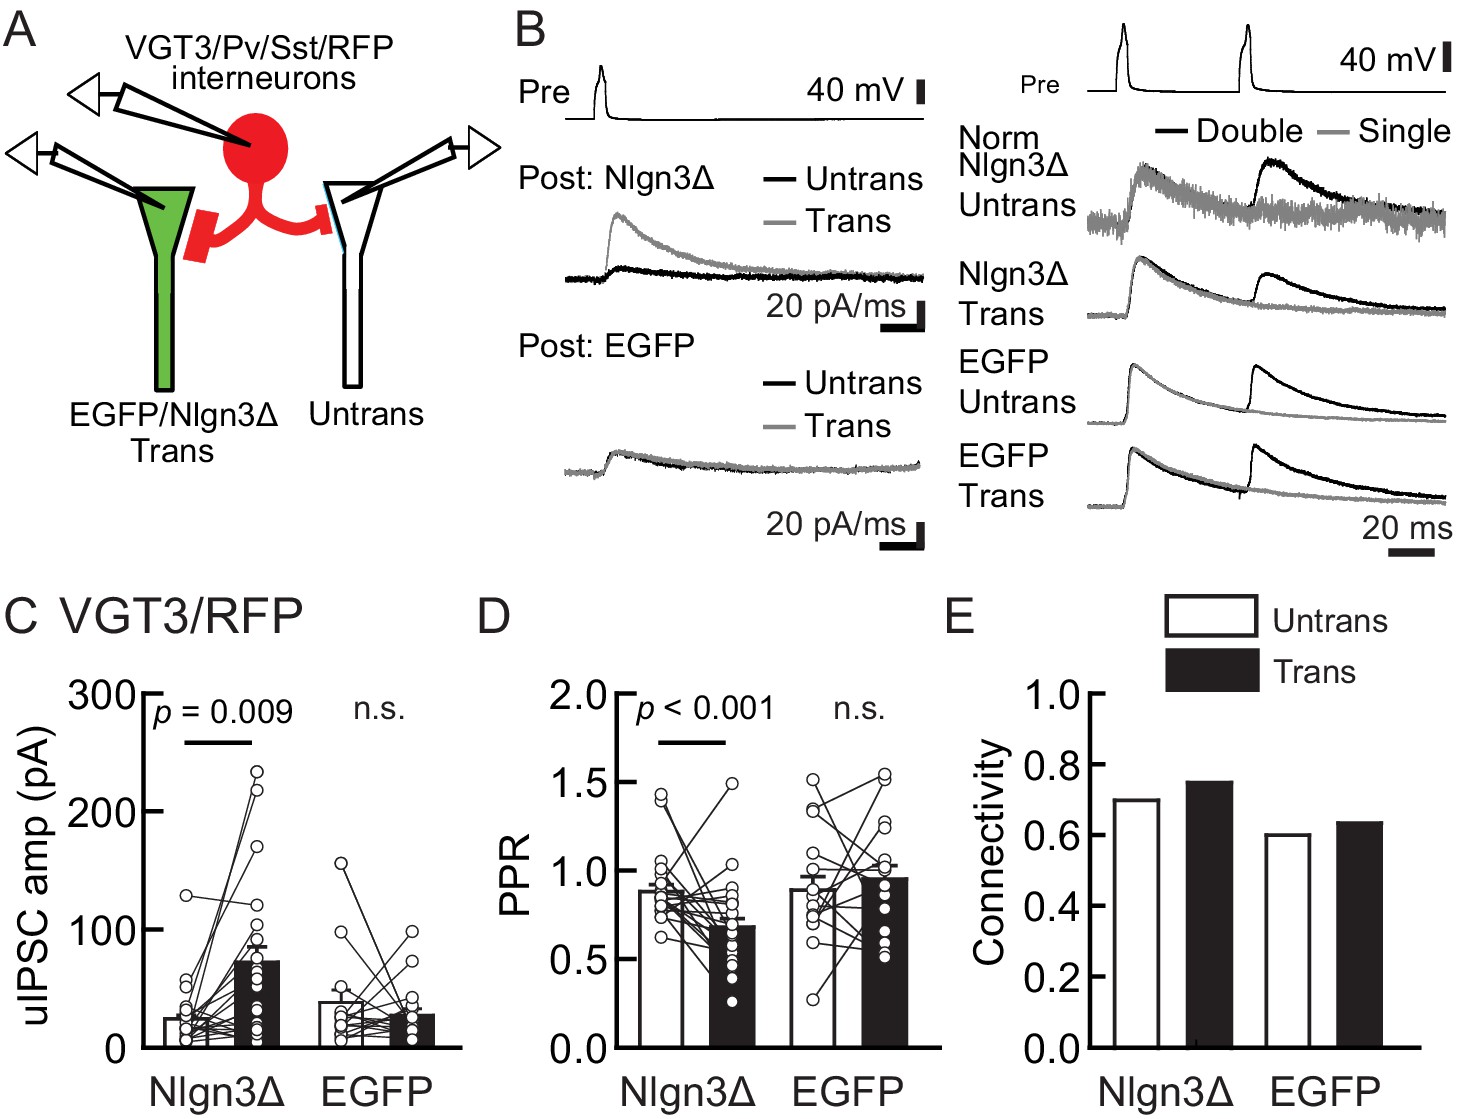
Nlgn3Δ overexpression (OE) specifically potentiates VGT3+ interneuron-mediated unitary synaptic transmission.
The effects of OE of Nlgn3Δ isoform or enhanced green fluorescent protein (EGFP, control) in hippocampal CA1 pyramidal neurons on inhibitory inputs mediated by VGT3+ inhibitory interneurons. (A) Configuration of the triple whole-cell recording for VGT3+, Pv+, and Sst+ interneurons forming synapses with pyramidal neurons. (B) Sample traces of unitary inhibitory postsynaptic currents (uIPSCs). Left top, averaged sample traces of a single presynaptic action potential (AP) evoked in a VGT3+ interneuron. Left middle and bottom, superimposed averaged sample uIPSC traces (Untrans: black; trans: dark gray) induced by an AP. Right, superimposed averaged sample traces of uIPSCs evoked by single (dark gray) and double (black) APs in VGT3+ interneurons. uIPSCs are normalized to the first amplitude. Because the first uIPSC overlaps with the second uIPSC, to accurately measure the amplitude of the second IPSC, we ‘cancelled’ the first uIPSC by subtracting the traces receiving a single pulse (gray) from those receiving a paired pulse (black), both normalized to the first response. The amplitude (C) and paired-pulse ratio (PPR) (D) of uIPSCs were plotted for each pair of transfected (Trans) and neighboring untransfected (Untrans) cells (open symbols). Bar graphs indicate mean ± SEM. (E) Synaptic connectivity between presynaptic inhibitory interneuron and postsynaptic untransfected (open bars) or transfected (black) pyramidal neurons. Numbers of cell pairs: Nlgn3Δ or EGFP at VGT3+ synapses (42 pairs/23 mice and 30/21). The number of tested slice cultures is the same as that of cell pairs. n.s., not significant. Mann–Whitney U-test.
Figure 2—figure supplement 1
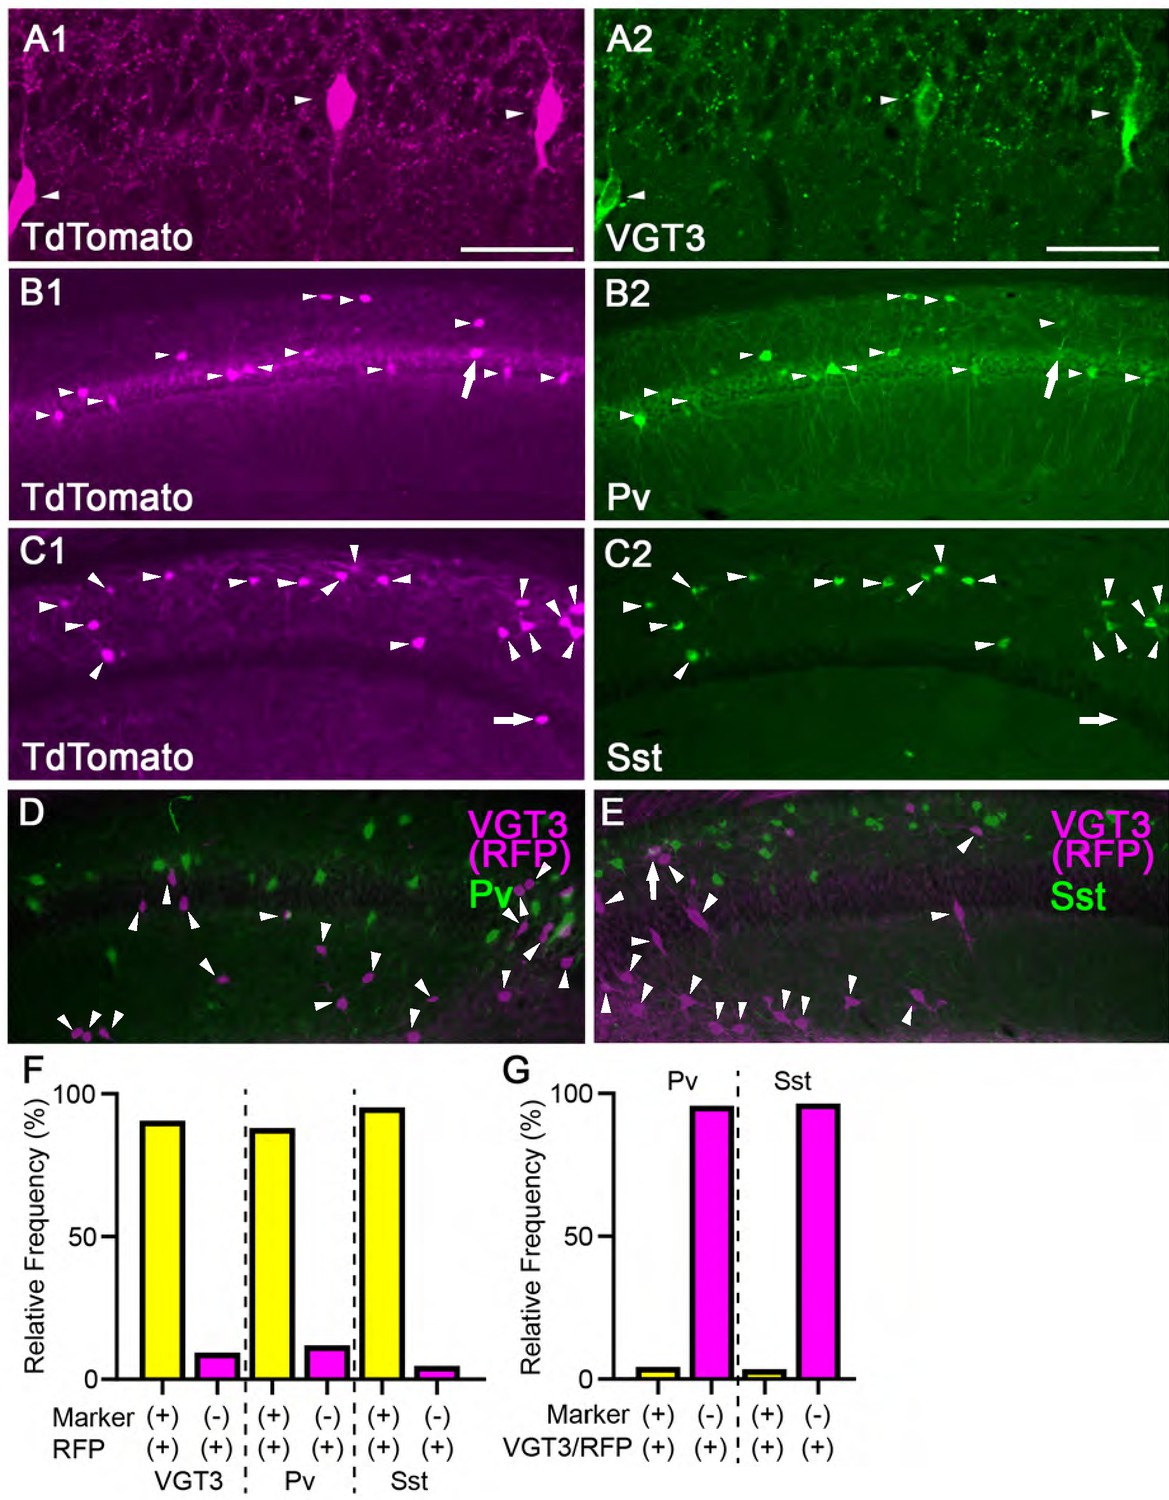
Validation of TdTomato expression in three different cell type-specific fluorescent lines.
(A–C) Images of double-labeled immunofluorescence staining against TdTomato (red, A1, B1, and C1) and cell type-specific markers (green, VGT3: A2, Pv: B2, Sst: C2) in the hippocampal CA1 region of VGT3/RFP (A), Pv/RFP (B), and Sst/RFP (C) mice. (D and E) Images of double-labeled immunofluorescence staining against TdTomato (magenta) and cell type-specific markers (green, Pv: D, Sst: E) in the hippocampal CA1 region of VGT3/RFP mice. (F) Relative proportion of hippocampal CA1 inhibitory interneurons as a fraction of neuronal populations positive for cell type-specific markers and TdTomato (+) and TdTomato-positive but marker negative (−) neurons. The TdTomato-positive neurons included for quantification were localized in the specific CA1 subregions where we performed electrophysiological recordings; VGT3/RFP mice: CA1 pyramidale, radiatum, and oriens; Pv/RFP: radiatum; Sst/RFP: oriens. Number of TdTomato-positive neurons: VGT3/RFP: 404 neurons/2 mice; Pv/RFP: 1601/2; Sst/RFP: 1789/2. (G) Relative proportion of hippocampal CA1 inhibitory interneurons in VGT3/RFP mice as a fraction of neuronal populations positive for Pv or Sst and TdTomato (+) neurons. Number of TdTomato-positive neurons: Pv/RFP staining: 1966/2; Sst/RFP: 1464/2. Scale bars, 50 µm.
Figure 3 with 1 supplement
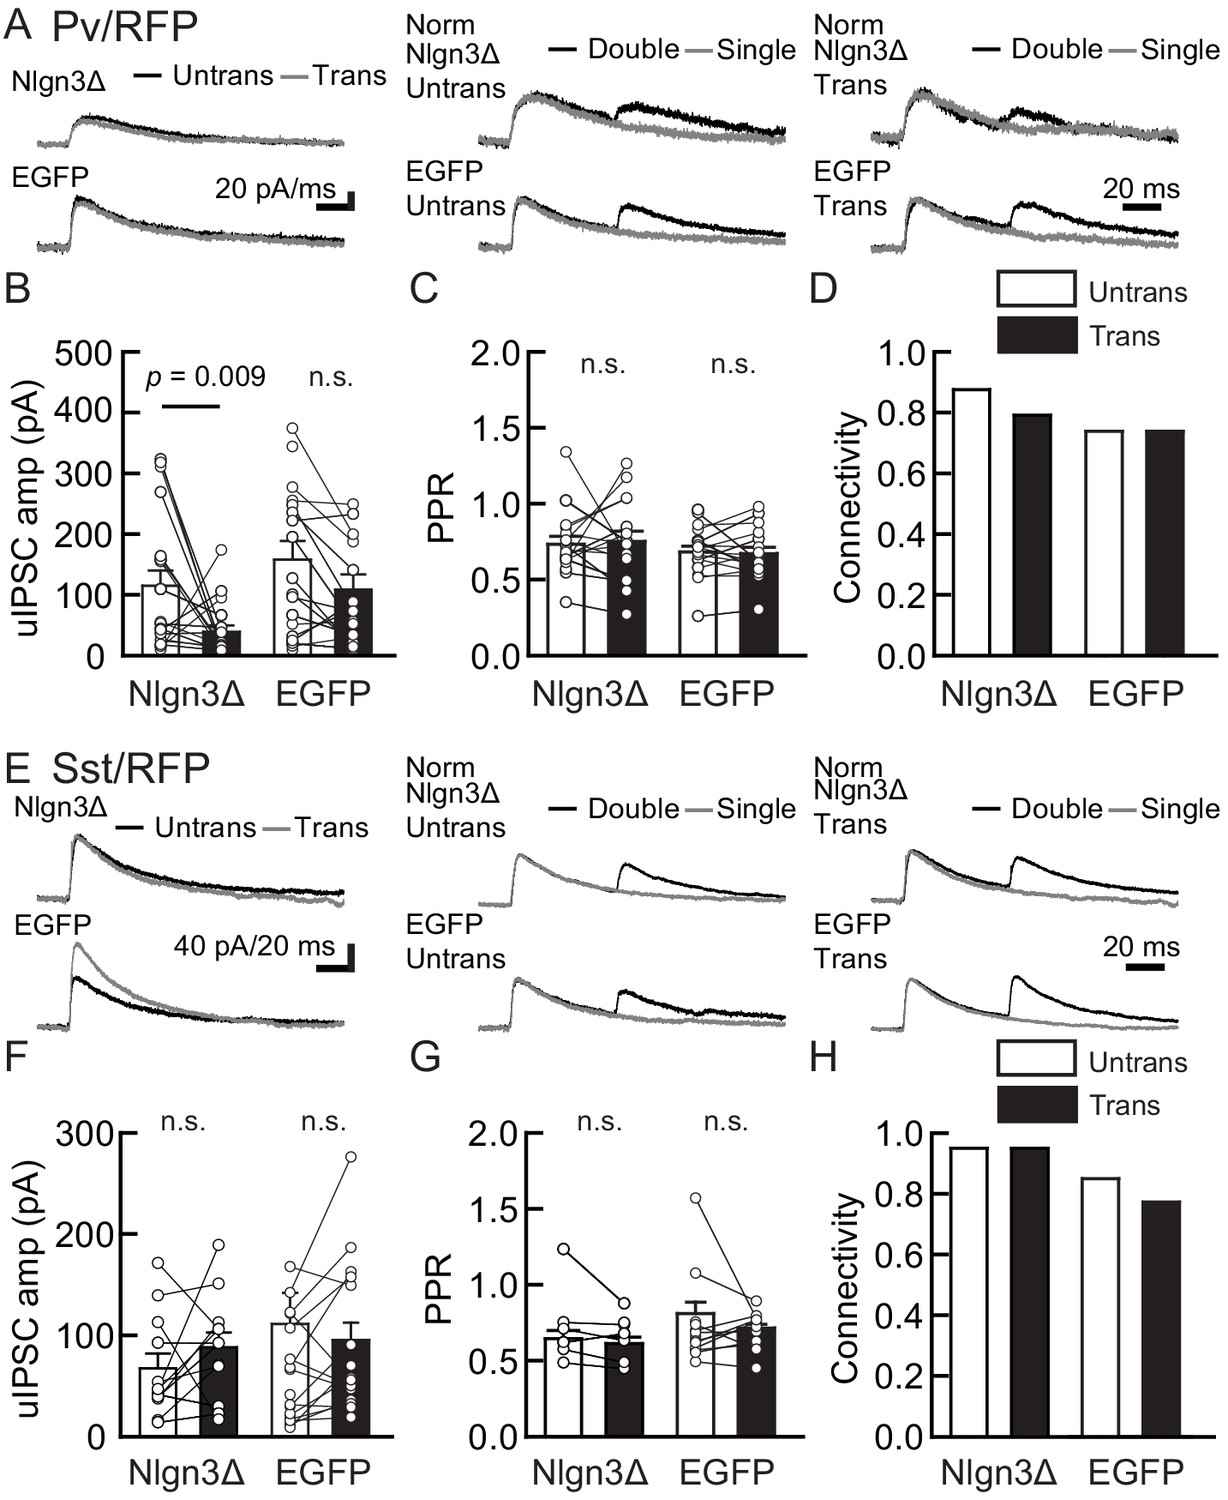
Nlgn3Δ overexpression (OE) does not increase PV+ and Sst+ interneuron-mediated unitary synaptic transmission.
The effects of OE of Nlgn3Δ isoform or enhanced green fluorescent protein (EGFP; control) in hippocampal CA1 pyramidal neurons were compared between inhibitory inputs mediated by Pv+ (A–D) and Sst+ (E–H) inhibitory interneurons. (A and E) Sample traces of unitary inhibitory postsynaptic currents (uIPSCs). Left, superimposed averaged sample uIPSC traces (Untrans: black; trans: dark gray) induced by an action potential (AP). Middle and right, superimposed averaged sample traces of uIPSCs evoked by single (dark gray) and double (black) APs in Pv+ and Sst+ interneurons. uIPSCs are normalized to the first amplitude. The amplitude (B and F) and paired-pulse ratio (PPR) (C and G) of uIPSCs were plotted for each pair of transfected (Trans) and neighboring untransfected (Untrans) cells (open symbols). Bar graphs indicate mean ± SEM. (D and H) Synaptic connectivity between presynaptic inhibitory interneuron and postsynaptic untransfected (open bars) or transfected (black) pyramidal neurons. Numbers of cell pairs: Nlgn3Δ or EGFP at Pv+ synapse (33 pairs/19 mice and 27/20) and Sst+ synapses (20/11 and 26/15). The number of tested slice cultures is the same as that of cell pairs. n.s., not significant. Mann–Whitney U-test.
Figure 3—figure supplement 1
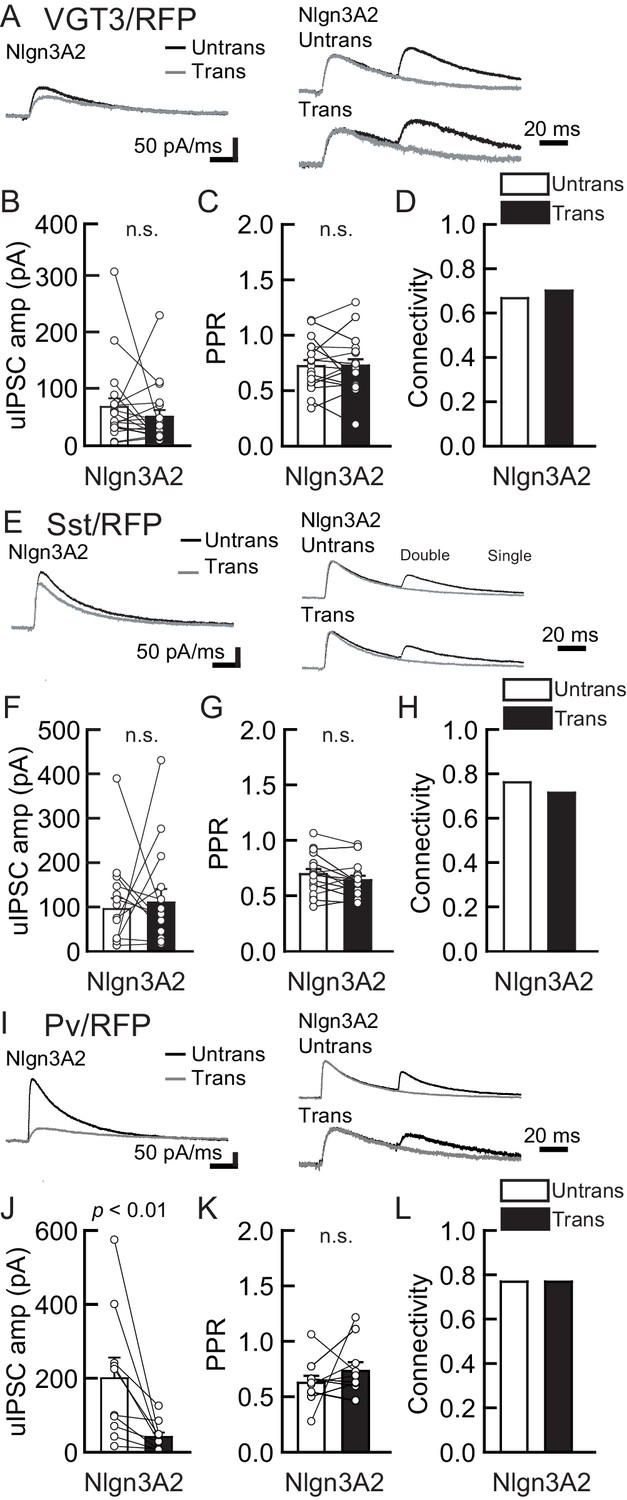
Nlgn3A2 overexpression (OE) does not increase VGT3+, Pv+, and Sst+ interneuron-mediated unitary synaptic transmission.
The effects of Nlgn3A2 isoform OE in hippocampal CA1 pyramidal neurons were compared between inhibitory inputs mediated by VGT3+ (A–D), Pv+ (E–H), and Sst+ (I–L) inhibitory interneurons. (A, E, and I) Sample traces of unitary inhibitory postsynaptic currents (uIPSCs). Left, superimposed averaged sample uIPSC traces (Untrans: black; trans: dark gray) induced by an action potential (AP). Middle and right, superimposed averaged sample traces of uIPSCs evoked by single (dark gray) and double (black) APs in Pv+ and Sst+ interneurons. uIPSCs are normalized to the first amplitude. The amplitude (B, F, and J) and paired-pulse ratio (PPR) (C, G, and K) of uIPSCs were plotted for each pair of transfected (Trans) and neighboring untransfected (Untrans) cells (open symbols). Bar graphs indicate mean ± SEM. (D, H, and L) Synaptic connectivity between presynaptic inhibitory interneuron and postsynaptic untransfected (open bars) or transfected (black) pyramidal neurons. Numbers of cell pairs: Nlgn3A2 at VGT3+ synapse (30 pairs/7 mice), Pv+ synapse (13/4), and Sst+ synapses (21/5). The number of tested slice cultures is the same as that of cell pairs. n.s., not significant. Mann–Whitney U-test.
Figure 4 with 1 supplement
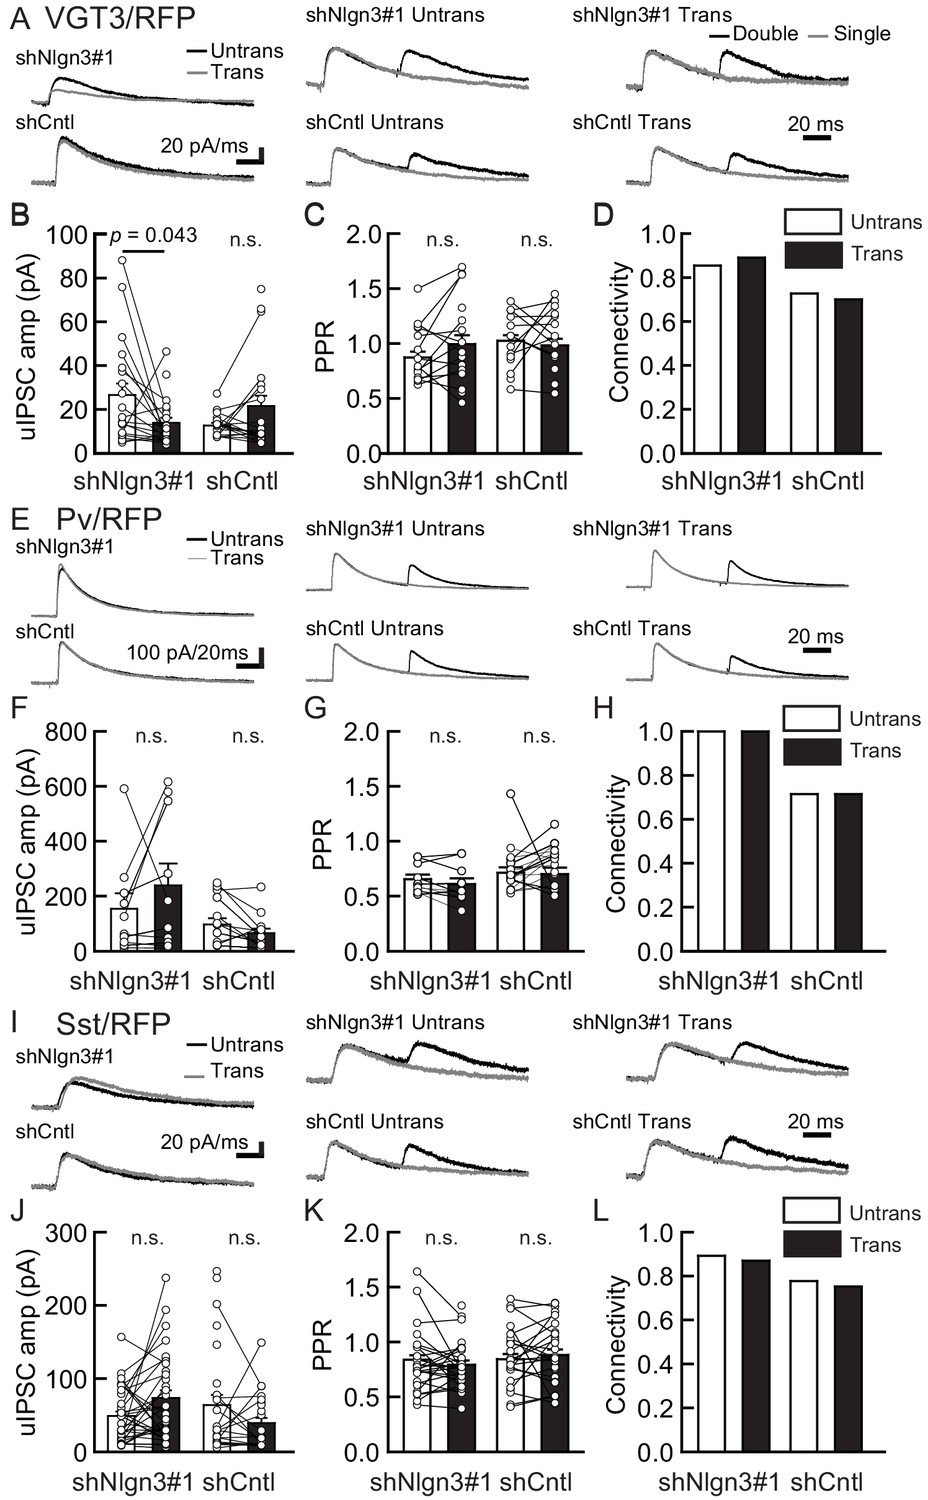
Endogenous Nlgn3 specifically regulates VGT3+, but not Pv+ and Sst+, interneuron-mediated unitary synaptic transmission.
The effects of shNlgn3 or shCntl expression in hippocampal CA1 pyramidal neurons were compared between three different inhibitory inputs mediated by VGT3+ (A–D), Pv+ (E–H), and Sst+ (I–L) inhibitory interneurons. (A, E, and I) Sample traces of unitary inhibitory postsynaptic currents (uIPSCs). Left, superimposed averaged sample traces of uIPSC (Untrans: black; trans: dark gray) induced by an action potential (AP). Middle and right, superimposed averaged sample traces of uIPSCs evoked by single (dark gray) and double (black) APs in VGT3+ (A), Pv+ (E), and Sst+ (I) interneurons. uIPSCs are normalized to the first amplitude. The amplitude (B, F, and J) and paired-pulse ratio (PPR) (C, G, and K) of uIPSCs were plotted for each pair of transfected (Trans) and neighboring untransfected (Untrans) cells (open symbols). Bar graphs indicate mean ± SEM. (D, H, and L) Synaptic connectivity between presynaptic inhibitory interneuron and postsynaptic untransfected (open bars) or transfected (black) pyramidal neurons. Numbers of cell pairs: shNlgn3 or shCntl at VGT3+ synapses (28 pairs/15 mice and 37/17), at Pv+ synapse (12/4 and 16/5), and Sst+ synapses (26/11 and 21/10). The number of tested slice cultures is the same as that of cell pairs. n.s., not significant. Mann–Whitney U-test.
Figure 4—figure supplement 1
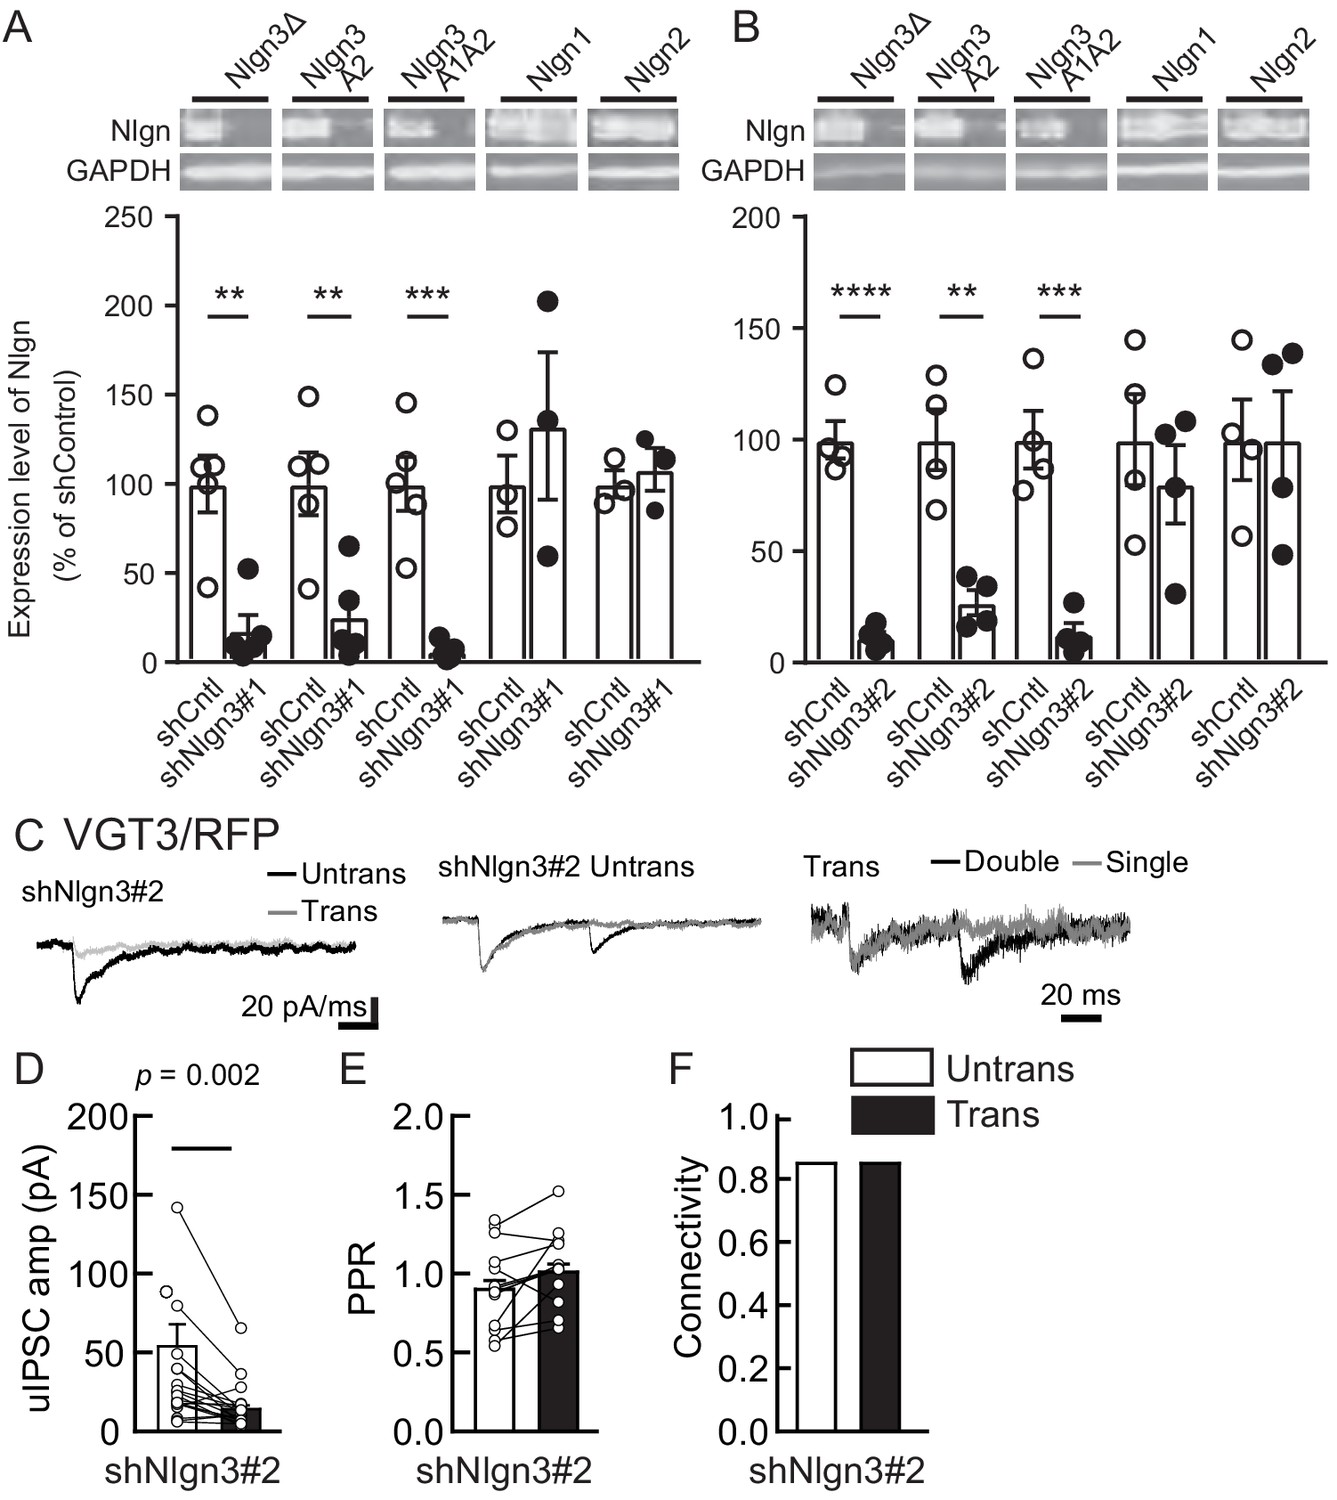
Nlgn3 shRNAs specifically knockdown Nlgn3 protein and regulate VGT3+ inhibitory synaptic transmission.
(A, B) Specificity of Nlgn3 shRNA constructs, shNlgn3#1 (A) and shNlgn3#2 (B), confirmed in HEK293T cell lysates overexpressing HA-tagged Nlgn3Δ, Nlgn3A2, Nlgn3A1A2, Nlgn1, and Nlgn2. (Top) Immunoblot images with HA and GAPDH. Membranes were first probed with rabbit HA antibody, stripped, and then re-probed with mouse GAPDH antibody. (Bottom) Summary bar graphs with individual scattered plots of shRNA effects. (C–F) Effects of shNlgn3#2 expression in hippocampal CA1 pyramidal neurons were compared between three different inhibitory inputs mediated by VGT3+ inhibitory interneurons. (C) Sample traces of uIPSCs measured at −70 mV. Left, superimposed averaged sample traces of uIPSC (Untrans: black; trans: dark gray) induced by an action potential (AP). Middle and right, superimposed averaged sample traces of uIPSCs evoked by single (dark gray) and double (black) APs in VGT3+ interneurons. uIPSCs are normalized to the first amplitude. The amplitude (D) and paired-pulse ratio (PPR) (E) of uIPSCs were plotted for each pair of transfected (Trans) and neighboring untransfected (Untrans) cells (open symbols). Bar graphs indicate mean ± SEM. (F) Synaptic connectivity between presynaptic inhibitory interneuron and postsynaptic untransfected (open bars) or transfected (black) pyramidal neurons. Numbers of cell pairs: shNlgn3 at VGT3+ synapses (18 cell pairs/10 mice). The number of tested slice cultures is the same as that of cell pairs. n.s., not significant. Mann–Whitney U-test.
Figure 5 with 1 supplement
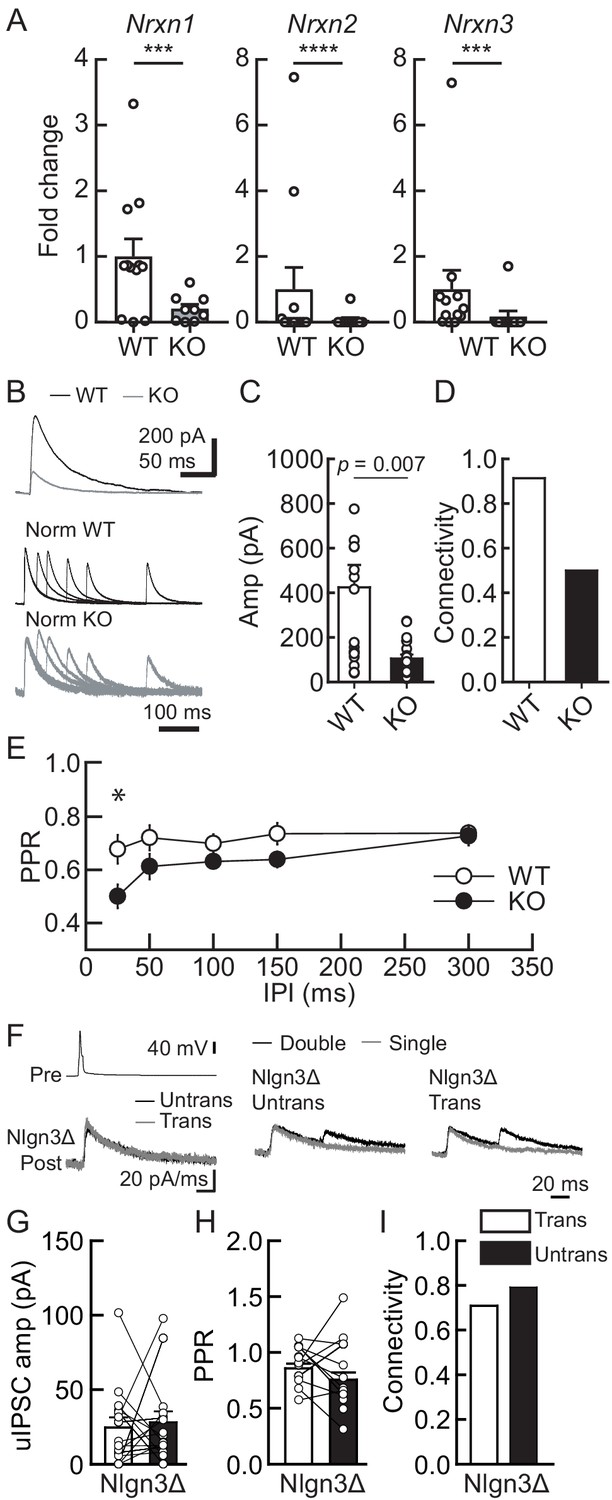
Lack of presynaptic Nrxns reduces inhibitory synaptic transmission and abolishes the potentiation effect of Nlgn3Δ in VGT3+ inhibitory synaptic transmission.
Effects of Nlgn3Δ isoform overexpression (OE) in hippocampal CA1 pyramidal neurons in the absence of presynaptic Nrxn input in VGT3+ interneurons. (A) Validation of the NrxnTKO/VGT3/RFP mouse line. Expression of Nrxn genes were compared in TdTomato-positive VGT3+ neurons in organotypic hippocampal slice cultures prepared from wild-type (WT) (VGT3/RFP) and knockout (KO) (NrxnTKO/VGT3/RFP) mice. qPCRs against Nrxn 1, 2, 3 and Gapdh (internal control) were performed for single-cell cDNA libraries prepared from TdTomato-positive neurons. Number of neurons: WT (N = 9, three mice) and KO (7, 2). ***p<0.001, ****p<0.0001 (Student’s t-test). (B–E) Effect of Nrxn triple KO on VGT3+ interneuron-mediated inhibitory synaptic transmission. (B) Left top, averaged sample traces of a single presynaptic action potential (AP) evoked in a NrxnTKO VGT3+ interneuron. Left bottom, superimposed averaged sample traces of unitary inhibitory postsynaptic current (uIPSC) (Untrans: black; trans: dark gray) induced by an AP. Right, superimposed averaged sample traces of uIPSCs evoked by single (dark gray) and double (black) APs in NrxnTKO VGT3+ interneurons. Summary of uIPSC amplitude (C), paired-pulse ratio (PPR) (D), and connectivity (E). Number of cell pairs: WT (N = 23, six mice) and KO (35, 7). *p<0.05 (two-way ANOVA with Sidak’s post hoc test). (F–I) Effect of Nlgn3Δ OE on NrxnTKO VGT3+ interneuron-mediated inhibitory synaptic transmission. (F) Left top, averaged sample traces of a single presynaptic AP evoked in a NrxnTKO VGT3+ interneuron. Left bottom, superimposed averaged sample traces of uIPSC (Untrans: black; trans: dark gray) induced by an AP. Right, superimposed averaged sample traces of uIPSCs evoked by single (dark gray) and double (black) APs in NrxnTKO VGT3+ interneurons. Summary of uIPSC amplitude (G), PPR (H), and connectivity (I). Open circles connected with bars represent individual pairs of cells (C, D, G, and H). Bar graphs indicate mean ± SEM. N = 18 cell pairs (three mice). The number of tested slice cultures is the same as that of cell pairs. Mann–Whitney U-test.
Figure 5—figure supplement 1
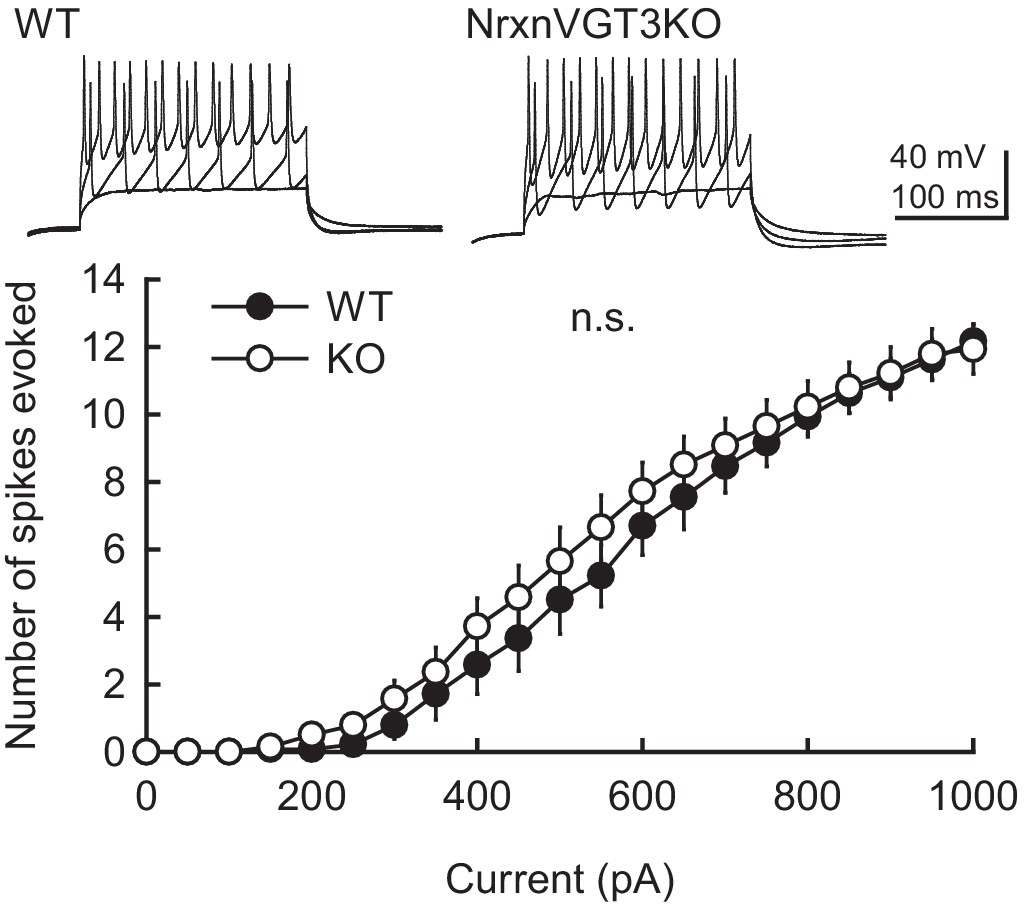
Membrane excitability is not altered in VGT3+ interneurons in NrxnTKO/VGT3/RFP mice.
(Top) Sample traces of VGT3+ interneurons in organotypic hippocampal slice cultures prepared from VGT/RFP (wild-type [WT], left) and NrxnTKO/VGT3/RFP (knockout [KO], right) mice. The superimposed traces were elicited by current injections of 200, 500, and 900 pA for 200 ms. (Bottom) Summary graph of the frequency of action potentials in WT and KO VGT3+ interneurons. The input–output relationship (number of spikes elicited vs. amount of current injection over a 200 ms duration) was plotted for WT and KO neurons. Neurons were held at resting membrane potentials. Two-way ANOVA with Sidak’s post hoc test: number of cells tested: untrans, 14 cells from five mice (14/5); trans, (14/5). n.s., not significant. Resting membrane potentials were not significant between WT and KO VGT3+ interneurons: WT, −56.3 ± 0.46; KO, −56.0 ± 0.28 mV (Student’s t-test).
Figure 6 with 1 supplement
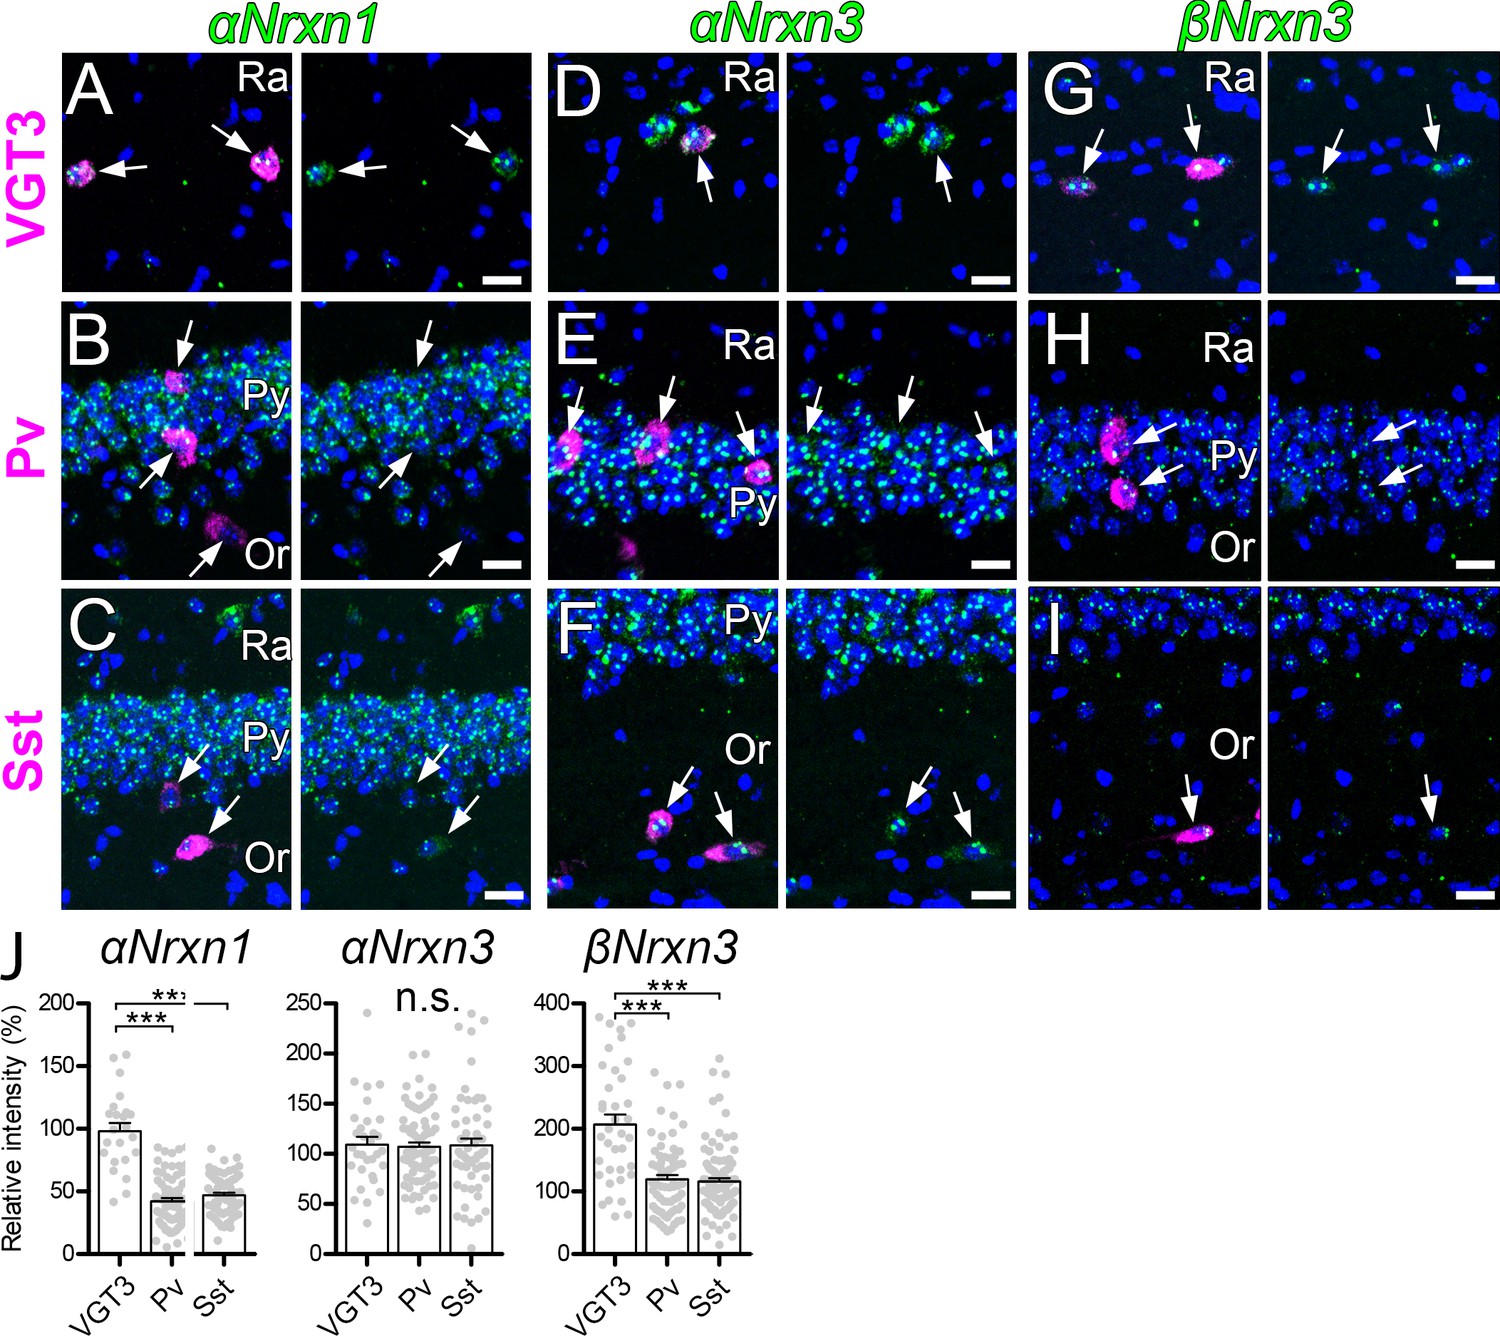
Expression of Nrxn isoforms in different types of inhibitory interneurons in the hippocampal CA1 region.
Double FISH for αNrxn1 (A, B, and C), αNrxn3 (D, E, and F), and βNrxn3 (G, H, and I) mRNAs in VGT3+ (A, D, and G), Pv+ (B, E, and H), and Sst+ (C, F, and I) in the hippocampus showing different levels of Nrxn mRNA (green) expression in different inhibitory interneurons (magenta). Note that the signal intensity in individual GABAergic neurons is variable, compared with that in glutamatergic neurons. Nuclei were stained with DAPI (blue). Or, st. oriens; Py, st. pyramidale; Ra, st. radiatum. (J) Summary scatterplots for αNrxn1, αNrxn3, and βNrxn3 mRNAs in VGT3+, Pv+, and Sst+ inhibitory interneurons. Data are represented as mean ± SEM. ns, not significant; ***p<0.001 (Mann–Whitney U-test). Scale bars, 20 μm.
Figure 6—figure supplement 1
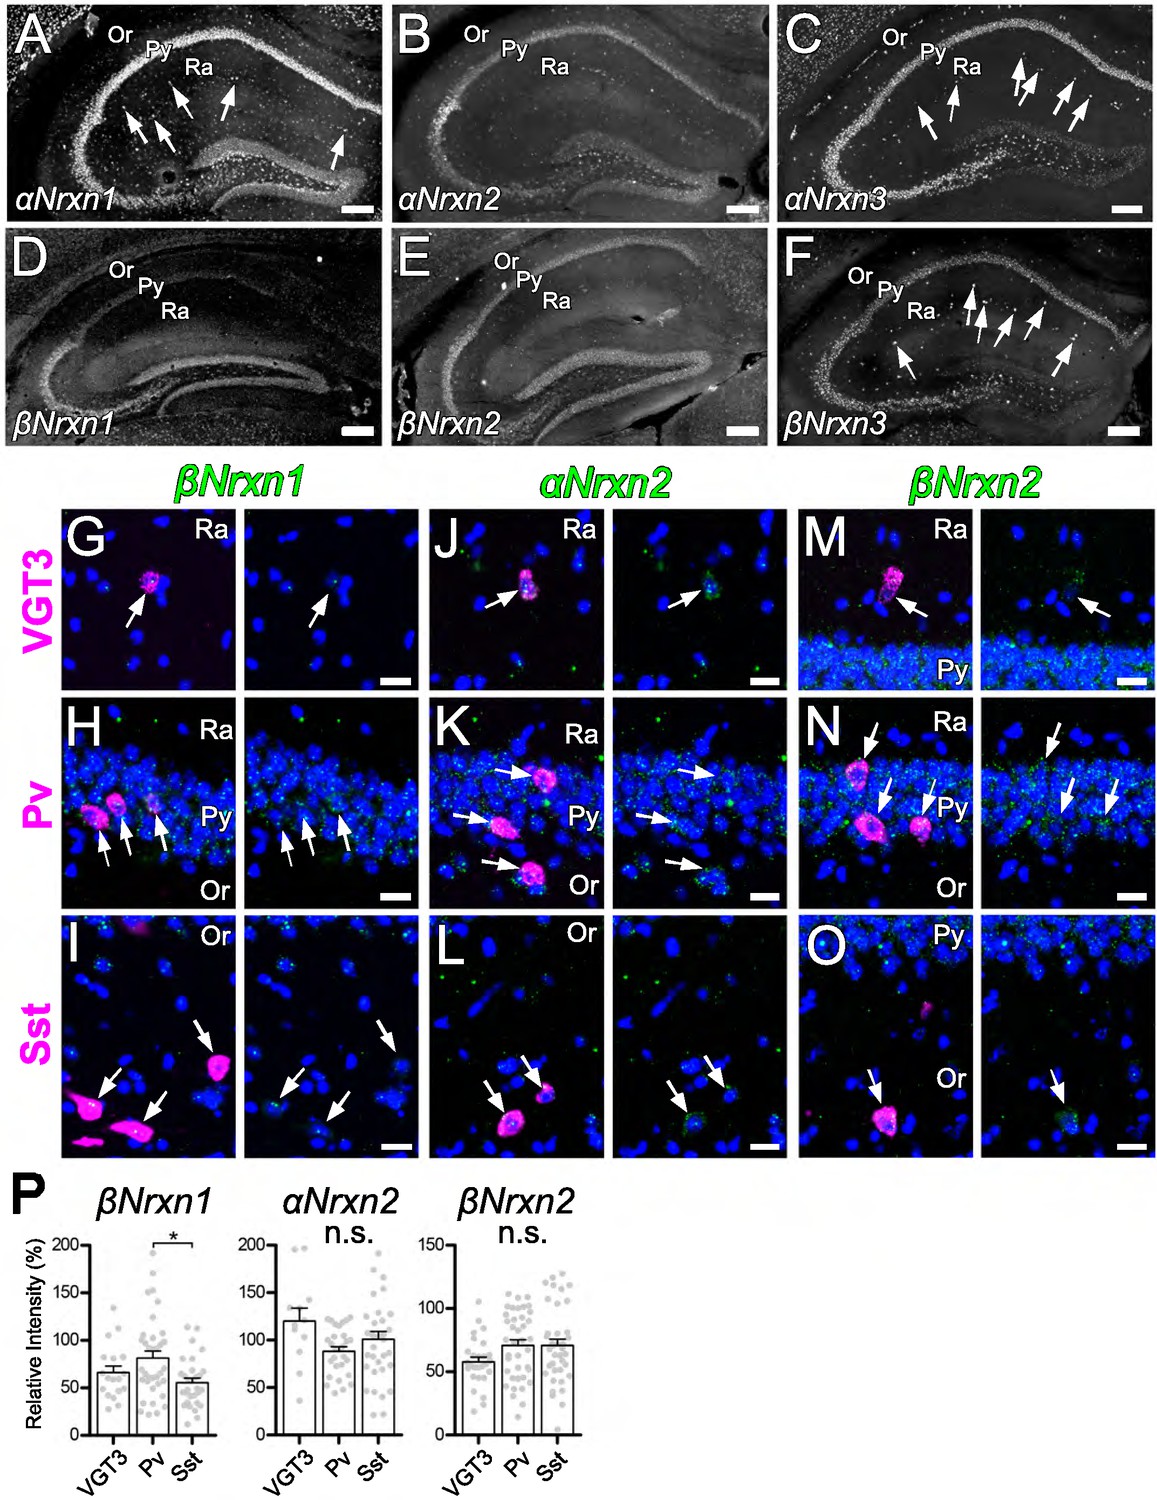
Expression of Nrxn isoforms in different types of inhibitory interneurons in the hippocampal CA1 region.
(A–F) Single FISH for αNrxn1 (A), αNrxn2 (B), αNrxn3 (C), βNrxn1 (D), βNrxn2 (E), and βNrxn3 (F) in the hippocampus. Striking signals for αNrxn1 (A), αNrxn3 (C), and βNrxn3 (F) are noted in sparse cells in the st. radiatum (arrows). (G–O) Double FISH for βNrxn1 (G, H, and I), αNrxn2 (J, K, and L), and βNrxn2 (M, N, and O) in VGT3+ (G, J, and M), Pv+ (H, K, and N), and Sst+ (I, L, and O) in the hippocampus showing different levels of Nrxn mRNA (green) expression in different inhibitory interneurons (magenta, arrows). Note that the signal intensity in individual GABAergic neurons is variable, compared with that in glutamatergic neurons. Nuclei were stained with DAPI (blue). Or, st. oriens; Py, st. pyramidale; Ra, st. radiatum. Note that none of the Nrxn isoforms displayed unique expression specific to VGT3+ inhibitory interneurons (see Figure 6J). (P) Summary scatterplots for βNrxn1, αNrxn2, and βNrxn2 mRNAs in VGT3+, Pv+, and Sst+ inhibitory interneurons. Data are represented as mean ± SEM. ns, not significant; *p<0.05. Scale bars, 200 µm (A–F) and 20 μm (G–O).
Figure 7 with 1 supplement

Transcriptomic similarity and endogenous Nrxn expression in hippocampal VGT3+, Pv+, and Sst+ inhibitory interneurons.
(A) Single-cell t-SNE plot of 15 single cells obtained from VGT3+ (magenta: MU_VGT3.1–5), Pv+ (yellow: MU_Pv.1–5), and Sst+ (orange: MU_Sst.1–5) interneurons compared to Allen Brain Atlas single cells (CA1-ProS; CA1-prosubiculum, CA2; CA2, CA3; CA3, DG; dentate gyrus, L2 IT RHP; Layer2, intratelencephalic, retrohippocampal region, L2/3 IT CTX-2; Layer2/3, intratelencephalic, cortical region, L2/3 IT ENTl; Layer2/3, intratelencephalic, lateral entorhinal area, L5 IT TPE-ENT; Layer5, intratelencephalic, temporal, perirhinal, and ectorhinal area, L6 CT CTX; Layer6, near-projecting (NP), L6 corticothalamic (CT), Lamp5; Lamp5-positive, Meis2; Meis2-positive, NP SUB; near-projecting, subiculum, Pvalb; Pvalb-positive, Sncg; Sncg-positive, Sst; Sst-positive, SUB-ProS; subiculum-prosubiculum, Vip; Vip-positive). (B) Summary bar graph of Nrxn gene (Nrxn1, 2, and 3) expression in VGT3+, Pv+, and Sst+ interneurons. (C–E) Summary graphs of splice isoforms of Nrxn1 (C), 2 (D), and 3 (E) in VGT3+, Pv+, and Sst+ interneurons. *p<0.05, one-way ANOVA followed by Sidak’s multiple comparisons test or Mann–Whitney U-test, N = 5 cells for each interneuron type.
-
Figure 7—source data 1
Inhibitory interneuron_tSNE data.
- https://cdn.elifesciences.org/articles/59545/elife-59545-fig7-data1-v1.zip
-
Figure 7—source data 2
Heat map of inhibitory interneurons.
- https://cdn.elifesciences.org/articles/59545/elife-59545-fig7-data2-v1.zip
Figure 7—figure supplement 1
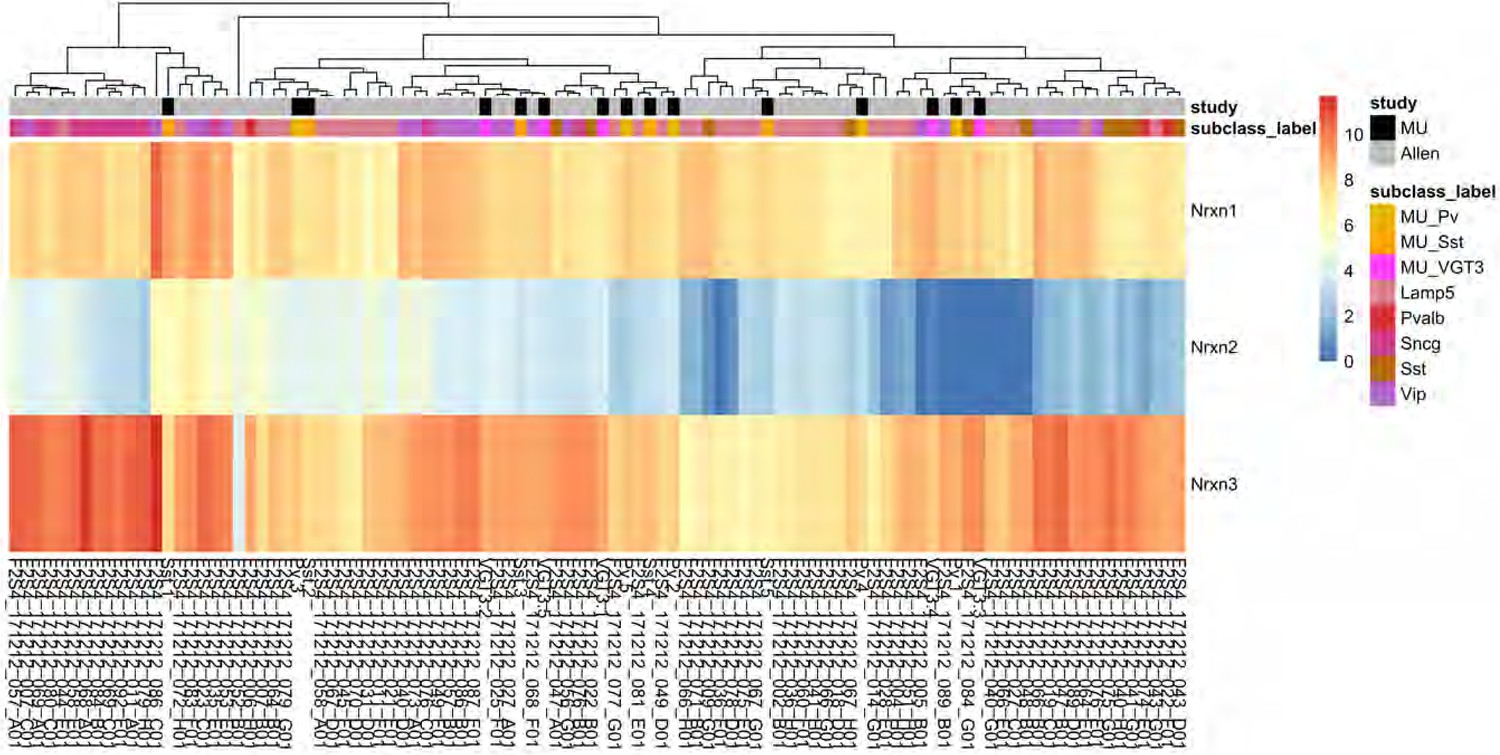
Heat map of Nrxn gene expression in VGT3+, Pv+, and Sst+ inhibitory interneurons.
A hierarchical clustering of Nrxn expression levels of 15 single cells (shown in black in the study annotation bar) obtained from VGT3+ (magenta: MU_VGT3.1–5), Pv+ (yellow: MU_Pv.1–5), and Sst+ (orange: MU_Sst.1–5) interneurons compared to 85 randomly selected hippocampal GABAergic neurons from the Allen Brain Atlas (shown in gray in the study annotation bar) demonstrated similarities between the MU cells and the Allen Brain Atlas dataset. Scale bar shows the batch-corrected log2+one transformed count-per-million (CPM) values.
Figure 8

An αNrxn1+AS4–Nlgn3Δ synaptic signal enhances VGT3+ inhibitory synapse transmission.
(A–C) Effect of pre- and postsynaptic overexpression of αNrxn1 and Nlgn3Δ, respectively, on unitary inhibitory synaptic transmission in organotypic slice cultures prepared from VGT3/NrxnTKO/RFP mice. (A) Configuration of triple whole-cell recording (left top), superimposed fluorescent, and Nomarski images (right top). (Bottom) Individual fluorescence and Nomarski images of TdTomato (left) and tag-blue fluorescent protein (tag-BFP; right). (B) Averaged sample unitary inhibitory postsynaptic current (uIPSC) traces. Nrxns and Nlgn3Δ were transfected in TdTomato-positive and CA1 pyramidal neurons, respectively, by electroporation. (C, D, and E) Summary of uIPSC amplitude (C), paired-pulse ratio (D), and connectivity (E). Numbers of cell pairs: αNrxn1+AS4, αNrxn1-AS4, and BFP at VGT3+ synapses (seven pairs/three mice, 9/4 and 9/4). The number of tested slice cultures is the same as that of cell pairs. Mann–Whitney U-test.
Figure 9
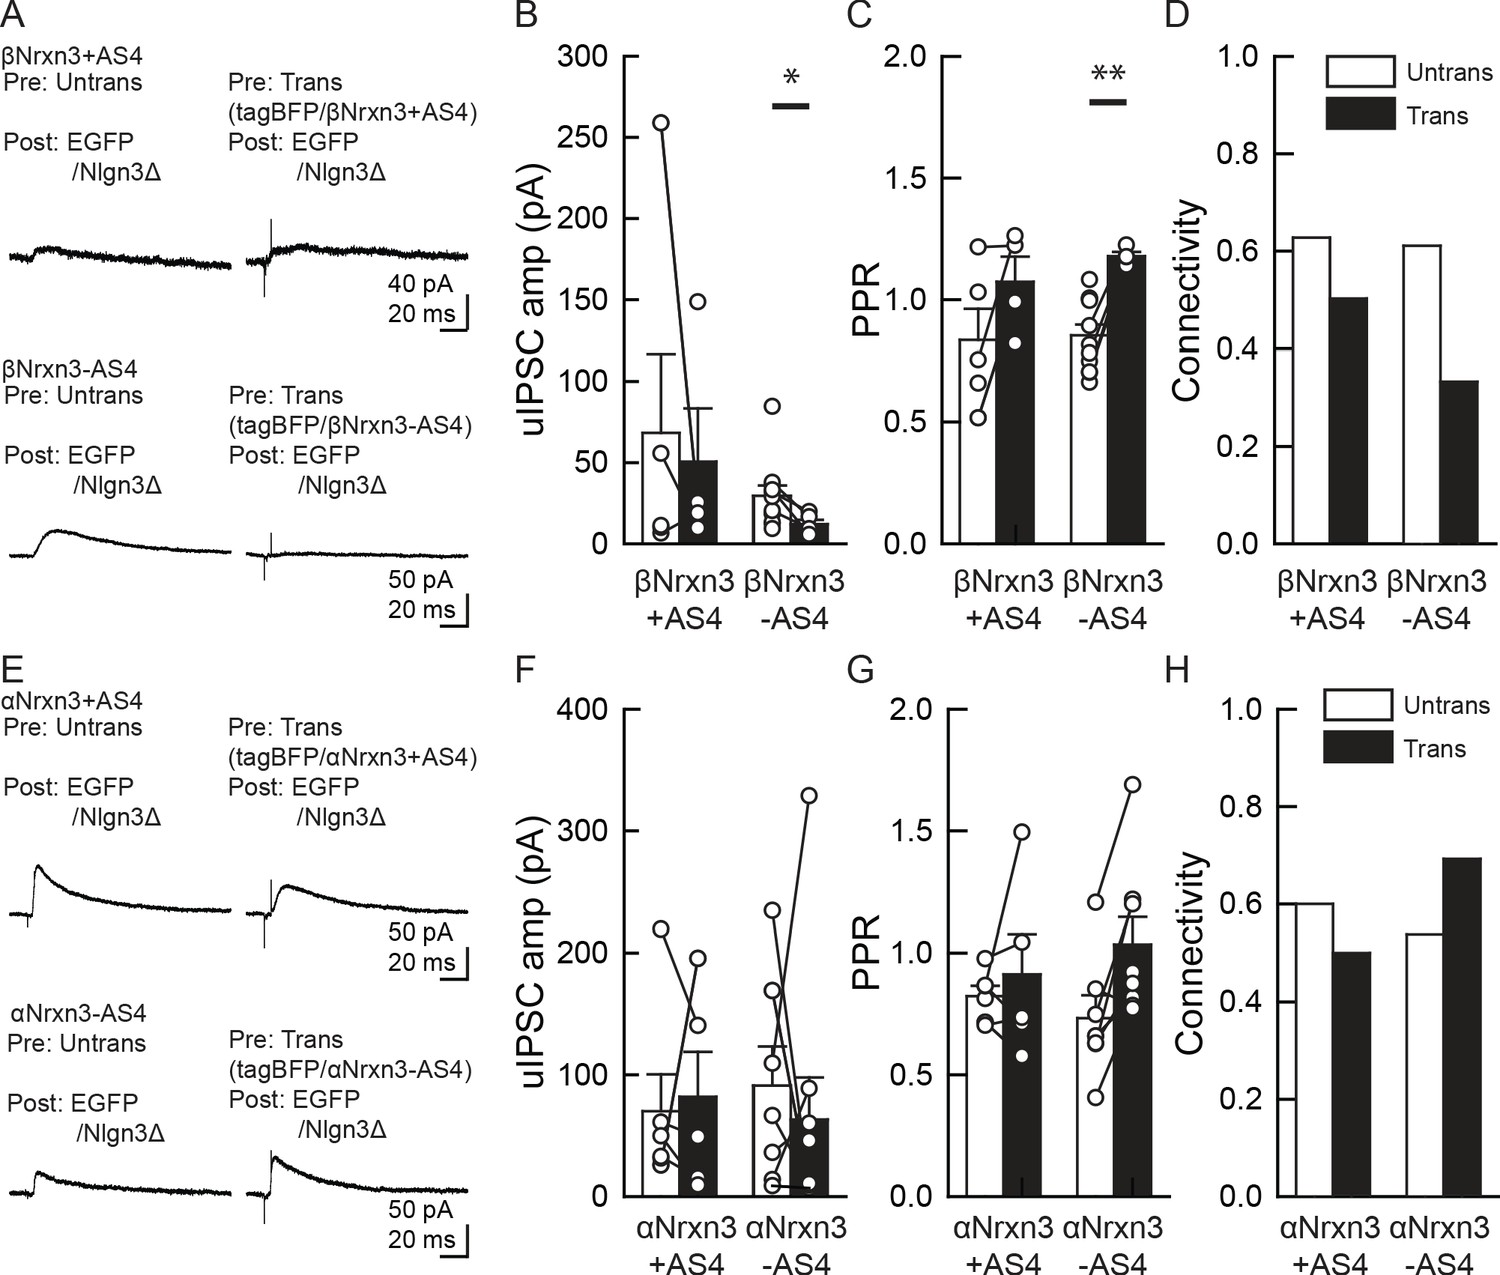
α/βNrxn3–Nlgn3Δ synaptic signals do not regulate VGT3+ inhibitory synapse transmission.
(A–D) Effect of pre- and postsynaptic overexpression (OE) of βNrxn3(±AS4) and Nlgn3Δ, respectively, on unitary inhibitory synaptic transmission in organotypic slice cultures prepared from NrxnTKO/VGT3/RFP mice. (E–H) Effect of pre- and postsynaptic OE of αNrxn3(±AS4) and Nlgn3Δ, respectively, on unitary inhibitory synaptic transmission. (A and E) Averaged sample unitary inhibitory postsynaptic current (uIPSC) traces. Summary of uIPSC amplitude (B and F), paired-pulse ratio (C and G), and connectivity (D and H). Numbers of cell pairs: βNrxn3+AS4, βNrxn3-AS4, αNrxn3+AS4, and αNrxn3-AS4 at VGT3+ synapses (eight pairs/three mice, 9/3, 5/3, and 11/3). The number of tested slice cultures is the same as that of cell pairs. Mann–Whitney U-test.
Tables
Table 1
Nrxn transcript IDs used for quantification.
| Transcript ID | gene | α or β | AS4 plus minus |
|---|---|---|---|
| ENSMUST00000174331.7 | Nrxn1 | α | AS4- |
| ENSMUST00000054059.14 | Nrxn1 | α | AS4+ |
| ENSMUST00000072671.13 | Nrxn1 | α | AS4+ |
| ENSMUST00000160800.8 | Nrxn1 | α | AS4+ |
| ENSMUST00000160844.9 | Nrxn1 | α | AS4+ |
| ENSMUST00000161402.9 | Nrxn1 | α | AS4+ |
| ENSMUST00000159778.7 | Nrxn1 | β | AS4- |
| ENSMUST00000172466.7 | Nrxn1 | β | AS4+ |
| ENSMUST00000174337.7 | Nrxn1 | β | AS4+ |
| ENSMUST00000113461.7 | Nrxn2 | α | AS4- |
| ENSMUST00000137166.7 | Nrxn2 | α | AS4+ |
| ENSMUST00000235714.1 | Nrxn2 | α | AS4+ |
| ENSMUST00000077182.12 | Nrxn2 | α | AS4+ |
| ENSMUST00000113462.7 | Nrxn2 | α | AS4+ |
| ENSMUST00000236635.1 | Nrxn2 | α | AS4+ |
| TENSMUST00000113459.1 | Nrxn2 | β | AS4- |
| ENSMUST00000113458.7 | Nrxn2 | β | AS4+ |
| ENSMUST00000190626.6 | Nrxn3 | α | AS4- |
| ENSMUST00000057634.13 | Nrxn3 | α | AS4+ |
| ENSMUST00000163134.7 | Nrxn3 | α | AS4+ |
| ENSMUST00000167103.7 | Nrxn3 | α | AS4+ |
| ENSMUST00000167887.7 | Nrxn3 | α | AS4+ |
| ENSMUST00000110133.8 | Nrxn3 | β | AS4- |
| ENSMUST00000238943.1 | Nrxn3 | β | AS4- |
| ENSMUST00000110130.3 | Nrxn3 | β | AS4+ |
Appendix 1—key resources table
| Reagent type (species) or resource | Designation | Source or reference | Identifiers | Additional information |
|---|---|---|---|---|
| Cell line (Human) | HEK 293T | Sigma | Authenticated with STR profiling, tested negative for mycoplasma | |
| Antibody | Anti-RFP (goat polyclonal) | Rockland | Cat#: 200-101-379 (RRID:AB_2744552) | IF (1:2000) |
| Antibody | Anti-RFP (rabbit polyclonal) | Rockland | Cat#: 600-401-379 (RRID:AB_2209751) | IF (1:2000) |
| Antibody | Anti-PV (mouse monoclonal) | Sigma | Cat#: P3088 (RRID:AB_477329) | IF (1:1000) |
| Antibody | Anti-PV (rabbit polyclonal) | Frontier Institute | Cat#: PV-Rb-Af750 (RRID:AB_2571613) | IF (1 μg/ml) |
| Antibody | Anti-Sst antibody (rabbit polyclonal) | Peninsula Lab | Cat#: T-41003.0050 | IF (1:2000) |
| Antibody | Anti-VIAAT (goat polyclonal) | Frontier Institute | Cat#: PV-Rb-Af750 (RRID:AB_2571613) | IF (1 μg/ml) |
| Antibody | Anti-VIAAT (rabbit polyclonal) | Frontier Institute | Cat#: VGAT-Rb-Af500 (RRID:AB_2571622) | IF (1 μg/ml) |
| Antibody | Anti-NL3 (rabbit polyclonal) | Frontier Institute | Cat#: Nlgn3-Gp-Af880 (RRID:AB_2571814) | IF (1 μg/ml) |
| Antibody | Anti-VGluT3 (goat polyclonal) | Frontier Institute | Cat#: VGluT3-Go-Af870 (RRID:AB_2571854) | IF (1 μg/ml) |
| Antibody | Anti-CB1 (rabbit polyclonal) | Frontier Institute | Cat#: CB1-Rb-Af380 (RRID:AB_2571591) | IF (1 μg/ml) |
| Antibody | Cy3-AffiniPure Donkey anti-Guinea pig IgG | Jackson ImmunoResearch | Cat# 706-165-148 (RRID:AB_2340460) | IF (1:200) |
| Antibody | Donkey anti-Rabbit IgG, Alexa Fluor 488 | Invitrogen | Cat#: A-21206 (RRID:AB_2535792) | IF (1:200) |
| Antibody | Donkey anti-Goat IgG, Alexa Fluor 488 | Invitrogen | Cat#: A-11055 (RRID:AB_2534102) | IF (1:200) |
| Antibody | Donkey anti-Goat IgG, Alexa Fluor 647 | Invitrogen | Cat#: A-21447 (RRID:AB_2535864) | IF (1:200) |
| Antibody | Donkey anti-Rabbit IgG, Alexa Fluor 647 | Invitrogen | Cat#: A-31573 (RRID:AB_2536183) | IF (1:200) |
| Antibody | Anti-Fluorescein-POD, Fab fragments from sheep | Roche | Cat#: 11426346910 (RRID:AB_840257) | FISH (1:500) |
| Antibody | Anti-Digoxigenin-POD, Fab fragments from sheep | Roche | Cat#: 11207733910 (RRID:AB_840257) | FISH (1:500) |
| Chemical compound, drug | tRNA from brewer’s yeast | Roche | Cat#:10109517001 | FISH |
| Chemical compound, drug | Sheep serum | Sigma-Aldrich | Cat#: S3772 | FISH |
| Chemical compound, drug | DAPI | Sigma-Aldrich | Cat#: D9542 | Nuclear staining (1:5000) |
| Chemical compound, drug | Kynurenic acid | Sigma-Aldrich | Cat#: K3375 | Electrophysiology |
| Recombinant DNA reagent | pCAG-HA-Nlgn3Δ (plasmid) | Uchigashima et al., 2020 | Subclone HA- Nlgn3Δ in pCAG vector | |
| Recombinant DNA reagent | pCAG-HA-Nlgn3A2 (plasmid) | Uchigashima et al., 2020 | Subclone HA- Nlgn3A2 in pCAG vector | |
| Recombinant DNA reagent | pCAG-Tag-BFP (plasmid) | This paper | Tag-BFP (Evrogen) | Subclone Tag-BFP in pCAG vector |
| Recombinant DNA reagent | pCAG-EGFP (plasmid) | Futai et al., 2013 | EGFP (Clontech) | Subclone EGFP in pCAG vector |
| Recombinant DNA reagent | pCAG-HA-αNrxn1 + AS4 (plasmid) | This paper | Subclone HA-αNrxn1 + AS4 in pCAG vector | |
| Recombinant DNA reagent | pCAG-HA-αNrxn1 – AS4 (plasmid) | Futai et al., 2013 | Subclone HA-αNrxn1 – AS4 in pCAG vector | |
| Recombinant DNA reagent | pCAG-HA-αNrxn3 + AS4 (plasmid) | This paper | Subclone HA-αNrxn3 + AS4 in pCAG vector | |
| Recombinant DNA reagent | pCAG-HA-αNrxn3 – AS4 (plasmid) | Kang et al., 2008 | Subclone HA-αNrxn3 – AS4 in pCAG vector | |
| Recombinant DNA reagent | pCAG-HA-βNrxn3 + AS4 (plasmid) | This paper | Subclone HA-βNrxn3 + AS4 in pCAG vector | |
| Recombinant DNA reagent | pCAG-HA-βNrxn3 – AS4 (plasmid) | This paper | Subclone HA-βNrxn3 – AS4 in pCAG vector | |
| Recombinant DNA reagent | shNlgn3#1 | Sigma Aldrich | TRCN0000031940 | shRNA in pLKO.1 vector |
| Recombinant DNA reagent | shNlgn3#2 | Sigma Aldrich | TRCN0000031939 | shRNA in pLKO.1 vector |
| Recombinant DNA reagent | pBS SK (-)-αNrxn1#1 (plasmid) | Uchigashima et al., 2019 | Subclone αNrxn1 (186–631, NM_020252.3) in pBS SK (-) vector | |
| Recombinant DNA reagent | pBS SK (-)-αNrxn1#2 (plasmid) | Uchigashima et al., 2019 | Subclone αNrxn1 (631–1132, NM_020252.3) in pBS SK (-) vector | |
| Recombinant DNA reagent | pBS SK (-)-βNrxn1#1 (plasmid) | Uchigashima et al., 2019 | Subclone βNrxn1 (379–824, XM_006523818.2) in pBS SK (-) vector | |
| Recombinant DNA reagent | pBS SK (-)-βNrxn1#2 (plasmid) | Uchigashima et al., 2019 | Subclone βNrxn1 (882–1490, XM_006523818.2) in pBS SK (-) vector | |
| Recombinant DNA reagent | pBS SK (-)-αNrxn2#1 (plasmid) | Uchigashima et al., 2019 | Subclone αNrxn2 (120–370, NM_001205234) in pBS SK (-) vector | |
| Recombinant DNA reagent | pBS SK (-)-αNrxn2#2 (plasmid) | Uchigashima et al., 2019 | Subclone αNrxn2 (894–1209, NM_001205234) in pBS SK (-) vector | |
| Recombinant DNA reagent | pBS SK (-)-βNrxn2#1 (plasmid) | Uchigashima et al., 2019 | Subclone βNrxn2 (188–375, AK163904.1) in pBS SK (-) vector | |
| Recombinant DNA reagent | pBS SK (-)-βNrxn2#2 (plasmid) | Uchigashima et al., 2019 | Subclone βNrxn2 (543–714, AK163904.1) in pBS SK (-) vector | |
| Recombinant DNA reagent | pBS SK (-)-αNrxn3#1 (plasmid) | Uchigashima et al., 2019 | Subclone αNrxn3 (207–795, NM_001198587) in pBS SK (-) vector | |
| Recombinant DNA reagent | pBS SK (-)-αNrxn3#2 (plasmid) | Uchigashima et al., 2019 | Subclone αNrxn3 (796–1782, NM_001198587) in pBS SK (-) vector | |
| Recombinant DNA reagent | pBS SK (-)-βNrxn3#1 (plasmid) | Uchigashima et al., 2019 | Subclone βNrxn3 (85–530, NM_001252074) in pBS SK (-) vector | |
| Recombinant DNA reagent | pBS SK (-)-βNrxn3#2 (plasmid) | Uchigashima et al., 2019 | Subclone βNrxn3 (771–1235, NM_001252074) in pBS SK (-) vector | |
| Recombinant DNA reagent | pBS SK (+)-VGT3 (plasmid) | Omiya et al., 2015 | Subclone VGluT3 (22–945, NM_182959) in pBS SK (+) vector | |
| Recombinant DNA reagent | pBS SK (+)-Pv (plasmid) | Yamasaki et al., 2016 | Subclone Parv (57–389, NM_013645) in pBS SK (+) vector | |
| Recombinant DNA reagent | pBS SK (+)-Sst (plasmid) | Song et al., 2014 | Subclone Sst (133–408, NM_012659) in pBS SK (+) vector | |
| Commercial assay or kit | Fluorescein RNA Labeling Mix | Roche | Cat#: 11685619910 | cRNA probe synthesis kit |
| Commercial assay or kit | DIG RNA Labeling Mix | Roche | Cat#: 11277073910 | cRNA probe synthesis kit |
| Commercial assay or kit | T3 RNA Polymerase | Promega | Cat#: P2083 | cRNA probe synthesis |
| Commercial assay or kit | T7 RNA Polymerase | Promega | Cat#: P2075 | cRNA probe synthesis |
| Commercial assay or kit | Blocking reagent | Roche | Cat#: 11096176001 | FISH |
| Commercial assay or kit | TSA Blocking reagent | PerkinElmer | Cat#: FP1020 | FISH |
| Commercial assay or kit | TSA Plus Cyanine three and Fluorescein System | PerkinElmer | Cat#: NEL753001KT | FISH |
| Commercial assay or kit | SMRT-Seq HT Kit | Takara Bio | Cat# 64437 | RNA-seq library prep kit |
| Commercial assay or kit | Nextera XT DNA Library Preparation Kit | Illumina | FC-131–1096 | RNA-seq library prep kit |
| Commercial assay or kit | Nextera XT Index Kit v2 Set A | Illumina | FC-131–2001 | RNA-seq library prep kit |
| Commercial assay or kit | NovaSeq 6000 S1 Reagent Kit (100 cycles) | Illumina | 20012865 | Illumina sequencing reagent |
| Software, algorithm | BBTools | DOE Joint Genome Institute | https://jgi.doe.gov/data-and-tools/bbtools/ (RRID:SCR_016968) | RNA-seq read filtering and trimming |
| Software, algorithm | HISAT2 | Center for Computational Biology at Johns Hopkins University | https://ccb.jhu.edu/software/hisat2/manual.shtml (RRID:SCR_015530) | RNA-seq read alignment |
| Software, algorithm | HTSeq | Simon Anders and Fabio Zanini | https://htseq.readthedocs.io/en/master/overview.html (RRID:SCR_005514) | RNA-seq read quantification |
| Software, algorithm | kallisto | Lior Pachter lab | https://pachterlab.github.io/kallisto/about (RRID:SCR_016582) | RNA-seq pseudoalignment |
| Software, algorithm | R | The R Foundation | https://www.r-project.org/ | Bioinformatic data manipulation, calculation and graphical display |
| Software, algorithm | MetaMorph | Molecular devices | https://www.moleculardevices.com/?_ga = 2.213249172.1046710400.1598576508–1999962342.1597912565 (RRID:SCR_002368) | Intensity and count analysis |
| Software, algorithm | ImageJ | https://imagej.nih.gov/ij/ (RRID:SCR_003070) | Intensity and count analysis | |
| Software, algorithm | pCLAMP 10.6 | Molecular devices | RRID:SCR_011323 | Electrophysiological data analysis |
Additional files
-
Source code 1
tpm calculation.
- https://cdn.elifesciences.org/articles/59545/elife-59545-code1-v1.zip
-
Transparent reporting form
- https://cdn.elifesciences.org/articles/59545/elife-59545-transrepform-v1.docx
Download links
A two-part list of links to download the article, or parts of the article, in various formats.
Downloads (link to download the article as PDF)
Open citations (links to open the citations from this article in various online reference manager services)
Cite this article (links to download the citations from this article in formats compatible with various reference manager tools)
Specific Neuroligin3–αNeurexin1 signaling regulates GABAergic synaptic function in mouse hippocampus
eLife 9:e59545.
https://doi.org/10.7554/eLife.59545


