HNRNPM controls circRNA biogenesis and splicing fidelity to sustain cancer cell fitness
- Institute of Molecular and Cell Biology (IMCB), Agency for Science, Technology and Research (A*STAR), Singapore
- Department of Microbiology, Icahn School of Medicine at Mount Sinai, United States
- Center for Therapeutics Discovery, department of Oncological Sciences and Pharmacological Sciences, Tisch Cancer Institute, Icahn School of Medicine at Mount Sinai, United States
- Tisch Cancer Institute, Icahn School of Medicine at Mount Sinai, United States
- Department of Oncological Sciences, Icahn School of Medicine at Mount Sinai, United States
- IIGM (Italian Institute for Genomic Medicine), Italy
- Dipartimento di Scienze della Vita e Biologia dei Sistemi Università di Torino, Italy
- Department of Molecular Genetics, Groningen Biomolecular Sciences and Biotechnology Institute (GBB), University of Groningen, Netherlands
- Cancer Science Institute of Singapore, National University of Singapore, Singapore
- Department of Anatomy, Yong Loo Lin School of Medicine, National University of Singapore, Singapore
- NTU Institute of Structural Biology, Nanyang Technological University, Singapore
- Department of Medical Biophysics, University of Toronto, Canada
- Princess Margaret Cancer Center, University Health Network, Canada
- Ontario Institute for Cancer Research, Canada
- Interdisciplinary Melanoma Cooperative Group, New York University Langone Medical Center, United States
- Department of Pathology, New York University Langone Medical Center, United States
- Department of Medicine, Hematology and Medical Oncology, Icahn School of Medicine at Mount Sinai, United States
- Department of Pathology, Icahn School of Medicine at Mount Sinai, United States
- Max Delbruck Center for Molecular Medicine, Germany
- Department of Molecular Oncology, Moffitt Cancer Center, United States
Figures
Figure 1 with 1 supplement
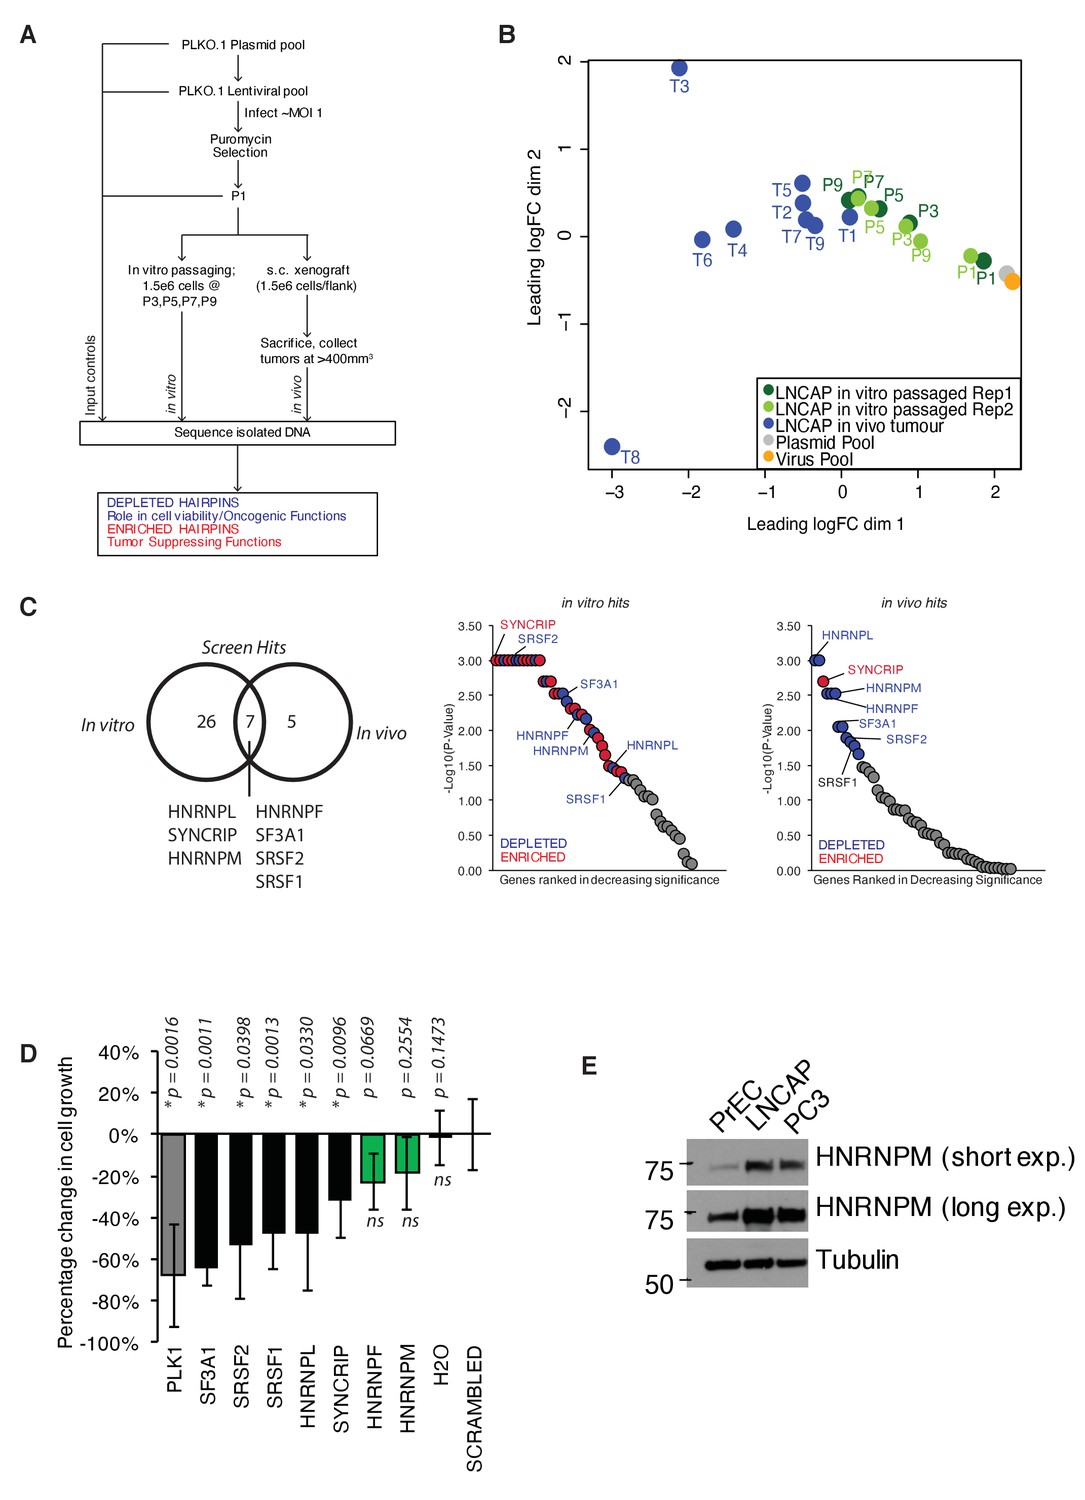
A pooled shRNA screen identifies HNRNPM as a regulator of prostate cancer (PCa) cell growth.
(A) Schematic of overall experimental design. (B) Multidimensional scaling (MDS) plot of individual samples (in vitro passaged cells and tumors) collected in the screen, in relation to each other. (C) Right: Venn diagram showing overlap of significant (p<0.05) hits for in vitro and in vivo screens. Left: ranked dotplots showing –log10(p-values) of in vivo and in vitro screen hits. Red circles represent significantly upregulated (enriched) hits, while blue circles represent significantly downregulated (depleted) hits. Tumor-specific hits are indicated. (D) Barplots showing overall prostate epithelial cell (PrEC) proliferation upon a 96 hr, siRNA-mediated knockdown of the indicated splicing factors, as measured through a colorimetric MTS assay. siRNAs that inhibit cell proliferation relative to the scrambled siRNA control are indicated in black, while siRNAs that do not alter cell proliferation are indicated in green. Each assay was performed in two biological replicates, with two technical duplicates per replicate. Error bars represent SD; *p<0.05 compared to scrambled. (E) Western blot of HNRNPM protein levels in PrEC, LNCAP, and PC3 cells. Tubulin is shown as a loading control.
-
Figure 1—source data 1
Rotational Gene Set Analysis (ROAST) results: tumor versus input (P1).
- https://cdn.elifesciences.org/articles/59654/elife-59654-fig1-data1-v2.xlsx
-
Figure 1—source data 2
Rotational Gene Set Analysis (ROAST) results: in vitro.
- https://cdn.elifesciences.org/articles/59654/elife-59654-fig1-data2-v2.xlsx
Figure 1—figure supplement 1
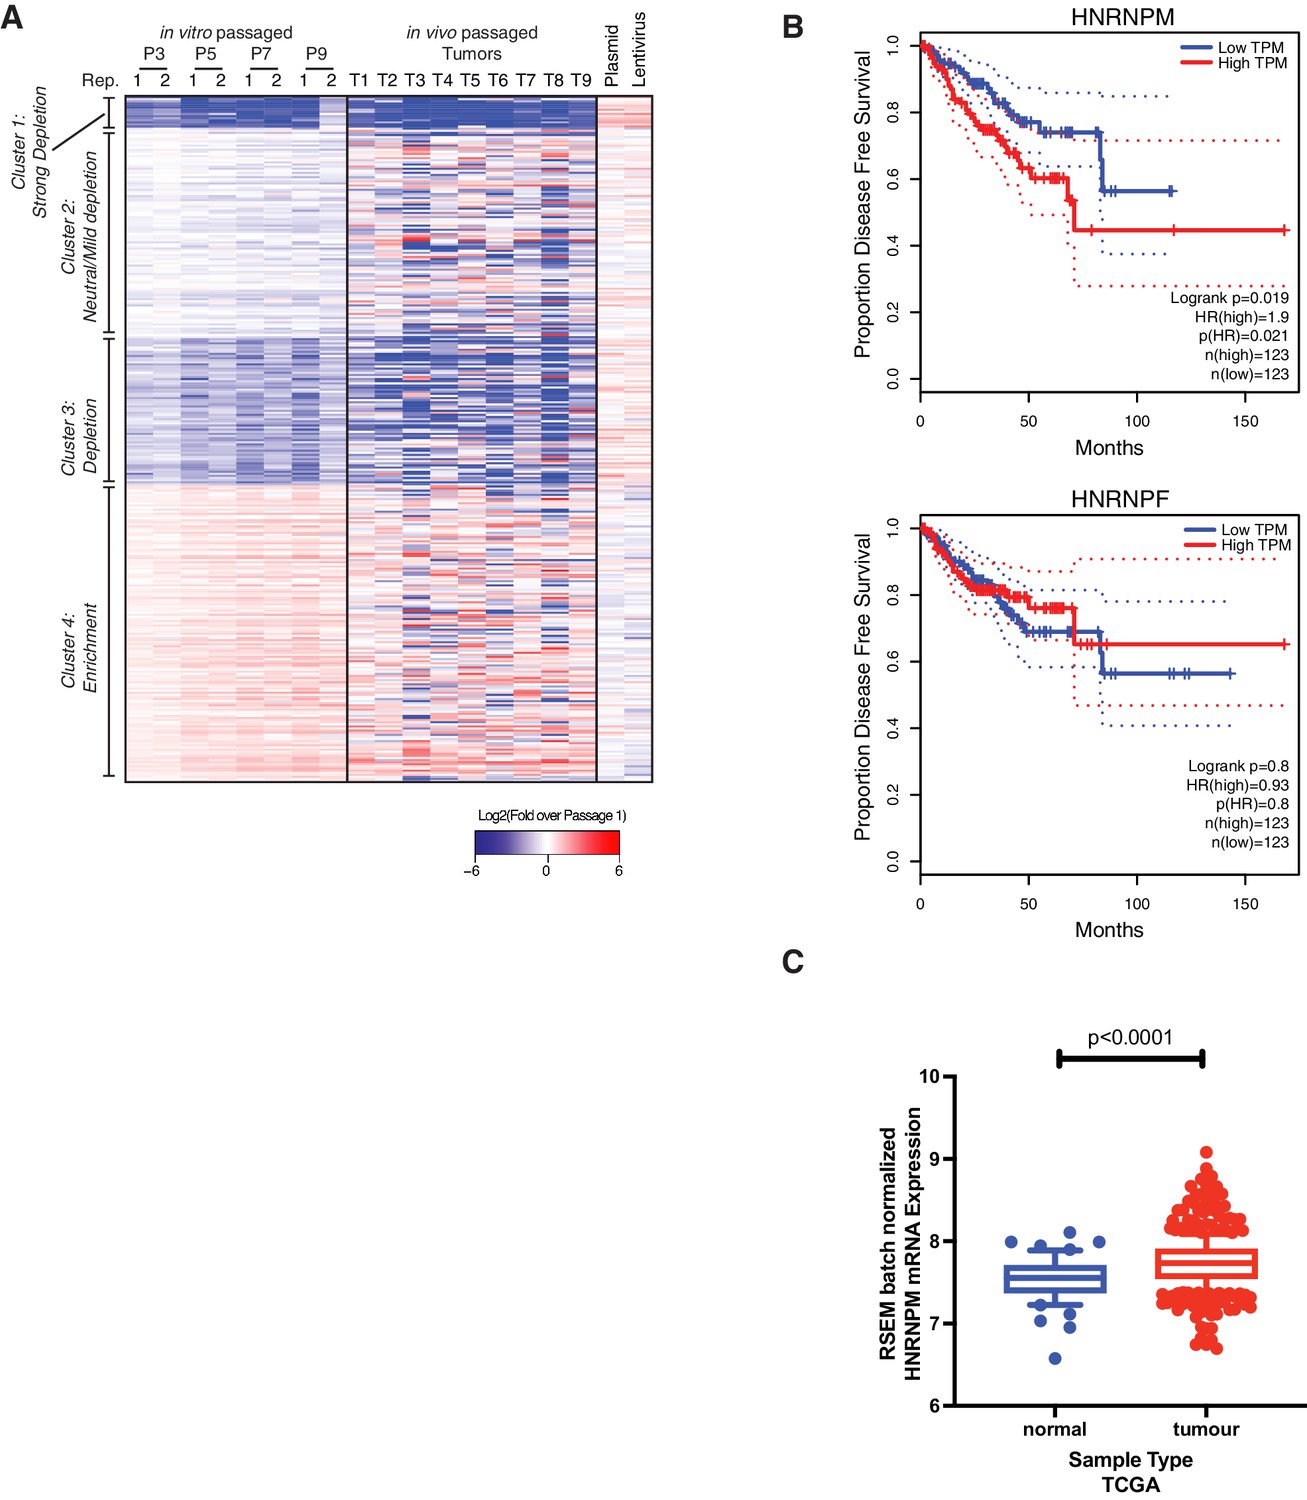
Verification of top hits in the pooled shRNA screen.
(A) Heatmap showing overall hairpin enrichment over time in in vitro passaged LNCAP cells (left), in vivo LNCAP xenografts (center), as well as input PLKO.1 plasmid and lentiviral pools (right). Colors are shown in relation to the first passage of cells collected after completion of puromycin selection (P1), where blue indicates depletion and red indicates enrichment of the individual hairpin over time. (B) Disease-free survival curves of prostate cancer patients that express high (>75th percentile) or low (≤25th percentile) of HNRNPM or HNRNPF. Data were plotted using GEPIA (Tang et al., 2017) and based on publicly available The Cancer Genome Atlas (TCGA) datasets. (C) HNRNPM mRNA expression levels of normal versus tumor samples in the TCGA prostate adenocarcinoma (PRAD) dataset. p-values were determined with Wilcoxon test.
Figure 2 with 2 supplements
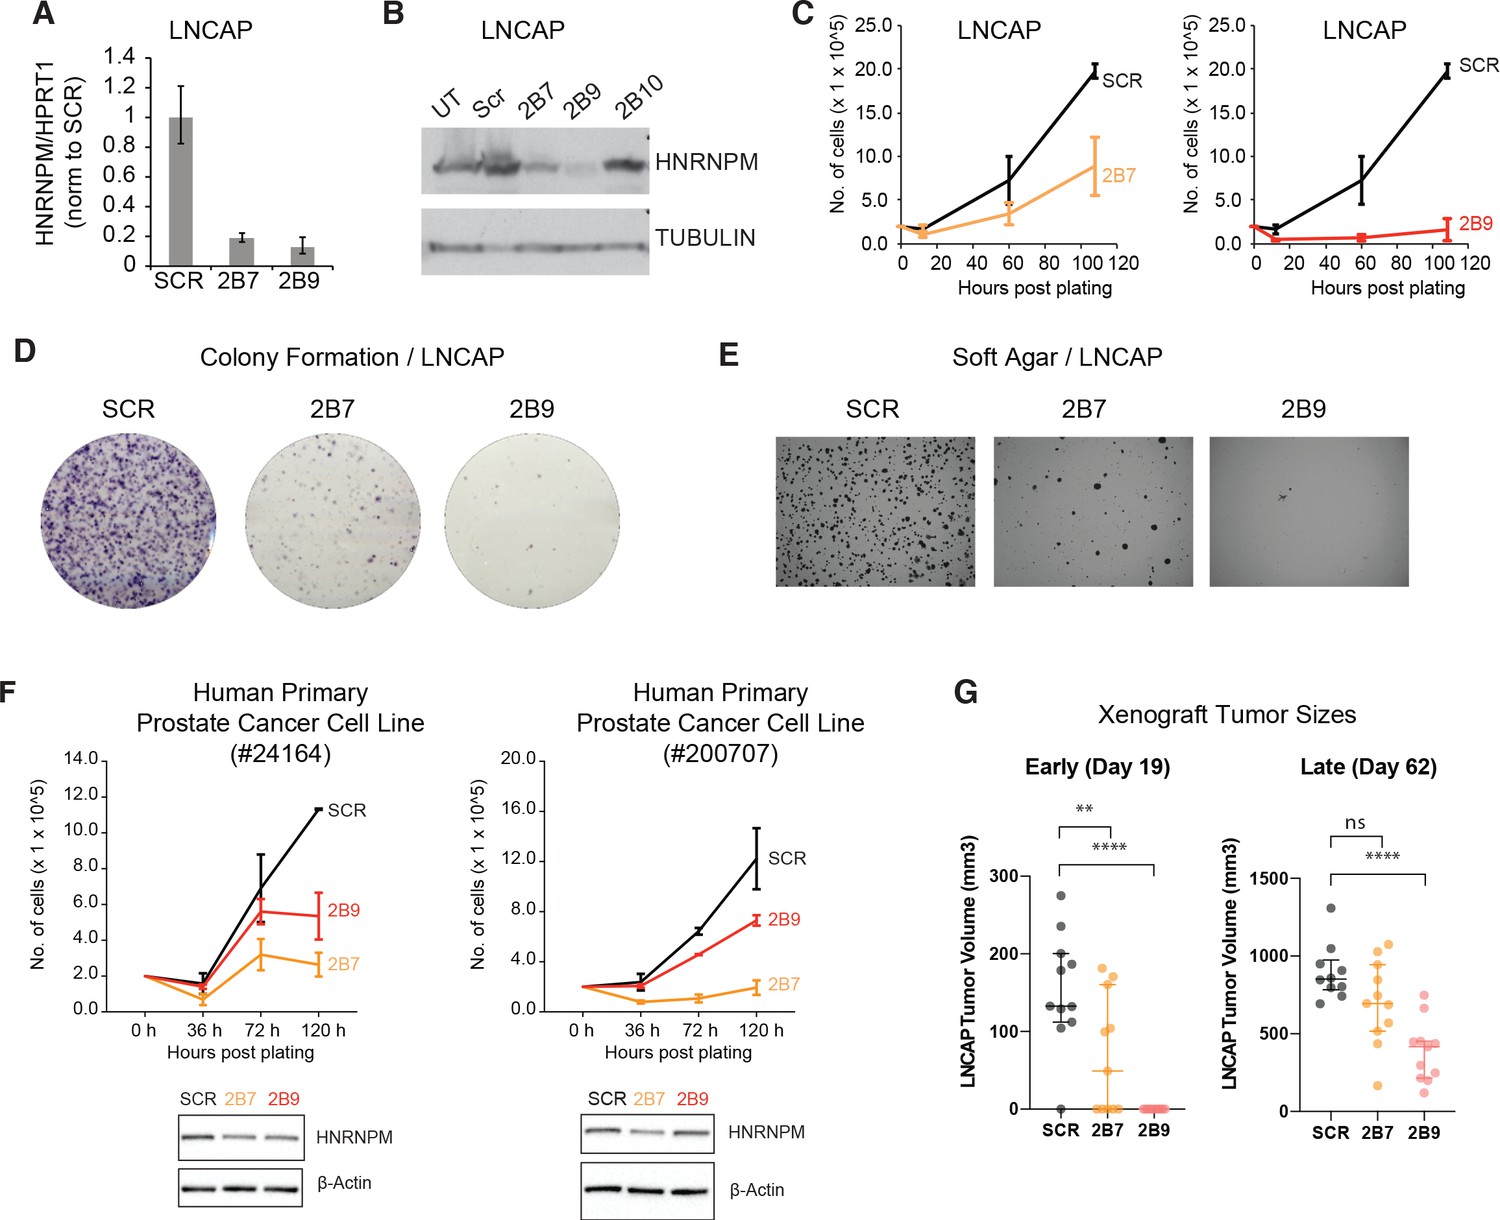
HNRNPM inhibits prostate cancer (PCa) cell growth in vitro and in vivo.
HNRNPM RNA (A) and protein levels (B) upon expression of scrambled (Scr) or HNRNPM-specific shRNAs (2B7, 2B9, 2B10) in LNCAP cells. UT: untreated cells. (C) Cell proliferation assays of LNCAP cells expressing either scrambled or HNRNPM-specific shRNAs (2B7 and 2B9). Shown are the mean and standard deviation of two biological replicates. (D) Colony formation assays and (E) anchorage-independent growth (soft agar assays) of LNCAP cells expressing either scrambled or HNRNPM-specific shRNAs (2B7 and 2B9). Shown are representative scans of three independent replicates. (F) Cell proliferation (top panels) and western blot (lower panels) of two independently derived primary human PCa cell lines (#24164 and #200707) expressing either SCR or HNRNPM-specific shRNAs (2B7 and 2B9). Shown are the mean and standard deviation of two biological replicates. Protein expression of HNRNPM and β-actin at assay start is shown below. (G) Size of xenografted, SCR, or HNRNPM-specific shRNA (2B7, 2B9) expressing LNCAP tumors at 19 and 60 days post injection in 6–8-week-old CB17-SCID mice (n = 11 per condition). A one-way ANOVA/Dunnet’s post-hoc test was used to calculate p-values. Ns: not significant. **p<0.01; ****p<0.0001.
Figure 2—figure supplement 1
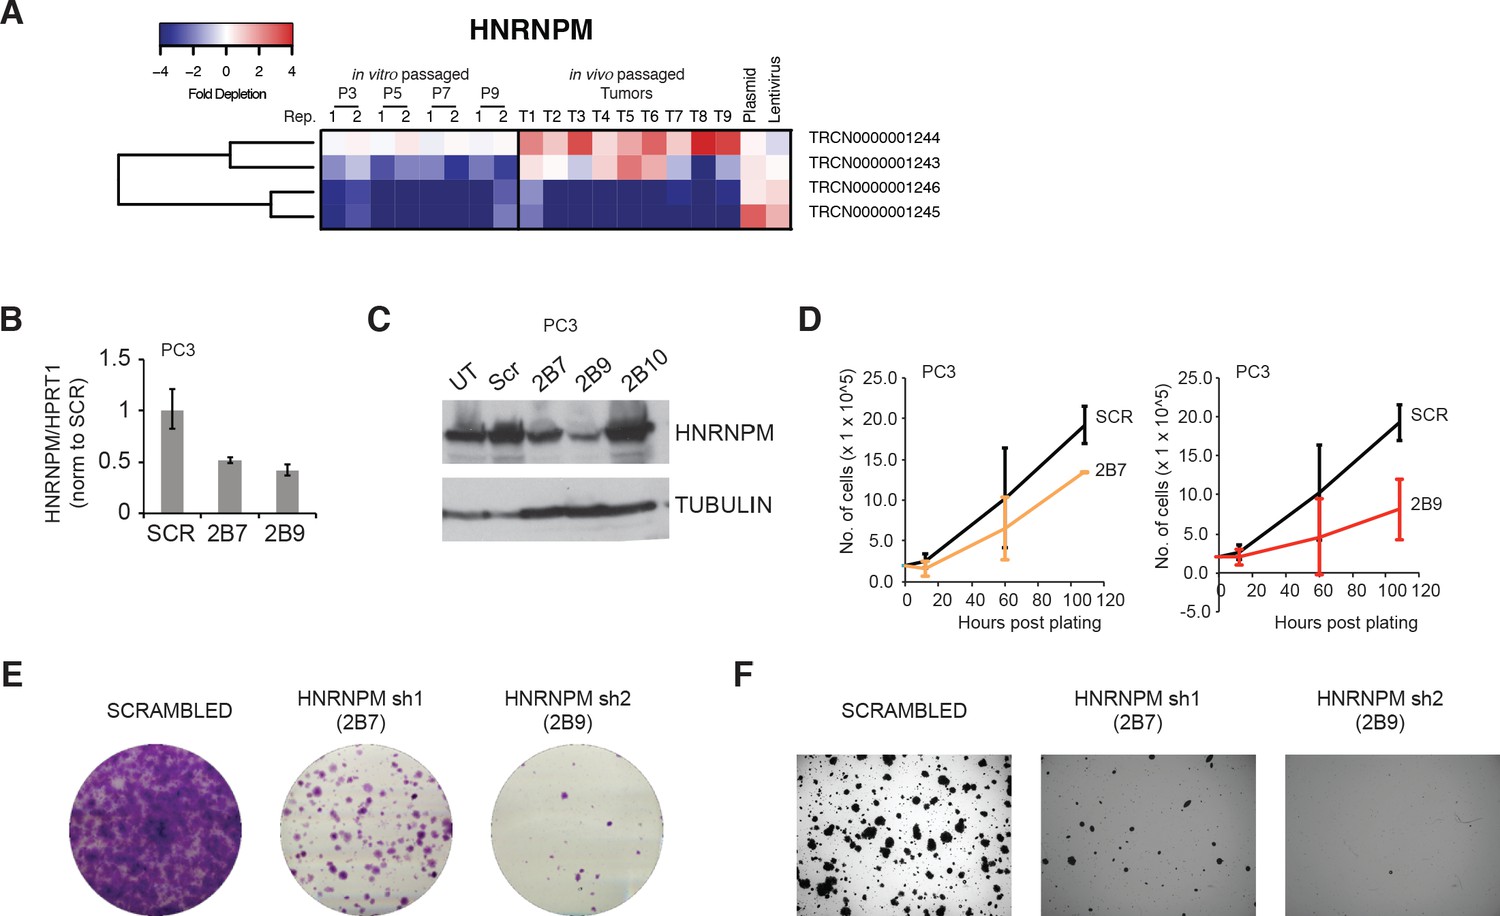
Impact of HNRNPM deficiency in independent prostate cancer (PCa) cell lines.
(A) Heatmap showing relative enrichment and depletion of HNRNPM-specific shRNAs in the screen. (B) HNRNPM RNA and (C) protein levels upon expression of scrambled or HNRNPM-specific shRNAs (2B7, 2B9, or 2B10) in PC3 PCa cells. (D) Cell proliferation assays of PC3 PCa cells expressing with either scrambled or HNRNPM-specific shRNAs (2B7 and 2B9). (E) colony formation assays and (F) anchorage-independent growth (soft agar assays) of shRNA-treated PC3 cells.
Figure 2—figure supplement 2
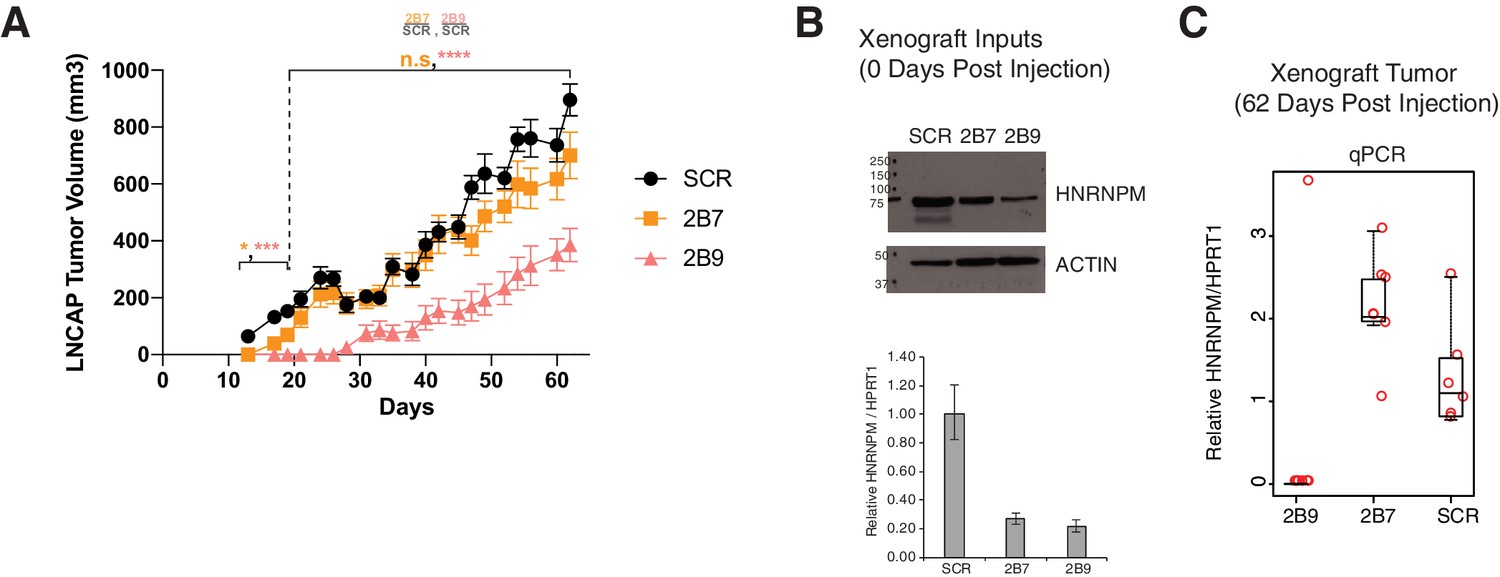
Xenograft tumor growth over time.
(A) LNCAP cells treated with scrambled (SCR; black lines) or HNRNPM-specific shRNAs (2B7; orange lines or 2B9; red lines) (n = 11 for all three conditions) per injected into the flanks of CB17-SCID mice at day 0. Shown are the mean and SEM of tumor volumes over time (days post injection). Tumor volumes between SCR and 2B7 tumors were only significant different at less than 20 days post injection, while tumor volumes between SCR and 2B9 were significantly different in size throughout the experiment. p-values were calculated using a two-way mixed model ANOVA/Tukey multiple comparisons post-hoc test. (B) Western blotting and RNA analysis of cells used as input for xenograft experiments (top panel). (C) qPCR analysis of RNA isolated from tumors harvested from xenografted mice at 62 days post injection. Each dot indicates one tumor.
Figure 3 with 1 supplement
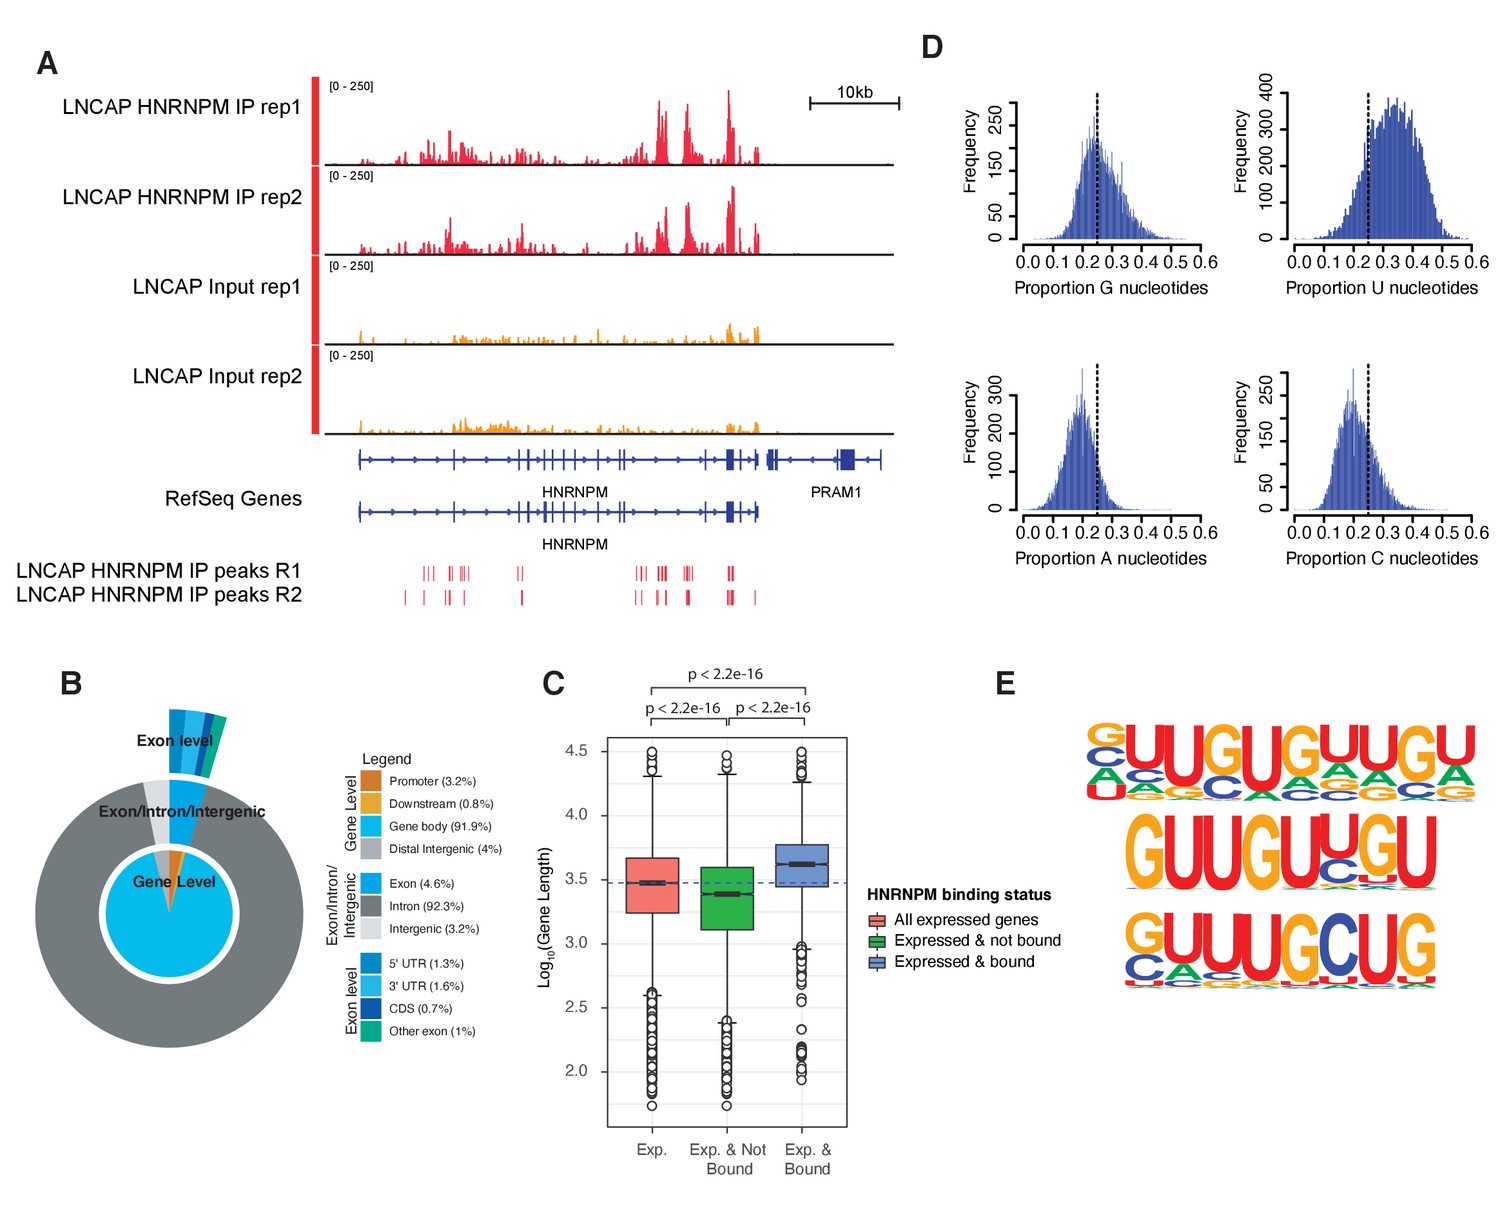
HNRNPM binds guanidine and uridine (GU)-rich elements within long introns.
(A) Normalized read density of HNRNPM eCLIP at the HNRNPM and PRAM1 genes. Input (yellow) and immunoprecipitation (red) tracks are shown. High-confidence (p<0.05, fold enrichment >2) peaks are shown in the lowest track. (B) Distribution of HNRNPM-bound peaks across different genomic features. Relative frequency of total of specific events is indicated in the legend. (C) Distribution of gene lengths in all expressed genes (red), expressed and non-HNRNPM-bound genes (green) and expressed and HNRNPM-bound genes (blue). Log10(Gene length in base pairs) is plotted. (D) Histogram plot of nucleotide frequencies within called, high-confidence HNRNPM-bound peaks. (E) Motif analysis of HNRNPM-bound peaks. Shown are the top three (from top to bottom; p=1e-726, p=1e-625, and p=1e-597) motifs found within intragenic HNRNPM-bound sites.
Figure 3—figure supplement 1
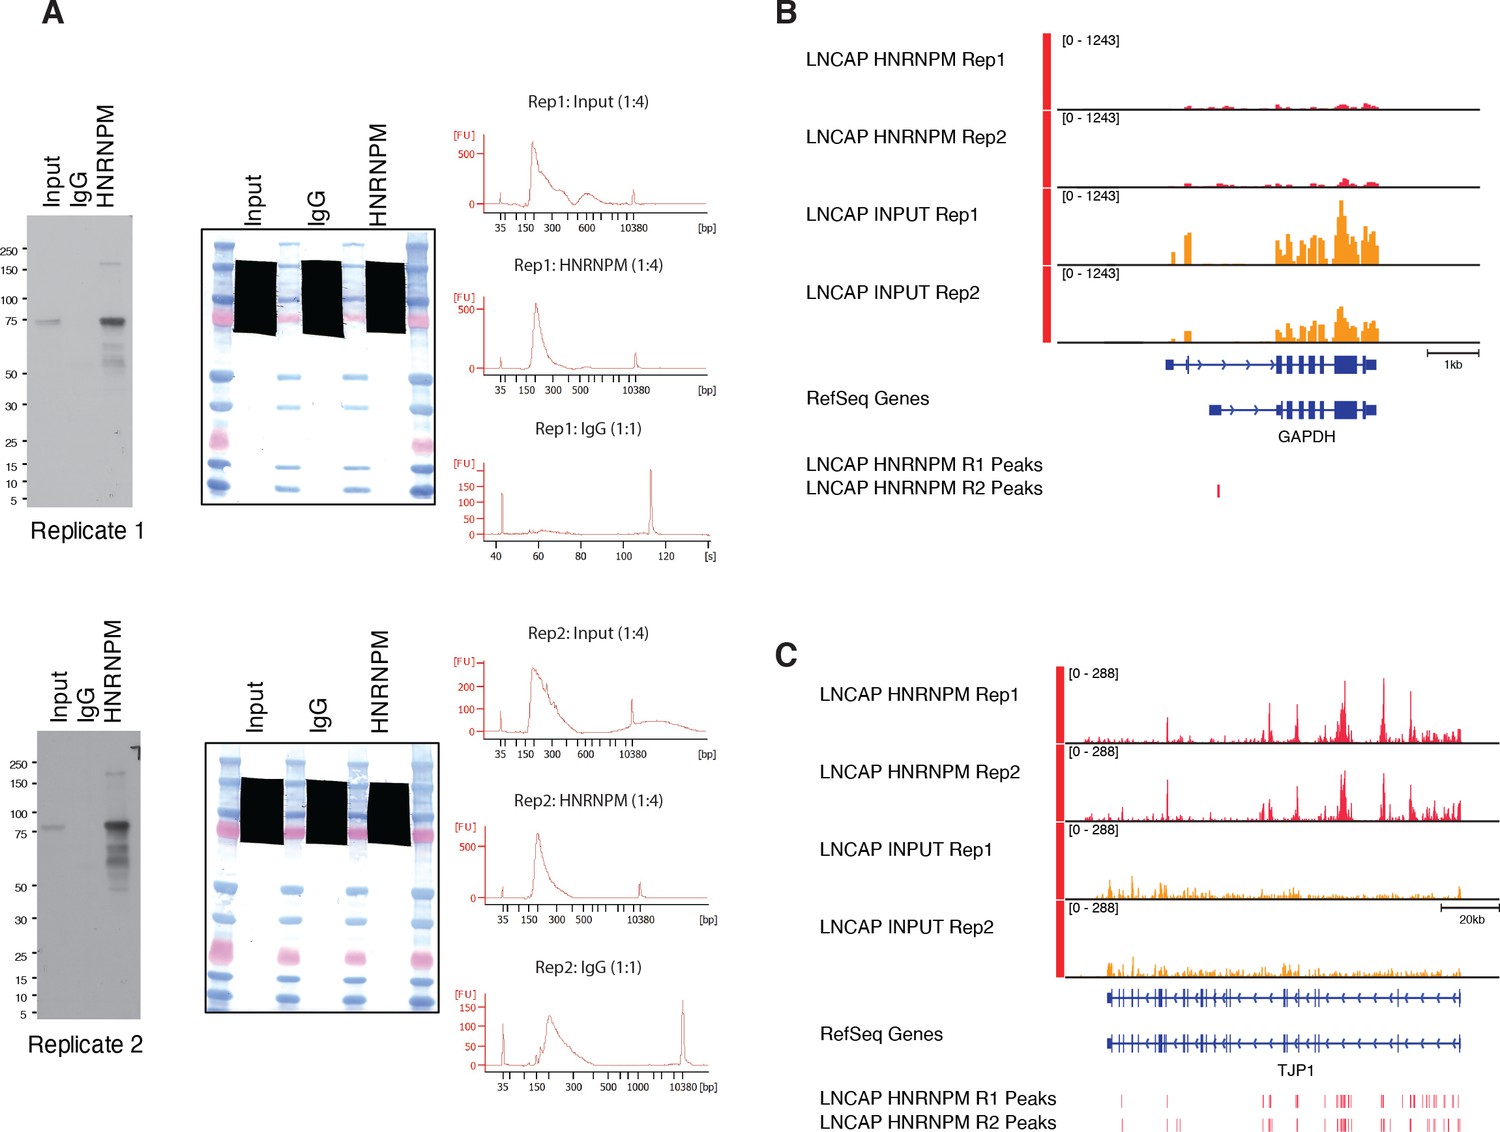
eCLIP analysis of HNRNPM-binding sites (associated with Figure 3).
(A, left) Immunoprecipitation-western blot validation of anti-HNRNPM antibody pull-down efficiency in UV-crosslinked LNCAP lysates. (A, center) Scan of membrane showing regions excised for eCLIP library preparation. (A, right) High-sensitivity DNA Bioanalyzer traces of eCLIP libraries used for sequencing. (B, C) Read density of HNRNPM eCLIP at an HNRNPM-bound locus, TJP1 (C), and a non-bound locus, GAPDH (B). Bars indicate high-confidence (p<0.05, fold enrichment >2) called eCLIP peaks.
Figure 4
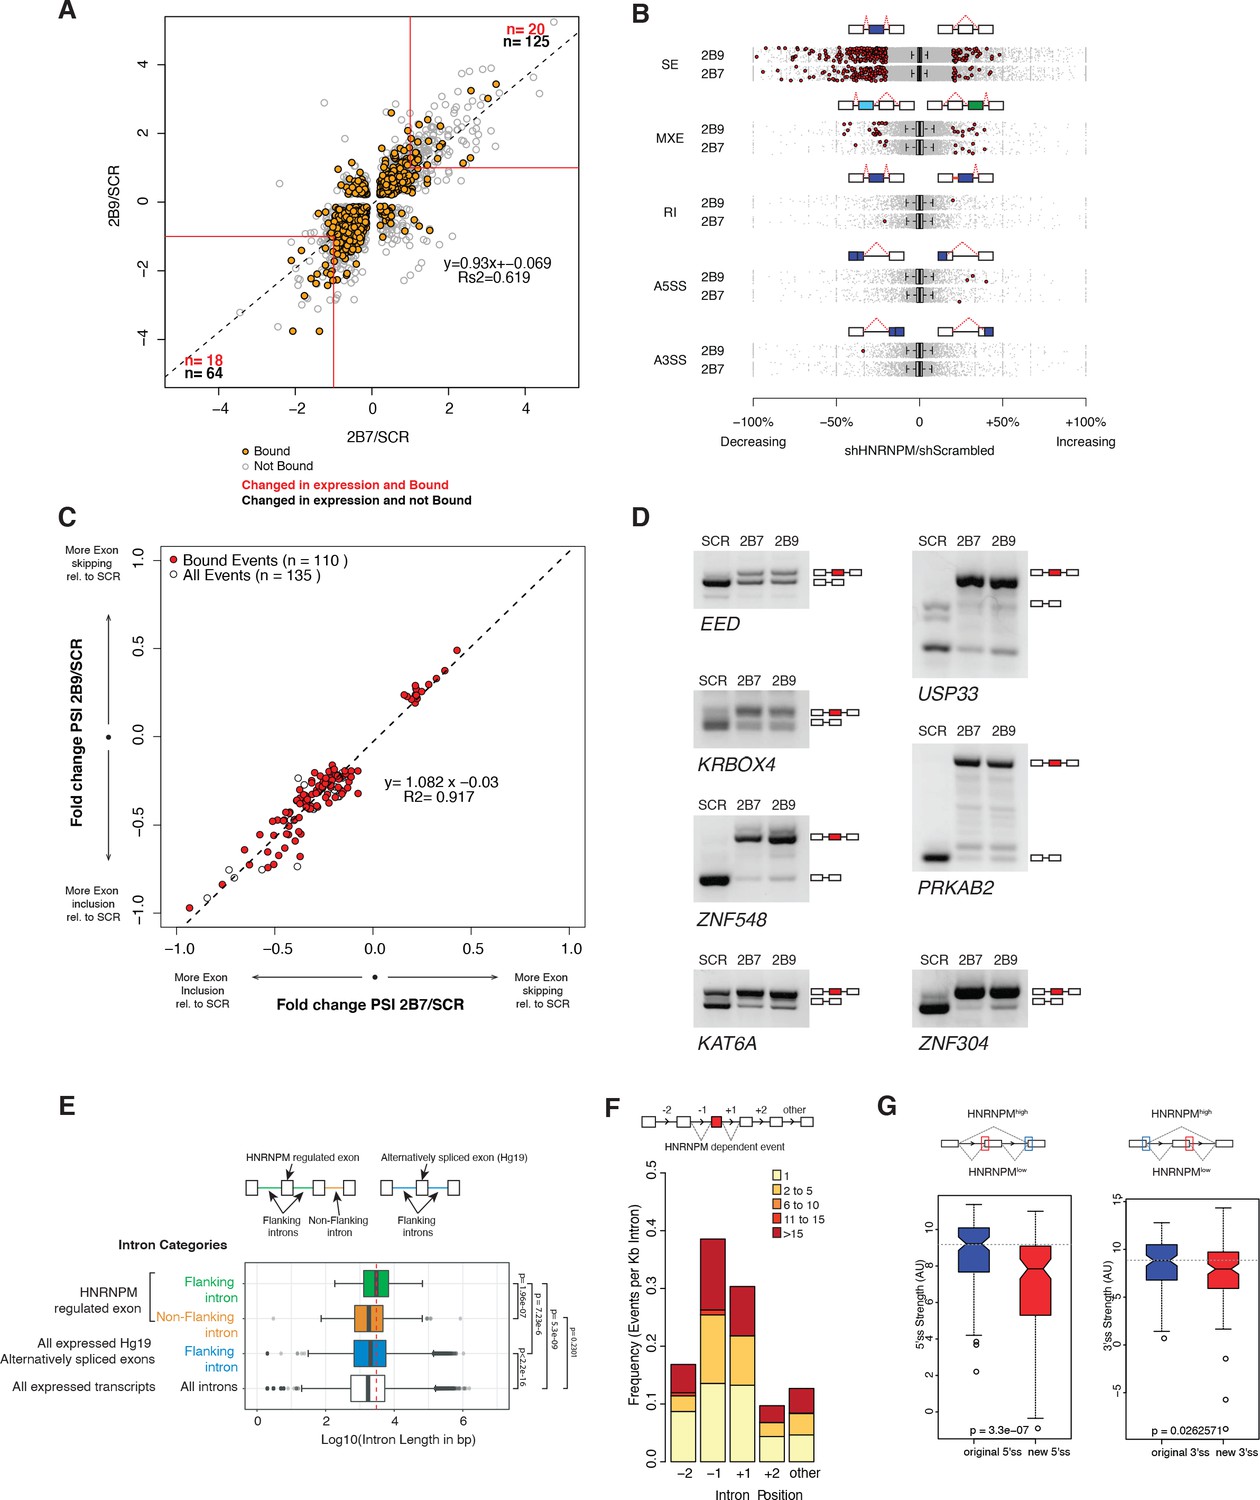
HNRNPM depletion results in increased exon inclusion.
(A) Scatterplot of all significantly changed (p<0.05, FDR < 0.05) genes (gray point) in HNRNPM shRNA-treated cells, and their HNRNPM-binding status. HNRNPM-bound genes are highlighted in orange. Red boxes denote a twofold change cutoff. The total numbers of differentially expressed genes (p<0.05, FDR < 0.05, fold change ≥ 2) are indicated in black, and the numbers of genes that are differentially expressed and bound by HNRNPM are indicated in red. (B) Plots showing all alternative splicing events occurring in HNRNPM shRNA-treated cells. All unique captured events are plotted in gray, while significantly changing events are shown in red. Change in percent spliced in (ΔPSI; HNRNPM shRNA [2B9] versus scrambled shRNA) for the captured events is shown on the x axis. RI: retained intron; A3SS: alternative 3′ splice site usage; A5SS: alternative 5′ splice site usage; MXE: mutually exclusive exons; SE: skipped exon. (C) Scatterplot of splicing events that are significantly changed (p<0.05, FDR < 0.05, |ΔPSI| > 0.2) in both HNRNPM shRNA (2B7 and 2B9) conditions. ΔPSI is calculated relative to scrambled shRNA-treated cells (SCR). Shown in red are events that occur in transcripts that are bound by HNRNPM. (D) RT-PCR validation of seven representative differentially spliced events that occur in HNRNPM-depleted cells. (E) Distribution of unique intron lengths in the introns flanking linear mis-splicing events (green) compared to that of other introns in the same transcript (orange). Shown also are distribution of lengths in introns flanking other alternatively spliced exons (blues) or all introns within expressed genes. Introns are plotted as Log10(length in base pairs). p-values were determined by Wilcoxon test. (F) Distribution of the numbers of HNRNPM-binding sites across the indicated introns in transcripts with linear mis-splicing events. (G) 5′ (right) and 3′ (left) splice site strength as compared to original, flanking splice sites in HNRNPM-dependent linear transcripts.
-
Figure 4—source data 1
Gene expression changes in all HNRNPM-bound genes.
- https://cdn.elifesciences.org/articles/59654/elife-59654-fig4-data1-v2.xlsx
-
Figure 4—source data 2
Binding status of all significantly differentially expressed genes in HNRNPM knockdown.
- https://cdn.elifesciences.org/articles/59654/elife-59654-fig4-data2-v2.xlsx
-
Figure 4—source data 3
Binding status of significantly changed skipped exon events.
- https://cdn.elifesciences.org/articles/59654/elife-59654-fig4-data3-v2.xlsx
Figure 5 with 1 supplement
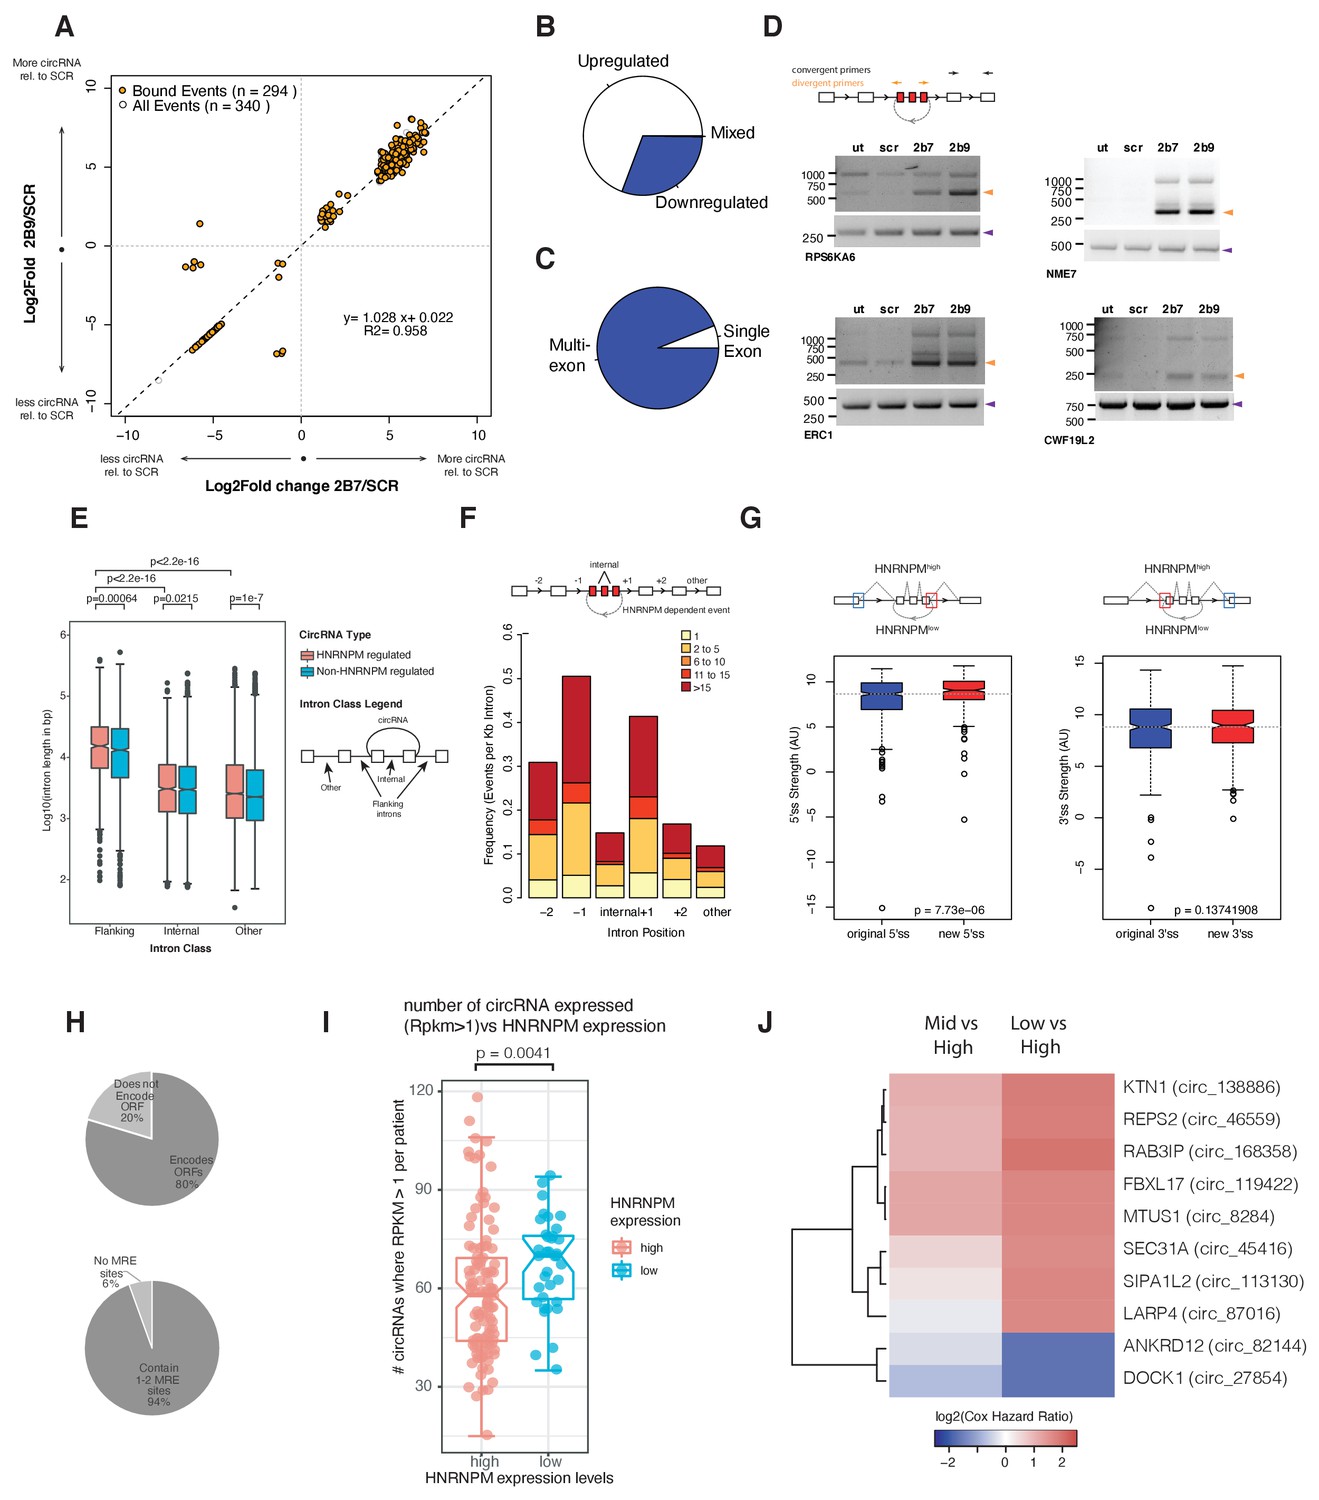
HNRNPM depletion results in increased circular RNA (circRNA) formation.
(A) Scatterplot of circRNA events that are significantly (p<0.05, FDR < 0.05) changed in sh2B7 or sh2B9-treated cells compared to scrambled shRNA-treated cells. All individual captured events are plotted in gray, genes highlighted in orange are bound by HNRNPM. (B) Distribution of upregulated and downregulated circRNAs in HNRNPM-deficient cells. (C) Distribution of multi-exonic or single-exon circular RNAs regulated by HNRNPM. (D) Semi-quantitative RT-PCR validation of four representative circRNA events occurring in sh2B7 or sh2B9-treated cells. (E) Distribution of unique intron lengths in the introns flanking circular, HNRNPM-dependent and -bound (red) backsplicing events compared to that of other introns (internal or other) in the same transcript. As a reference, intron lengths of circRNAs that are not regulated and not bound by HNRNPM are shown in blue. Introns are plotted as Log10(length in base pairs). p-values were determined by Wilcoxon test. (F) Distribution of the numbers of HNRNPM-binding sites across the indicated introns in transcripts with circular mis-splicing events. (G) 5′ (right) and 3′ (left) splice site strength as compared to original, flanking splice sites in HNRNPM-dependent circular transcripts. (H) Distribution of HNRNPM-dependent circRNAs that encode ORFs or have miRNA-response elements. (I) circRNA expression levels in patients that express high or low levels of HNRNPM. (J) Heatmap showing the log2(Cox regression hazard ratios) of patients expressing low or mid levels of the indicated circRNAs when compared to patients expressing high levels of the same circRNA. Shown only are the HNRNPM-regulated circRNAs that significantly (p<0.1) predicted disease-free survival in patients with prostate cancer.
-
Figure 5—source data 1
Binding status of significantly changed circular RNAs.
- https://cdn.elifesciences.org/articles/59654/elife-59654-fig5-data1-v2.xlsx
Figure 5—figure supplement 1
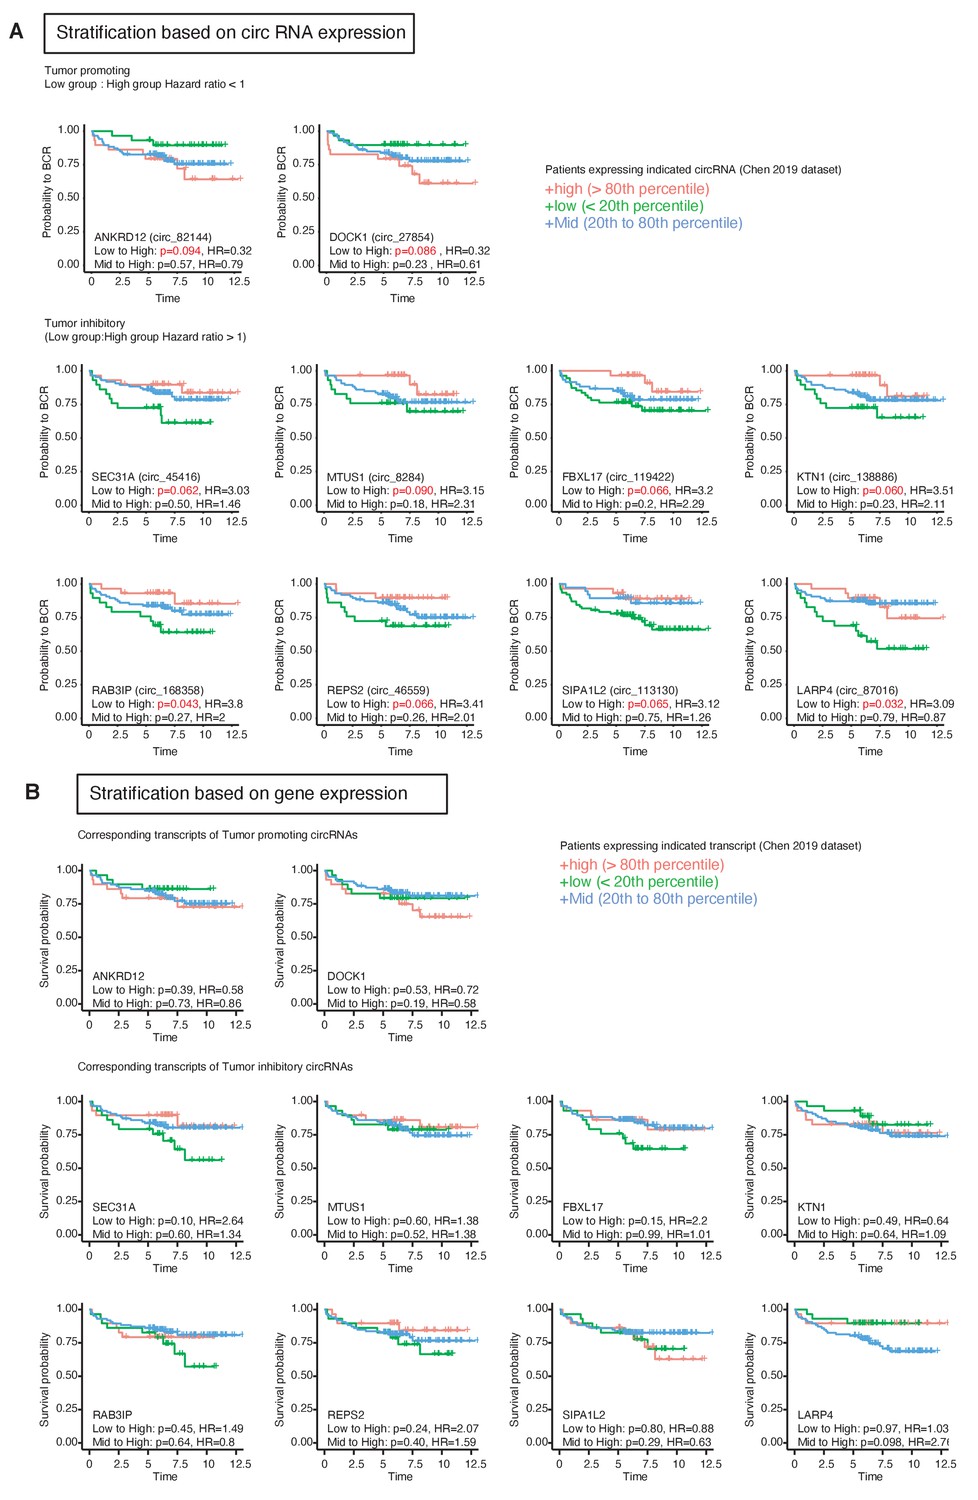
A subset HNRNPM-regulated circular RNA (circRNA) significantly predicts patient survival (associated with Figure 5).
(A) Biochemical relapse survival curves of prostate cancer patients expressing high (>80th percentile), low (≤20th percentile), or mid (20th–80th percentile) levels of the indicated circRNAs. Shown below are the Cox regression analysis p-values and hazard ratios for the indicated comparisons. p<0.1 are shown in red. Shown only are the HNRNPM-regulated circRNAs that significantly (p<0.1) predicted disease-free survival in patients with prostate cancer. (B) Biochemical relapse survival curves of prostate cancer patients with high (>80th percentile), low (≤20th percentile), or mid (20th–80th percentile) total expression levels of the genes shown in (A). Cox regression analysis p-values and hazard ratios for the indicated comparisons are shown below each plot.
Figure 6 with 3 supplements
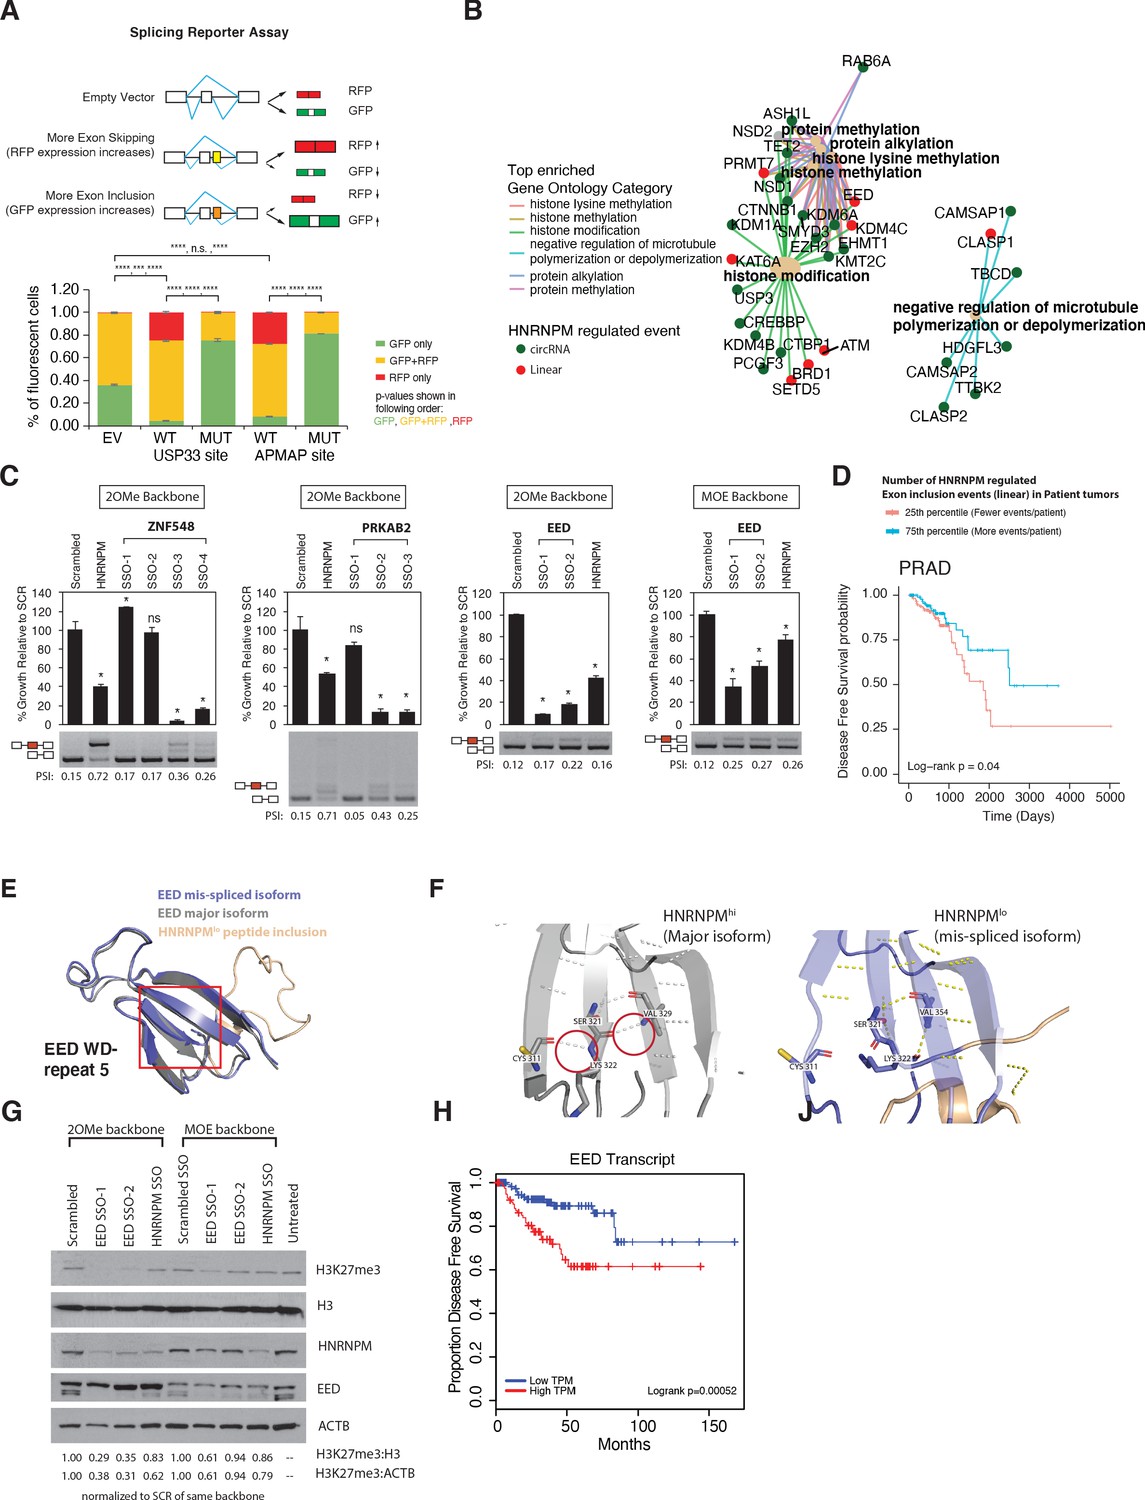
Mimicking HNRNPM-dependent linear-splicing events in cells inhibits exon inclusion and cell growth.
(A, top panel) Schematic showing outcomes of splicing reporter assay. Wildtype (WT) or mutant (MUT) HNRNPM-binding sites at the USP33 or APMAP genes and identified by eCLIP were cloned into a splicing reporter. The percentages of green fluorescent protein (GFP) (indicating exon inclusion) and dsRed fluorescent proteins (RFP) (indicting exon skipping) single- (green and red bars) and double-positive cells (yellow bars) out of all fluorescent cells are shown in a barplot in the lower panel. Shown are the mean and standard deviation of three experiments. Student’s t-test was used to calculate p-values between the indicated groups. Ns: not significant; ** p<0.01; **** p<0.0001. (B) Gene ontology analysis of transcripts that are either changed in expression or mis-spliced upon HNRNPM knockdown. Both mis-spliced circular (green dots) and linear (red dots) RNAs are shown. Top enriched gene ontology categories (yellow dots) and the genes present in each category are indicated with colored lines. (C) Cell proliferation and exon inclusion outcomes in splice-switching-antisense-oligonucleotides (SSO)-treated cells as compared to scrambled SSO-treated cells. For proliferation assays, growth is shown relative to cells treated with the scrambled non-targeting SSO. The mean and standard deviation of three biological replicates are shown. p-values for growth were determined using Student’s t-test. *p<0.05. A representative splicing gel together with the PSI of the HNRNPM-regulated isoforms are shown below each barplot. As controls, a HNRNPM targeting SSO is also included (lane 2). For each gene (ZNF548, PRKAB2, and EED), multiple SSOs targeting different sequences were used. ZNF548 SSO-1, ZNF548 SSO-2, and PRKAB SSO-1 are control SSOs that do not induce inclusion events. For the EED event, both 2-O-methyl (2OMe) and 2-methoxy-ethyl (MOE)-based SSO backbone chemistries were used to control for potential toxicities due to SSO transfection. SSO backbone chemistries used are indicated at the top of each panel. (D) Disease-free survival plot of The Cancer Genome Atlas (TCGA) prostate adenocarcinoma (PRAD) patients, stratified by the total number of events per patient where the PSI of a given HNRNPM-regulated exon exceeds that of the median PSI within the patient population. Patients with more exon inclusion events (top 75th percentile) are shown in blue, whereas patients with less exon inclusion events (lower 25th percentile) are shown in red. (E) WD40 domain 5 of EED when the HNRNPM-regulated exon 10 is included. Structure of the HNRNPM-regulated WD40 domain in WT EED (gray), superimposed on the predicted structure of the HNRNPM-dependent EED isoform (blue). The new peptide generated by the splicing event is depicted in orange. (F) Closeup view of hydrogen bonding interactions that stabilize the WD40 beta sheet in either WT or the new EED isoform. (G) Western blot of H3K27me3 (EED target), HNRNPM, and EED upon treatment with the scrambled, HNRNPM-targeting SSO (HNRNPM) or SSOs that promote the inclusion of EED exon 10 (EED SSO-1 and SSO-2). Backbone chemistry of the SSOs used is indicated. Untreated cells are included as controls. HNRNPM. Shown also are histone 3 and actin B loading controls. (H) Disease-free survival curves of prostate cancer patients when expression in transcripts per million (TPM) of EED is low (blue) or high (red).
Figure 6—figure supplement 1
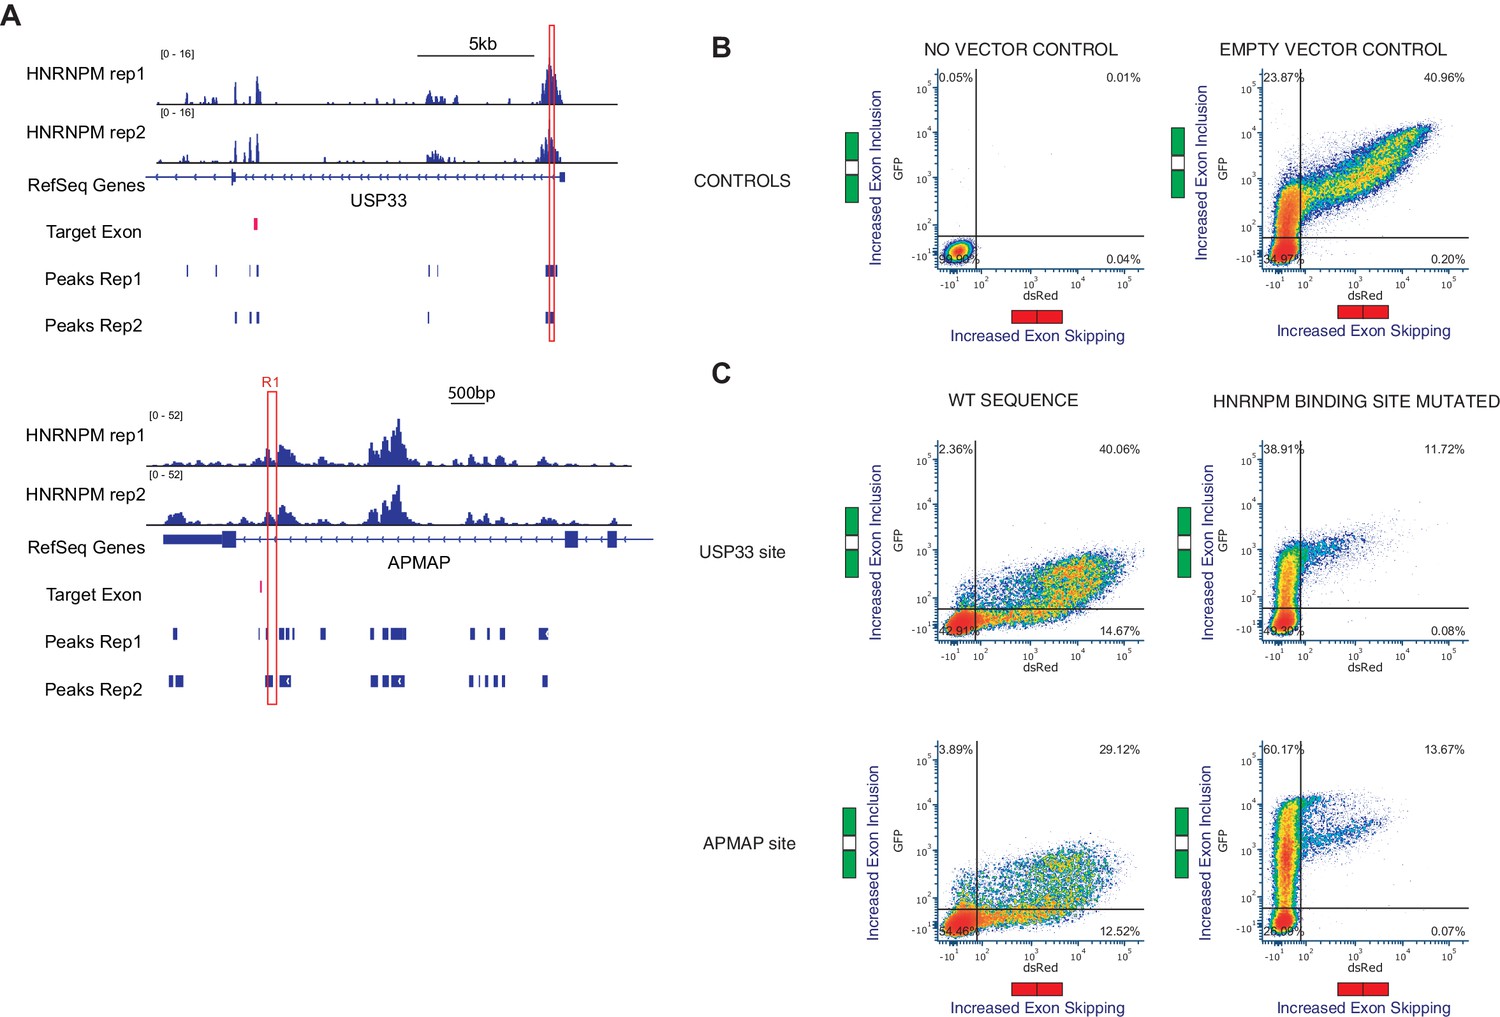
HNRNPM-bound sequences inhibit exon inclusion.
(A) Plots showing HNRNPM-bound regions of the USP33 and APMAP gene that were cloned and inserted into the minigene construct. (B) Representative flow cytometry plots showing differential splicing patterns of cells that were transfected with the indicated constructs. Left: no plasmid control; right: unmodified vector control. y-axis shows increasing levels in exon inclusion, and x-axis shows increasing levels of exon skipping. (C) Representative flow cytometry plots showing differential splicing patterns of cells that were transfected with the indicated constructs. Left: vectors with wildtype HNRNPM-binding site; right: vectors with mutated HNRNPM-binding site. y-axis shows increasing levels in exon inclusion, and x-axis shows increasing levels of exon skipping.
Figure 6—figure supplement 2
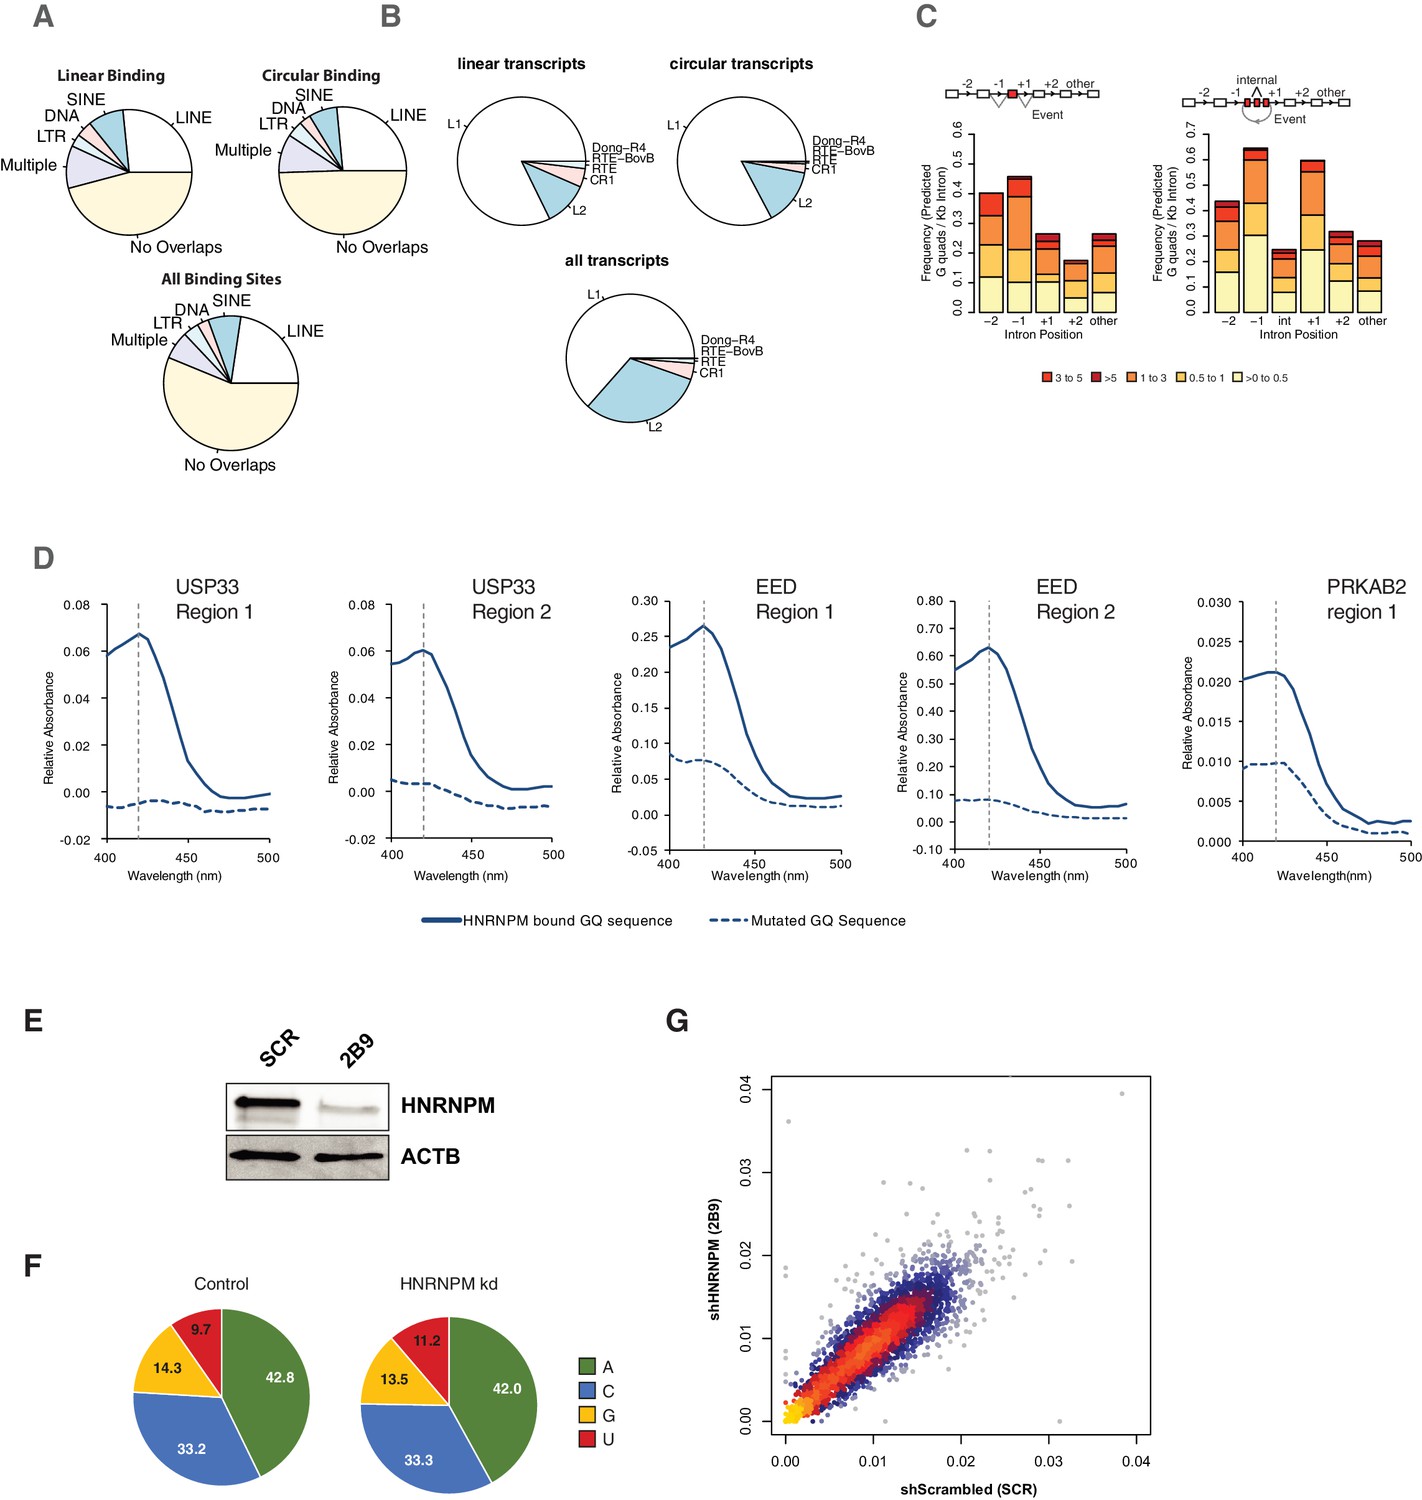
Structural characterization of HNRNPM-bound introns.
(A) Distribution of unique HNRNPM peaks found in the immediate flanking upstream and downstream introns of mis-spliced linear (top-left panel) or circular (top-right panel) mis-splicing events that share a >10% overlap with one or multiple classes of four types of repetitive elements (long-interspersed nuclear elements [LINEs], short-interspersed nuclear elements [SINEs], DNA, and long terminal repeat [LTR]). The overlap of these elements with HNRNPM peaks found across the transcriptome is indicated in the bottom panel. (B) Types of LINEs associated with HNRNPM-binding sites at mis-spliced linear (top-left panel) and circular (top-right panel) transcripts compared to that in regions bound by HNRNPM (bottom panel) across all transcripts. (C) Distribution of G-quadruplex-forming regions in the upstream (−1 or −2) or downstream (+1 or +2) introns relative to mis-spliced linear (left) or circular (right) events. Counts are normalized to the length of the intron. (D) Colorimetric, hemin-based assay for RNA G-quadruplex folding. RNA oligos of HNRNPM-binding sites of the USP33, EED, and PRKAB2 genes were folded in the presence of potassium and incubated with hemin. The presence of RNA G-quadruplexes in conjunction with hemin results in a peroxidase activity, which can be detected as an increase in absorbance at 420 nm. As a negative control, the same test oligos with mutated GQ sites were used (dotted lines). (E) HNRNPM protein levels in cells used for targeted DMS-MaPseq. (F) Base mutation frequencies in scrambled shRNA or HNRNPM (2B9) shRNA-treated LNCAP cells. (G) Overall correlation of the structure probing data for scrambled shRNA and HNRNPM shRNA (2B9)-treated cells. Representative HNRNPM-bound sites in the introns flanking mis-splicing events for PRKAB2, USP33, ZNF548, ZNF304, GMPR2, and GAPDH were used for this analysis.
Figure 6—figure supplement 3

HNRNPM regulates a multigenic splicing program to maintain cell proliferation.
(A) Distribution of predicted outcomes of HNRNPM-dependent linear-splicing events occurring in coding domains of affected genes. (B) Structure of the HNRNPM-regulated WD40 domain in wildtype EED protein (gray), superimposed on the predicted structure of the HNRNPM-dependent EED isoform (blue) that contains the 25 aa long peptide coded by the exon regulated by HNRNPM. The new peptide generated by the splicing event is depicted in orange. WD domains in EED are numbered. (C) Independent replicate of western blot shown in Figure 6G. H3K27me3 (EED target), HNRNPM, and EED upon treatment with the scrambled, HNRNPM targeting splice-switching-antisense-oligonucleotides (SSO) (HNRNPM) or SSOs that promote the inclusion of EED exon 10 (EED SSO-1 and SSO-2) is shown. Backbone chemistry of the SSOs used is indicated. Shown also are histone three and actin B loading controls.
Figure 7 with 1 supplement
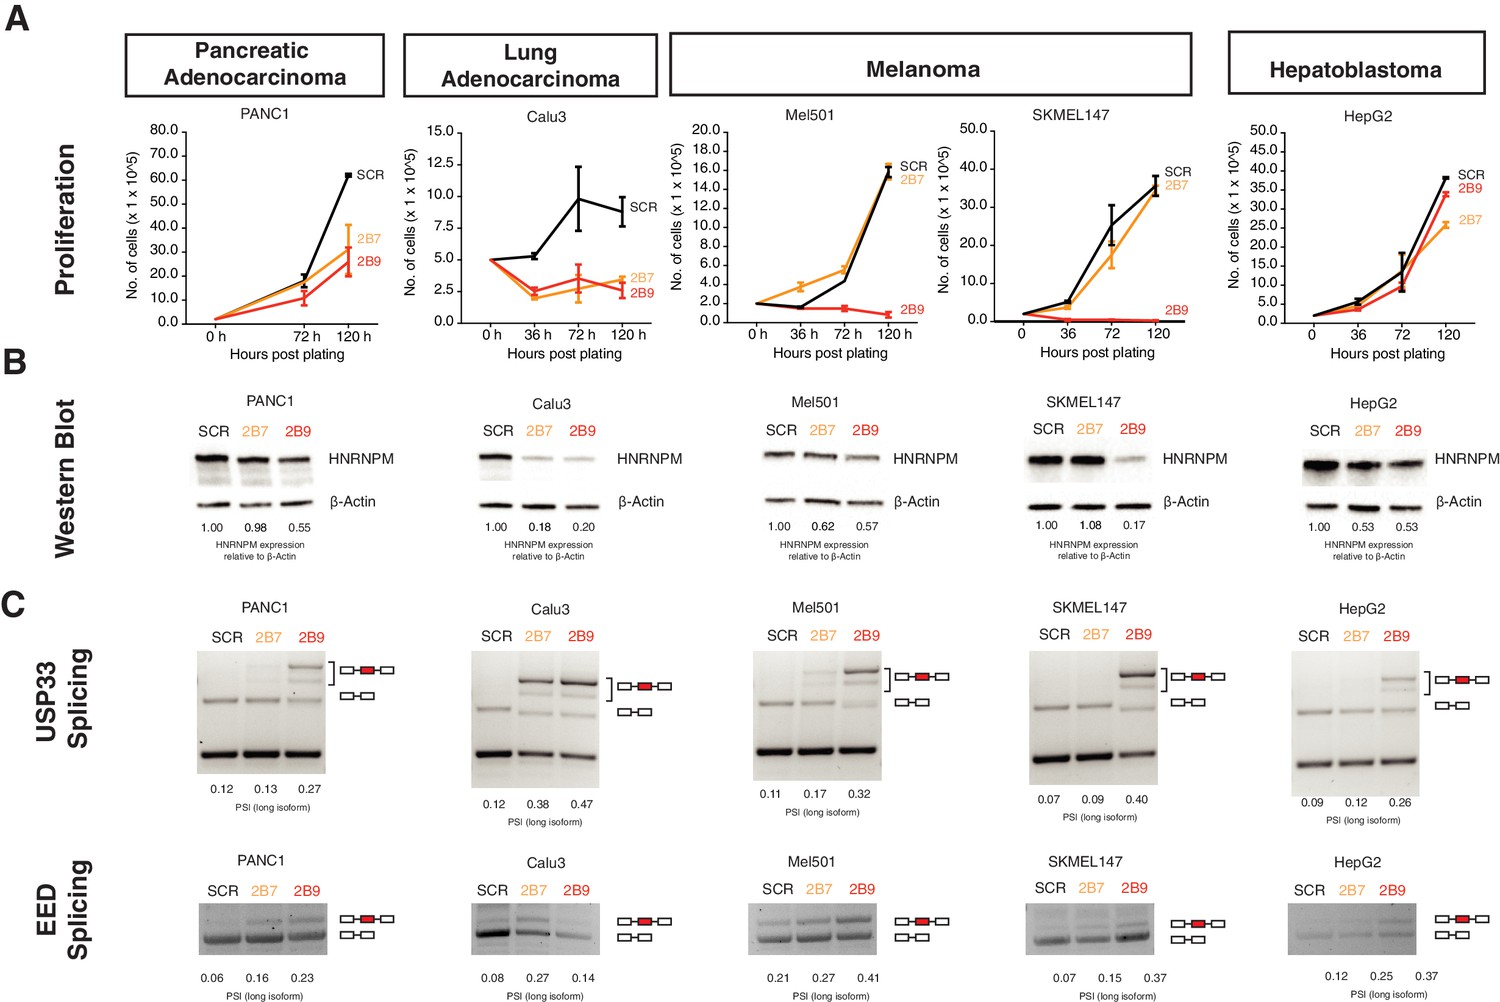
HNRNPM regulates growth and splicing in other cancer cell lines.
(A) Proliferation curves of PANC1, Calu3, Mel501, SKMEL147, and HepG2 cells, representing cell lines derived from pancreatic adenocarcinoma, lung adenocarcinoma, melanoma, and hepatoblastoma, upon treatment with scrambled (SCR; black) or HNRNPM-specific (2B7; orange or 2B9; red) shRNAs. Shown are the mean and standard deviation of two biological replicates. (B) HNRNPM expression in the indicated cell lines, upon SCR or HNRNPM-specific (2B7 or 2B9) shRNA treatment. ImageJ quantification of HNRNPM protein levels relative to β-actin is shown below. (C) Effect of HNRNPM knockdown on the USP33 and EED transcripts in the indicated cell lines. PSI of HNRNPM-regulated exons, as quantified by ImageJ, is shown below each lane.
Figure 7—figure supplement 1
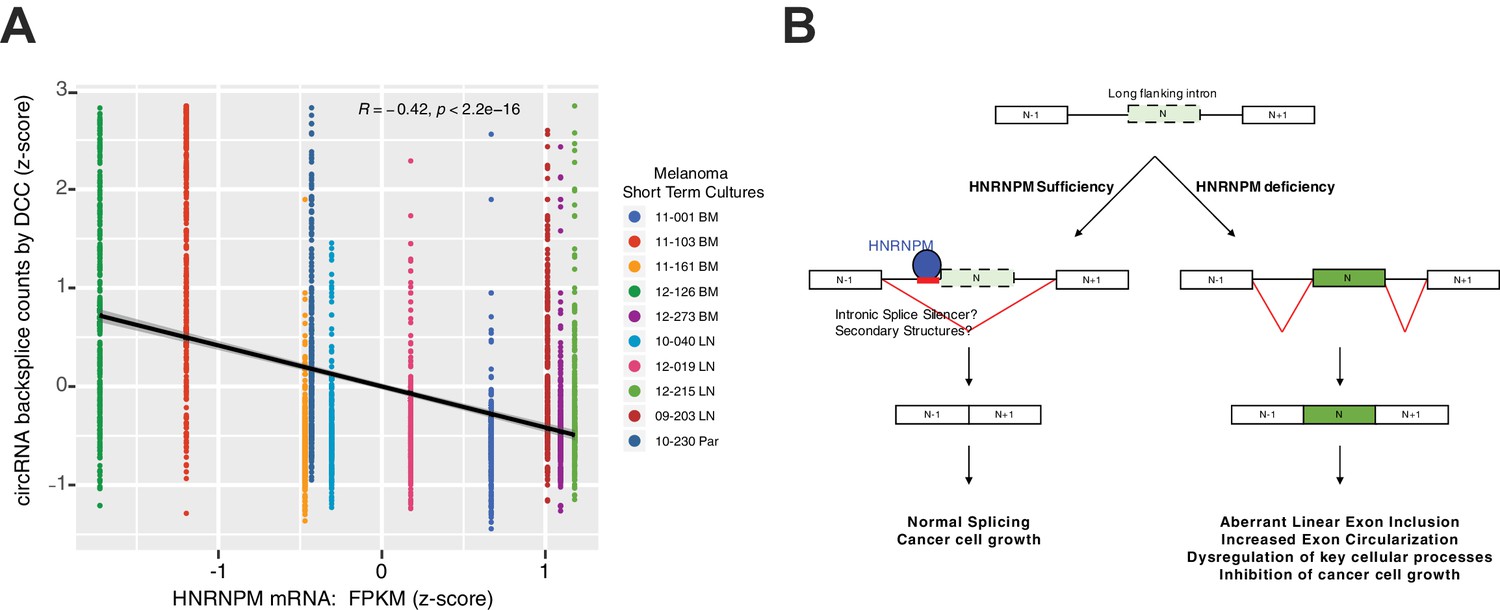
HNRNPM mRNA levels are negatively correlated with target circular RNA (circRNA) levels in melanoma short-term cultures.
(A) Short-term cultures were subjected to RNA-sequencing following rRNA removal. BM: brain metastasis sample; LN: lymph node metastasis; Par: parotid gland metastasis. Numbers of short-term cultures represent internal patient IDs. Of 332 circRNAs associated with HNRNPM in prostate cancer (PCa; see Figure 5—source data 1), 290 were expressed in melanoma short-term cultures and so are visualized here. (B) Model summarizing the role of HNRNPM in PCa cells.
Author response image 1
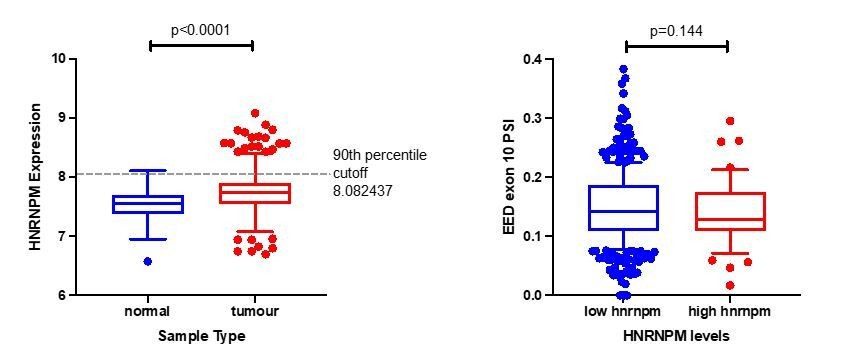
Analysis of EED exon10 inclusion in TCGA patient samples.
(a) To stratify patients between “high hnrnpm” and “low hnrnpm” expression, we used a 90th percentile cutoff within tumor samples. This cutoff was chosen based on HnRNPM expression in normal samples. (b) EED exon 10 PSI levels were examined between patients that had “high hnrnpm” and “low hnrnpm” levels as identified in (a). P values were determined using a Mann-Whitney test.
Author response image 2
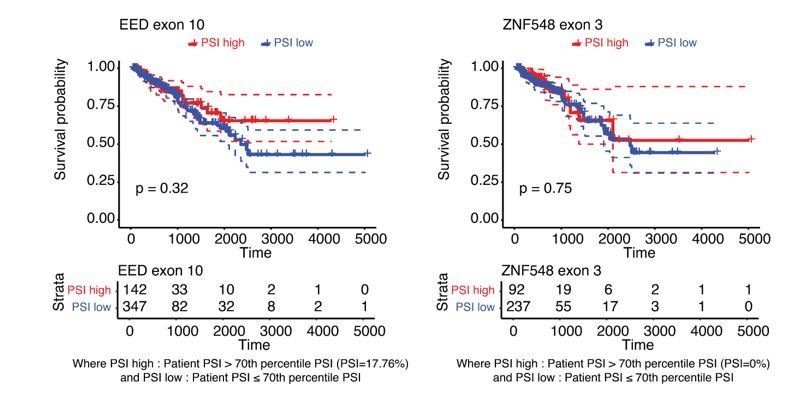
Increased inclusion of single HNRNPM-regulated exons poorly correlates with improved patient survival.
Disease free survival plot of TCGA PRAD patients, stratified by the total number of events per patient where the PSI of the indicated HNRNPM-regulated exon exceeds that of the median PSI within the patient population. Patients with more exon inclusion events (top 75th percentile) are shown in red, whereas patients with less exon inclusion events (lower 25th percentile) are shown in blue.
Author response image 3
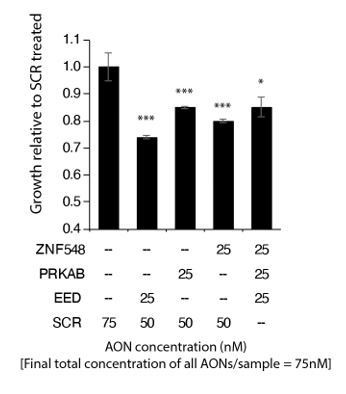
Combined knockdown of multiple splicing events results in inhibition of cell proliferation.
LNCAP cells were transfected with 2OMe SSOs targeting ZNF548 (ZNF548 SSO-3), PRKAB2 (PRKAB SSO-2) and EED (EED SSO-1). To adjust for overall SSO concentrations in cells, control (SCR) targeting SSOs were added to each well as indicated in the table below the barplots. Cell proliferation was measured at 96 hours post transfection with the MTS assay (Promega). Shown are the mean and standard deviation of 3 biological replicates.
Author response image 4
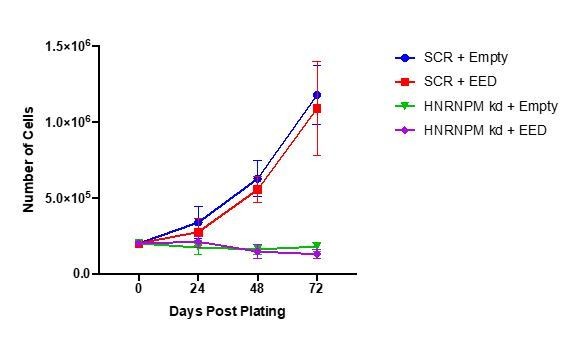
EED overexpression in HNRNPM knockdown cells.
LNCAP cells were transduced with either a control (empty vector) or EED overexpressing lentivirus (Blasticidin resistant). After selection, cells were transduced with lentivirus expressing either the scrambled (SCR) or HNRNPM-specific (HNRNPM kd; 2B9) shRNAs (Puromycin resistant). After the second selection step, 2E5 cells were plated and proliferation over time was monitored through counting every 24 hours. The mean and standard deviation of 2 independent replicates is shown.
Additional files
-
Supplementary file 1
Table of shRNAs and sequences used for pooled screens.
- https://cdn.elifesciences.org/articles/59654/elife-59654-supp1-v2.xlsx
-
Supplementary file 2
Sequences used for bichromatic splicing reporter.
- https://cdn.elifesciences.org/articles/59654/elife-59654-supp2-v2.xlsx
-
Supplementary file 3
Sequences of RNA oligos used for RNA G-quadruplex hemin assays.
- https://cdn.elifesciences.org/articles/59654/elife-59654-supp3-v2.xlsx
-
Transparent reporting form
- https://cdn.elifesciences.org/articles/59654/elife-59654-transrepform-v2.docx
Download links
A two-part list of links to download the article, or parts of the article, in various formats.
Downloads (link to download the article as PDF)
Open citations (links to open the citations from this article in various online reference manager services)
Cite this article (links to download the citations from this article in formats compatible with various reference manager tools)
HNRNPM controls circRNA biogenesis and splicing fidelity to sustain cancer cell fitness
eLife 10:e59654.
https://doi.org/10.7554/eLife.59654


