A convolutional neural network for the prediction and forward design of ribozyme-based gene-control elements
- Department of Bioengineering, Stanford University, United States
- Chan Zuckerberg Biohub, United States
Figures
Figure 1

A computational workflow for the design of tertiary-interaction ribozyme switches.
(A) Schematic of the mechanism by which tertiary-interaction ribozyme switches regulate gene expression. In the absence of ligand (blue pentagon), interactions between nucleotides in the variable loop (green) and the aptamer (yellow) lead to cleavage, separating the gene of interest from the poly-A tail, resulting in rapid degradation of the target transcript and a decrease in gene expression. Ligand binding to the aptamer disrupts the loop-loop interactions, thereby disrupting cleavage and increasing transcript stability and gene expression. (B) Schematic of the computational design process for a tertiary-interaction ribozyme switch. The selected aptamer is grafted onto one of the two ribozyme loops, and a library of variable loops (varied in both length and sequence) is grafted onto the opposite loop. A computational model then analyzes each member of the library in silico for predicted gene-regulatory activity; sequences predicted to result in low gene-regulatory activity in the absence of ligand can be synthesized and subsequently characterized in vivo.
Figure 2 with 1 supplement

Design and high-throughput characterization of ribozyme libraries with random variable loop sequences.
(A) Schematic of the design of ribozyme libraries for the model training data set FACS-Seq 1. (B) The distribution of gene-regulatory activities for ribozyme libraries analyzed in FACS-Seq 1. A mean gene-regulatory activity (log10(GFP/mCherry)) value for each sequence is generated using the distribution of that sequence among the different FACS-Seq activity bins (see Materials and methods). The solid arrow indicates the mean gene-regulatory activity of the native ribozyme (sTRSV) control, and the dashed line indicates the mean gene-regulatory activity of the inactive ribozyme (sTRSVc) control. FACS-Seq 1 consists of approximately 75,000 unique ribozyme sequences, for which at least 20 reads for each sequence were recorded. (C) Schematic of the design of ribozyme libraries for the model training data sets FACS-Seq 2 and FACS-Seq 3. (D) The distributions of gene-regulatory activities for prescreened ribozyme libraries analyzed in FACS-Seq 2 and FACS-Seq 3. The initial FACS-Seq 2 library was sorted into a low- and high-expressing population by setting the bin barrier at log10(GFP/mCh) = 0.28, the 20th percentile value. Each population was passaged for 2 days, then recombined for the binning sort. When recombining, four times as many cells from the low-expressing population as the high-expressing population were included in the final population, enriching for low basal gene-regulatory activity ribozymes. FACS-Seq 2 consists of approximately 61,000 unique ribozyme sequences. The initial FACS-Seq 3 library was sorted into a low- and high-expressing population by setting the bin barrier at log10(GFP/mCh) = –0.22, the 5th percentile value, but only the low-expressing population was retained for binning. FACS-Seq 3 consists of approximately 9000 unique ribozyme sequences. (E) The distribution of sequences analyzed in the FACS-Seq experiments for acquiring the training data set as a function of loop size.
Figure 2—figure supplement 1
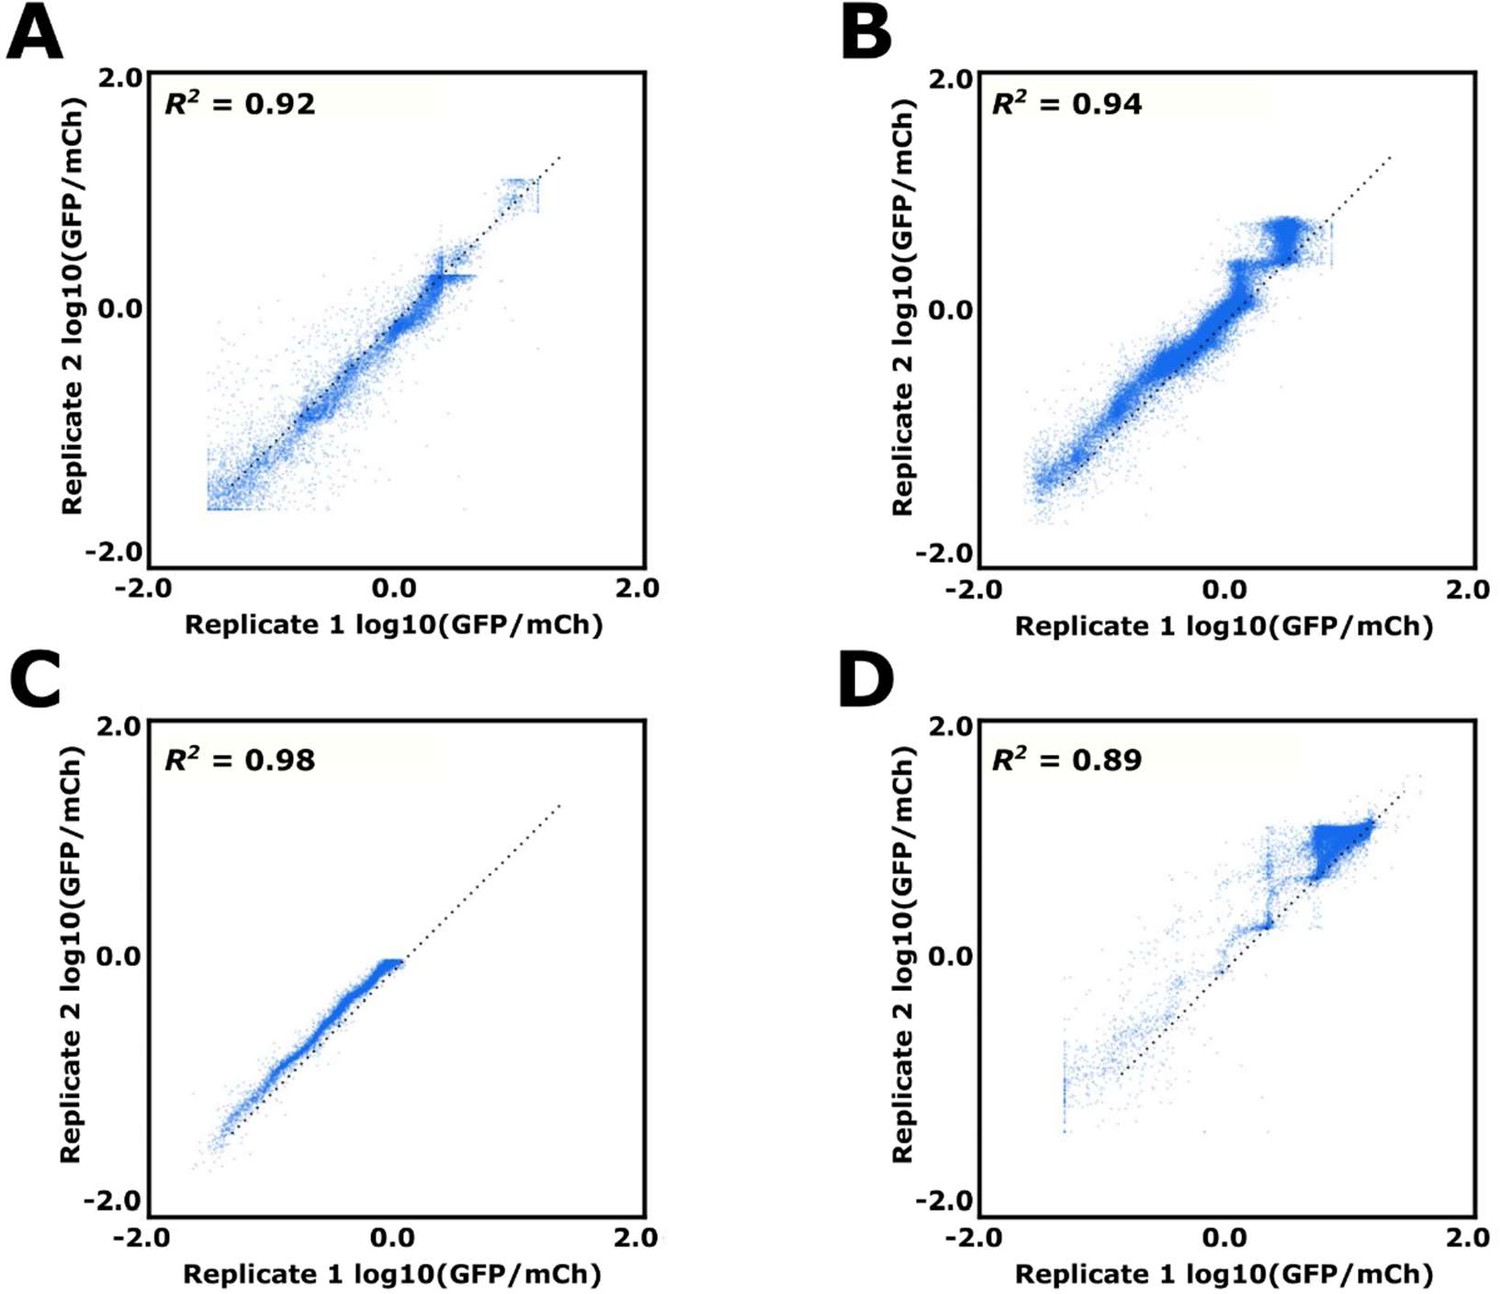
Replicate data for FACS-Seq runs 1–4.
Each point represents a single sequence’s mean estimated log10(GFP/mCh), with its x and y position determined by the log10(GFP/mCh) value derived using the first and second replicate for (A) FACS-Seq 1, (B) FACS-Seq 2, and (C) FACS-Seq 3. (D) Instead of two identical replicates, the x and y positions of a sequence correspond to its uninduced and induced log10(GFP/mCh) value from the FACS-Seq 4 (designed) library.
Figure 3 with 2 supplements
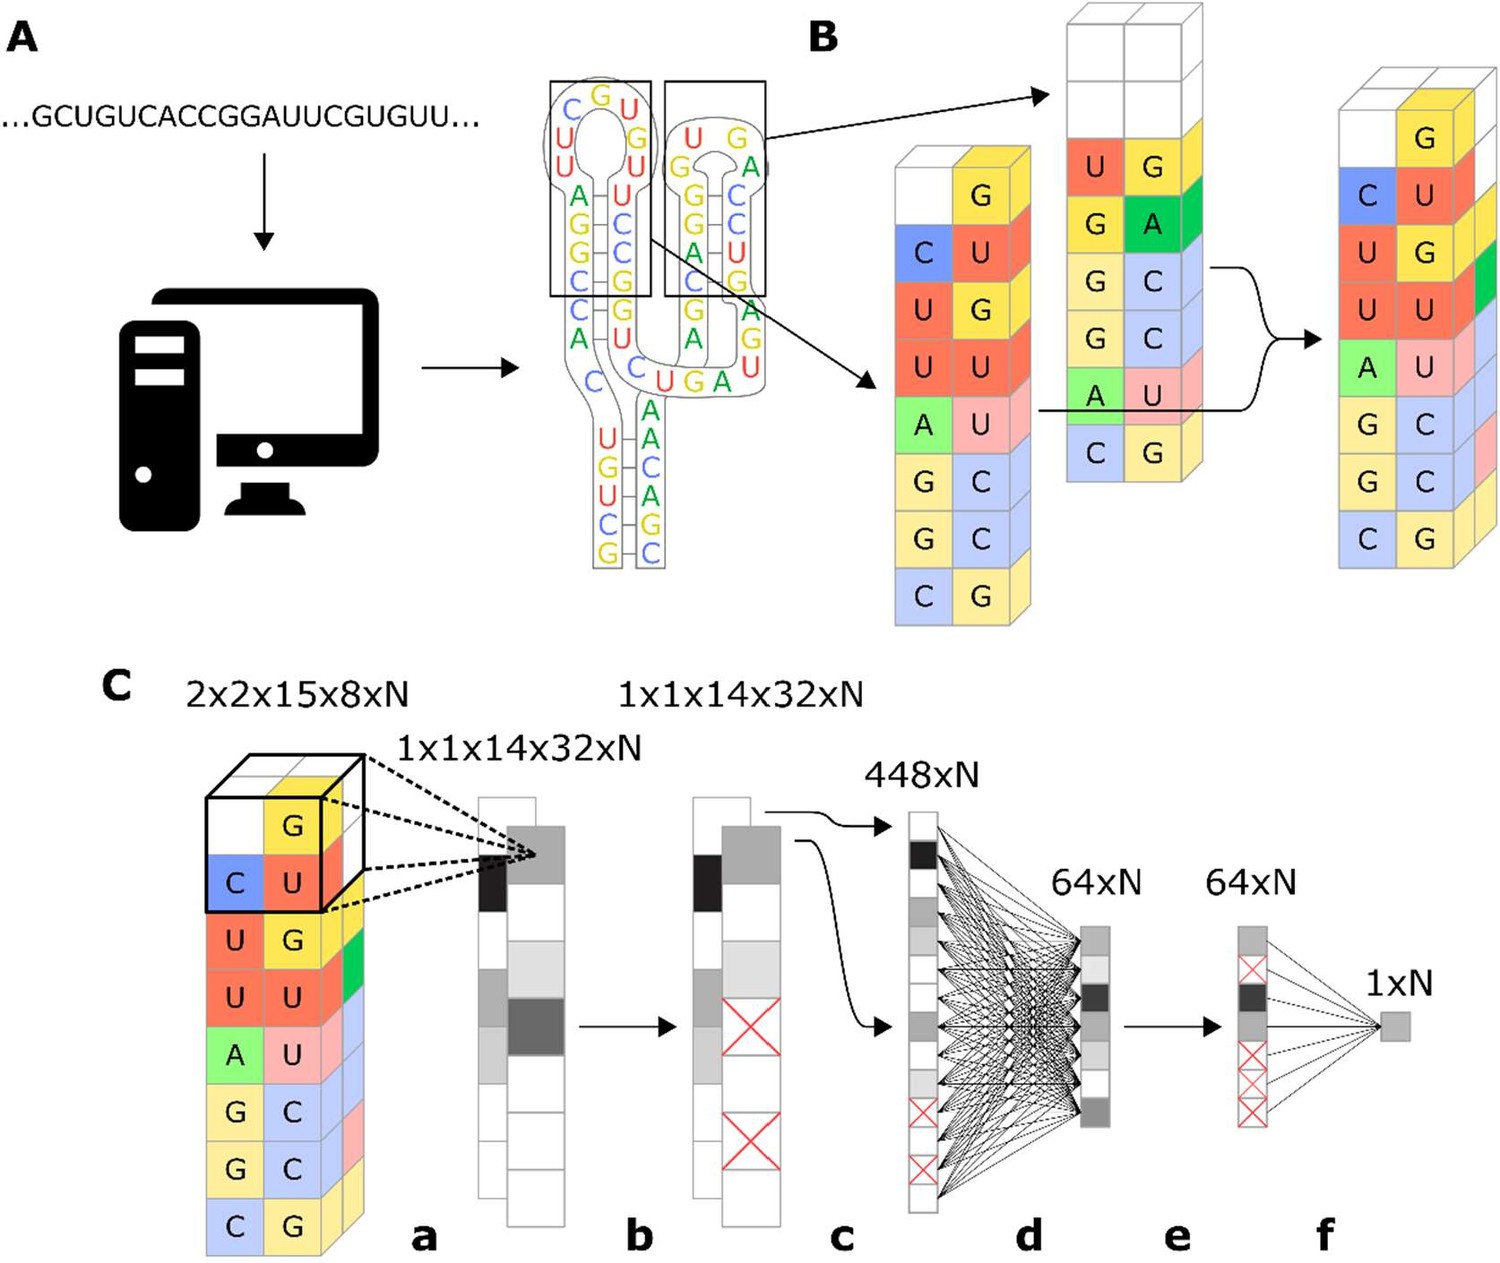
Workflow for encoding of a ribozyme sequence into numerical features and the architecture of the neural network that converts those features into a predicted gene-regulatory activity.
(A) The RNA sequence is computationally folded to obtain a predicted secondary structure. (B) The predicted secondary structure is converted into a three-dimensional set of features, where each feature is a binary recording across eight channels that represent the four nucleotides and being either paired or unpaired. For example, in the figure the first nucleotide of the loop is a U, so the feature that represents that position is given a value of 1 in the unpaired U channel, and a 0 in the rest of the channels. Positions that have no nucleotide occupying them are given values of 0 for all channels. (C) Schematic representation of the model architecture of the convolutional neural network that predicts gene-regulatory activity. The numbers above each layer demonstrate the dimensions of the array of N sequences at each step of the network. The layer order is: (a) 2 × 2 × 2 convolution with step size of 1, (b) 25% dropout, (c) flatten, (d) fully connected with rectilinear activation, (e) 50% dropout, and (f) fully connected to reduce to one decimal value.
Figure 3—figure supplement 1
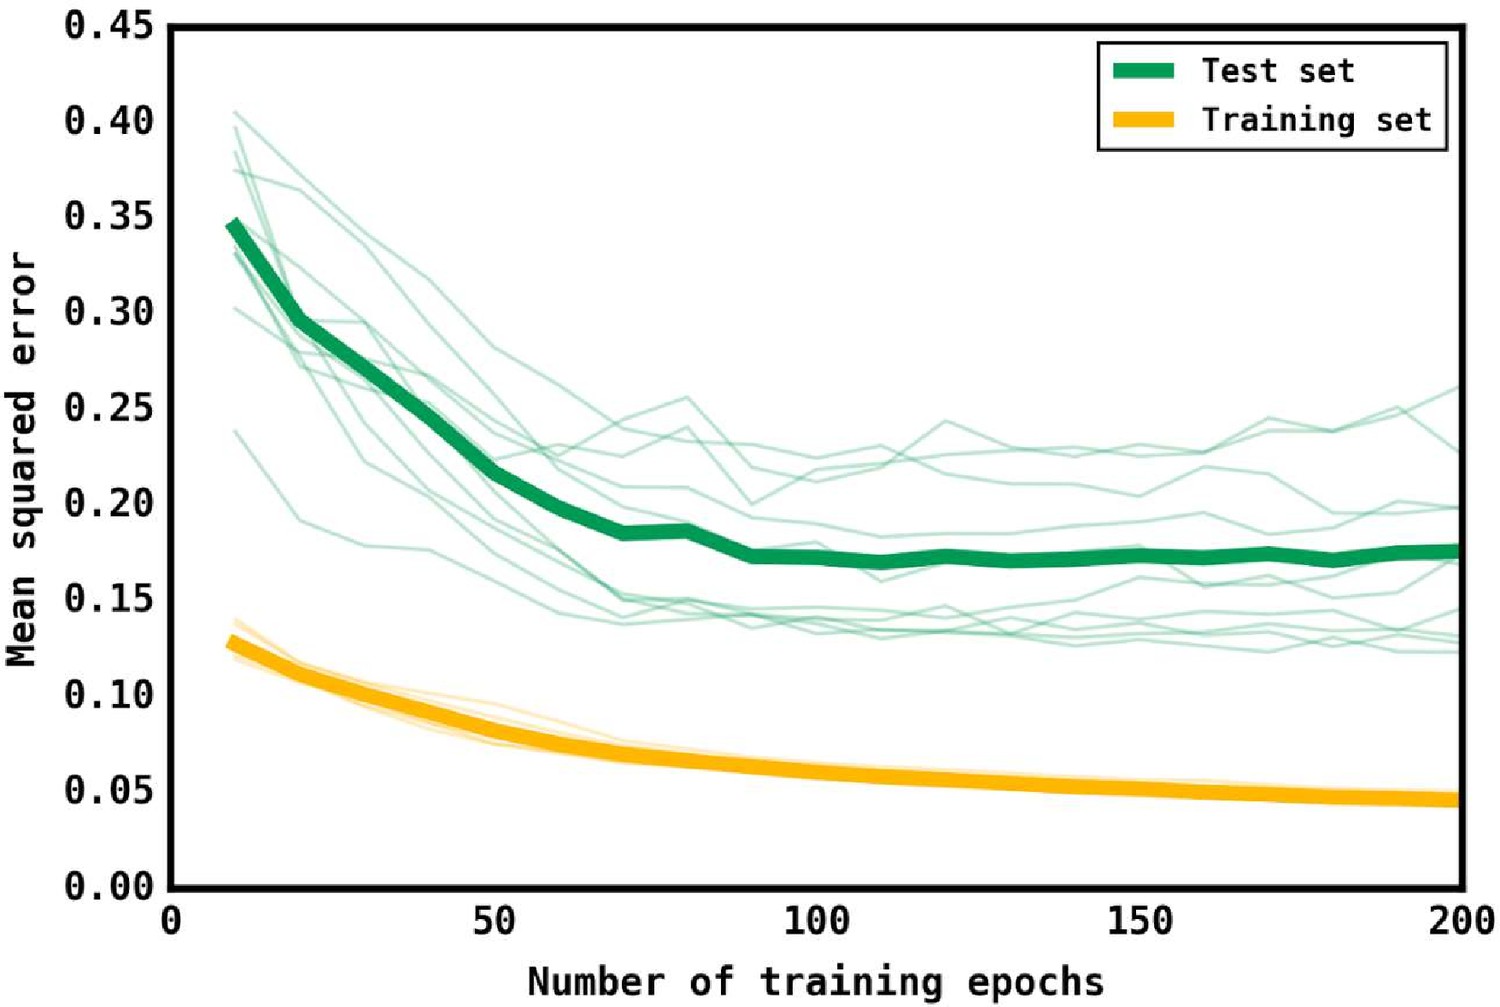
Training and test loss curves for the neural network.
Loss curves as measured by the mean squared error of predictions for the training (yellow) set and the test (green) set as the number of training epochs increases. 10 iterations were performed with different test and training sets, with the thin lines representing the curves for that iteration. The thick lines represent the mean curve for the training and test sets.
Figure 3—figure supplement 2
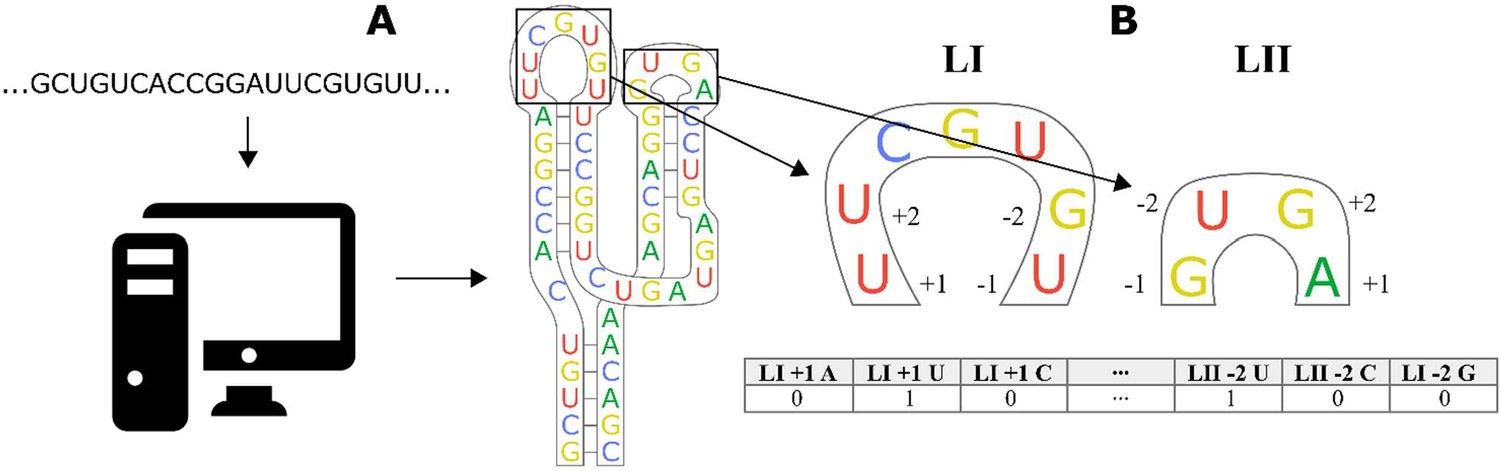
Workflow for encoding of a ribozyme sequence into numerical features with a linear regression algorithm.
(A) The RNA sequence is computationally folded to obtain a predicted secondary structure. (B) The predicted structure is converted into a one-dimensional set of features, where each feature is a binary recording of whether a specific base exists in a specific position close to the stem. As an example, the first nucleotide of the loop is a U, so the feature Loop I + 1 A is given a value of 0, while Loop I + 1 U is given a value of 1. The encoding of a nucleotide as a set of binary features is repeated for the two bases closest to the stem on the 5′ and 3′ part of the loop.
Figure 4 with 3 supplements
Training and validation of models for predicting ribozyme gene-regulatory activity.
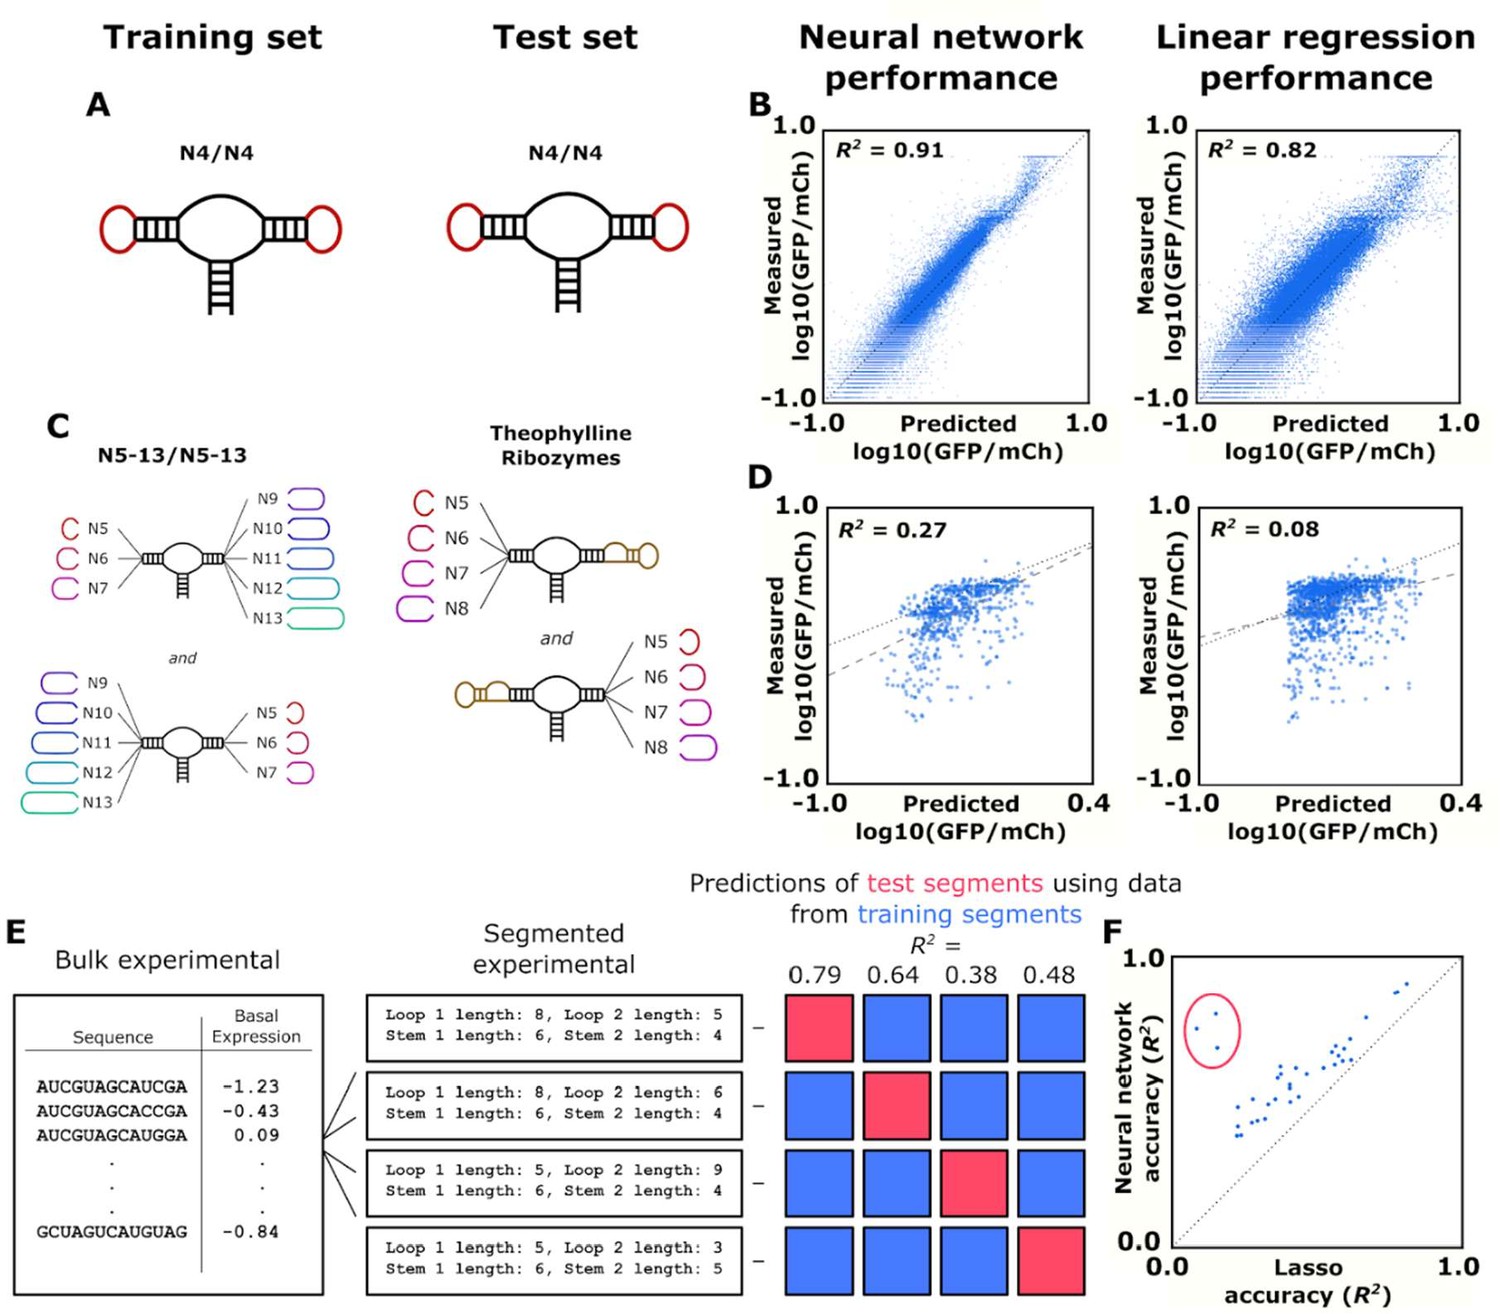
(A) Schematic of the training and test sets for simple ribozymes, wherein both sets comprise ribozymes with four random nucleotides on each loop. No ribozyme sequences are shared between the two sets. (B) Comparison of the neural network and linear regression algorithms on their ability to predict the basal expression of simple ribozymes. Each point on a plot represents the predicted and measured basal gene-regulatory activity for a single ribozyme sequence. The points for accurately predicted ribozymes fall close to the dotted line that represents when the predicted and measured basal gene-regulatory values are equal. (C) Schematic of the training and test sets for ribozymes with a theophylline aptamer in place of one of the loop regions. The models were trained on ribozymes with four random nucleotides on each loop. The trained models were used to predict the basal gene-regulatory activity of ribozymes with a theophylline aptamer in place of one of the two loop regions. (D) Comparison of the neural network and linear regression algorithms on their ability to predict the basal expression of ribozymes with a theophylline aptamer whose activity was measured through FACS-Seq. Each point on a plot represents the predicted and measured basal gene-regulatory activity for a single ribozyme sequence. The black dotted line represents the where predicted activity equal the measured activity for a given ribozyme, while the gray dashed line represents the line of best fit to the predicted data. (E) Workflow for the evaluation of an algorithm’s accuracy when predicting the basal gene-regulatory value of ribozymes whose structure differs from the structures in the training set. The sequences in the experimental data set are first grouped into different segments based on the size of the loops and the stems in the computationally predicted secondary structure such that each ribozyme in a segment shares the same structure. The gene-regulatory activity levels of the sequences in one segment (the test segment) are predicted using a model trained on the sequences in other segments (grouped into a training segment). This prediction is compared to the experimental data to determine the accuracy, as measured by the R2 value, of predicting that segment based on segments that are structurally different. This process is repeated using each segment as the test segment. (F) Comparison of the ability of two algorithms, a lasso linear regression model (Lasso) and a three-dimensional convolutional neural network, to predict the basal gene-regulatory activities of different test segments. Each segment is represented by a single point, with its positioning determined by the R2 value of a model’s prediction for sequences in that segment. The dotted line represents the point where the two models would have equal accuracy. The points encompassed by the red circle represent the segments that do not have the same stem length as the native ribozyme.
Figure 4—figure supplement 1
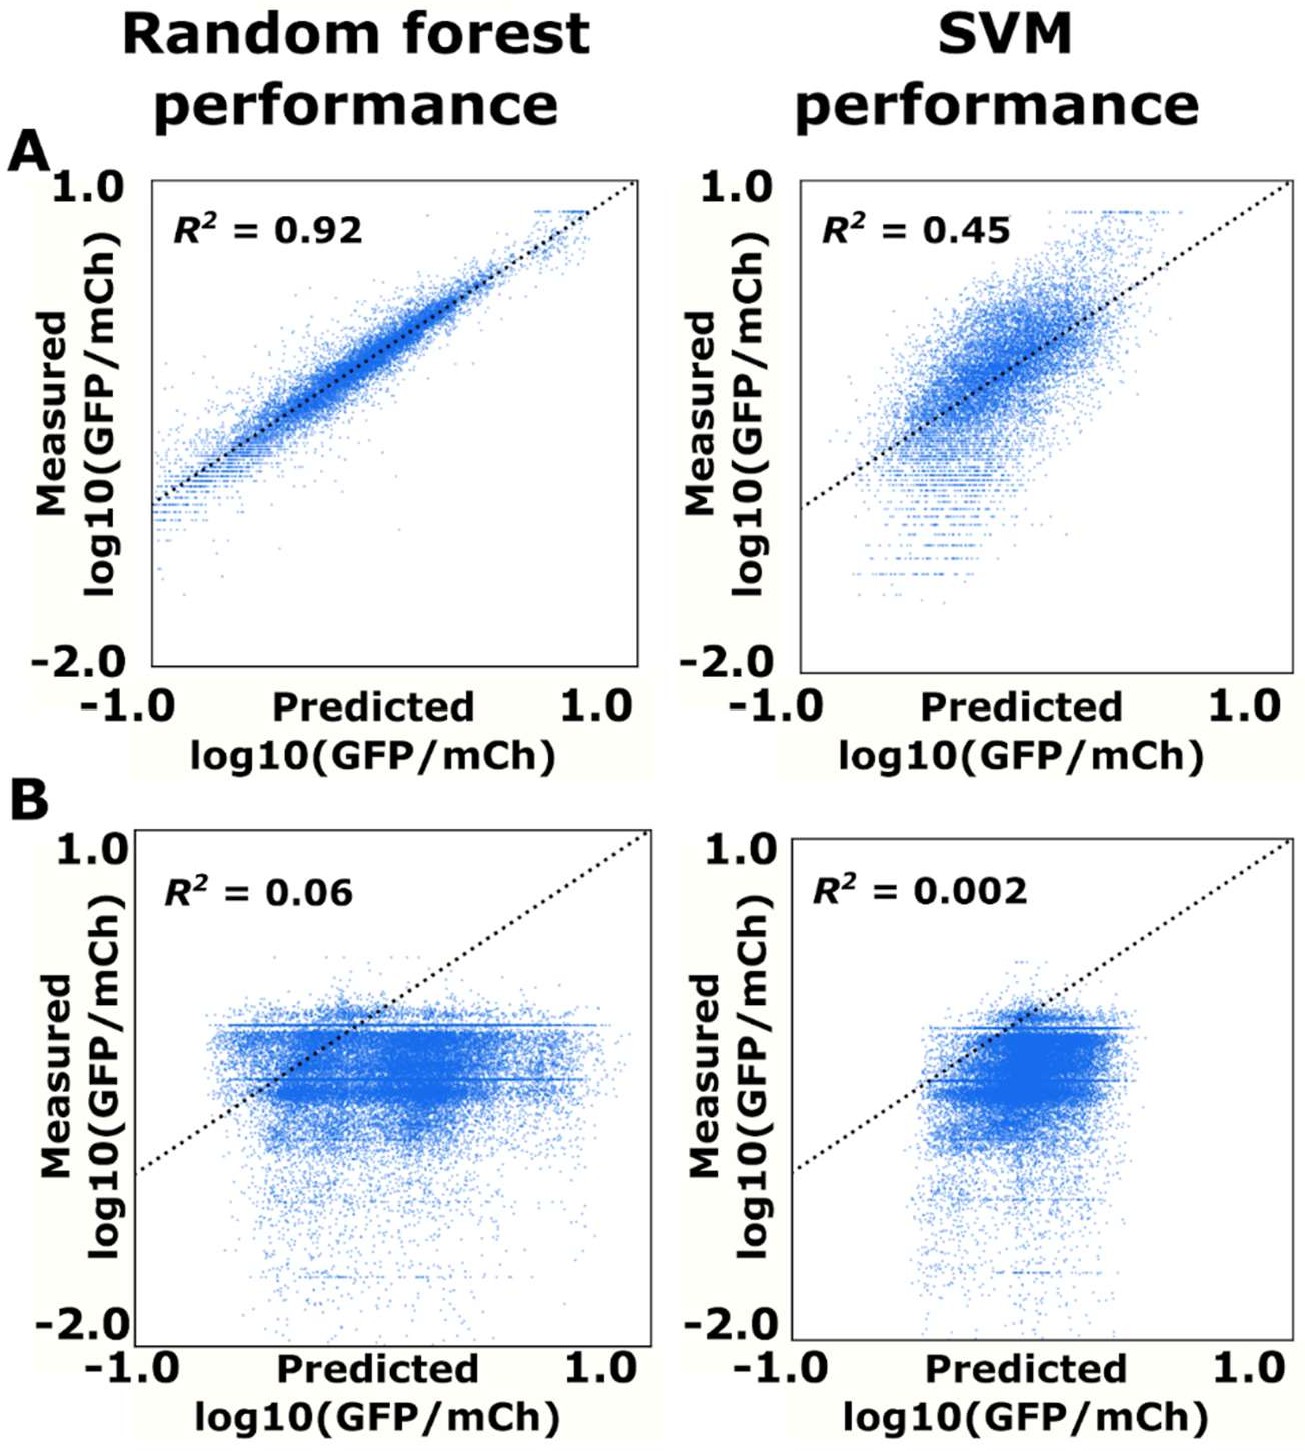
Random forest and SVM prediction of ribozyme gene-regulatory activity.
(A) Comparison of the random forest and SVM algorithms on their ability to predict the basal expression of simple ribozymes. Each point on a plot represents the predicted and measured basal gene-regulatory activity for a single ribozyme sequence. The points for accurately predicted ribozymes fall close to the dotted line that represents when the predicted and measured basal gene-regulatory values are equal. (B) Comparison of the random forest and SVM algorithms on their ability to predict the basal expression of ribozymes with a theophylline aptamer whose activity was measured through FACS-Seq. Each point on a plot represents the predicted and measured basal gene-regulatory activity for a single ribozyme sequence.
Figure 4—figure supplement 2
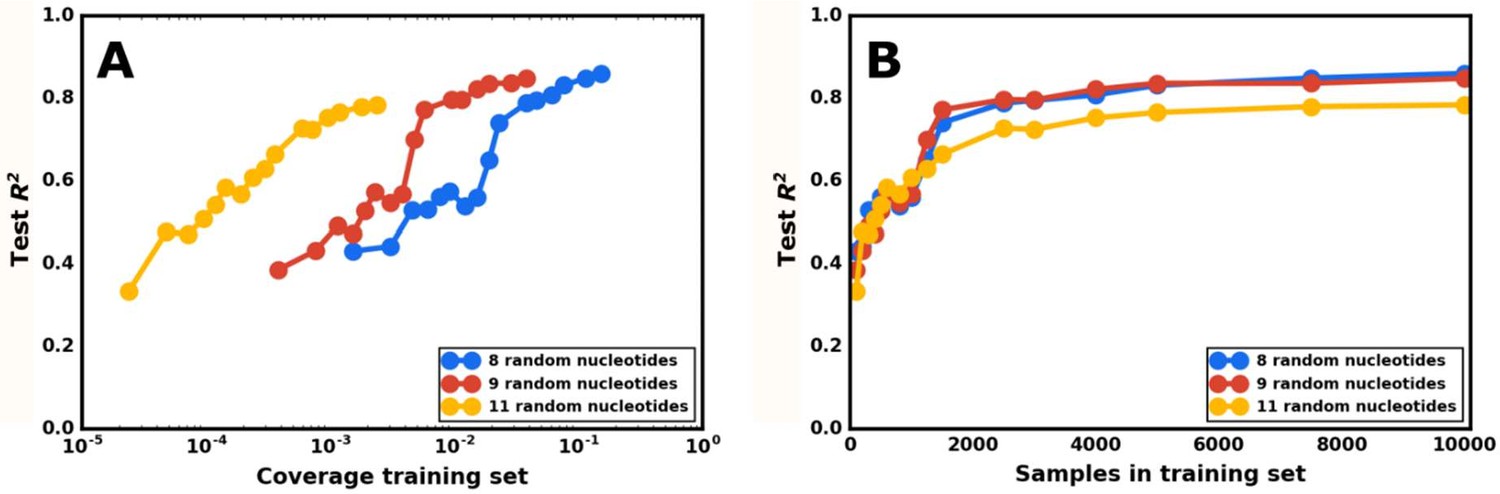
Model accuracy as a function of the size of the training set.
(A) Plotting model accuracy as a function of the training set’s coverage of the total possible sequences for the indicated number of random nucleotides. Each point represents the prediction from a neural network model, trained on a set of sequences with a specific number of random nucleotides, of the activity of a different test set of sequences from the same library. The model’s accuracy is defined as the R2 value when comparing the model’s predicted gene-regulatory activities for the test set and that set’s measured activities. The coverage for that point is determined by dividing the number of sequences in the training set by the total possible number of sequences for that number of random nucleotides. The neural network model was tested on varying levels of coverage for three different libraries, with 8, 9, and 11 random nucleotides. (B) Plotting model accuracy as a function of the number of sequences in the training set. The same set of trained models as in (A), but plotted so that the X axis is the total number of sequences in the training set for a given model.
Figure 4—figure supplement 3
Model accuracy as a function of the similarity of structures in the test set to those in the training set.
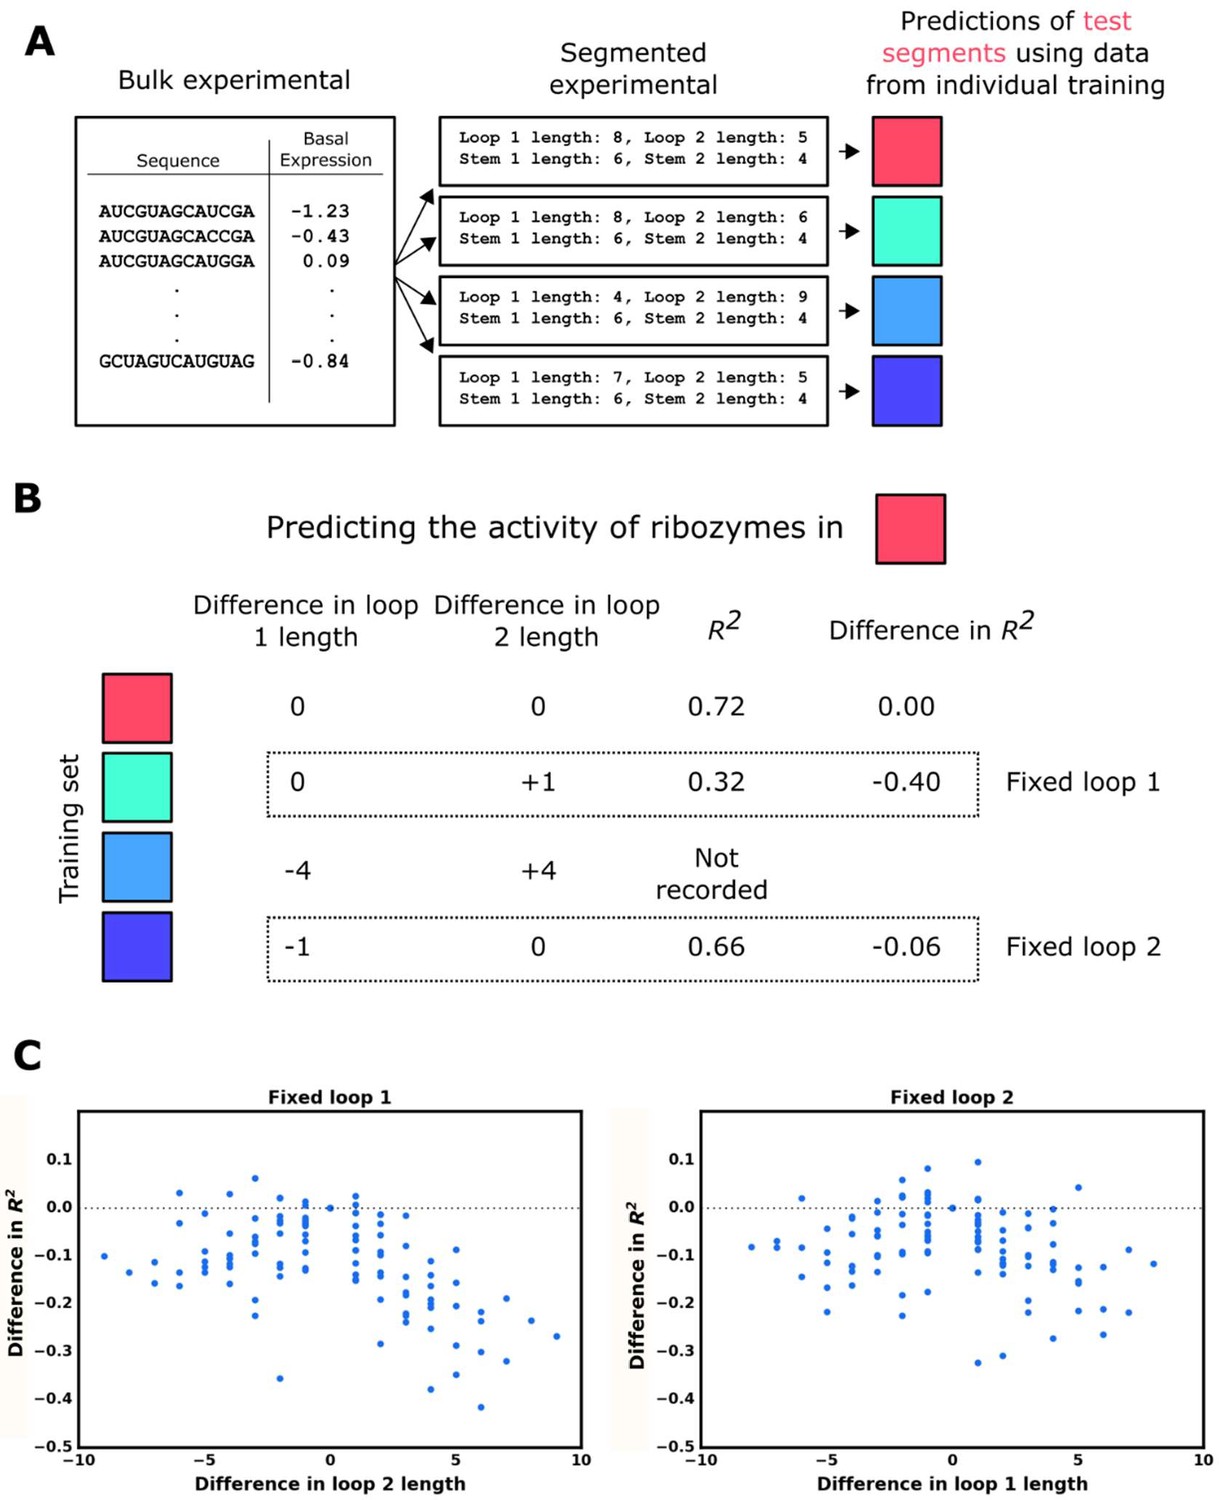
(A) Workflow for the evaluation of the model’s accuracy when predicting the basal gene-regulatory value of ribozymes whose structure differs from the structures in the training set in one of the two loops. The sequences in the experimental data set are first grouped into different segments based on the size of the loops and the stems in the computationally predicted secondary structure such that each ribozyme in a segment shares the same structure. The gene-regulatory activity levels of the sequences in one segment are predicted using a model trained on the sequences in another segment that shares both stem lengths and one loop length. This prediction is compared to the experimental data to determine the accuracy, as measured by the R2 value, of predicting that segment when the training set has one loop of different length. This process is repeated using each segment as the test segment, recording the accuracy and difference in loop length. (B) Example for predicting a test segment using the individual training segments. First, the test segment (red) is sub-segmented into test and training sequences, and used to generate a baseline R2 of predicting the test segment when sequences in the training set have no difference in loop 1 or loop 2 length. The first training segment (teal), which fixes the length of loop 1 but not loop 2, is used to generate an R2 of predicting the test segment, which is compared to the R2 of the self-prediction to generate a difference in R2 when loop 2 length differs. The next training segment (light blue) is ignored because it fixes neither loop 1 nor loop 2 lengths in relation to the test segment. The final training segment (dark blue) undergoes the same process as the teal training segment to measure how the accuracy changes when sequences in the training segment have a fixed loop 2 length, but loop 1 length differs. (C) Plotting the model’s accuracy as a function of the difference in the length of loops 1 or 2 between sequences in the training set and those in the test set. The individual points represent the difference in the R2 value for predicting ribozyme activity when ribozymes in the training set have a difference in loop length in one loop versus having the same loop size.
Figure 5 with 2 supplements
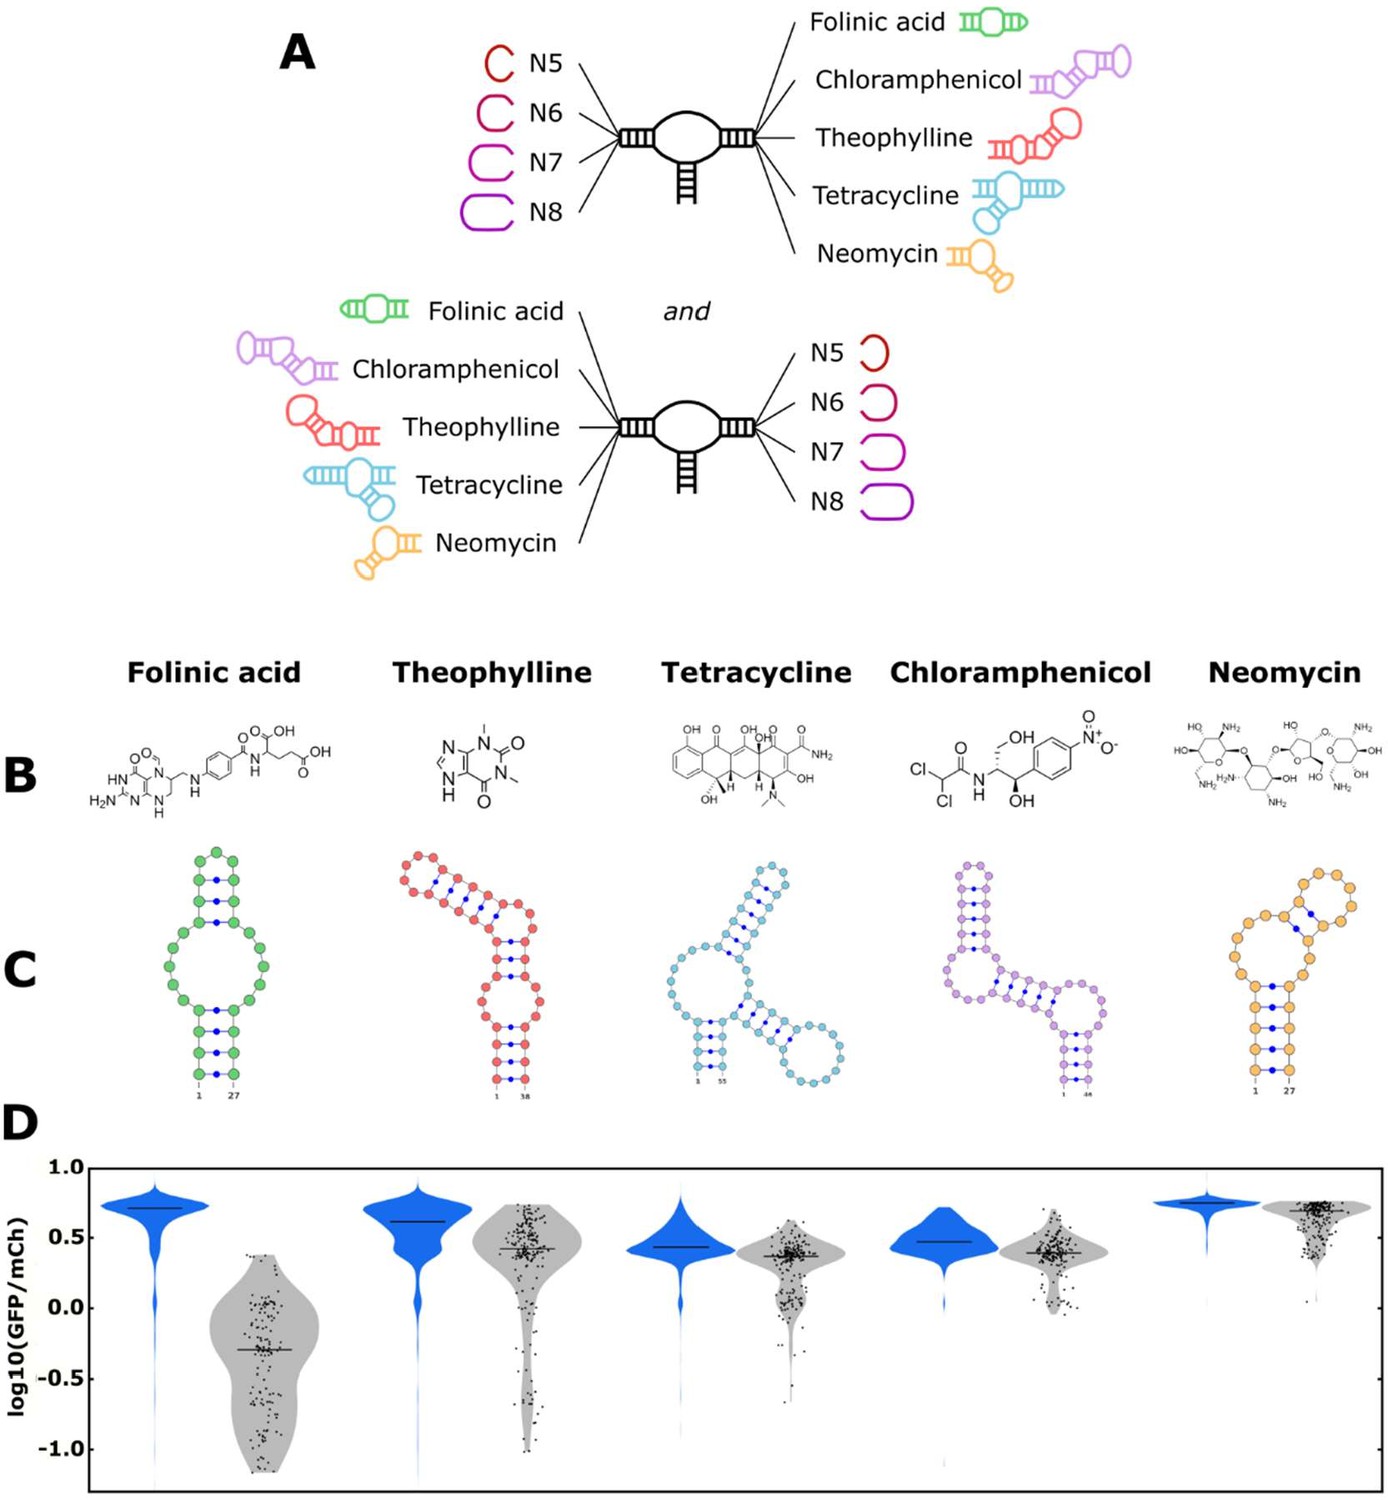
The convolutional neural network (CNN) model designs ribozyme libraries with aptamers grafted onto a loop region enriched in sequences exhibiting low gene-regulatory activities.
(A) Schematic of the designs for the aptamer-ribozyme libraries. Each ribozyme has one variable loop, consisting of between 5 and 8 random nucleotides, and one aptamer loop (as indicated). (B) Chemical structures of the different ligands for which aptamers were tested in the model. (C) Schematic of the RNA secondary structures for the aptamers tested in the model. (D) Distribution of gene-regulatory activities across random and CNN-designed ribozyme libraries. The gene-regulatory activities of individual ribozyme sequences were measured via FACS-Seq. Blue violin plots: distribution of activities for the random libraries; gray violin plots: distribution of activities for the designed libraries. The individual activities of sequences in the designed libraries are shown as black points. Only sequences with more than 20 reads recorded were counted. For the random libraries, 5,264 folinic acid, 4,639 theophylline, 2,002 tetracycline, 911 chloramphenicol, and 1,417 neomycin sequences were counted. For the designed libraries, 154 folinic acid, 198 theophylline, 197 tetracycline, 174 chloramphenicol, and 196 neomycin sequences were counted.
Figure 5—figure supplement 1
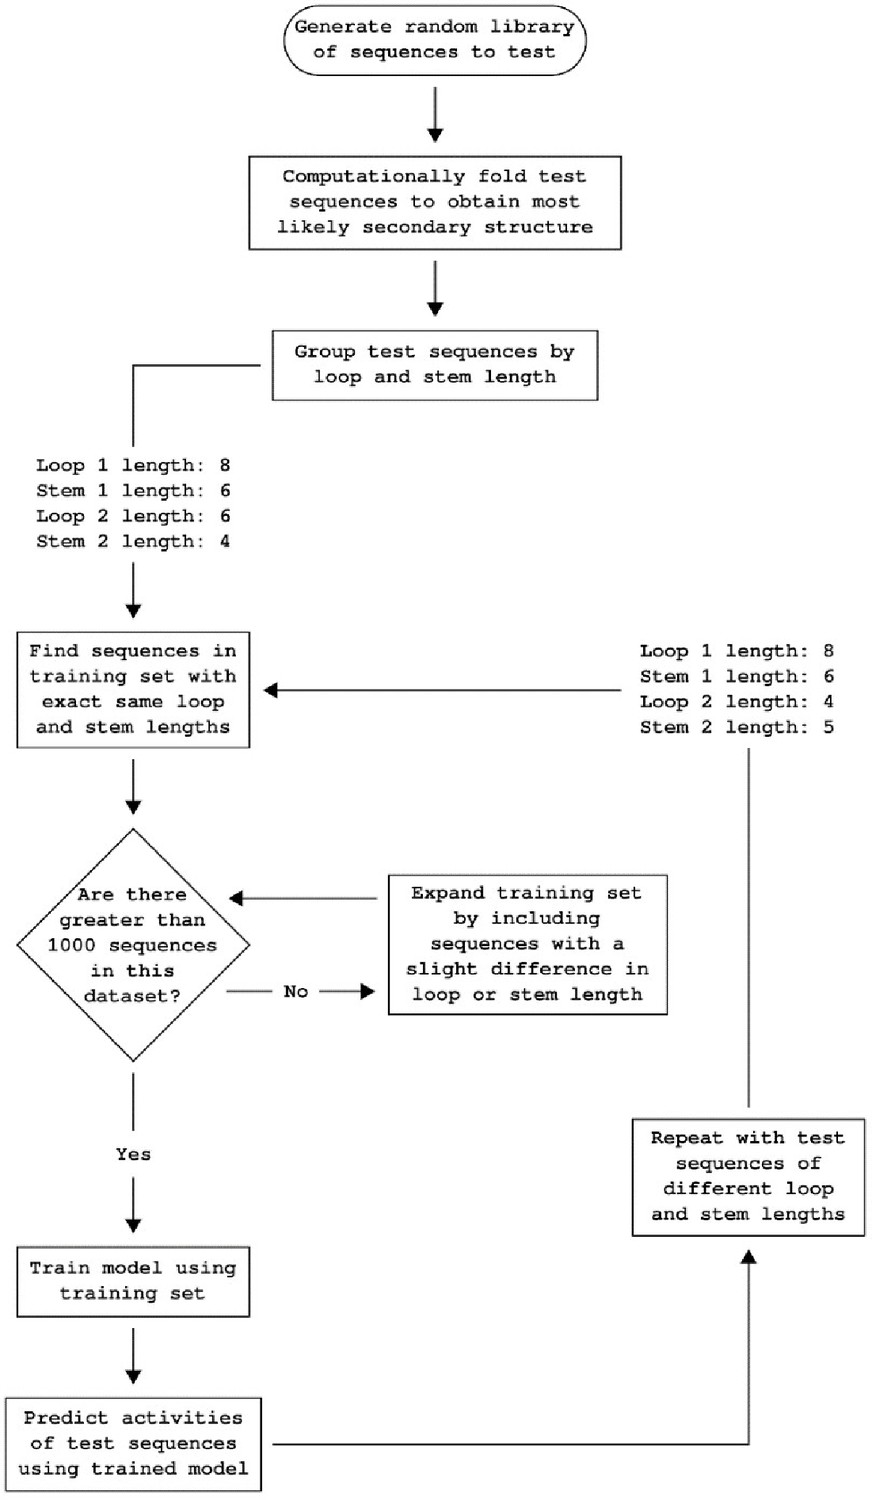
Workflow for predicting ribozyme activity.
Workflow detailing how the convolutional neural network model predicts the individual basal gene-regulatory activity level of each ribozyme in a set of ribozyme sequences. The library of training sequences is divided into groups based on the structure of the computationally folded ribozymes. The set of ribozymes to be predicted is also divided into groups based on the structure of computationally folded ribozymes. Only the ribozymes in the training with similar enough structures to the test set are used to predict ribozymes in the test set. Initially, only sequences in the training set that have an identical structure to those in the test set are considered, but the training set is incrementally increased by considering ribozymes with increasing differences in structure until at least 1,000 ribozymes are in the training set.
Figure 5—figure supplement 2
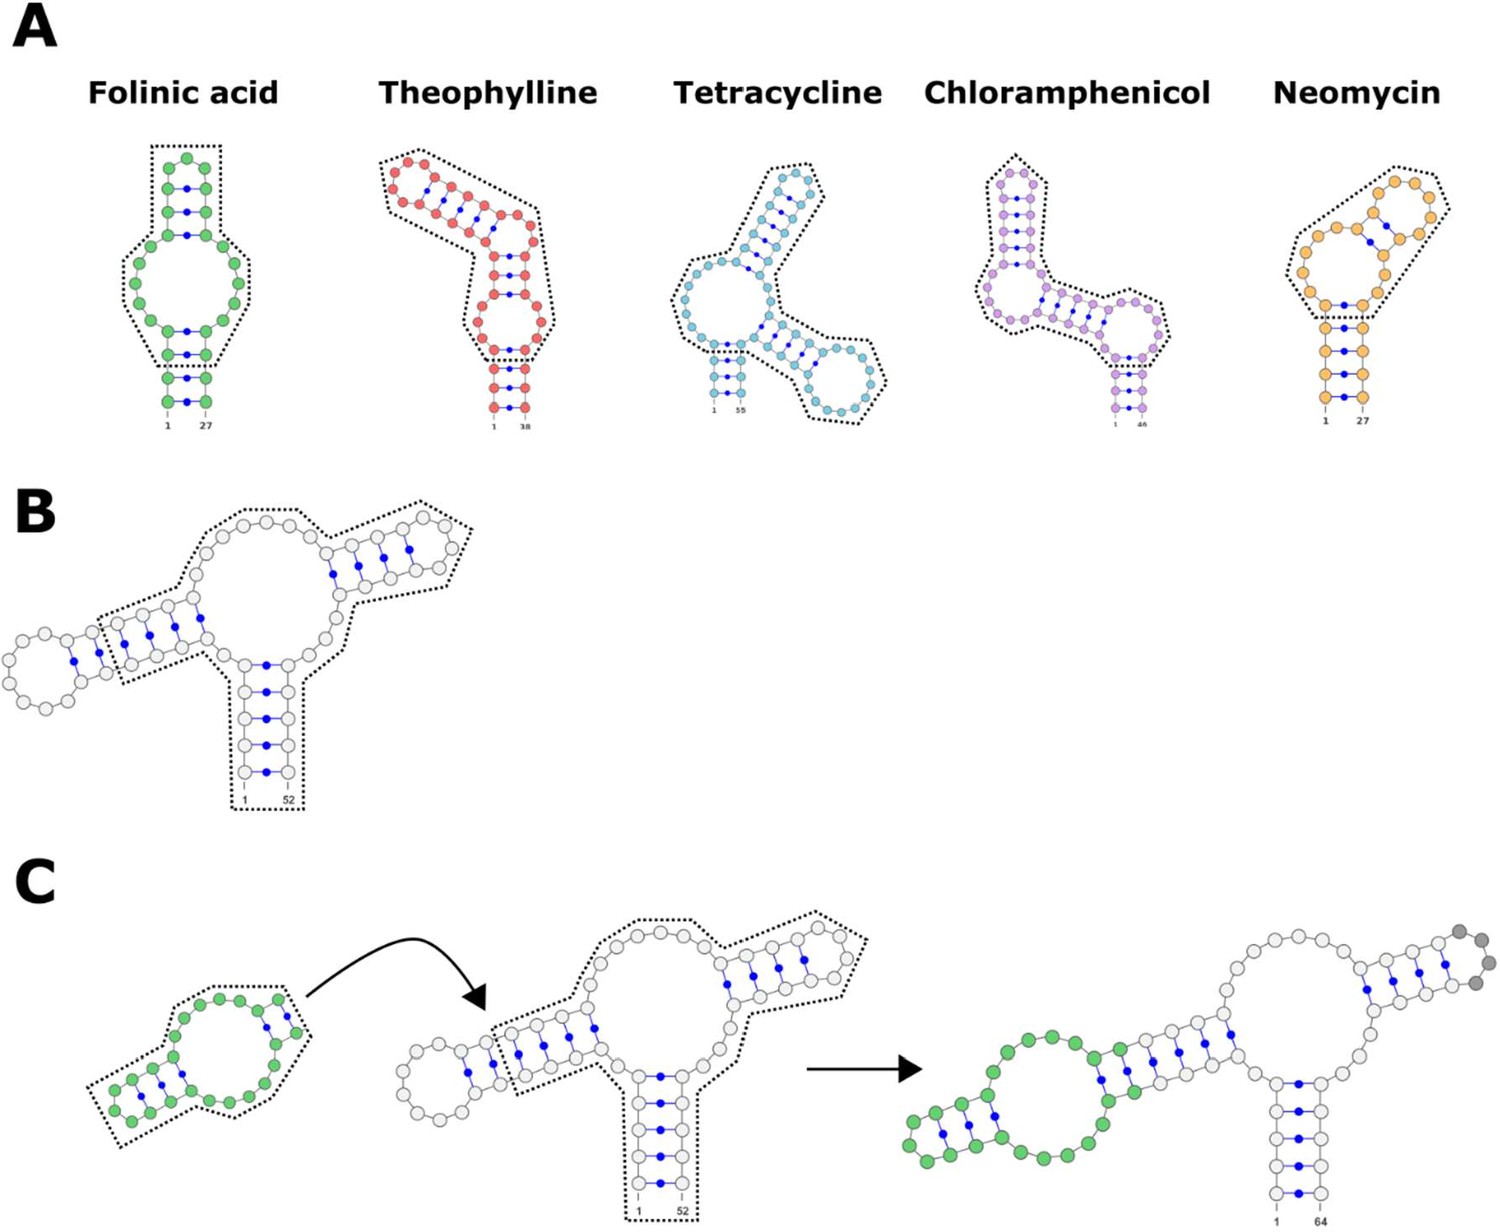
Schematic detailing the process of adding an aptamer onto one loop of the ribozyme.
(A) The secondary structure of the aptamers used to design genetic switches. The portion surrounded by the dotted line is retained, while the uncircled portion (the stem leading up to the first bulge) is removed. (B) The secondary structure of the hammerhead ribozyme, with the two loops showing. The portion surrounded by the dotted line is retained. In this example, loop I is removed, but loop II could be removed if the aptamer was instead added to that region of the ribozyme. (C) The workflow for adding the retained portion of the aptamer onto the retained portion of the ribozyme. The secondary structure of the final hammerhead ribozyme with an attached folinic acid aptamer (highlighted in green). The opposite loop (highlighted in gray) could contain random or designed nucleotides.
Figure 6

Validated basal and activated gene-regulatory activities for the top-performing ribozyme sequences predicted from the convolutional neural network model.
(A) The basal and activated gene-regulatory activities for the top 15 predicted ribozyme sequences characterized individually via flow cytometry analysis. The box plots show the middle two quartiles of the gene-regulatory activities of ribozymes in the absence (blue) and presence (green) of the indicated ligand, with the mean activity levels for clonal populations of the individual ribozymes represented by the black points. The whiskers extending from the boxes represent 1.5 times the interquartile range, which approximates 99% of the expected range for values. Both basal and activated activity levels are normalized to that of an inactive ribozyme control (sTRSVc). (B) The activation ratio values (ratio of activity levels in the presence and absence of the indicated ligand) for the top 15 ribozyme sequences. The box plot represents the middle two quartiles for activation ratio, with the activation ratios for individual sequences represented by the black points. (C) The basal and activated gene-regulatory activities and the activation ratio values for the three best performing designs among the top 15 predicted designs. The blue and green bars represent the mean basal and induced gene-regulatory activities, respectively, for an individual ribozyme sequence, with the error bars showing the standard deviation. The number above each pair of bars represents the activation ratio for that sequence. p-values < 0.05 are represented by *, those <0.01 by **, and those <0.001 by ***.
-
Figure 6—source data 1
Activity of designed ribozymes in the presence and absence of their cognate ligand.
- https://cdn.elifesciences.org/articles/59697/elife-59697-fig6-data1-v2.docx
Figure 7
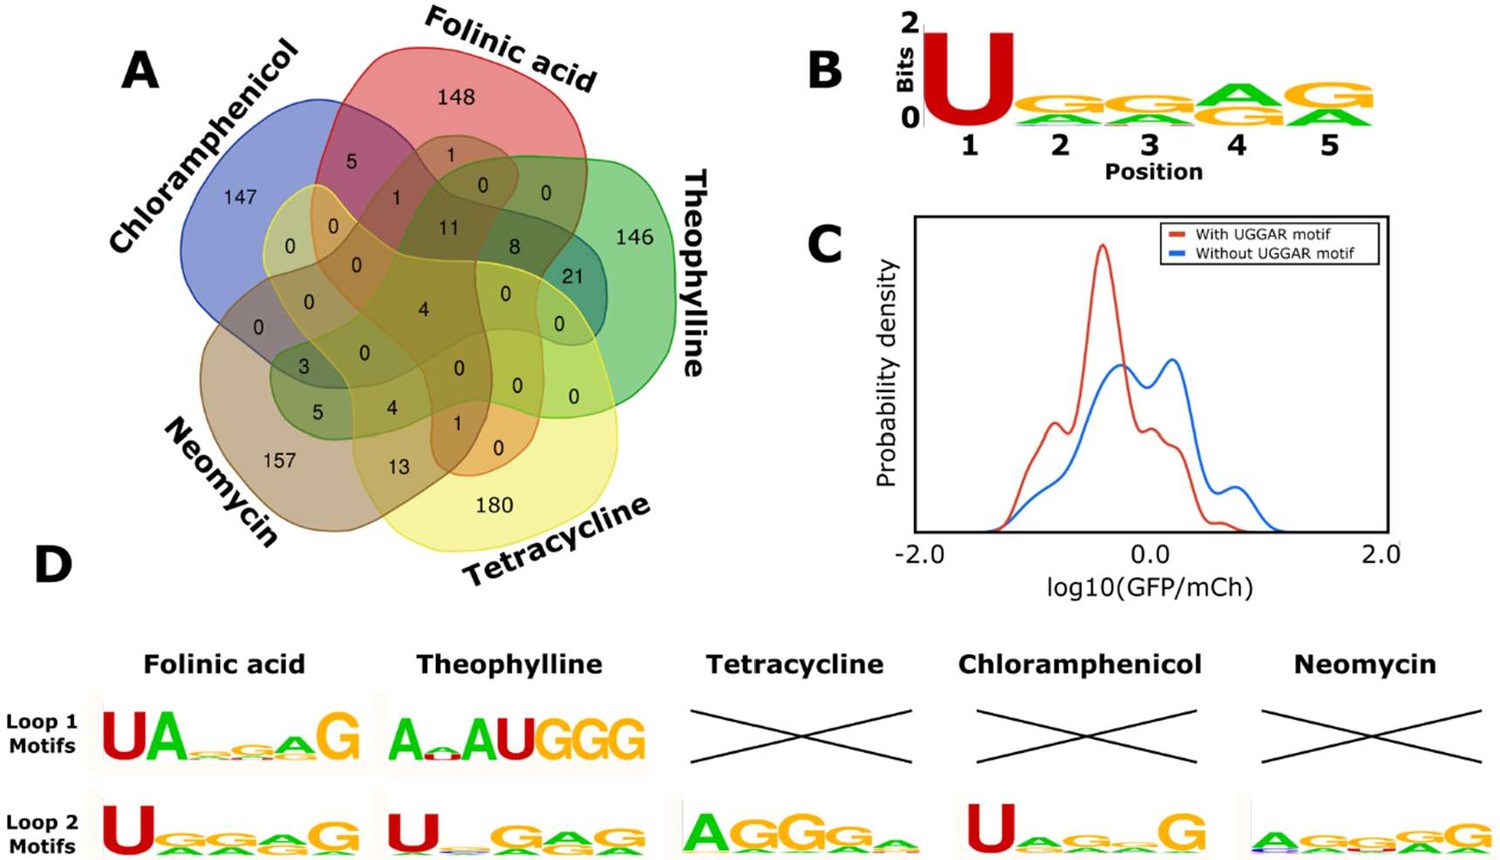
Computational analysis of the loop motifs predicted by the convolutional neural network model for different aptamer sequences.
(A) Venn diagram showing which sequences for the variable loop were shared among the top 200 designs across different aptamers (red: folinic acid; green: theophylline; yellow: tetracycline; brown: neomycin; blue: chloramphenicol). (B) Consensus sequence motif for sequences that were present in at least four of the five designed libraries. (C) Distribution of expression values for all the sequences in the training library (blue) and sequences harboring the common consensus sequence motif (red). (D) Consensus sequence motifs present in each variable loop within the top 15 predicted ribozyme designs for each aptamer. X indicates that there were no designs in the top 15 predicted designs that had that loop present as the variable loop for the indicated aptamer.
Tables
Table 1
Statistics on the gene-regulatory activities from the parent and designed libraries.
Library data is grouped based on aptamer, and the distributions are analyzed to determine the mean gene-regulatory activity value and fraction of sequences in the library that fell below a threshold gene-regulatory activity value (set as log10(GFP/mCh) = 0).
| Folinic acid | Theophylline | Tetracycline | Chloramphenicol | Neomycin | |
|---|---|---|---|---|---|
| Mean log10(GFP/mCh) value for parent library | 0.624 | 0.553 | 0.443 | 0.485 | 0.726 |
| Mean log10(GFP/mCh) value for designed library | –0.361 | 0.312 | 0.296 | 0.383 | 0.641 |
| Fraction below log10(GFP/mCh) = 0.0 for parent library | 0.027 | 0.024 | 0.012 | 0.001 | 0.001 |
| Fraction below log10(GFP/mCh) = 0.0 for designed library | 0.772 | 0.151 | 0.076 | 0.006 | 0.0 |
| Result of rank-sum test (p-value) | 1.2 × 10–91 | 1.0 × 10⁻³⁴ | 8.0 × 10–36 | 1.6 × 10⁻²³ | 4.8 × 10–42 |
Key resources table
| Reagent type (species) or resource | Designation | Source or reference | Identifiers | Additional information |
|---|---|---|---|---|
| Strain, strain background (Escherichia coli) | DH10B | Thermo Fisher | C404010 | Chemically competent |
| Strain, strain background (Saccharomyces cerevisiae) | W303 MATα | https://www.yeastgenome.org/strain/w303 | Chemically and electrocompetent | |
| Recombinant DNA reagent | pCS1748 | PMID:22810204 | Used to characterize ribozyme activity | |
| Sequence-based reagent | PCR and sequencing primers | This paper | PCR primers | Sequences listed in supplementary information |
| Commercial assay or kit | KAPA HiFi PCR Kit | Roche Sequencing Store | KR0368 | |
| Chemical compound, drug | Folinic acid | Millipore Sigma | F7878 | |
| Chemical compound, drug | Theophylline | Sigma Aldrich | T1633 | |
| Chemical compound, drug | Neomycin | Sigma Aldrich | N1876 | |
| Chemical compound, drug | Chloramphenicol | Sigma Aldrich | C0378 | |
| Chemical compound, drug | Tetracycline | Sigma Aldrich | 87128 | |
| Software, algorithm | Python 3 | Python.org | ||
| Software, algorithm | RNAstructure | Reuter and Mathews, 2010 |
Additional files
-
Supplementary file 1
Primers used to create the training libraries in FACS-Seq experiments 1–3.
Primers are DNA oligonucleotide sequences.
- https://cdn.elifesciences.org/articles/59697/elife-59697-supp1-v2.docx
-
Supplementary file 2
DNA primers used in the next-generation sequencing (NGS) preparation for all FACS-Seq experiments.
Primers are DNA oligonucleotide sequences.
- https://cdn.elifesciences.org/articles/59697/elife-59697-supp2-v2.docx
-
Supplementary file 3
DNA primers used in the construction of the ribozyme plus aptamer library in FACS-Seq 4.
Primers are DNA oligonucleotide sequences.
- https://cdn.elifesciences.org/articles/59697/elife-59697-supp3-v2.docx
-
Supplementary file 4
DNA primers used in the construction of the individual designed ribozymes.
Primers are DNA oligonucleotide sequences.
- https://cdn.elifesciences.org/articles/59697/elife-59697-supp4-v2.docx
-
Supplementary file 5
Top-predicted structures of the ribozymes with the lowest predicted basal gene-regulatory activities.
Structures are laid out in dot-bracket notation.
- https://cdn.elifesciences.org/articles/59697/elife-59697-supp5-v2.docx
-
Supplementary file 6
Sequences for loops I and II for the 200 ribozymes for each aptamer that were predicted to have the lowest basal gene-regulatory activity.
The sequences of loops I and II are indicated, one of which is the indicated aptamer, while the remainder of the ribozyme sequence is conserved. The final column contains the predicted basal gene-regulatory activity for a ribozyme with the two given loop sequences in terms of log10(GFP/mCherry).
- https://cdn.elifesciences.org/articles/59697/elife-59697-supp6-v2.docx
-
Transparent reporting form
- https://cdn.elifesciences.org/articles/59697/elife-59697-transrepform1-v2.pdf
Download links
A two-part list of links to download the article, or parts of the article, in various formats.
Downloads (link to download the article as PDF)
Open citations (links to open the citations from this article in various online reference manager services)
Cite this article (links to download the citations from this article in formats compatible with various reference manager tools)
A convolutional neural network for the prediction and forward design of ribozyme-based gene-control elements
eLife 10:e59697.
https://doi.org/10.7554/eLife.59697


