Rapid purification and metabolomic profiling of synaptic vesicles from mammalian brain
- Department of Neurobiology, Howard Hughes Medical Institute, Harvard Medical School, United States
- New York University School of Medicine, Metabolomics Core Resource Laboratory at NYU Langone Health, United States
- Department of Radiation Oncology, New York University Langone Medical Center, United States
Figures
Figure 1 with 1 supplement
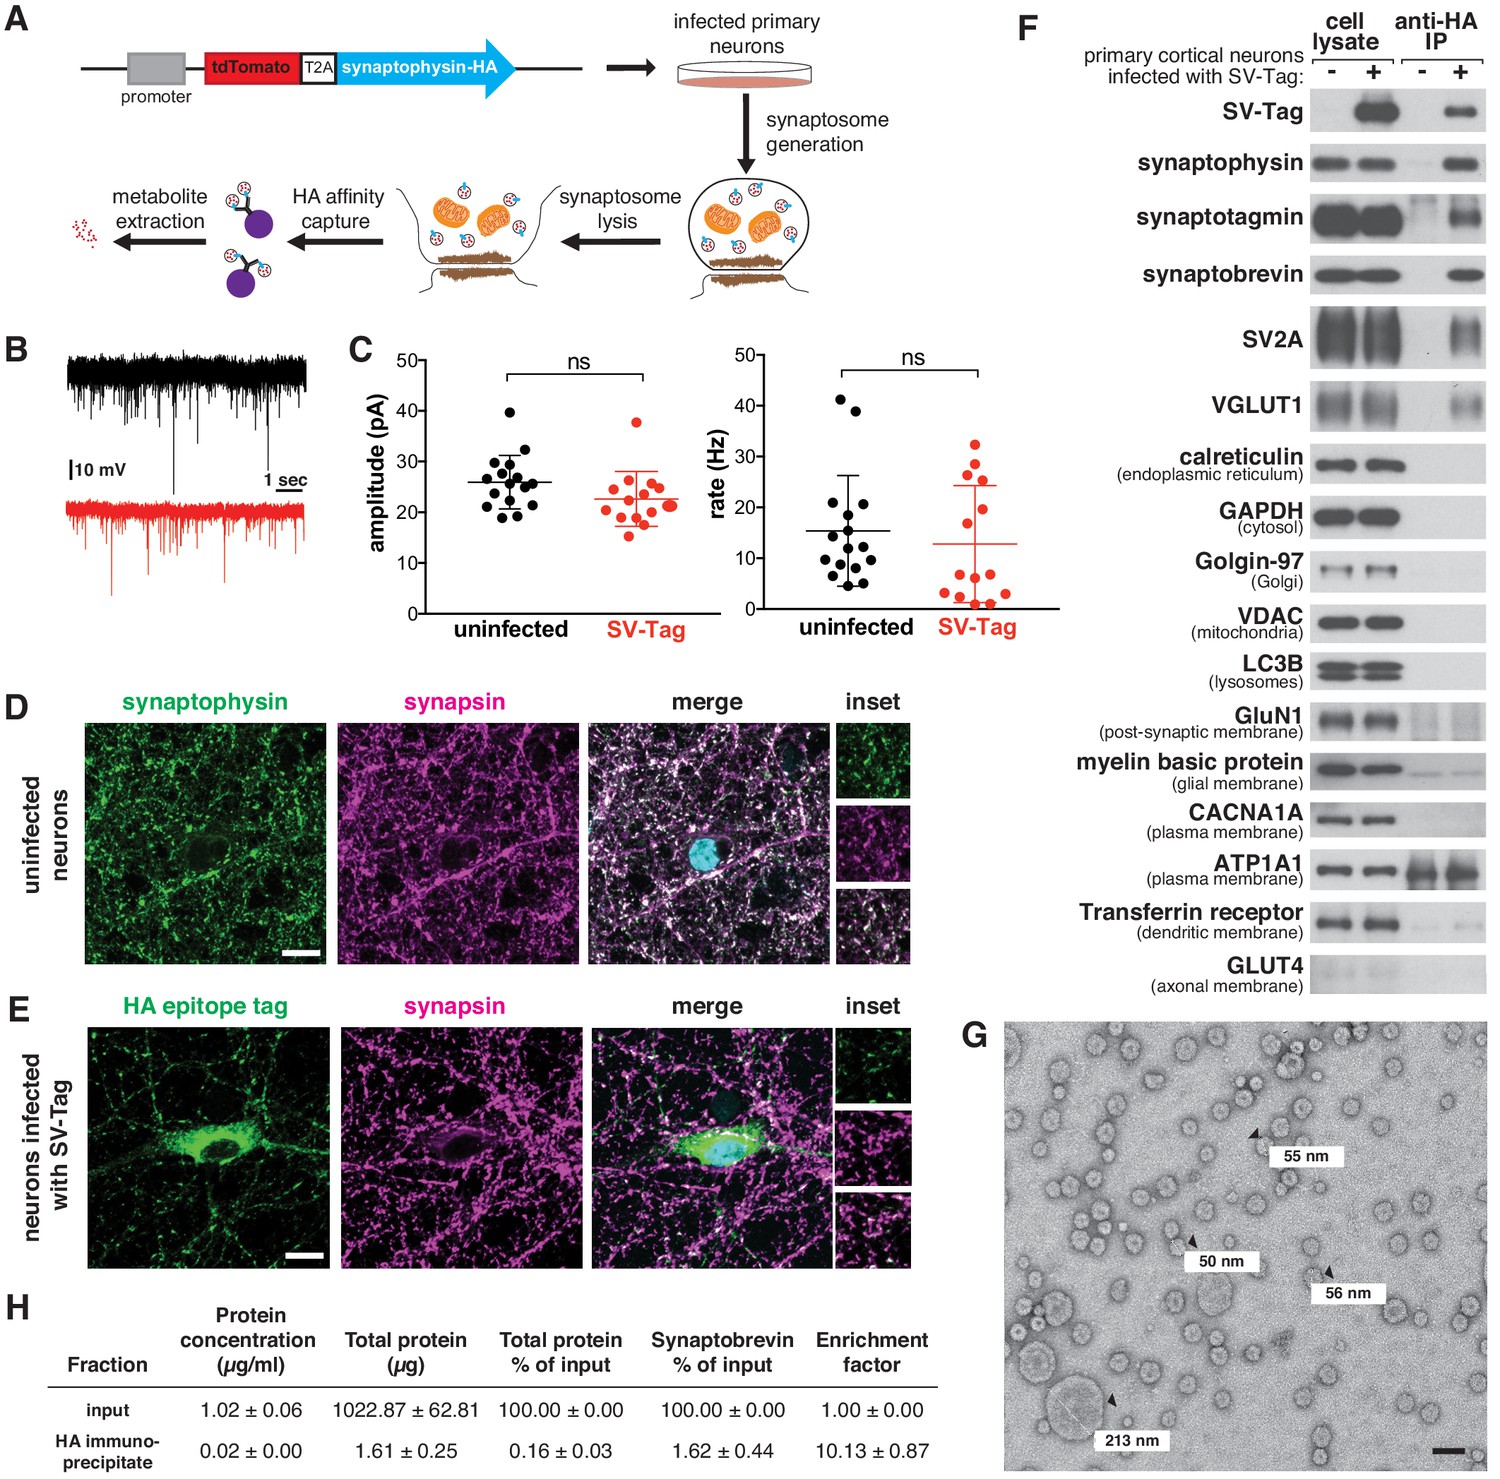
A method for rapid and specific isolation of synaptic vesicles (SVs) from mouse primary cortical cultures.
(A) Construct design for tagging SVs and schematic of the workflow used to isolate SVs. (B) Representative traces of mEPSCs in uninfected neurons (black) and neurons infected with SV-tag (red). (C) Summary of the average amplitude (± standard deviation (std) and rate of mEPSCs in uninfected neurons and neurons infected with SV-tag (Vhold = −70 mV, 1 µM TTX, 10 µM gabazine)). Non-significant p-value = n.s. (D) Immunostaining of uninfected primary neurons for endogenous synaptophysin (green) and synapsin (magenta). Cyan in the merged image represents DAPI-stained nuclei. Insets show selected fields that were magnified 1.6X. Scale bars: 10 µm. (E) Immunostaining of infected primary neurons expressing SV-tag (green) and synapsin (magenta) in. Insets show selected fields that were magnified 1.6X. Scale bars: 10 µm. (F) Immunoblot analysis of protein markers for SVs and indicated subcellular compartments and membranes in whole-cell lysates, purified SVs, and control immunoprecipitates. Lysates were prepared from neurons infected with lentivirus encoding SV-tag. 0.4% of the lysate and 5% of the immunoprecipitates were loaded into the indicated lane. (G) Electron microscope image of vesicles isolated with the workflow. Values denote diameter of indicated particles, specified by black arrows. Scale bar: 100 nm (H) Table summarizing the relative enrichment of synaptobrevin in the final immunoisolate from SV-tagged neurons, as assessed by quantitative immunoblotting. Values represent the mean ± std of three biological replicates. Source data is included (Figure 1—source data 1).
-
Figure 1—source data 1
Quantification of total protein and synaptobrevin content in input and HA immunoisolates from the SV-tag workflow.
- https://cdn.elifesciences.org/articles/59699/elife-59699-fig1-data1-v2.xlsx
-
Figure 1—source data 2
Analysis of particle size distribution in EM images of the final immunoisolate from SV-tagged neurons.
- https://cdn.elifesciences.org/articles/59699/elife-59699-fig1-data2-v2.xlsx
Figure 1—figure supplement 1
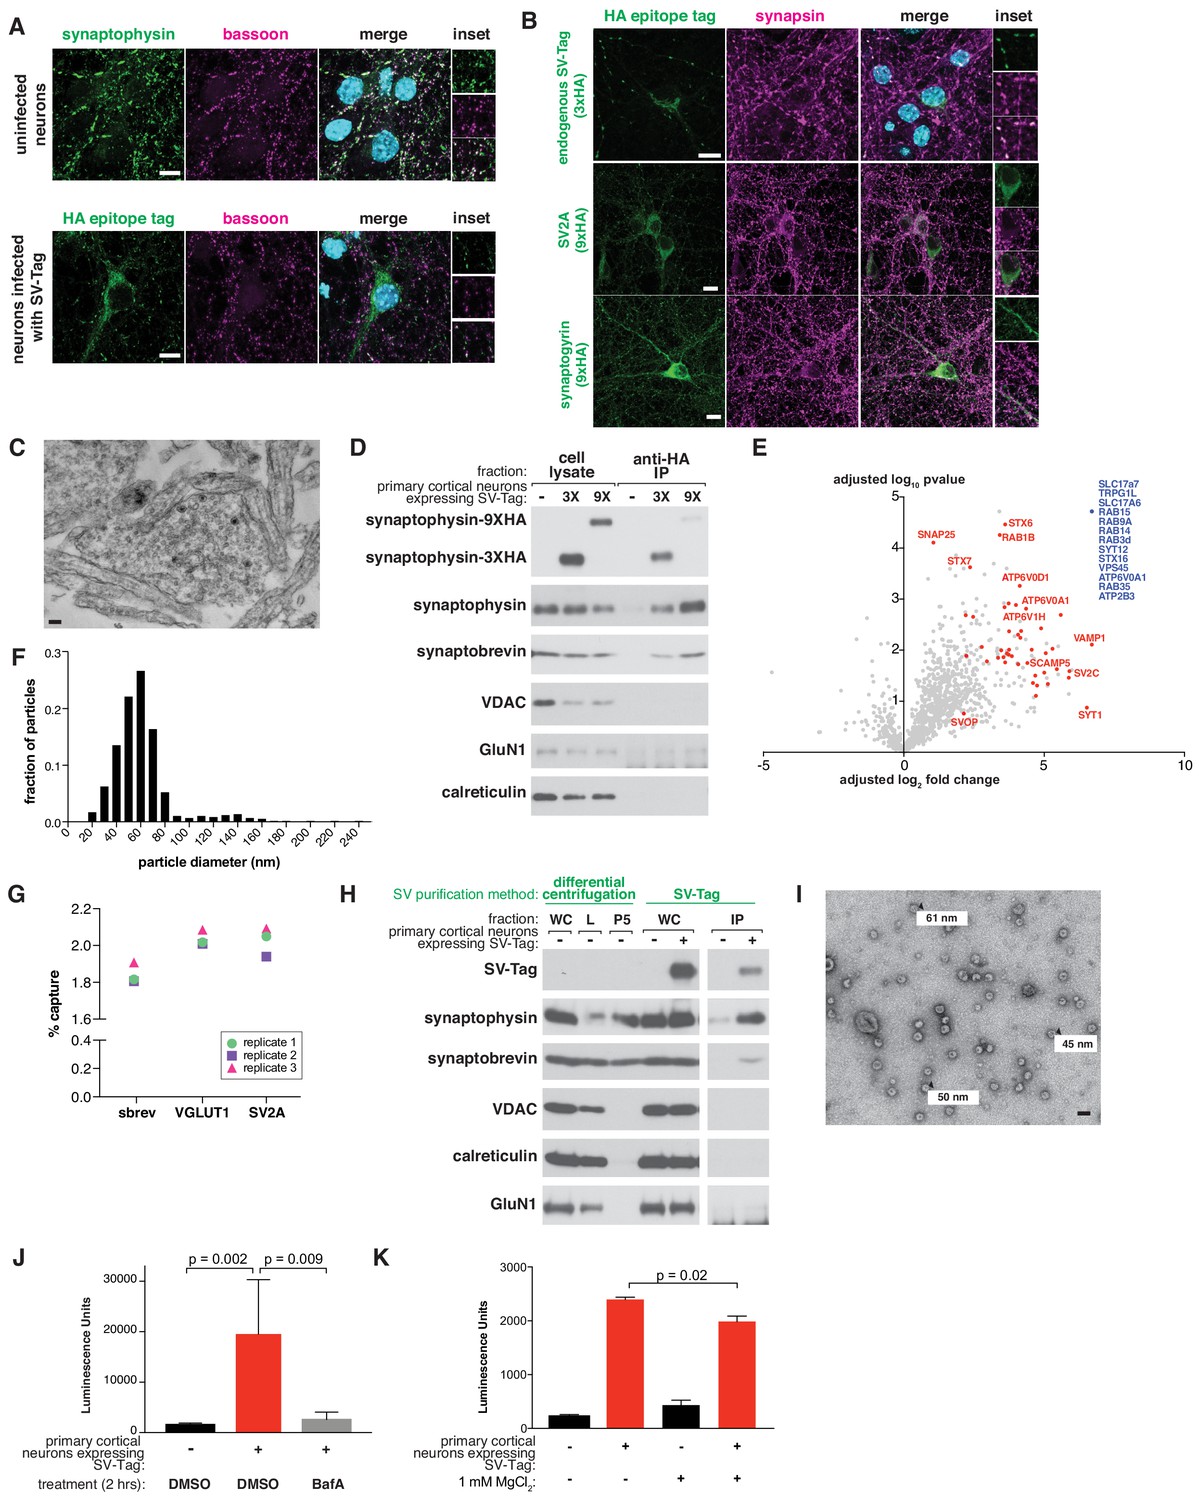
Characterization of synaptic vesicles isolated from mouse primary cortical cultures.
(A) Immunostaining of bassoon (magenta) in uninfected primary neurons (top panel) and neurons expressing SV-tag (green) (bottom panel). Cyan in merged image represents DAPI-stained nuclei. Insets show selected fields that were magnified 1.5X. Scale bars: 10 µm. (B) Immunostaining of primary neurons expressing indicated HA-tagged proteins (green) and endogenous synapsin (magenta). Specifically, neurons are expressing endogenously tagged synaptophysin with a triple HA-tag (top row), SV2A tagged at the N-terminus with nine tandem HA-tags (9x HA) (middle row), and synaptogyrin tagged at the N-terminus with a 9X HA-tag (bottom row). Insets show selected fields that were magnified 1.7X (top row) and 1.35X (middle and bottom row). Scale bars, 10 µm. (C) Electron microscope image of synaptosomes generated with the workflow. Scale bar, 100 nm. (D) Immunoblot analysis of the effect of the number of HA-tags on the efficiency of SV isolation. Lysates were prepared from neurons infected with lentivirus encoding for synaptophysin conjugated to three HA-tags (3X) or nine HA-tags (9X). (E) Proteomics analysis of isolated SVs vs. control IP. The blue dot denotes proteins in which there were no detected peptides in the control IP (n = 70, 14 of which are validated SV proteins), and red dots represent established SV proteins based on literature. (F) Histogram of the distribution of particle diameters observed by EM imaging of the final immunoisolate from SV-tagged neurons (source data included in Figure 1—source data 2) (G) Percent of initial input of synaptobrevin (sbrev), VGLUT1, and SV2A proteins present in the immunoisolate from SV-tagged neurons (H) Immunoblot analysis of SVs isolated with the SV-tag based workflow compared to a previously established one based on differential centrifugation. WC: whole cell, L: whole-cell lysate, P5: SV pellet, IP: HA immunoprecipitate (I) Electron microscope image of SVs generated with the differential centrifugation method used in S1H. Values denote diameter of indicated particles. Scale bar, 100 nm (J) Luminescence-based detection of glutamate in SVs isolated from neurons treated with DMSO or Bafilomycin A (500 nM) 2 hr prior to isolation. (K) Luminescence-based detection of glutamate in SVs isolated in the absence or presence of 1 mM MgCl2.
Figure 2 with 1 supplement
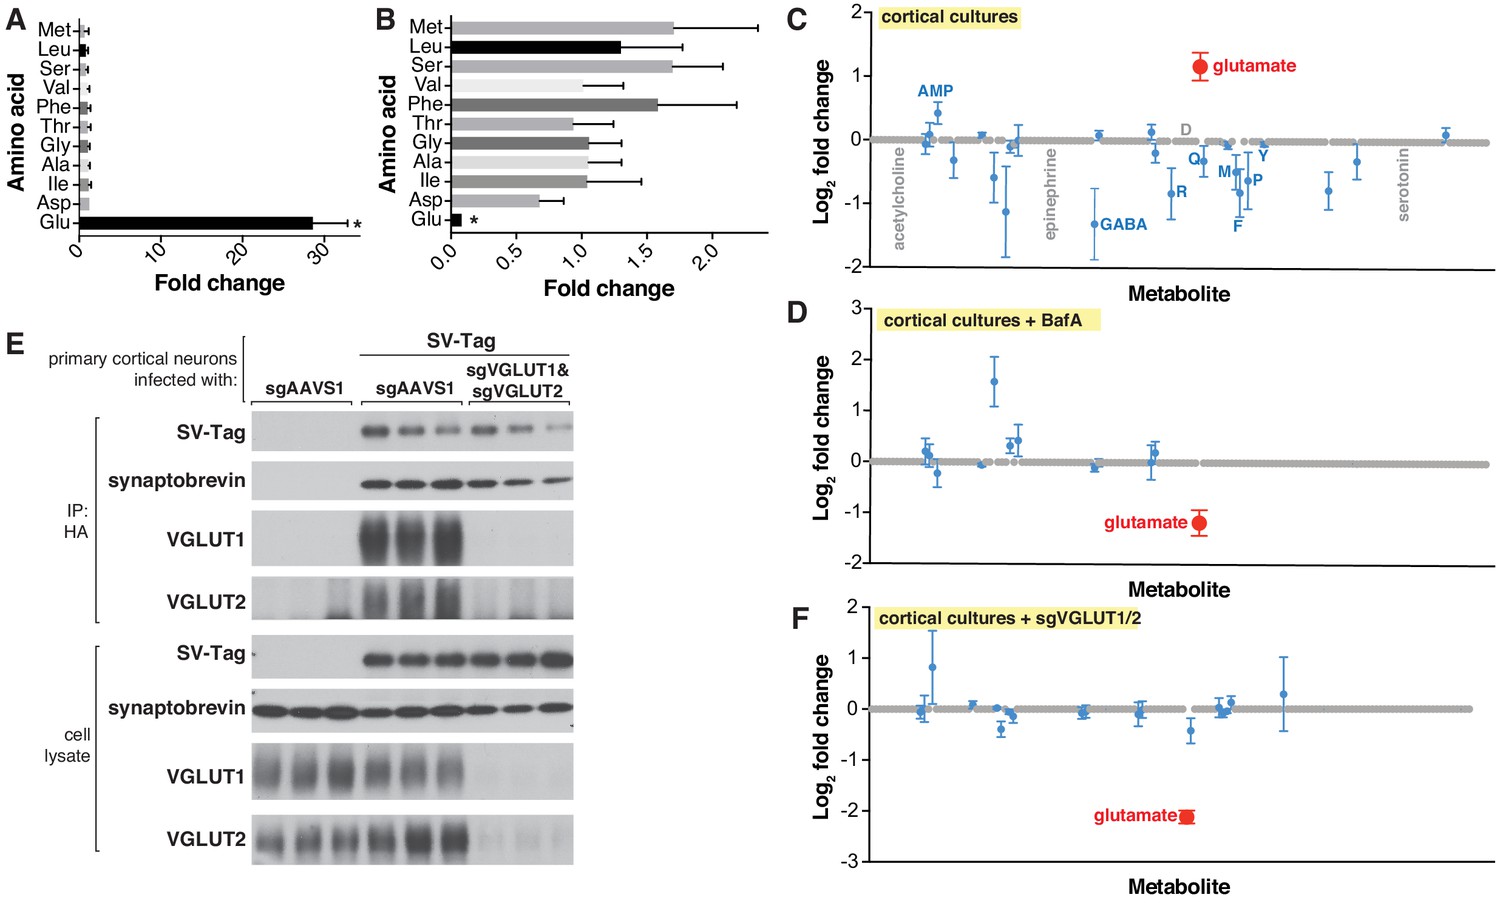
Targeted metabolite profile of purified synaptic vesicles (SVs) from cultured neurons.
(A) Fold change (mean ± standard error of the mean (SEM), n = 3) of selected amino acids detected by GC/MS in purified SVs vs. control IPs. Asterisk denotes a statistically significant difference (p-value < 0.05) of the abundance of the indicated amino acid in SVs profiled from cells infected with SV-tag compared to uninfected cells. (B) Effect of pretreatment of neurons with BafilomycinA on the abundance of selected amino acids in purified SVs, as detected with GC/MS (mean ± SEM, n = 3) (C) Relative abundance via LC/MS of 153 polar metabolites present in purified SVs derived from SV-tag infected cells, compared to preps from uninfected cells (mean ± SEM, n = 3–4). Red indicates p-value < 0.05, blue indicates p- value > 0.05, and gray indicates that the metabolite was undetected in all samples. Single letter codes annotate selected amino acids. Metabolites are listed in alphabetical order, and their corresponding identities can be found in Supplementary file 2. (D) Effect of BafilomycinA on the presence of a panel of polar metabolites in purified SVs profiled with LC/MS (mean ± SEM, n = 3–4). Fold changes are color coded using the same specifications as in (C). (E) Immunoblot analysis of neurons expressing control guides (sgAAVS1) or guides targeting glutamate transporters (sgVGLUT1 and sgVGLUT2). Lysates were prepared from neurons infected with lentivirus encoding the indicated constructs. Fold changes are color coded using the same specifications as in (C). (F) LC/MS metabolite profile of SVs isolated from cells with glutamate transporter knockdown compared with control cells expressing the control guide.
Figure 2—figure supplement 1
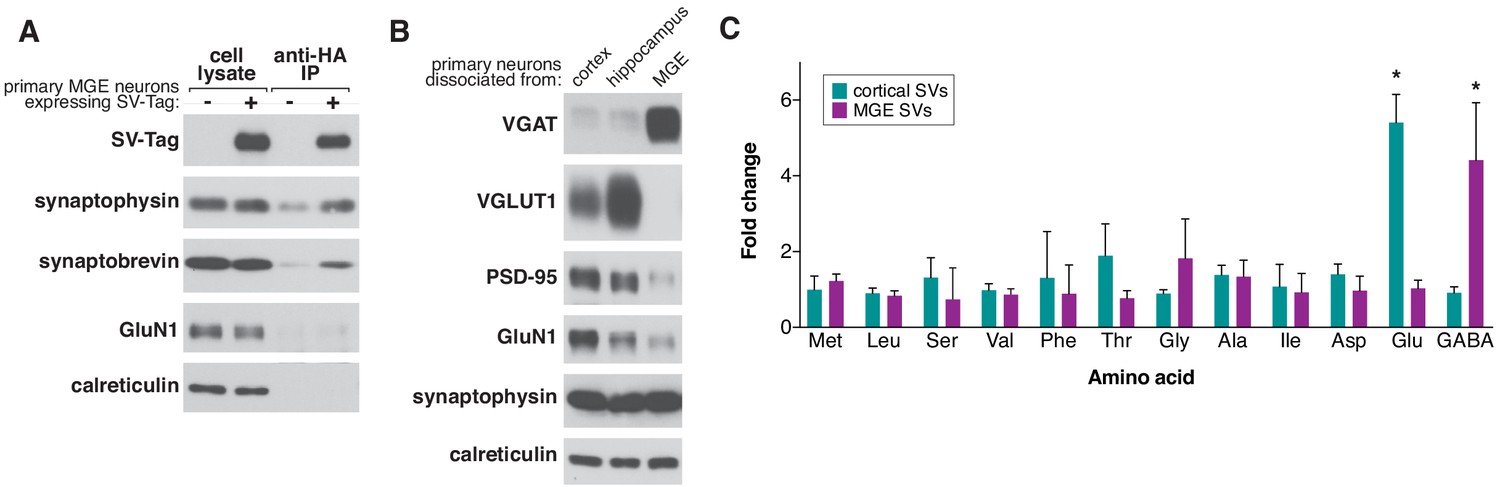
Comparison of metabolite profiles of isolated synaptic vesicles from cultured excitatory and inbitory neuronns.
(A) Immunoblot analysis of indicated proteins in whole-cell lysates, HA immunoprecipitates from medial ganglionic eminence (MGE) cultures infected with SV-tag, and control immunoprecipitates from uninfected MGE cultures. (B) Immunoblot analysis of whole-cell lysates of primary cortical, hippocampal, and MGE neurons. Lysates were probed for the presence of indicated synaptic and pan neuronal markers. (C) Comparison of the relative abundances of specified amino acids in purified synaptic vesicles (SVs) isolated from cortical vs. MGE cultures and profiled with GC/MS (mean ± SEM, n = 3). Asterisk denotes statistical significance. Glutamate fold change p-value = 7.5e−5, GABA fold change p-value = 4.8e−3.
Figure 3
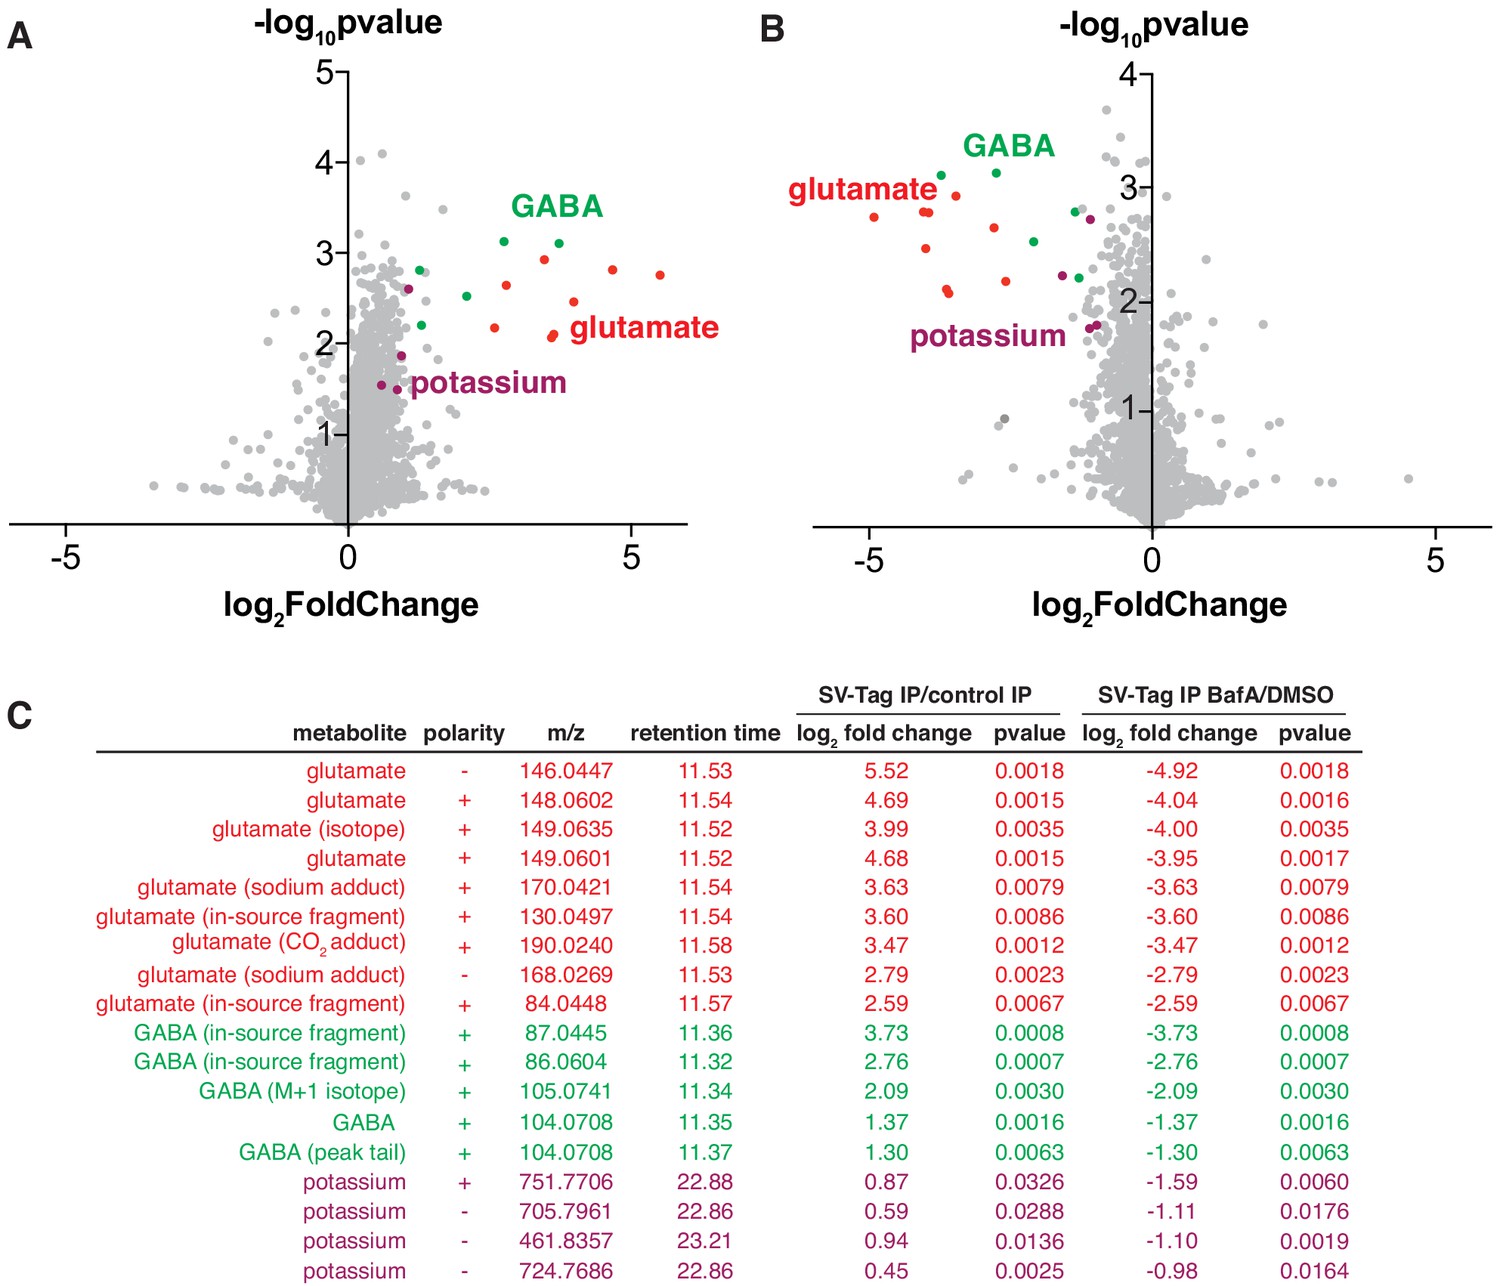
Unbiased polar metabolomics profile of purified synaptic vesicles (SVs) from cultured cortical neurons.
(A) Global polar metabolomics analysis via LC/MS of purified SVs, compared to an IP from uninfected cells. Green indicates glutamate and its associated derivatives generated during the LC/MS run. Red indicates GABA and its derivatives. Purple indicates potassium. Each dot represents the average of three replicate samples. (B) Global polar metabolomics analysis on purified SVs from Bafilomycin-treated vs. DMSO treated neurons. Legend is same as in A. (C) Summary of metabolites from global analysis which are significantly enriched in SV-tagged SVs and significantly depleted by BafilomycinA treatment.
Figure 4 with 1 supplement
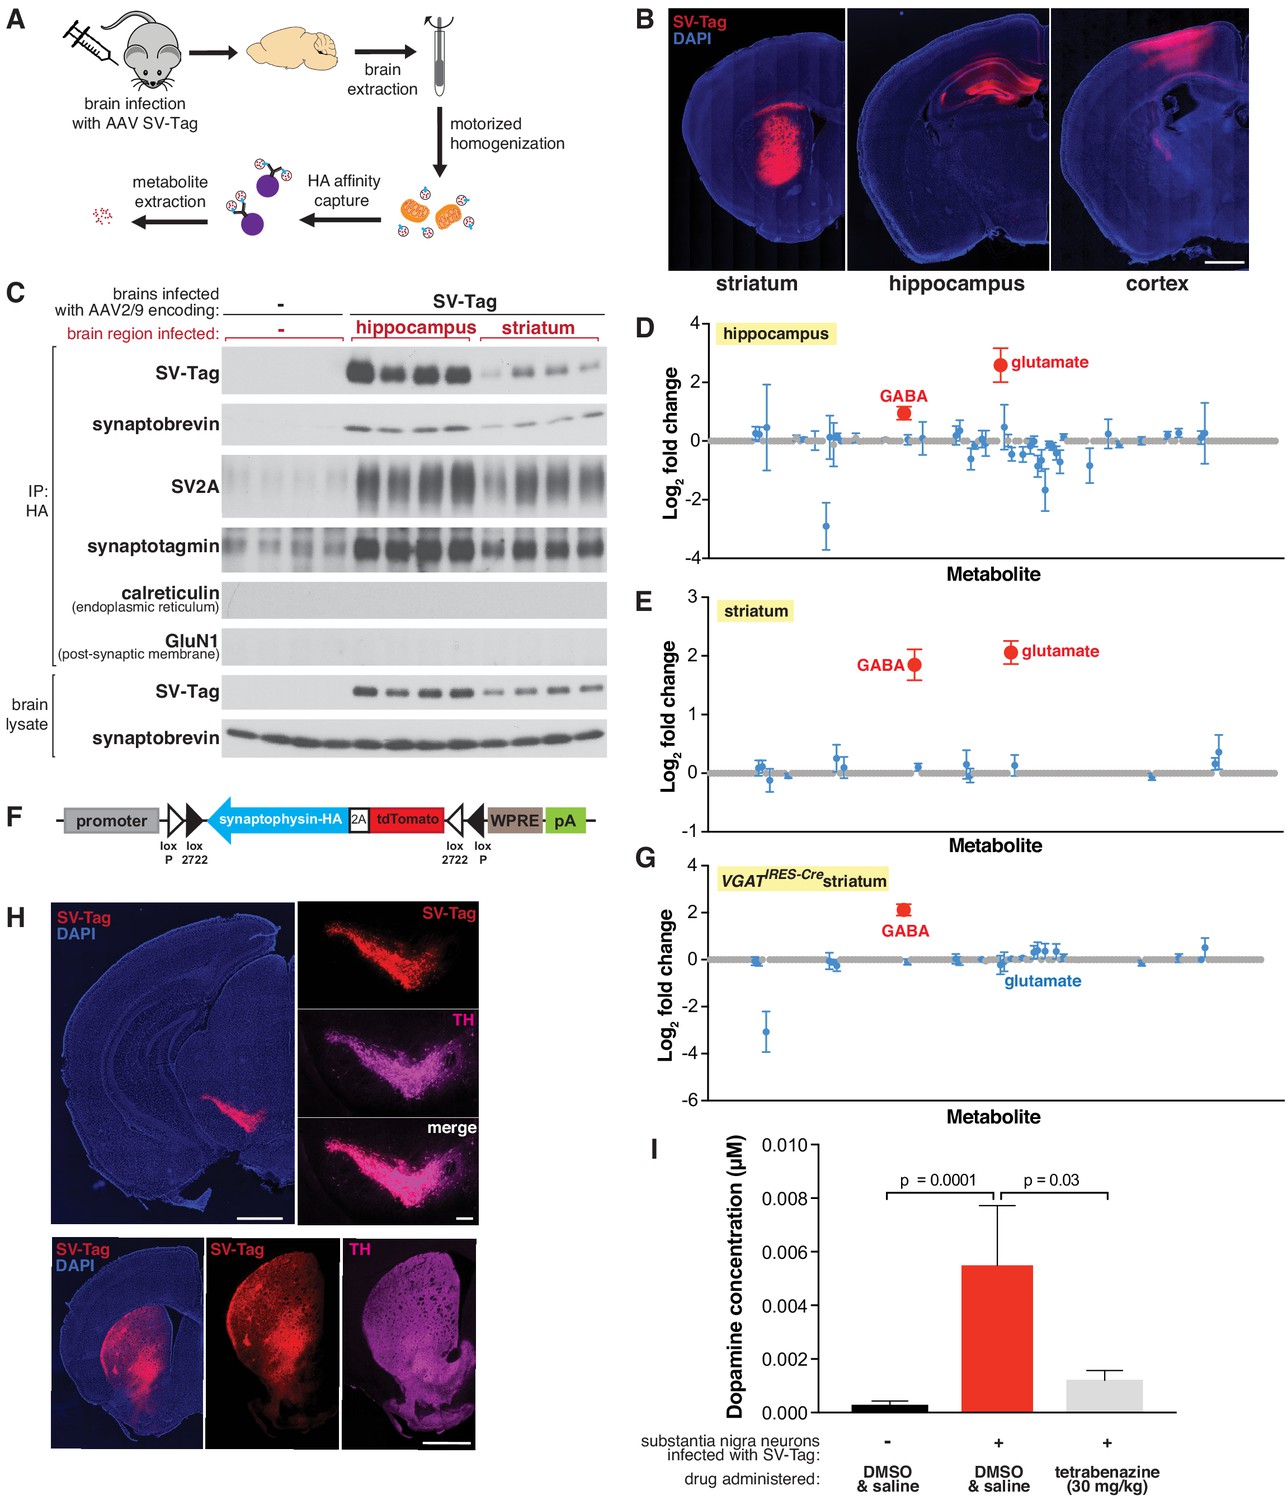
Adaptation of the workflow for rapid and specific isolation and metabolite profiling of synaptic vesicles (SVs) directly from mouse brain tissue.
(A) Schematic of the workflow used to isolate SVs from mouse brain tissue. (B) Immunofluorescence images of coronal sections from wild-type mouse brains transduced with SV-tag in the indicated brain regions. Neurons are labeled with DAPI nuclear stain (blue) and SV-tag (red). Scale bar: 1 mm. (C) Immunoblot analysis of indicated protein markers present in brain lysates, control immunoprecipitates from uninfected brains, and HA immunoprecipitates from hippocampi and striatum that were infected with SV-tag. (D) LC/MS profile of SVs isolated from wild-type mice brains infected with SV-tag in hippocampus compared to a control IP from uninfected brains. (mean ± SEM, n = 4). Color code and legend is the same as in Figure 2C. (E) LC/MS profile of SVs isolated from wild-type mice brains infected with SV-tag in striatum compared to uninfected brains. (mean ± SEM, n = 4) (F) Construct design for expression of SV-tag in neurons in a Cre-dependent manner. (G) LC/MS profile of SVs isolated from Slc32a1IRES-Cre/wt (VGATIRES-Cre) mice brains infected with SV-tag in striatum compared to uninfected brains. (mean ± SEM, n = 4) (H) Coronal sections from a Slc6a3IRES-Cre/wt mouse transduced with Cre-dependent SV-tag in dopaminergic neurons of the midbrain. Dopamine neurons are immunolabelled for tyrosine hydroxylase (TH, magenta), DAPI nuclear stain (blue) and SV-tag (red). (I) Targeted LC/MS profiling of dopamine in SVs isolated from Slc6a3IRES-Cre/wt mice transduced with Cre-dependent SV-tag in dopaminergic neurons of the midbrain. Indicated mice were subjected to saline injection or tetrabenazine injection intraperitoneally 2 hr prior to harvesting of SVs.
-
Figure 4—source data 1
Absolute dopamine concentrations measured for Figure 4I.
- https://cdn.elifesciences.org/articles/59699/elife-59699-fig4-data1-v2.xlsx
Figure 4—figure supplement 1
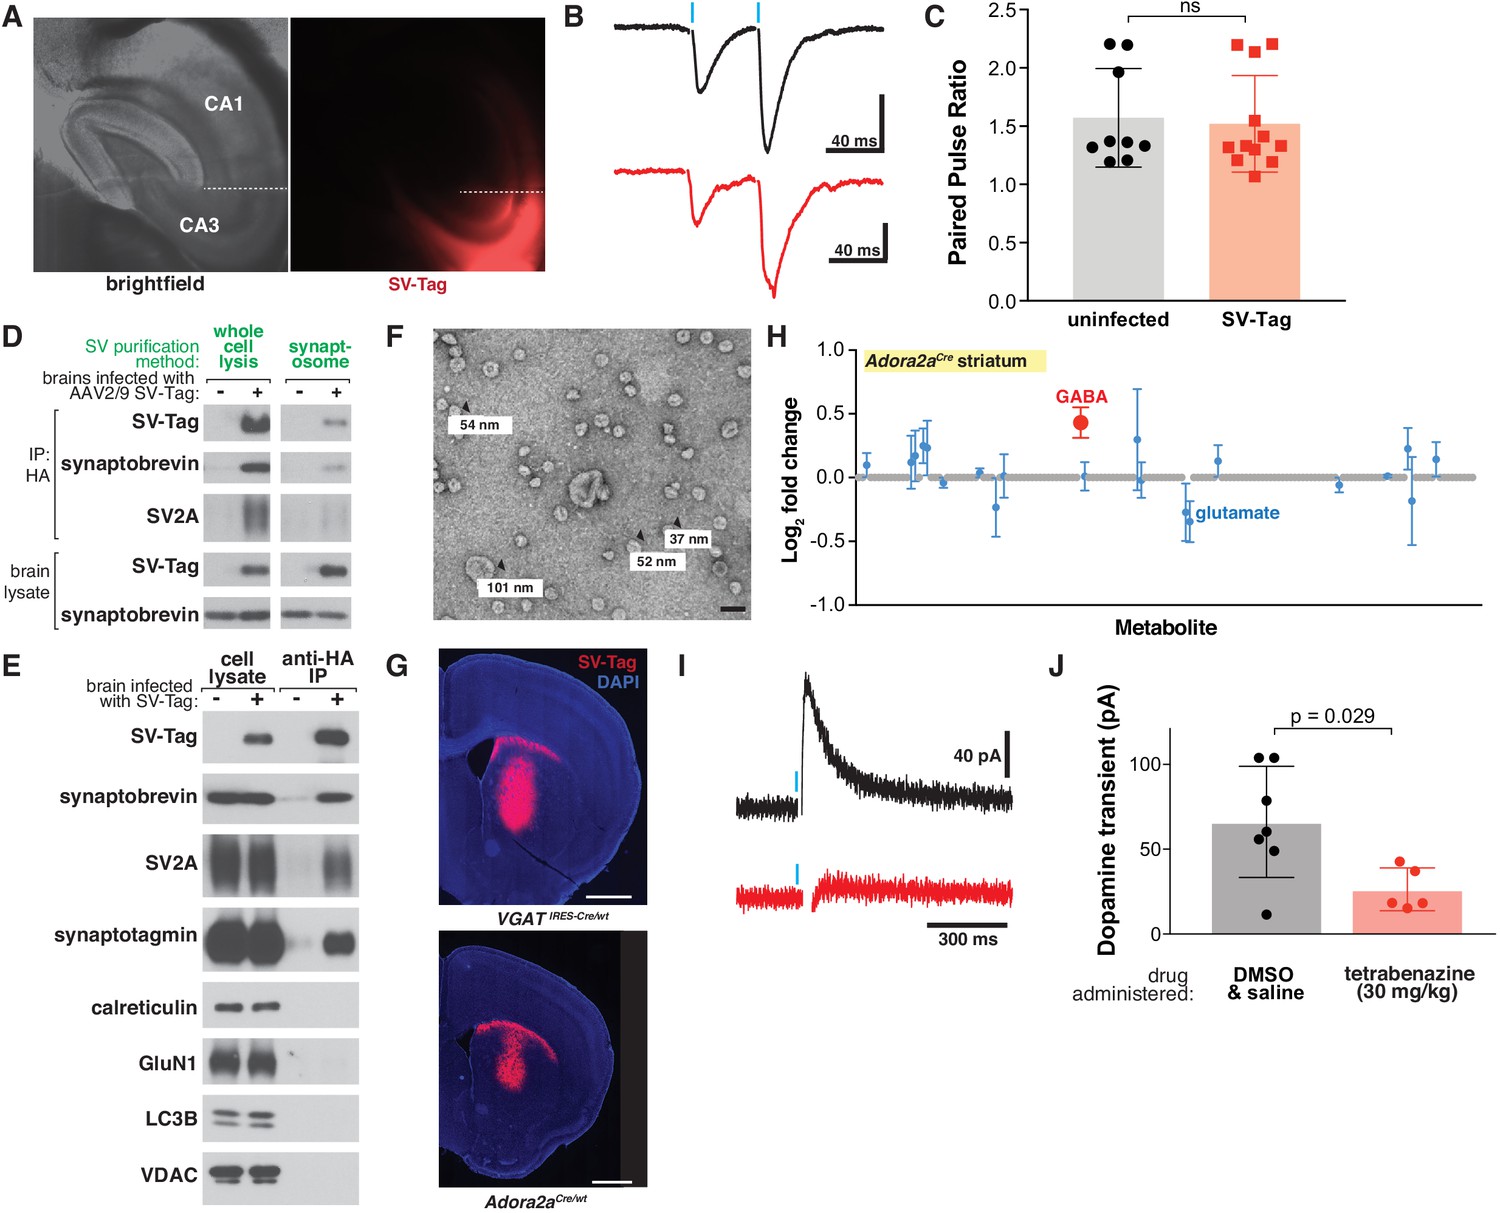
Characterization of synaptic vesicles isolated directly from mouse brain tissue.
(A) Immunofluorescence images of transverse sections containing hippocampal CA3 transduced with SV-tag. A cut was made between CA2 and CA1 (dashed white line) to prevent recurrent excitation of these synapses. (B) Representative traces of evoked current responses in hippocampus from electrical stimulation. Vertical blue bars indicate stimulation that occurred with an interstimulus interval of 50 ms of Schaffer collaterals with (red) and without (black) expression of SV-tag. Vertical bar indicates 100 pA. Non-significant p-value = n.s. (C) Summary of paired-pulse ratios of electrically evoked synaptic responses from CA3 to CA1 synapses that were uninfected or expressing SV-tag. (D) Immmunoblot analysis of indicated proteins for synaptic vesicles (SVs) isolated from the whole-cell lysis method of brains compared to vesicles isolated with the synaptosome method. (E) Immunoblot analysis of SVs isolated from mouse brains transduced with SV-tag in the cortex. (F) Electron microscope image of SVs generated with the workflow. Values denote diameter of indicated particles. Scale bar: 100 nm (G) Coronal sections from Slc32a1IRES-Cre/wt (VGAT IRES-Cre/wt) and Adora2aCre/wt mice transduced with a Cre-dependent SV-tag in the striatum. (H) LC/MS profile of SVs isolated from Adora2aCre/wt mice brains infected with SV-tag in striatum compared with uninfected brains. (mean ± SEM, n = 4) (I) Representative traces of amperometry demonstrating the effects of DMSO (black) and tetrabenazine (black) on evoked dopamine. Blue indicates electrical stimulation. (J) Amperometry for dopamine in coronal slices prepared from mice administered intraperitoneally with tetrabenazine (30 mg/kg) or vehicle control 2 hr before slicing.
Tables
Key resources table
| Reagent type (species) or resource | Designation | Source or reference | Identifiers | Additional information |
|---|---|---|---|---|
| Strain, strain background (M. musculus) | Wild-type | Jackson Labs | C57BL6/J, RRID:MGI:5650797 | Stock #00644 |
| Strain, strain background (M. musculus) | Albino Swiss mice | Charles River | CD-1 IGS, RRID:MGI:5653285 | Stock #022 |
| Strain, strain background (M. musculus) | Vgatires-cre | Jackson Labs | Slc32a1IRES-Cre, RRID:IMSR_NM-KI-200081 | Stock #016962 |
| Strain, strain background (M. musculus) | Datires-cre | Jackson Labs | Slc6a3IRES-Cre,RRID:IMSR_NM-KI-200092 | Stock #006660 |
| Strain, strain background (M. musculus) | Adora2aCre | GENSAT | RRID:MMRRC_034744-UCD | founder line KG139 |
| Strain, strain background (AAV) | AAV2/9 hSynapsin SV-tag WPRE | BCH Viral Core | NA | Titer: 1.6 × 10¹⁴ gc/ml |
| Strain, strain background (AAV) | AAV2/9 Cre floxed SV-tag WPRE | BCH Viral Core | NA | Titer: 1.7 × 10¹⁴ gc/ml |
| Antibody | Guinea pig polyclonal synaptophysin | Synaptic Systems | 101004, RRID:AB_1210382 | (1:100) dilution |
| Antibody | Rabbit polyclonal synaptophysin | Synaptic Systems | 101002, RRID:AB_887905 | (1:1000) dilution |
| Antibody | Rabbit monoclonal synapsin | Cell Signaling Technology | 5297S, RRID:AB_261578 | (1:500) dilution |
| Antibody | Rabbit monoclonal HA-Tag | Cell Signaling Technology | 3724S, RRID:AB_1549585 | (1:1000) dilution |
| Antibody | Mouse monoclonal synaptotagmin | Synaptic Systems | 105011, RRID:AB_887832 | (1:1500) dilution |
| Antibody | Mouse monoclonal synaptobrevin | Synaptic Systems | 104211. RRID:AB_887811 | (1:5000) dilution |
| Antibody | Rabbit monoclonal SV2A | Synaptic Systems | 119003, RRID:AB_2725760 | (1:2000) dilution |
| Antibody | Rabbit polyclonal VGLUT1 | Synaptic Systems | 135303, RRID:AB_887875 | (1:1500) dilution |
| Antibody | Rabbit monoclonal VGLUT2 | Synaptic Systems | 135421, RRID:AB_2619823 | (1:1000) dilution |
| Antibody | Rabbit monoclonal calreticulin | Cell Signaling Technology | 12238S, RRID:AB_2688013 | (1:250) dilution |
| Antibody | Rabbit monoclonal GAPDH | Cell Signaling Technology | 2118S, RRID:AB_1031003 | (1:1000) dilution |
| Antibody | Rabbit monoclonal Golgin-97 | Cell Signaling Technology | 13192S, RRID:AB_2798144 | (1:200) dilution |
| Antibody | Rabbit monoclonal VDAC | Cell Signaling Technology | 4661S, RRID:AB_10557420 | (1:500) dilution |
| Antibody | Rabbit monoclonal LC3B | Cell Signaling Technology | 2775S, RRID:AB_915950 | (1:200) dilution |
| Antibody | Mouse monoclonal NMDA receptor | Synaptic Systems | 114011, RRID:AB_887750 | (1:1000) dilution |
| Antibody | Rabbit polyclonal Myelin basic protein | Synaptic Systems | 295003, RRID:AB_2620036 | (1:300) dilution |
| Antibody | Rabbit polyclonal Ca2+channel P/Q-type alpha1A unit | Synaptic Systems | 152103, RRID:AB_887699 | (1:300) dilution |
| Antibody | Mouse monoclonal apha1 Na+ K+ ATPase | Abcam | Ab7671, RRID:AB_306023 | (1:300) dilution |
| Antibody | Rabbit polyclonal Transferrin receptor | Abcam | Ab84036, RRID:AB_10673794 | (1:300) dilution |
| Antibody | Mouse monoclonal GLUT4 | Cell Signaling Technology | 2213S, RRID:AB_823508 | (1:200) dilution |
| Antibody | Mouse monoclonal tyrosine hydroxylase | ImmunoStar | 22941, RRID:AB_572268 | (1:1000) dilution |
| Antibody | Mouse monoclonal Bassoon | Enzo Life Sciences | SAP7F407, RRID:AB_1641480 | (1:1000) dilution |
| Antibody | Rabbit monoclonal VGAT | Synaptic Systems | 131011, RRID:AB_887872 | (1:1000) dilution |
| Peptide, recombinant protein | Recombinant mouse synatopbrevin protein (His tagged) | Abcam | Ab222979 | |
| Chemical compound, drug | BafilomycinA | Millipore Sigma | 196000 | |
| Chemical compound, drug | Tetrabenazine | Sigma | T2952-10MG | |
| Recombinant DNA reagent | pUbc SV-tag (lentiviral vector) | This study | Figure 1A | |
| Recombinant DNA reagent | pAAV hSynapsin SV-tag (AAV vector) | This study | Figure 4F | |
| Recombinant DNA reagent | pAAV hSynapsin flexed SV-tag (AAV vector) | This study | Figure 4F | |
| Recombinant DNA reagent | pLenti CRISPR sgVGLUT1 (lentiviral vector) | This study | Methods section,‘Lentiviral constructs and production’ | |
| Recombinant DNA reagent | pLenti CRISPR sgVGLUT2 (lentiviral vector) | This study | Methods section,‘Lentiviral constructs and production’ | |
| Commercial assay or kit | Glutamate- Glo assay | Promega | J7021 | |
| Other | Anti-HA magnetic beads | Thermo Fisher Scientific | 88837, RRID:AB_2861399 |
Additional files
-
Supplementary file 1
Proteomics profile of immunoprecipitates from primary cortical neurons expressing SV-tag vs. uninfected neurons, related to Figure S1D.
- https://cdn.elifesciences.org/articles/59699/elife-59699-supp1-v2.xlsx
-
Supplementary file 2
List of the metabolites interrogated in the targeted LC/MS runs, related to Figure 2C,D and F, Figure 4D,E and G, and Figure S4H.
- https://cdn.elifesciences.org/articles/59699/elife-59699-supp2-v2.xlsx
-
Supplementary file 3
Metabolites detected in SVs from cortical cultures via GC/MS and LC/MS and their associated calculations of fold changes, significance, and SEM, related to Figure 2.
- https://cdn.elifesciences.org/articles/59699/elife-59699-supp3-v2.xlsx
-
Supplementary file 4
Metabolites detected via global LC/MS performed on cortical culture SVs, treated with DMSO or BafilomycinA, related to Figure 3.
- https://cdn.elifesciences.org/articles/59699/elife-59699-supp4-v2.xlsx
-
Supplementary file 5
Metabolites detected in SVs from hippocampus and striatum via LC/MS and their associated calculations of fold changes, significance, and SEM, related to Figure 4.
- https://cdn.elifesciences.org/articles/59699/elife-59699-supp5-v2.xlsx
-
Transparent reporting form
- https://cdn.elifesciences.org/articles/59699/elife-59699-transrepform-v2.docx
Download links
A two-part list of links to download the article, or parts of the article, in various formats.
Downloads (link to download the article as PDF)
Open citations (links to open the citations from this article in various online reference manager services)
Cite this article (links to download the citations from this article in formats compatible with various reference manager tools)
Rapid purification and metabolomic profiling of synaptic vesicles from mammalian brain
eLife 9:e59699.
https://doi.org/10.7554/eLife.59699


