Global landscape of phenazine biosynthesis and biodegradation reveals species-specific colonization patterns in agricultural soils and crop microbiomes
- Division of Geological and Planetary Sciences, California Institute of Technology, United States
- Division of Biology and Biological Engineering, California Institute of Technology, United States
- Wheat Health, Genetics and Quality Research Unit, USDA Agricultural Research Service, United States
Figures
Figure 1
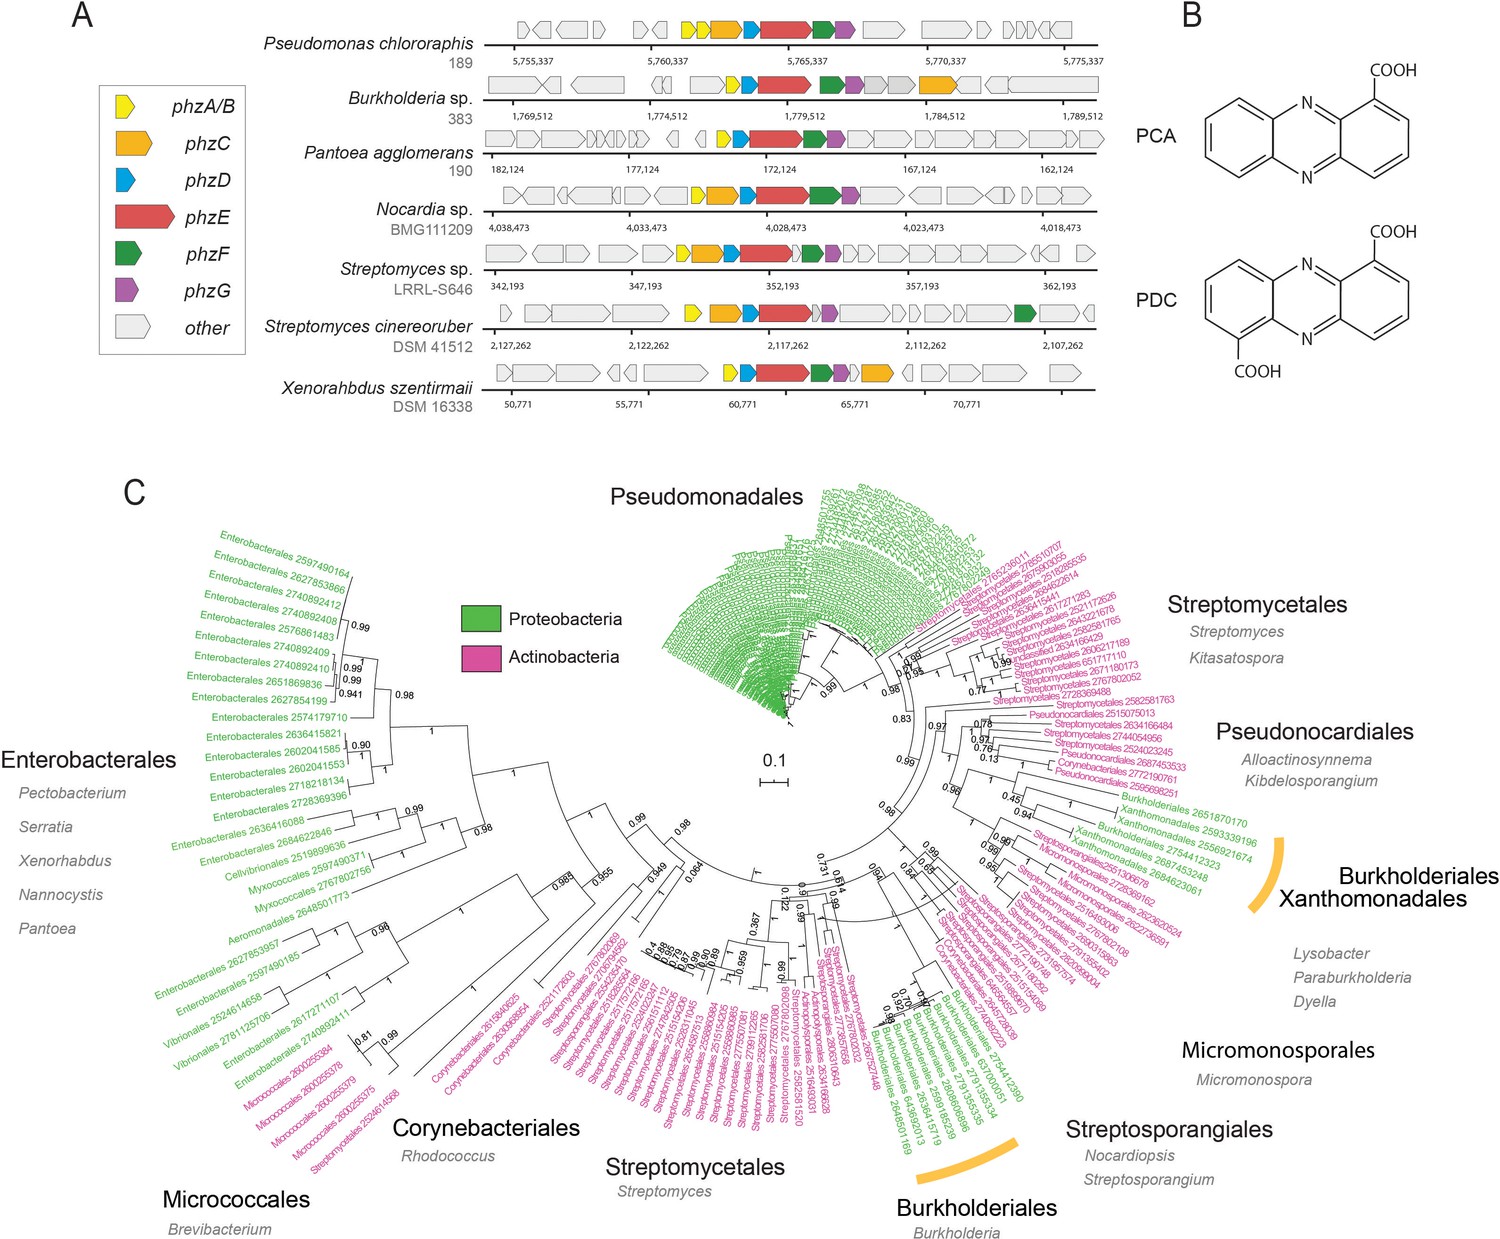
Diversity and phylogeny of phenazine producing bacteria assembled in this study.
(A) Genomic regions containing the core phenazine biosynthesis genes in diverse bacteria. Core biosynthesis genes (phzA/BCDEFG) are colored as shown in the legend, all other surrounding genes are depicted in gray. (B) Chemical structures of the main phenazine precursors, PCA and PDC. (C) Phylogenetic tree constructed using the concatenated phenazine-biosynthesis protein sequences. Phylum level is color coded according to the legend and specific clades are annotated around the tree (orders in black and genera in gray). Orange bars highlight Xanthomonadales and Burkholderiales species. Tree scale and bootstrap values are depicted in the figure.
Figure 2 with 2 supplements
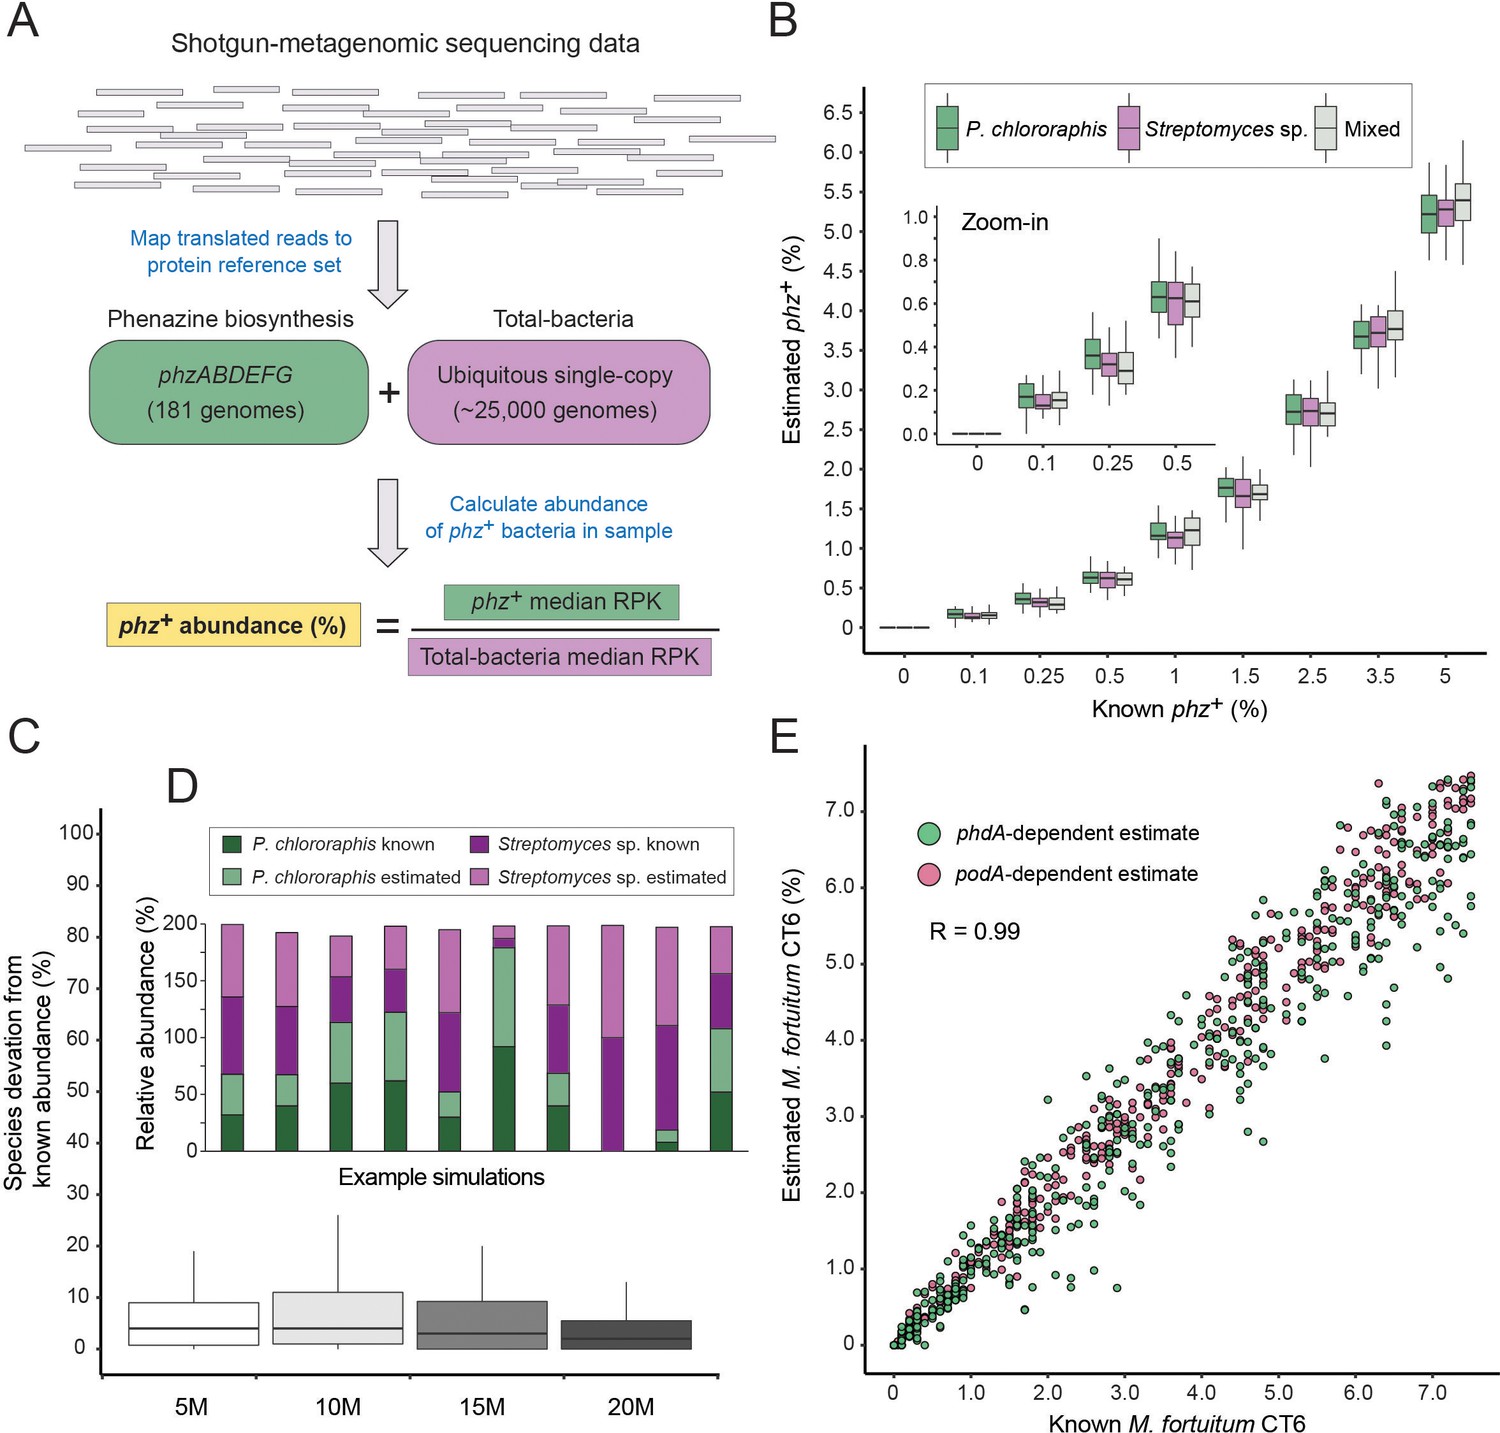
A method for estimating the abundance of phz+ bacteria using shotgun-metagenomics.
(A) Schematic representation of the computational approach. Phenazine producer abundance is calculated using the median Reads Per Kilobase (RPK) levels. (B) Validation results using simulated communities. Box plots represent different producer combinations as indicated in the legend. Each boxplot represents data from simulations performed with 80% amino-acid identity threshold and across 5–20M library coverages (n = 48 per individual boxplot). The black bar represents the box median. (C) Accuracy in measuring relative abundance of multiple phz+ species in a mixed community. Y-axis shows the difference between known and estimated species abundance across the indicated library coverages, considering samples with >0.1% phz+ bacteria. (D) Example of individual simulation results with two different phz+ bacteria. Similar heights of dark and light column portions represent good agreement between known and estimated levels. (E) Scatter plot depicting phenazine degrader (M. fortuitum CT6) frequency estimates at a gradient of known levels in simulated metagenomes. M. fortuitum levels are estimated using either phdA or podA genes, shown in pink and green, respectively.
Figure 2—figure supplement 1
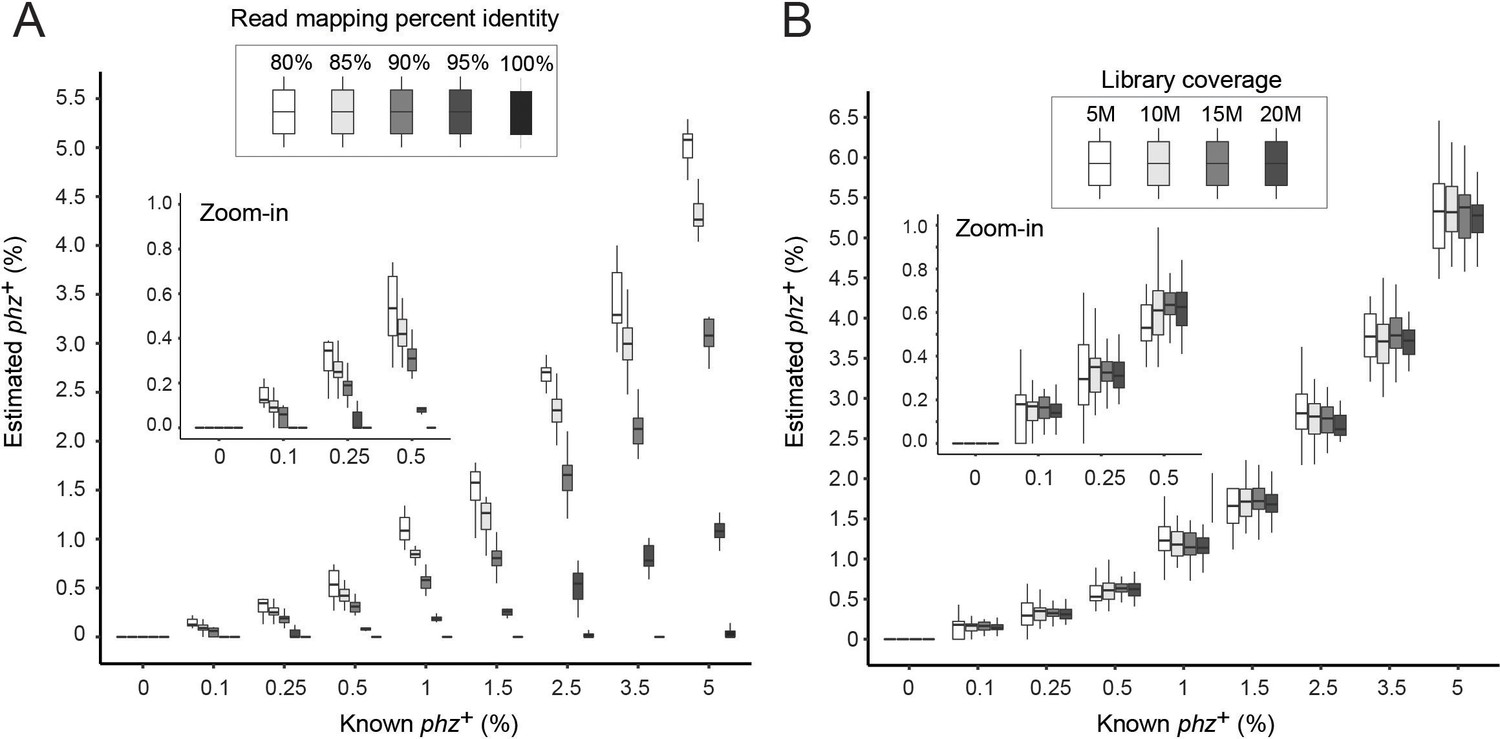
Benchmarking with mapping and library coverage parameters.
(A) Cross-validation of Simulated communities spiked with phz+ Streptomyces at different frequencies. The simulated metagenomic data were mapped against a database that does not contain the specific Streptomyces producer that was spiked-in and various percent amino-acid identity thresholds were tested (as indicated in the legend). (B) Simulations of all simulated communities using an 80% amino-acid identity threshold, separated by different library coverages.
Figure 2—figure supplement 2
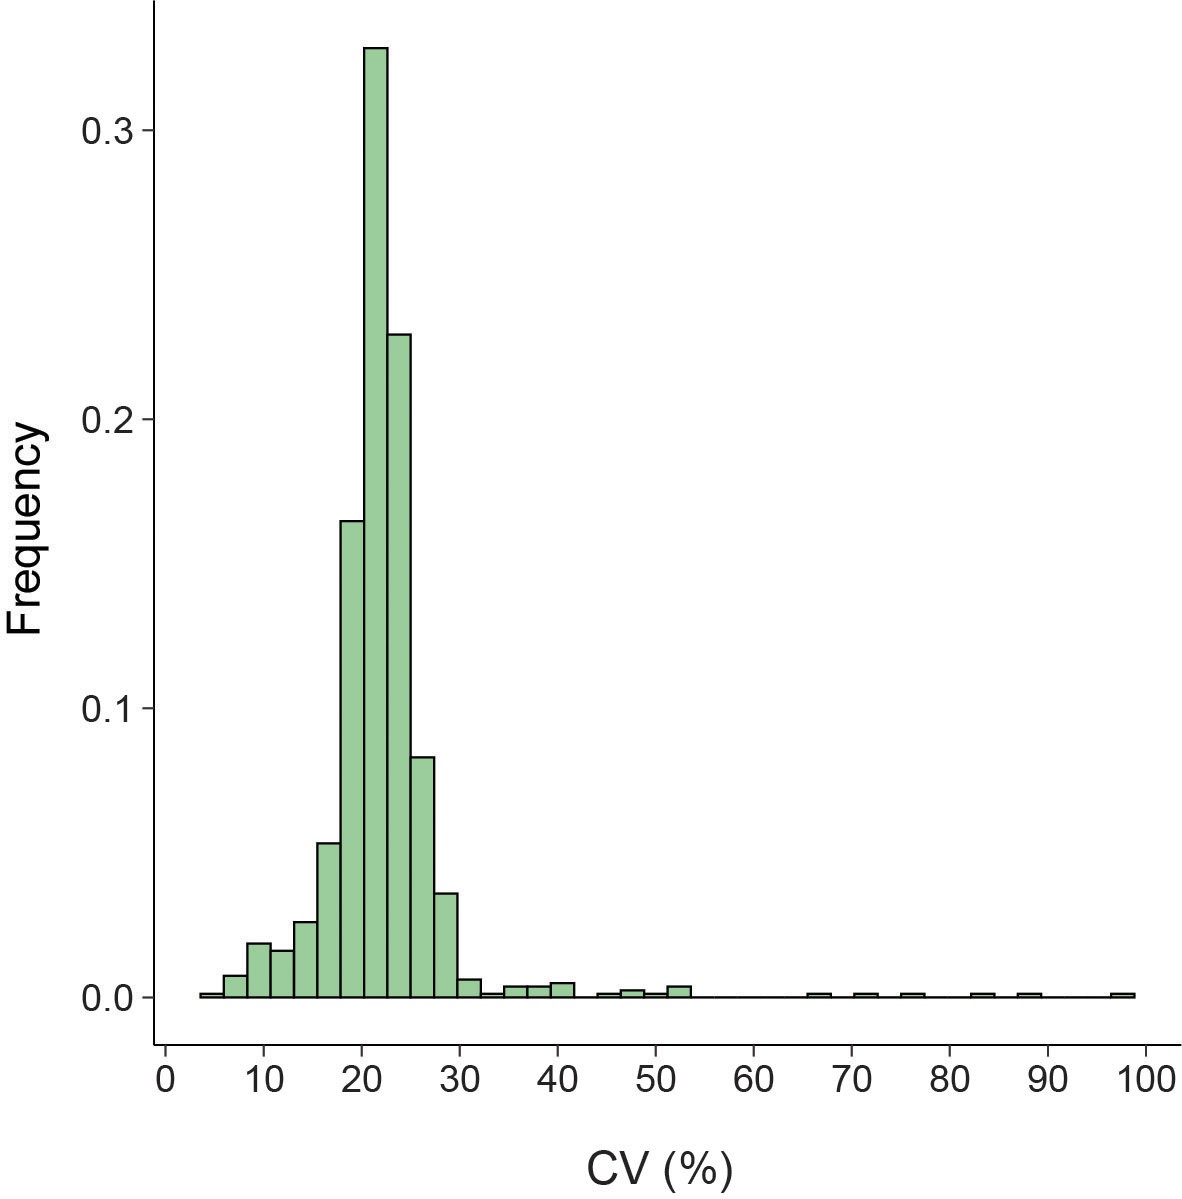
Low variation in bac120 reference gene coverage across samples.
Histogram shows the coefficient of variation (CV; standard deviation/mean) calculated using the 25 chosen bac120 reference genes across all analyzed samples in this study.
Figure 3 with 1 supplement
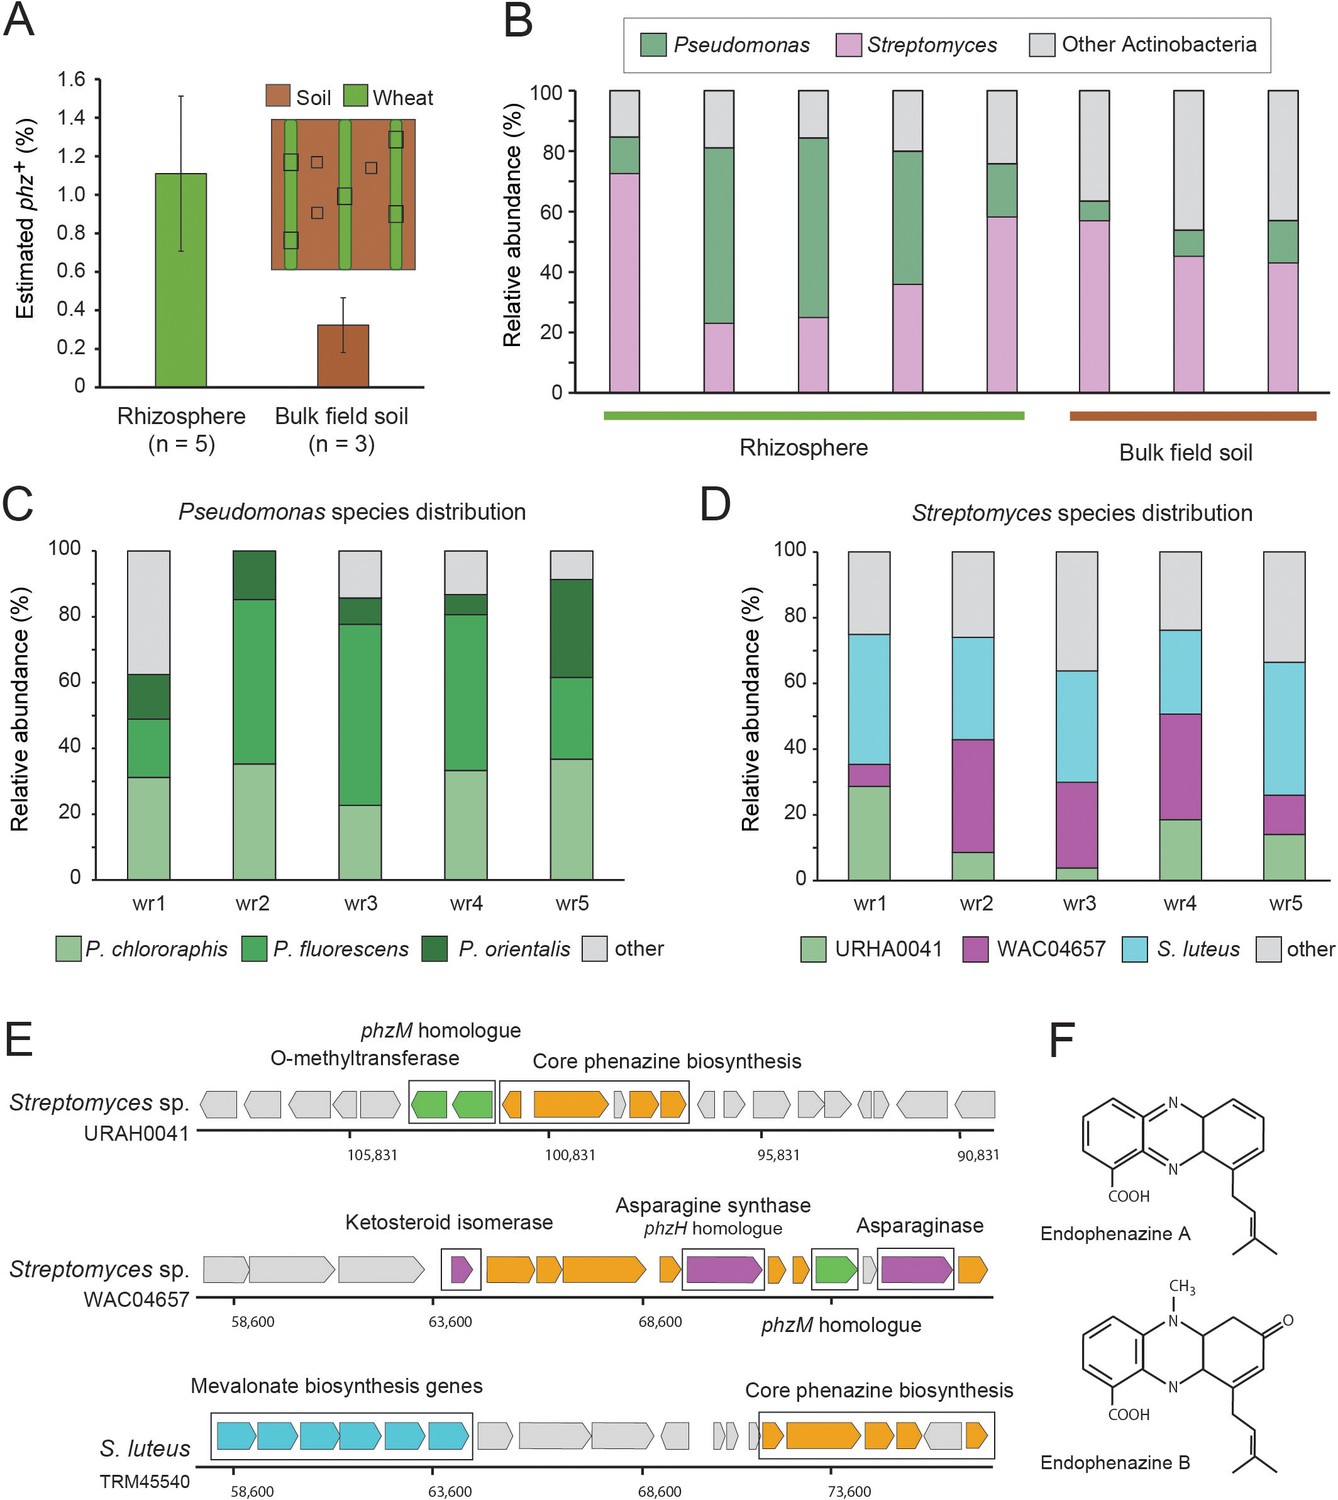
Field validation in the wheat rhizosphere.
(A) Illustration of sample collection and metagenomic results. Green and brown stripes represent planted wheat rows and field soil, respectively. Black boxes depict sampling sites. Estimated phz+ levels in wheat rhizospheres and soil collected between planted rows. Error bars represent standard deviation. (B) Order level taxonomic distribution of phz+ bacteria within each sample. Y-axis describes the relative abundance of each order out of all phz+ bacteria. (C–D) Species level phz+ distributions across wheat rhizosphere samples (wr1-wr5). (E) Genomic regions displaying phenazine core and modification genes in the main Streptomyces groups detected in the rhizosphere. Specific modification genes are annotated in the figure. (F) Chemical structures of representative prenylated phenazines predicted to be produced by the mevalonate pathway highlighted in the S. luteus genomic region in E.
Figure 3—figure supplement 1
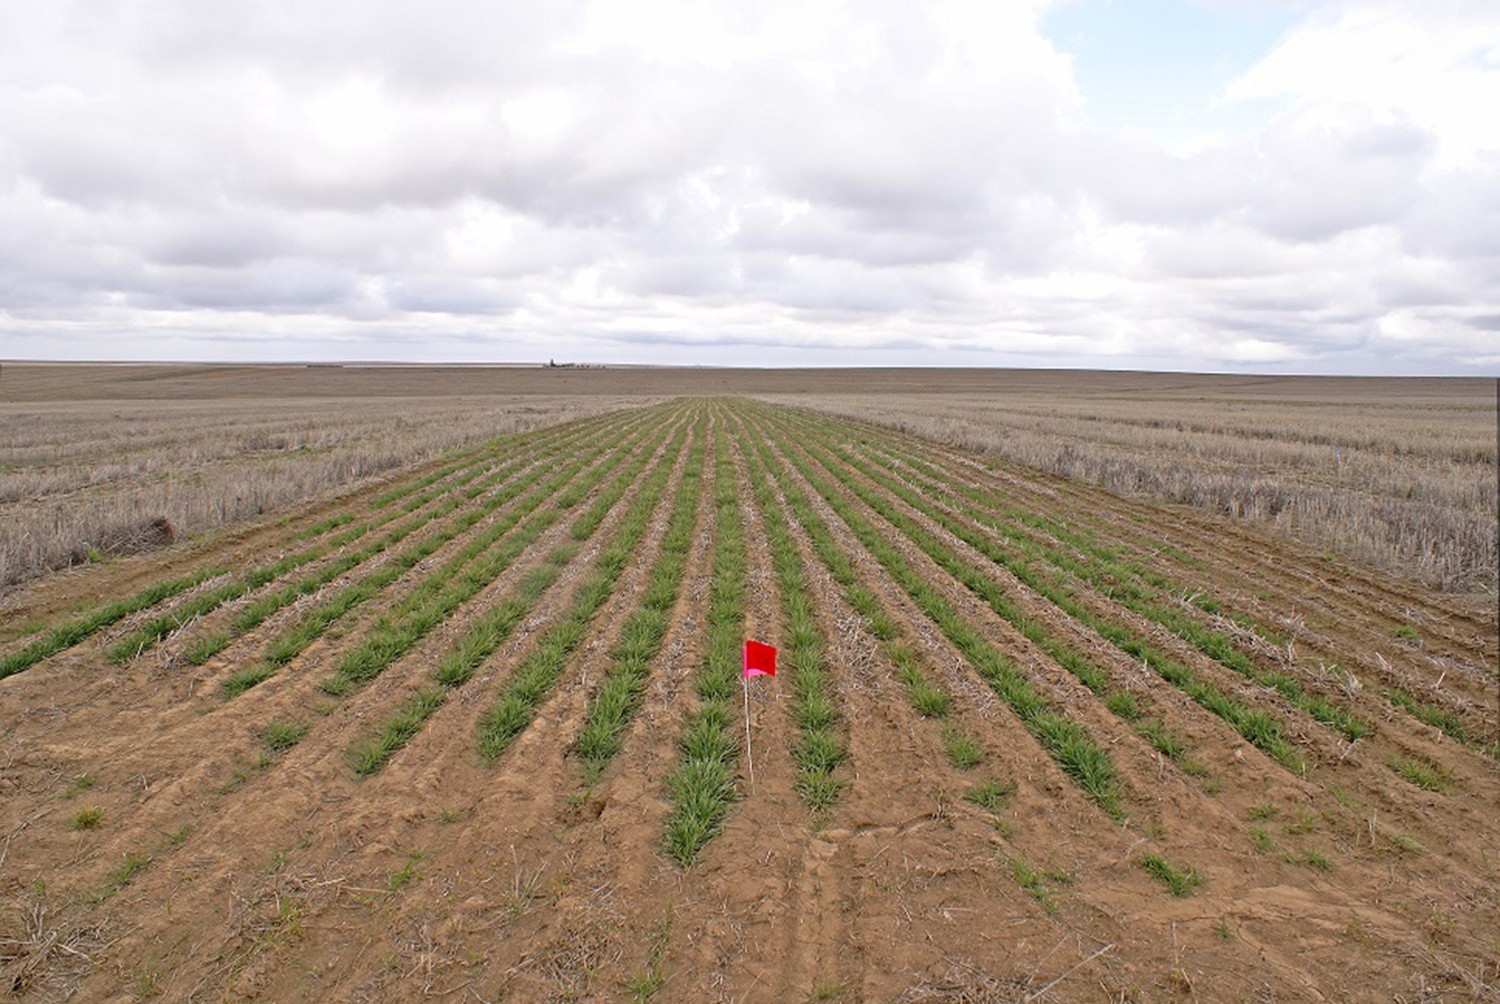
Wheat field sampling site.
The Washington State University Lind Dryland Research Station (46.973°N, 118.616°W, 423.7 m above sea level). Wheat seedlings were collected from different positions and different rows. Bulk soil was collected between rows.
Figure 4 with 3 supplements
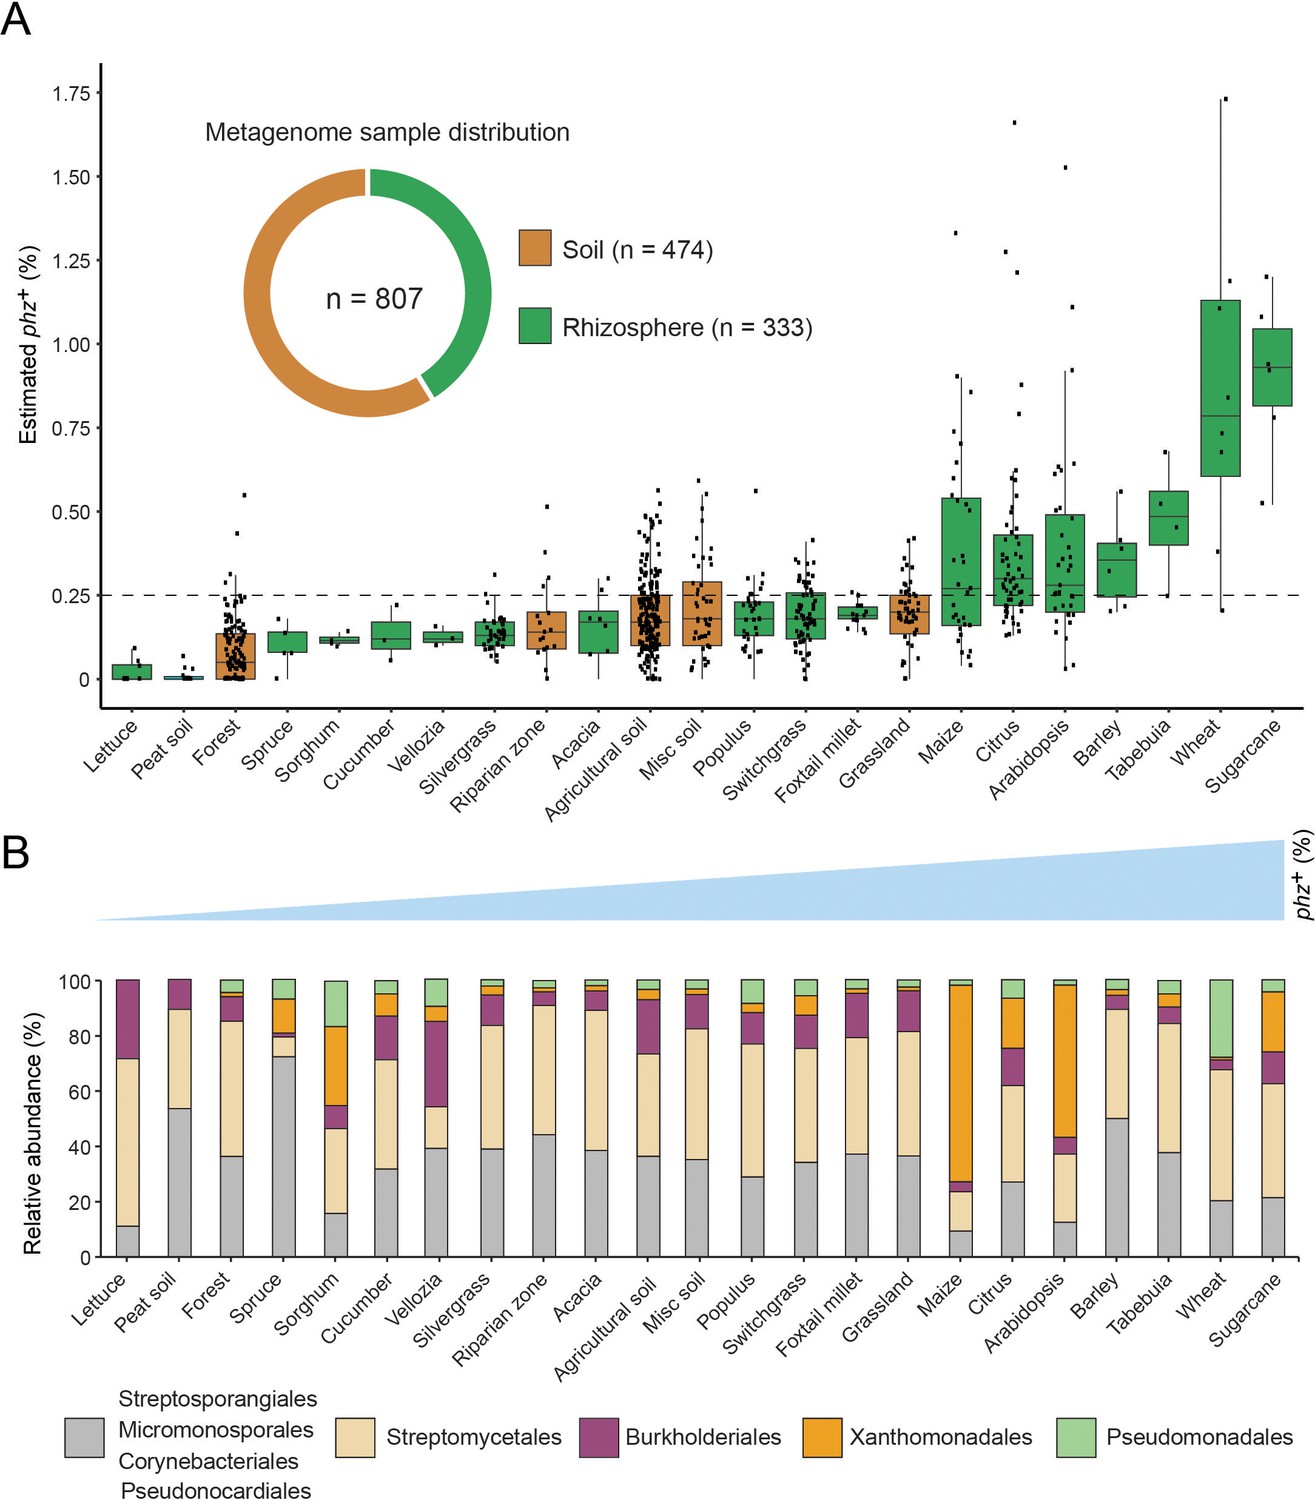
Global analysis of phenazine biosynthesis across diverse soil and plant habitats.
(A) Distribution of phz+ bacteria levels per each habitat (percent of all bacteria). Soil and rhizosphere samples are depicted in brown and green, respectively. Each boxplot represents a different habitat as annotated in the x-axis. Boxplot central line shows the median and all samples are shown as black dots. (B) Comparison of the relative abundance of phz+ taxonomic distributions across habitats, considering all individual samples (e.g., the maize bar was calculated using all 32 metagenomes in our dataset; Analysis of individual samples can be found in Figure 4—figure supplement 2). Order level taxonomic groups are depicted via different colors according to the legend.
Figure 4—figure supplement 1

Metagenomic sample category distributions.
Subcategory distributions for shotgun-metagenomic samples classified as either bulk soil or rhizospheres analyzed in this study.
Figure 4—figure supplement 2
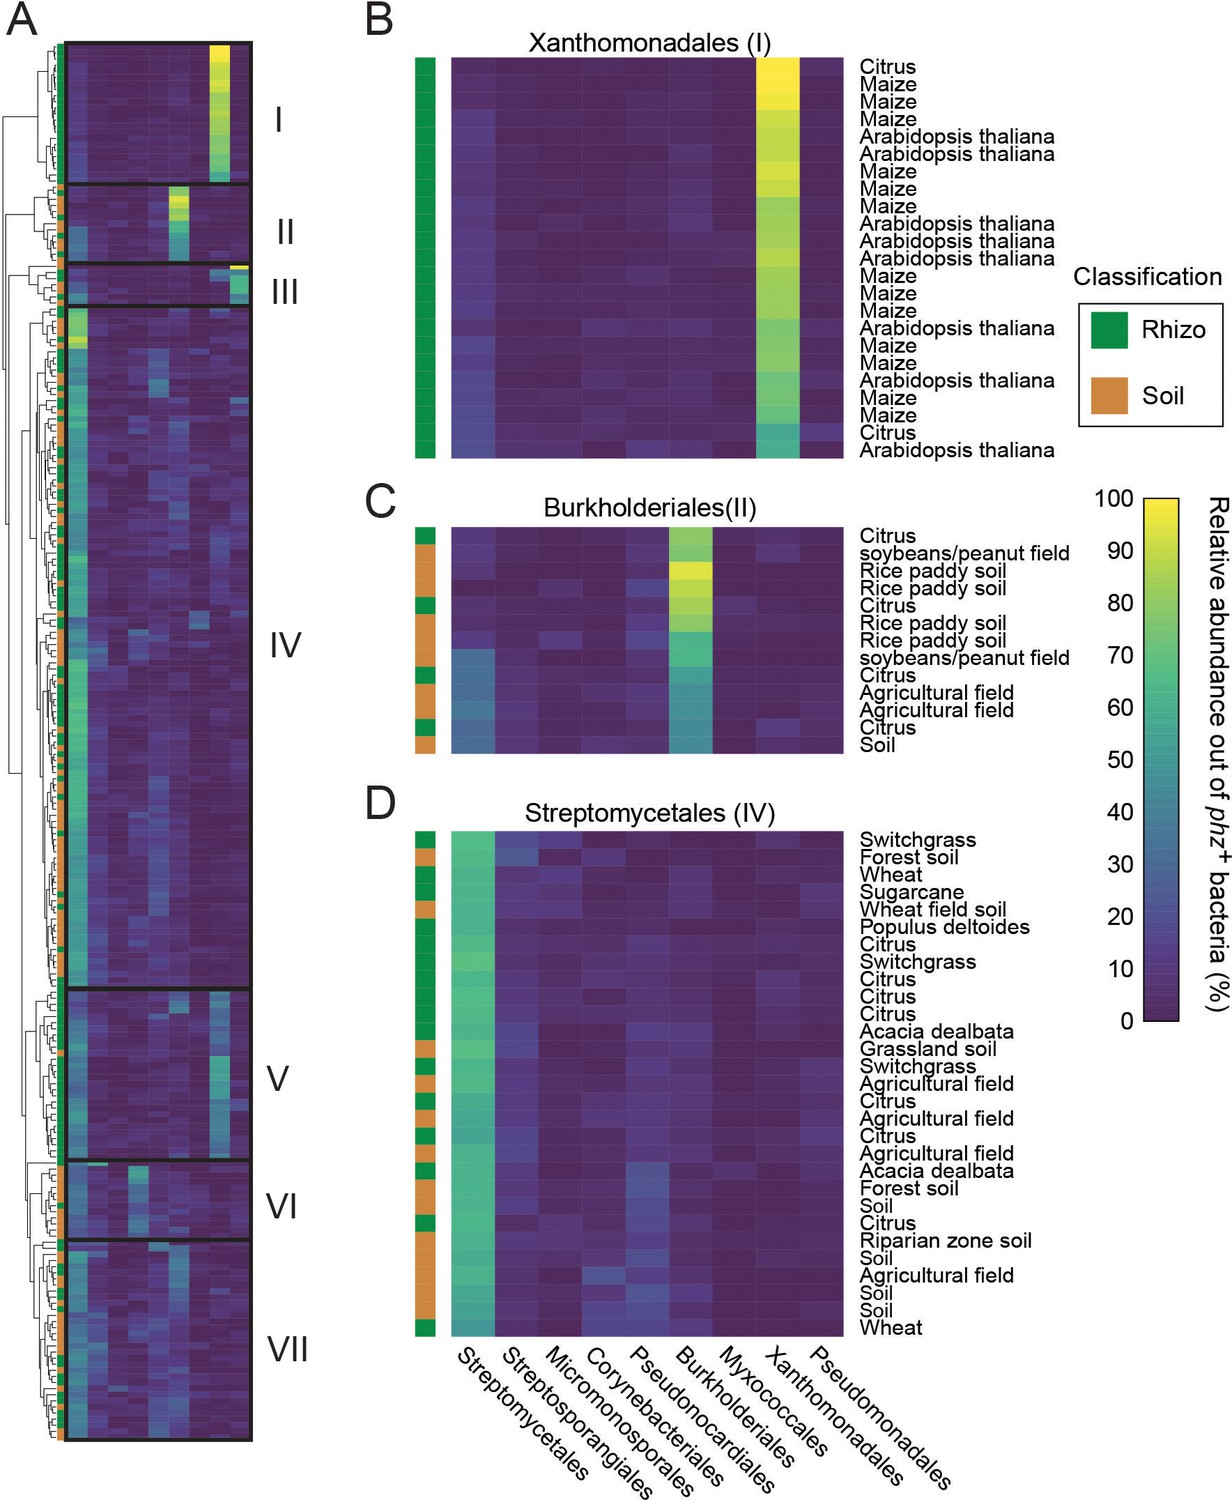
Taxonomic analysis of phz+ rich metagenomes.
(A) Clustered heatmap representing the relative abundance of different phz+ clades (columns) in samples containing at least 0.25% total phz+ bacteria (rows; n = 229). Color bar indicates abundance. On the left, the rows are color coded as either rhizosphere (green) or soil (brown). Seven main clusters are outlined and annotated as I-VII. (B–C) Representative sections of clusters I, II and IV. The text on the right describes the sample origin (e.g., maize, agricultural field, etc.).
Figure 4—figure supplement 3
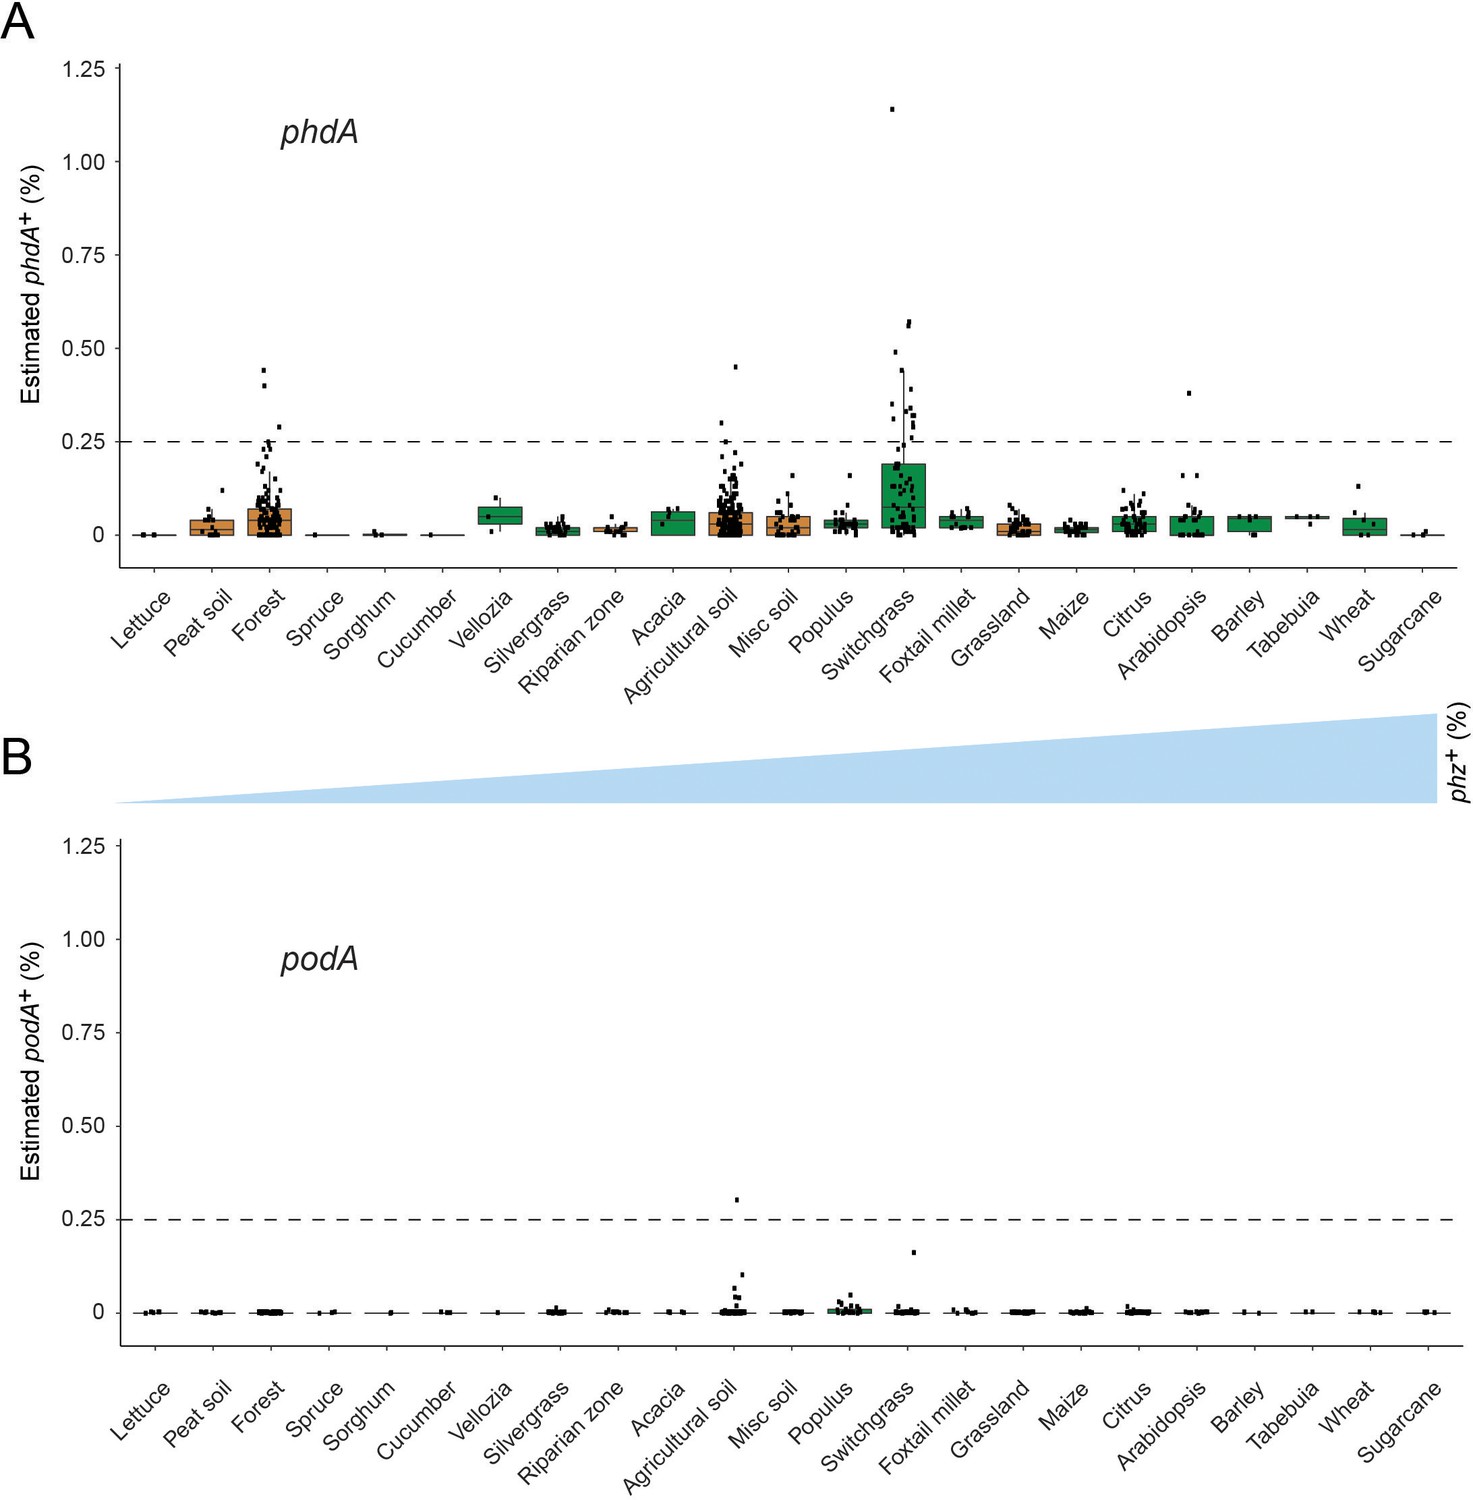
Phenazine biodegradation gene abundances per habitat.
(A–B) Distribution of phdA+ and podA+ bacteria levels per each habitat (percent of all bacteria). Soil and rhizosphere samples are depicted in brown and green, respectively. Each boxplot represents a different habitat as annotated in the x-axis. Boxplot central line shows the median and all samples are shown as black dots. Habitats are ranked by phz+ bacteria abundance as in Figure 4 and the phz+ levels are qualitatively depicted by the blue triangle between panels A and B.
Figure 5 with 2 supplements
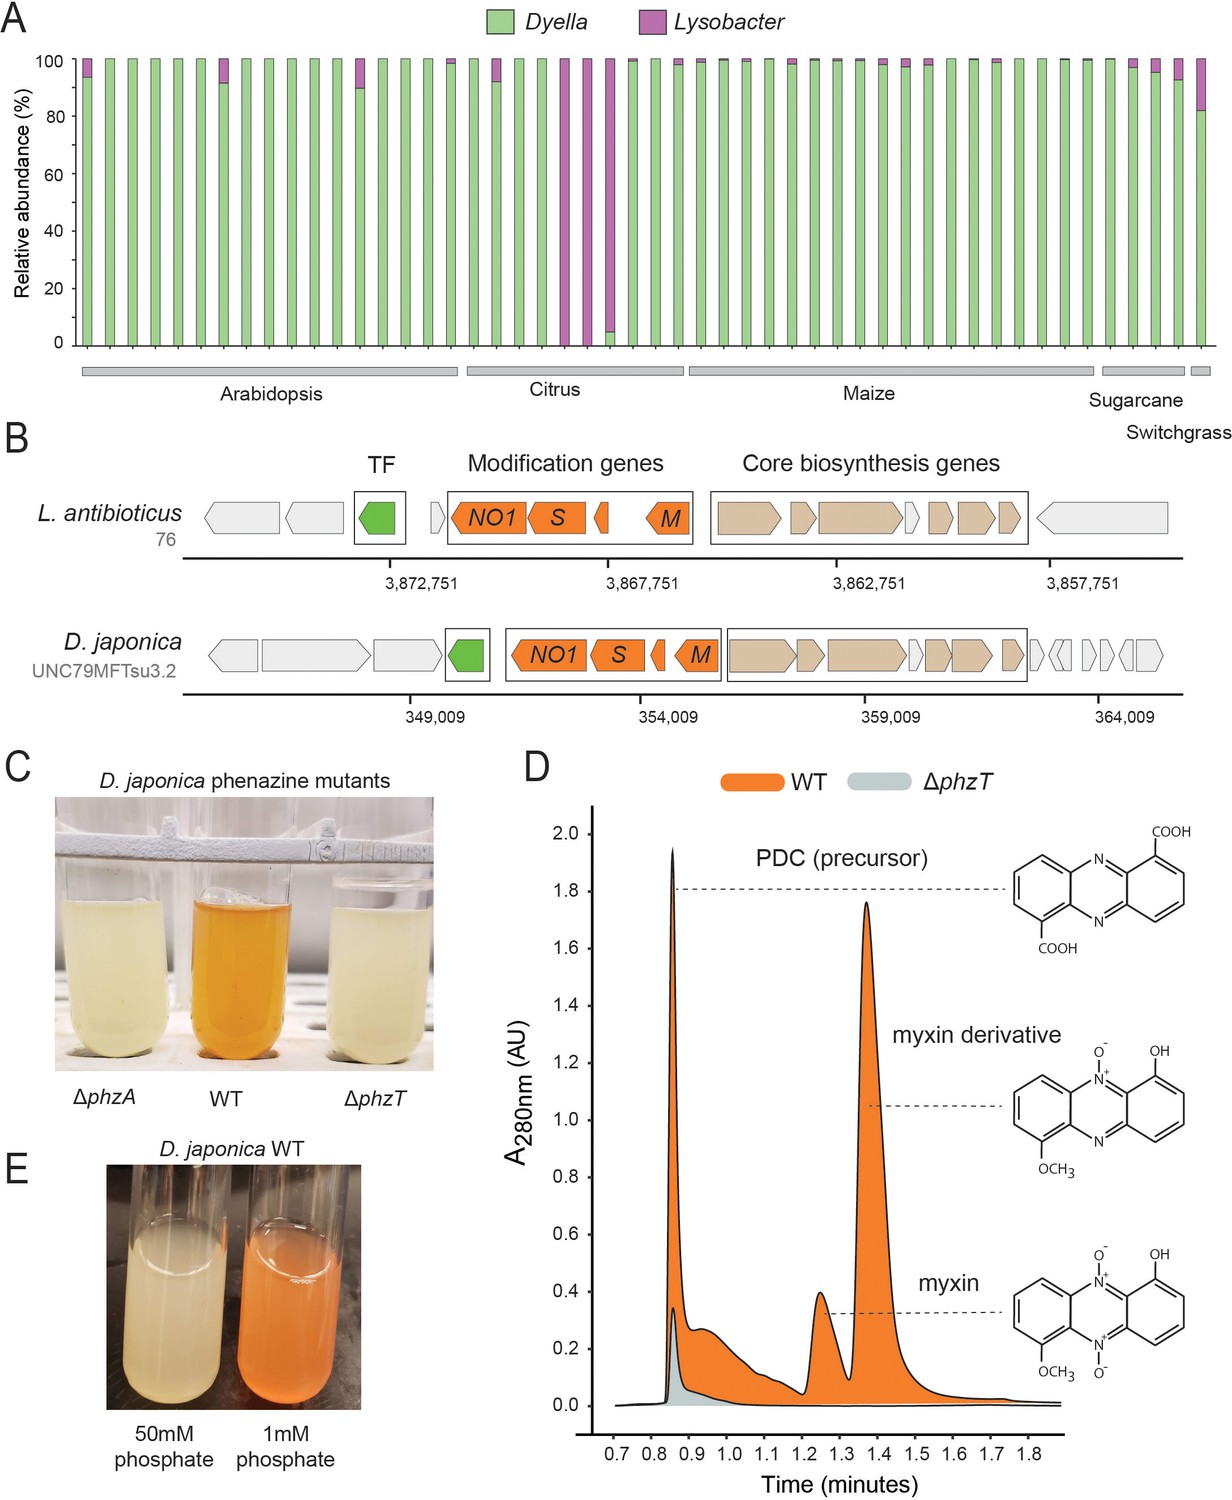
Phenazines produced by D. japonica.
(A) Relative abundance of Lysobacter and Dyella out of all Xanthomonadales in high phz+ samples (B) Genomic regions containing the core phenazine biosynthesis genes (tan) and phenazine modification genes (orange) in L. antibioticus and D. japonica. A conserved transcription factor (TF) is marked in green and all other genes shown in gray. (C) D. japonica ΔphzA, WT and ΔphzT culture tubes following 48 hr growth in minimal defined medium. (D) WT (orange) and ΔphzT (gray) spent-culture media LC-MS results showing UV absorbance at 280 nm. Detected phenazine structures are shown to the right with a dashed line indicating the position where their mass was detected. (E) WT D. japonica cultures grown for 24 hr in minimal defined media containing either 1 mM or 50 mM phosphate.
Figure 5—figure supplement 1
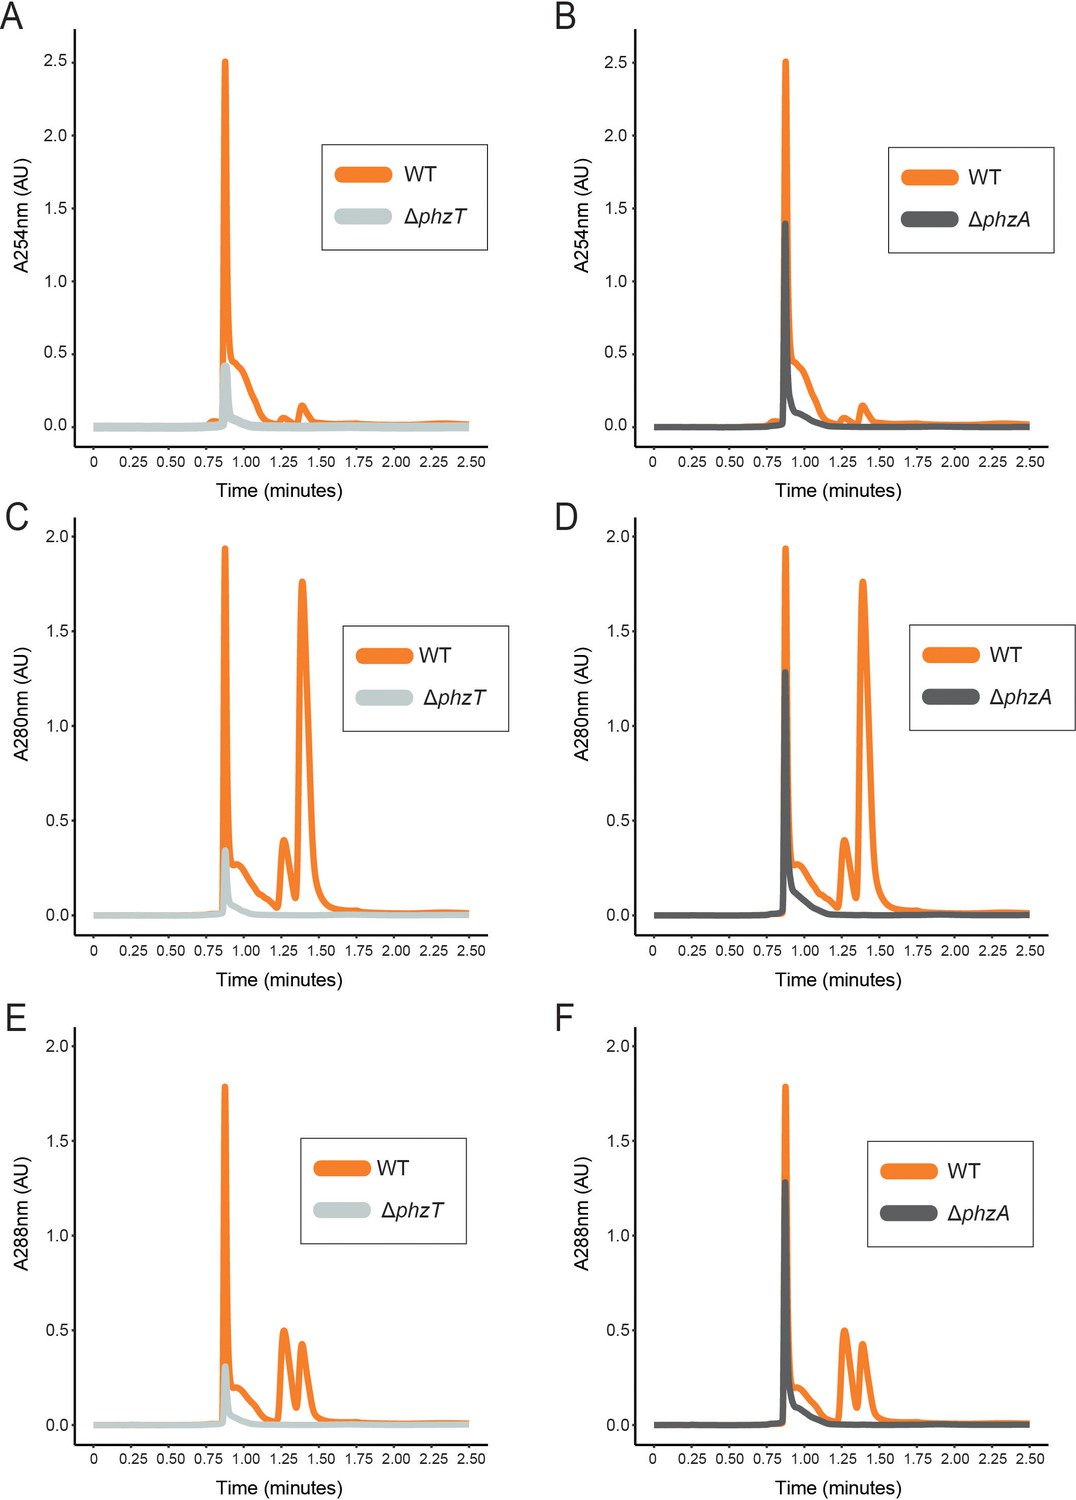
LC-MS UV-vis profiles in WT and mutant D. japonica cultures.
D japonica WT (orange), ΔphzT (gray) ΔphzA(dark gray) spent-culture media LC-MS results showing UV absorbance at 254 nm (A–B), 280 nm (C–D) and 288 nm (E–F).
Figure 5—figure supplement 2

LC-MS mass traces of specific phenazines in WT and mutant D. japonica.
Specific m/z intensity traces for PDC (A), myxin (B) and a myxin derivative, 1-Hydroxy-6-methoxyphenazine-N10-oxide (C) detected in D. japonica spent culture media. The molecular masses of the three phenazines are shown in the figure. Traces from WT and ΔphzT mutant cultures are shown in orange and gray, respectively.
Figure 6
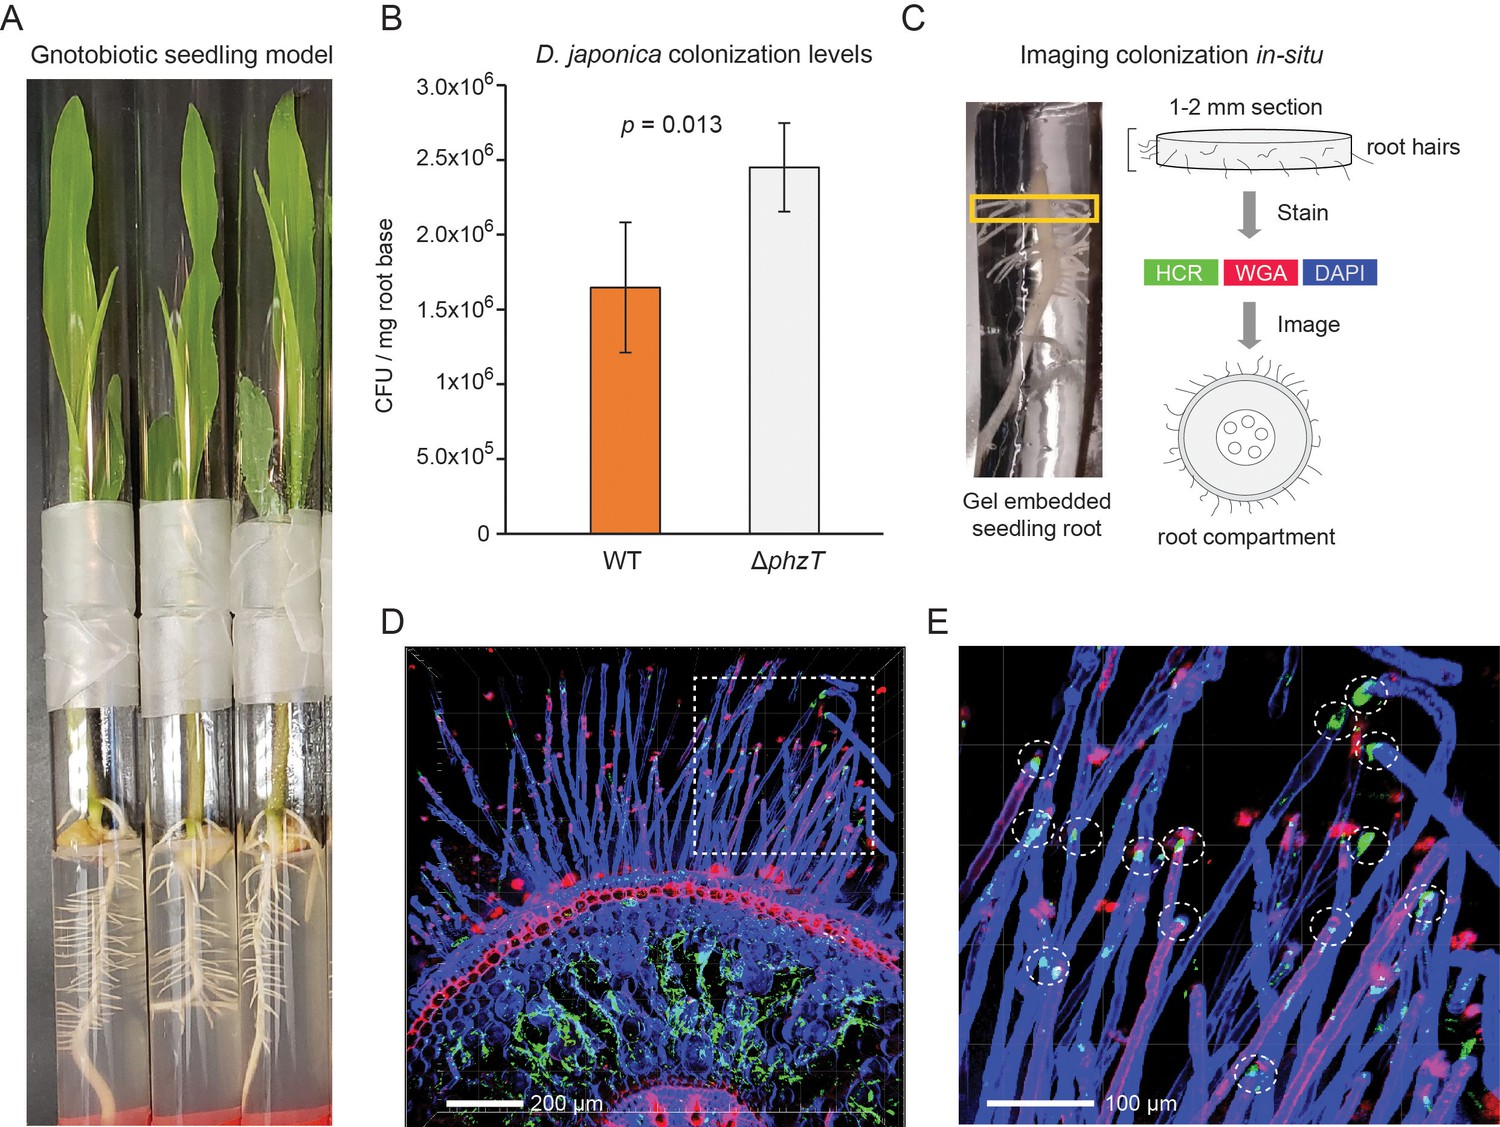
D. japonica maize seedling colonization.
(A) Example of 7-day-old maize seedlings grown in an agar-based gnotobiotic system inside two glass tubes connected by parafilm. (B) Colonization efficiency of D. japonica WT (orange) or ΔphzT (gray) in a mono-colonization assay (n = 5 for each genetic background). Error bars represent standard deviation. P-value for a two-tailed t-test comparison is shown in the panel. (C) Illustration of the sample preparation process for in situ imaging of bacterial colonization. Roots are encased in a stabilizing hydrogel and root-base sections are extracted and labeled before imaging. (D) Maximal-projection image depicting bacteria (green) and plant tissue via DAPI (blue) and WGA (red). (E) Zoom-in on the dashed box in panel D. Encircled are root hair tips colonized by bacteria (green patches).
Tables
Key resources table
| Reagent type (species) or resource | Designation | Source or reference | Identifiers | Additional information |
|---|---|---|---|---|
| Strain, strain background (Dyella japonica UNC79MFTsu3.2) | D. japonica WT | Levy et al., 2018 | Genome IMG ID: 2556921674 | WT |
| Strain, strain background (Dyella japonica UNC79MFTsu3.2 ΔphzA) | D. japonica ΔphzA | This paper | phzA deletion mutant | |
| Strain, strain background (Dyella japonica UNC79MFTsu3.2 ΔphzT) | D. japonica ΔphzT | This paper | phzT deletion mutant | |
| Recombinant DNA reagent | pMQ30 | Shanks et al., 2006 | GenBank: DQ230317.1 | Plasmid for generating deletions in D. japonica |
| Genetic reagent (Escherichia coli S17-1) | E. coli S17-1 | Simons et al., 1996 | ATCC 47055 | Mobilizing strain that carries the pMQ30 plasmid |
| Software, algorithm | DIAMOND v0.9.22.123 | Buchfink et al., 2015 | DIAMOND | Mapping translated reads to references |
| Software, algorithm | Trimmomatic v0.38 | Bolger et al., 2014 | Trimmomatic | Read quality control |
| Software, algorithm | fastq-dump v2.9.2 | NCBI | fastq-dump | Retrieve public metagenomes from SRA |
Additional files
-
Supplementary file 1
List of phenazine producer genomes and gene accessions used in study.
- https://cdn.elifesciences.org/articles/59726/elife-59726-supp1-v2.xlsx
-
Supplementary file 2
List of reference universal single-copy genes used in study.
- https://cdn.elifesciences.org/articles/59726/elife-59726-supp2-v2.xlsx
-
Supplementary file 3
List of species and genome accessions used to construct simulated metagenomes.
- https://cdn.elifesciences.org/articles/59726/elife-59726-supp3-v2.xlsx
-
Supplementary file 4
SRA sample information and analysis results.
Phenazine producer and degrader levels, along with relative abundance of specific taxonomic groups is included for each analyzed sample.
- https://cdn.elifesciences.org/articles/59726/elife-59726-supp4-v2.xlsx
-
Supplementary file 5
List of the oligos used in constructing the D. japonica mutant strains.
- https://cdn.elifesciences.org/articles/59726/elife-59726-supp5-v2.xlsx
-
Transparent reporting form
- https://cdn.elifesciences.org/articles/59726/elife-59726-transrepform-v2.pdf
Download links
A two-part list of links to download the article, or parts of the article, in various formats.
Downloads (link to download the article as PDF)
Open citations (links to open the citations from this article in various online reference manager services)
Cite this article (links to download the citations from this article in formats compatible with various reference manager tools)
Global landscape of phenazine biosynthesis and biodegradation reveals species-specific colonization patterns in agricultural soils and crop microbiomes
eLife 9:e59726.
https://doi.org/10.7554/eLife.59726


