Alpha-satellite RNA transcripts are repressed by centromere–nucleolus associations
- Whitehead Institute for Biomedical Research, United States
- Department of Biology, Massachusetts Institute of Technology, United States
- UC Santa Cruz Genomics Institute, University of California, Santa Cruz, United States
Figures
Figure 1 with 1 supplement
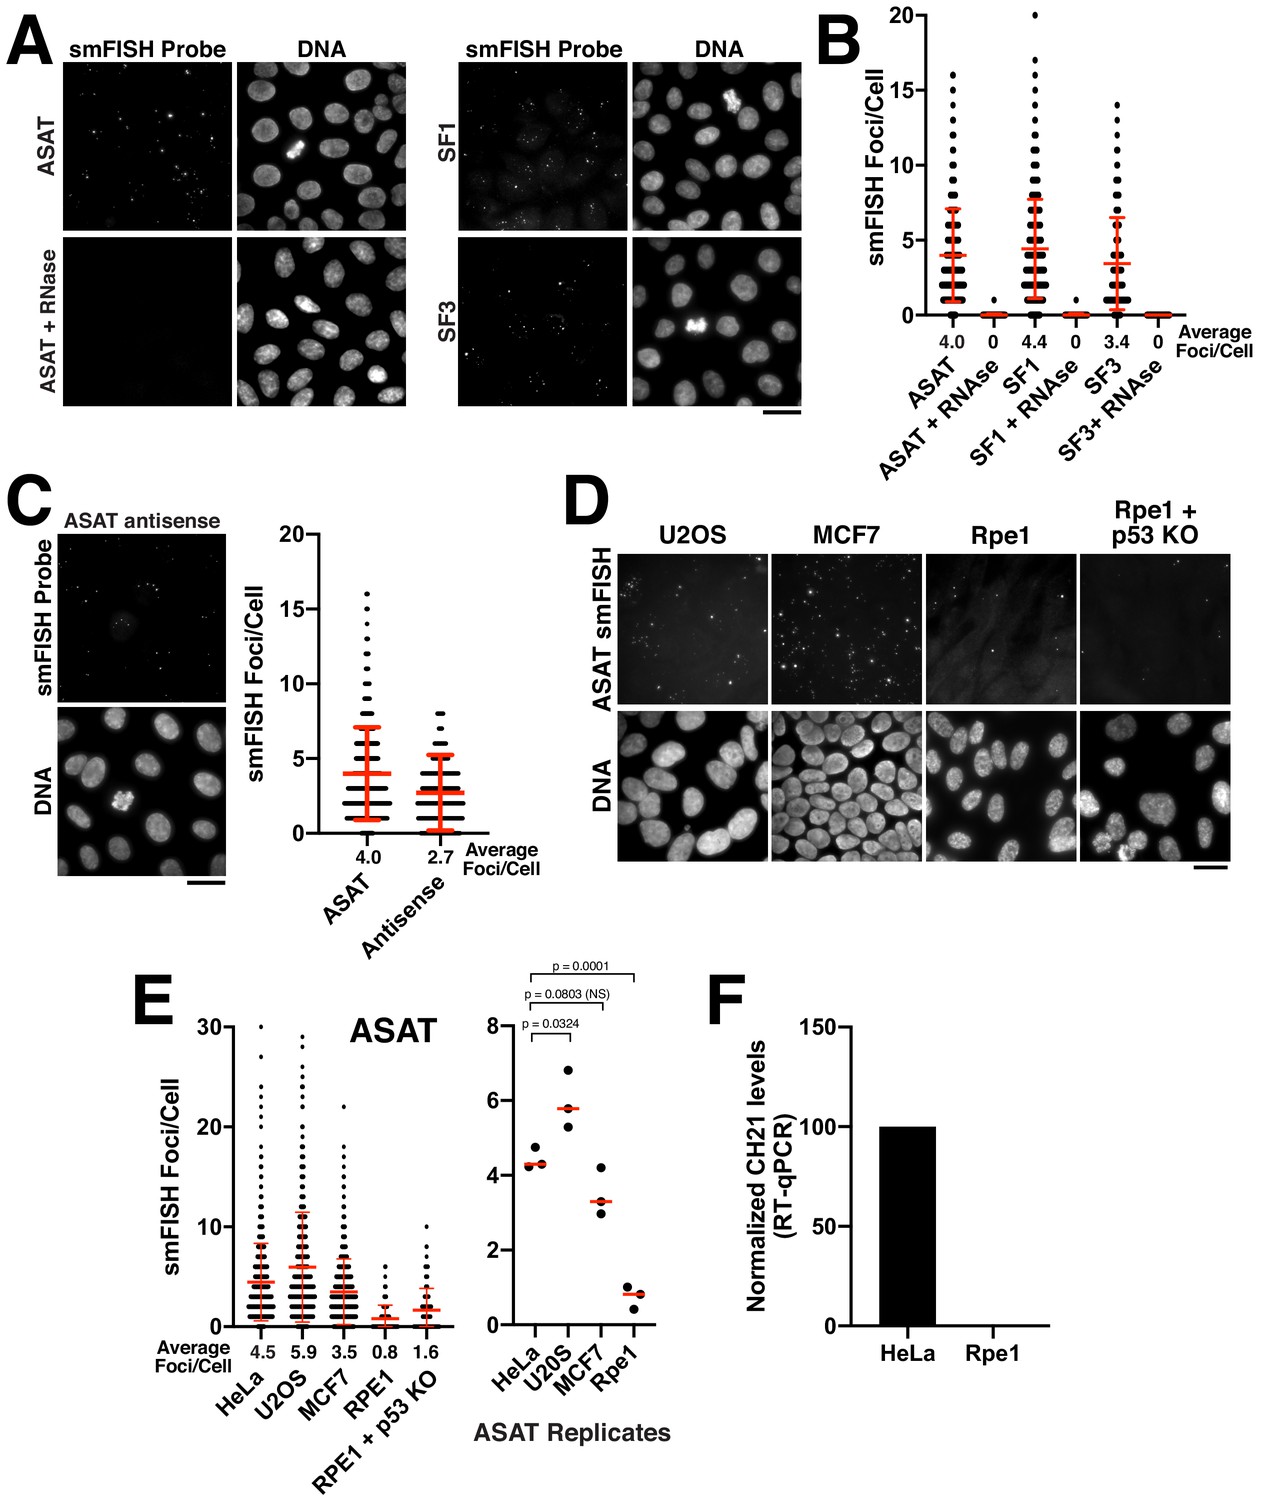
Quantitative detection of centromere RNAs using smFISH.
(A) Detection of alpha-satellite RNA transcripts by smFISH in asynchronous HeLa cells. Designed probes detected RNAs derived from centromeres across subsets of multiple chromosomes, but with distinct specificity (see Supplementary file 2; ASAT, SF1, and SF3 repeats). Treatment of cells with RNase A prior to hybridization diminished RNA-smFISH signals. (B) Quantification of smFISH foci in the presence or absence of RNase A treatment indicates that the signal observed is due to a ribonucleic source. Points represent the number of foci per cell for each cell test. Error bars represent the mean and standard deviation of at least 100 cells. (C) Detection of anti-sense alpha-satellite transcripts in HeLa cells for the ASAT smFISH probe sequences. Error bars represent the mean and standard deviation of at least 100 cells. (D) Images showing varying abundance of alpha-satellite RNA across cell lines (based on smFISH foci), with RPE-1 cells displaying overall lower levels of centromere smFISH foci. For the RPE-1 + p53 KO condition, p53 was eliminated using an established TP53 iKO cell line (McKinley and Cheeseman, 2017). (E) Left, quantification indicating the variation of smFISH foci across selected cell lines. Error bars represent the mean and standard deviation of at least 100 cells. Right, average smFISH foci/cell for multiple independent replicates to enable statistical comparisons. p-values represent T-tests conducted on replicates of smFISH foci numbers for each selected cell line. (F) Graph showing quantification of RT-qPCR for alpha-satellite transcripts from chromosome 21. Levels of chromosome 21 alpha-satellite RNAs was not detected in Rpe1 cells and was therefore set to 0 in the figure. The levels of alpha-satellite transcripts in RPE-1 cells are reduced compared to HeLa cells. A semi-quantitative assessment of the RT-PCR data (with no standard curve interpolation, see Figure 1—figure supplement 1D) indicated a ~ 20-fold reduction in alpha-satellite transcripts in RPE-1 cells relative to HeLa. We performed three biological replicates of the RT-qPCR. Scale bars, 25 µm.
-
Figure 1—source data 1
Source data for the RT-qPCR experiments shown in Figure 1F and Figure 1—figure supplement 1 – panel D.
- https://cdn.elifesciences.org/articles/59770/elife-59770-fig1-data1-v2.xlsx
Figure 1—figure supplement 1
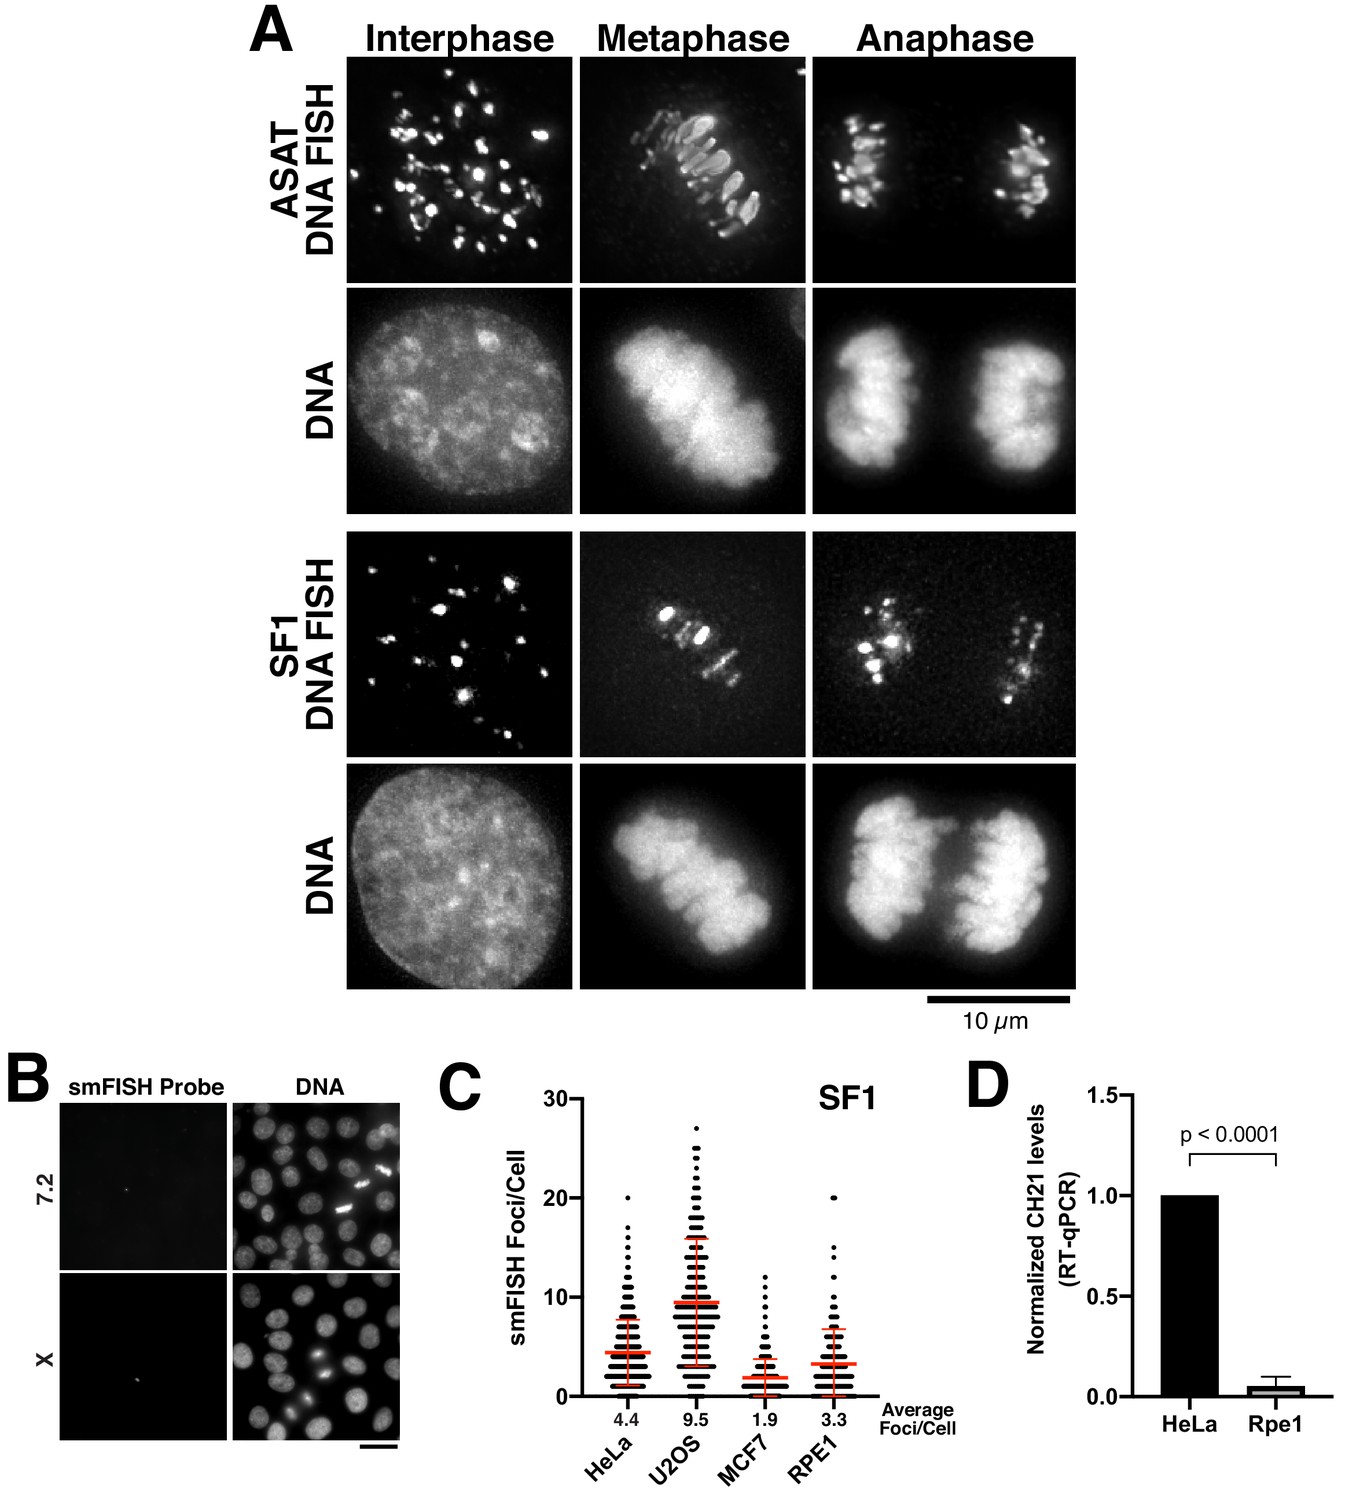
Centromere RNA levels vary across cell lines.
(A) DNA FISH showing multiple DNA-associated puncta that are distributed throughout the nucleus in interphase and align on the spindle on metaphase/anaphase chromosomes. Equivalent smFISH probes were used for a modified protocol to detect DNA. Scale bar, 10 µm. (B) RNA transcripts were not detected using smFISH probes designed against centromere sequences from chromosome seven and X. Scale bar, 25 µm. (C) Quantification indicating the variation of smFISH Foci across selected cell lines using probes designed against chromosome 3 (SF1). Error bars represent the mean and standard deviation of at least 100 cells. (D) Semi-quantitative assessment of alpha-satellite RNA levels derived from chromosome 21 by RT-PCR. Data from Figure 1F was re-analyzed so that we did not interpolate the data using a standard curve. The mean of 3 biological replicates was plotted and error bars represent standard deviation. P-value represents the results of a T-test.
Figure 2
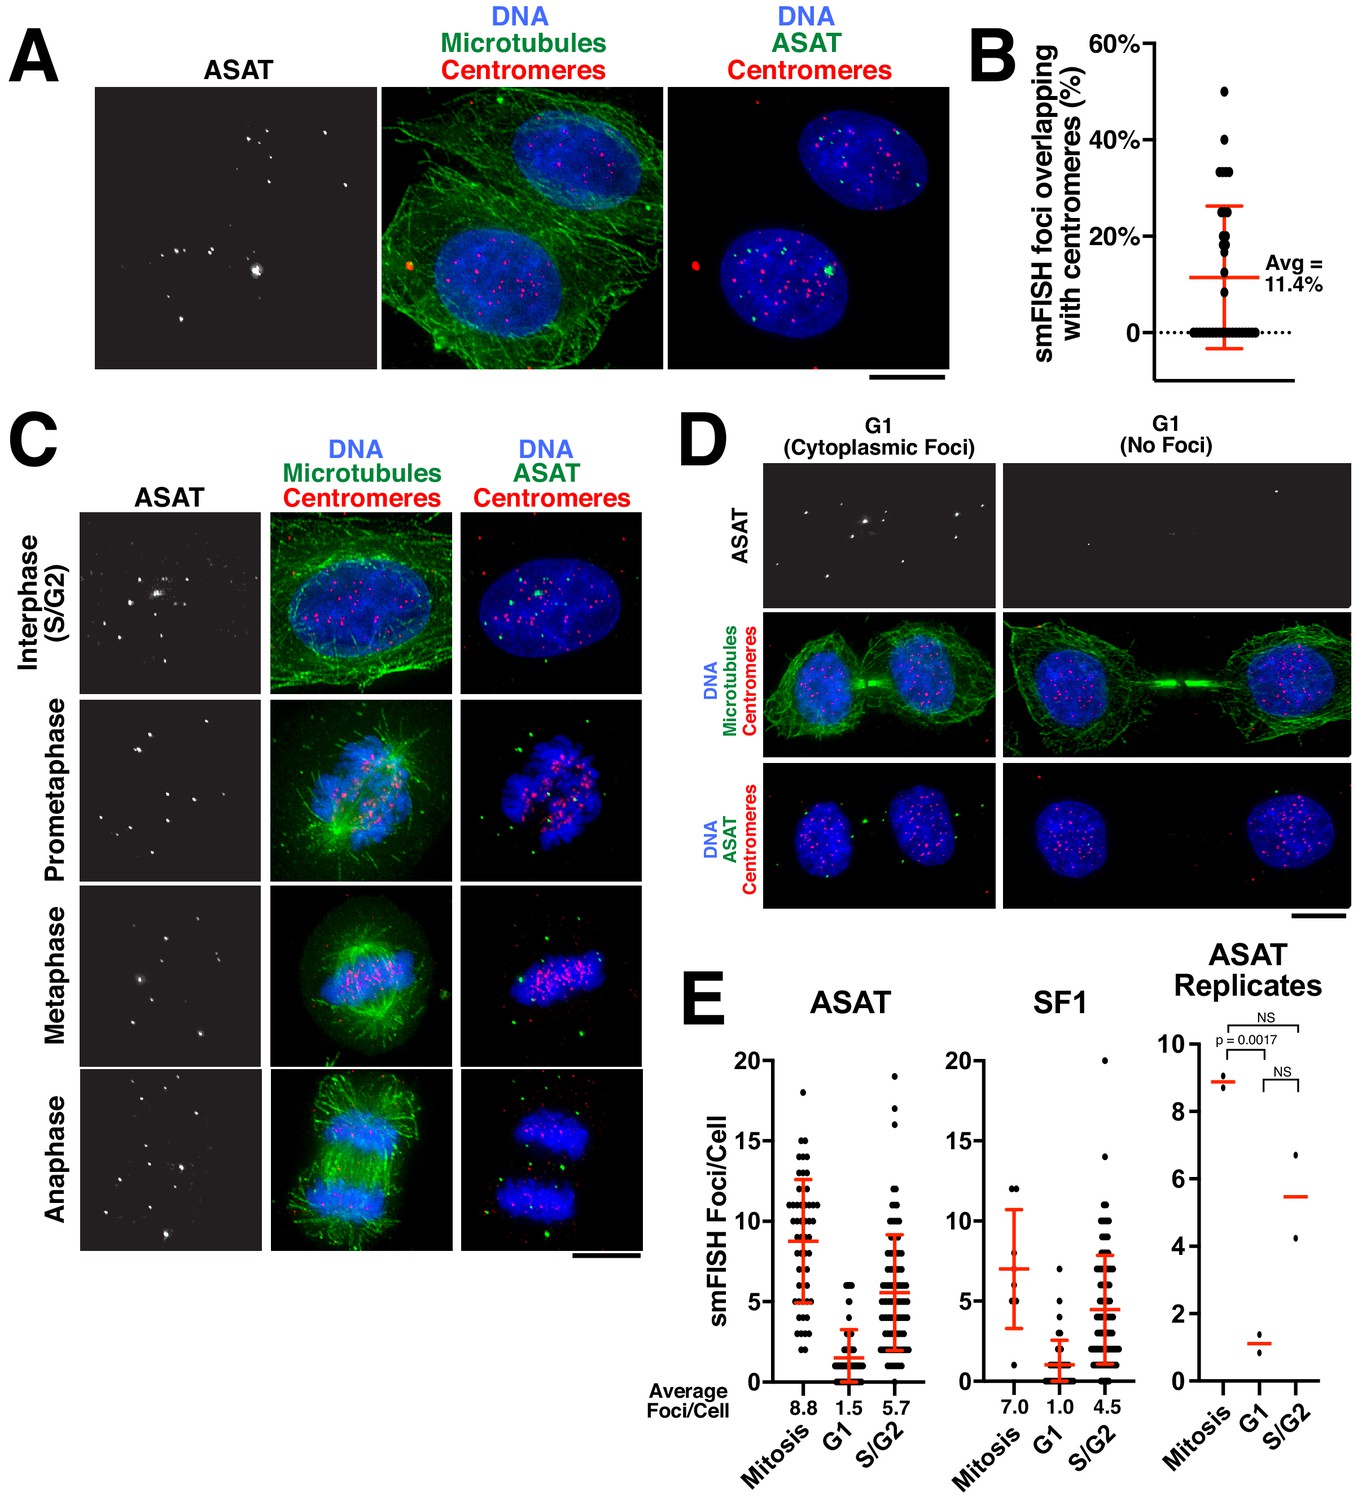
Analysis of centromere RNA foci across the cell cycle.
(A) Immunofluorescence images (using anti-tubulin antibodies in green and anti-centromere antibodies (ACA) in red) showing alpha-satellite derived transcripts (smFISH; ASAT probe sets) localized to the nucleus during interphase in HeLa cells. The majority of detected transcripts do not co-localize with centromeres. (B) Graph showing the fraction of ASAT smFISH foci that overlap with centromeres by immunofluorescence. Each point represents one cell. n = 36 cells. (C) Immunofluorescence of HeLa cells (as in A) throughout the cell cycle reveals smFISH foci are separable from chromatin in mitosis. (D) Immunofluorescence-smFISH analysis indicates that progression of cells into G1 (defined by cells with a mid-body) results in the nuclear exclusion of smFISH foci. Left: Foci are located in the cytoplasm after the nuclear envelope reforms. Right: Foci are absent, possibly reflecting the degradation of cytoplasmic RNA. (E) Quantification of smFISH foci throughout the cell cycle (for either ASAT or SF1 probe sets) reveals that transcripts levels are high in S/G2 and mitotic cells, but reduced as cells exit mitosis into G1. A T-test was conducted on independent replicates of the ASAT smFISH data for each selected cell-cycle state. Error bars represent the mean and standard deviation of at least 8 cells/replicate. Scale bars, 10 µm.
Figure 3 with 1 supplement
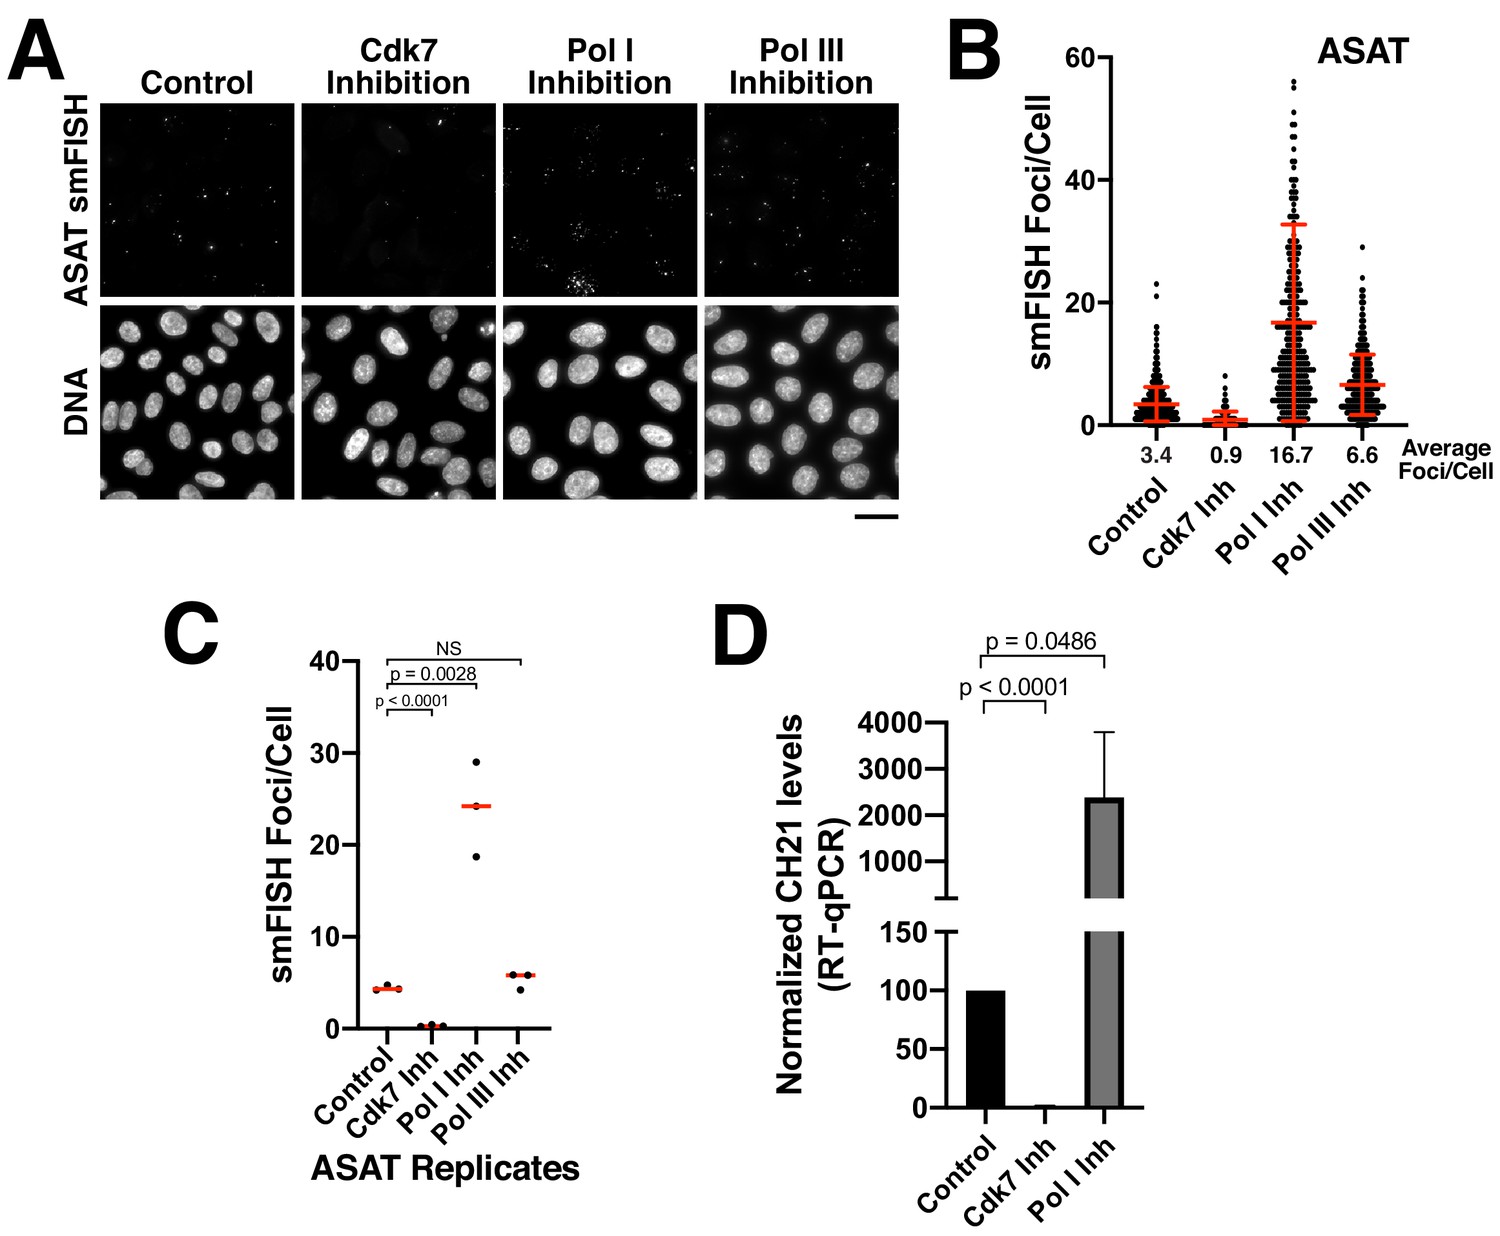
Alpha-satellite RNAs are products of Pol II-mediated transcription.
(A) Treatment of HeLa cells with small-molecule inhibitors reveals that alpha-satellite transcripts are mediated by RNA polymerase II. Cells were treated with the RNA Polymerase I inhibitor BMH-21 (24 hr), the RNA Polymerase III inhibitor ML-60218 (24 hr), or the Cdk7 inhibitor THZ1 (5 hr), which inhibits RNA Polymerase II initiation. Transcripts were identified using the ASAT smFISH probe set. (B) Quantification of smFISH foci from (A) after treatment of HeLa cells with small-molecule inhibitors against Cdk7, RNA Pol I, and RNA Pol III. smFISH foci were substantially reduced after inhibition of RNA Pol II activator, Cdk7, but increased by RNA Pol I inhibition. Error bars represent the mean and standard deviation of at least 240 cells. (C) Graph showing independent replicates of ASAT smFISH foci for each small-molecule inhibitor treatment (Cdk7, RNA Pol I, and RNA Pol III). P-values represent T-tests for the indicated comparisons. (D) RT-qPCR quantification reveals significantly reduced levels of chromosome 21 alpha-satellite transcripts of cells treated by the Cdk7 inhibitor THZ1 for 5 hr, but increased levels following RNA polymerase I inhibition (24 hr treatment) when compared to control HeLa cells. The levels of alpha-satellite RNA from chromosome 21 detected was outside of our quantifiable range in cells treated with CDK7 inhibitor and thus was set to 0. The mean of 3 biological replicates was plotted and error bars represent the standard deviation. P-value represents the results of a T-test.
-
Figure 3—source data 1
Source data for the RT-qPCR experiments shown in Figure 3D.
- https://cdn.elifesciences.org/articles/59770/elife-59770-fig3-data1-v2.xlsx
Figure 3—figure supplement 1
Analysis of centromere RNAs following RNA polymerase inhibition.
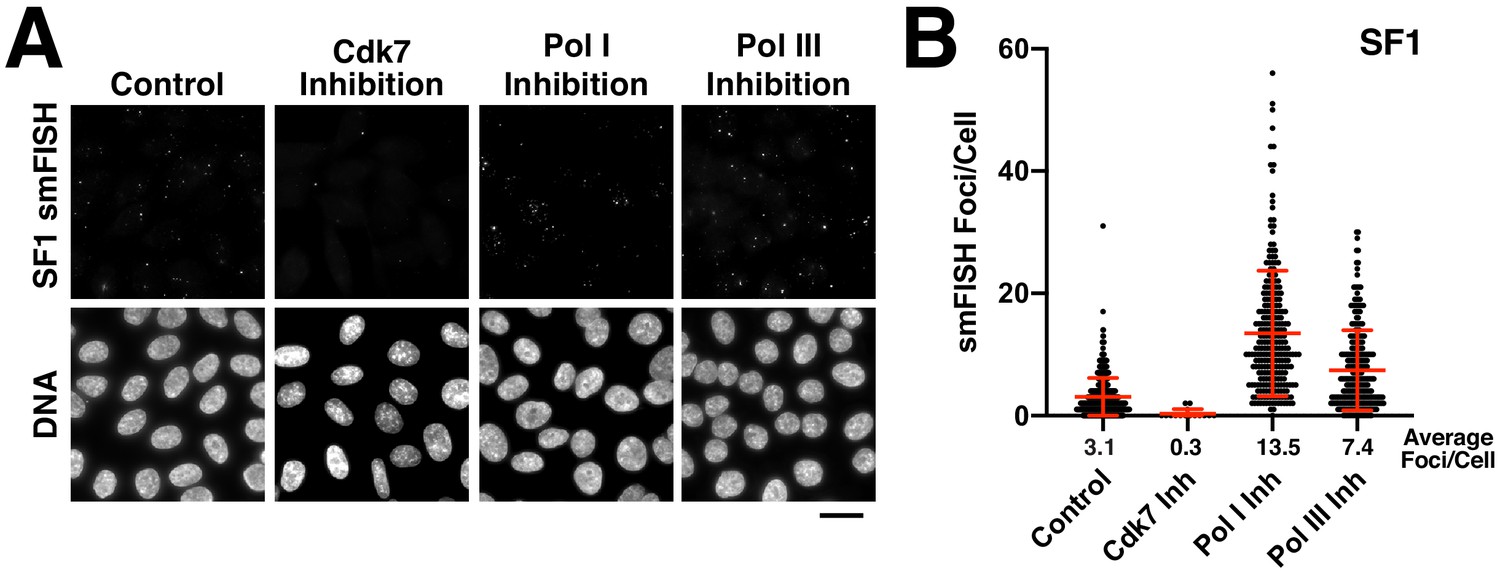
(A) Treatment of HeLa cells with small-molecule inhibitors against each polymerase reveals that alpha-satellite transcripts are mediated by RNA polymerase II (24 hr treatment for the RNA Polymerase I and III inhibitors, 5 hr treatment for the Cdk7 inhibitor). This experiment was conducted as in Figure 3A,B, but transcripts were detected with probe set designed against super-chromosomal family one sequences (SF1). (B) Quantification of smFISH foci from (A) after treatment of HeLa cells with small-molecule inhibitors against Cdk7, RNA Pol I and RNA Pol III. When compared to controls, the number of smFISH foci was substantially reduced after inhibition of RNA Pol II activator, Cdk7. Error bars represent the mean and standard deviation of at least 240 cells. Scale bar, 25 µm.
Figure 4 with 1 supplement
Eliminating CENP-C results in substantially increased alpha-satellite transcript numbers.
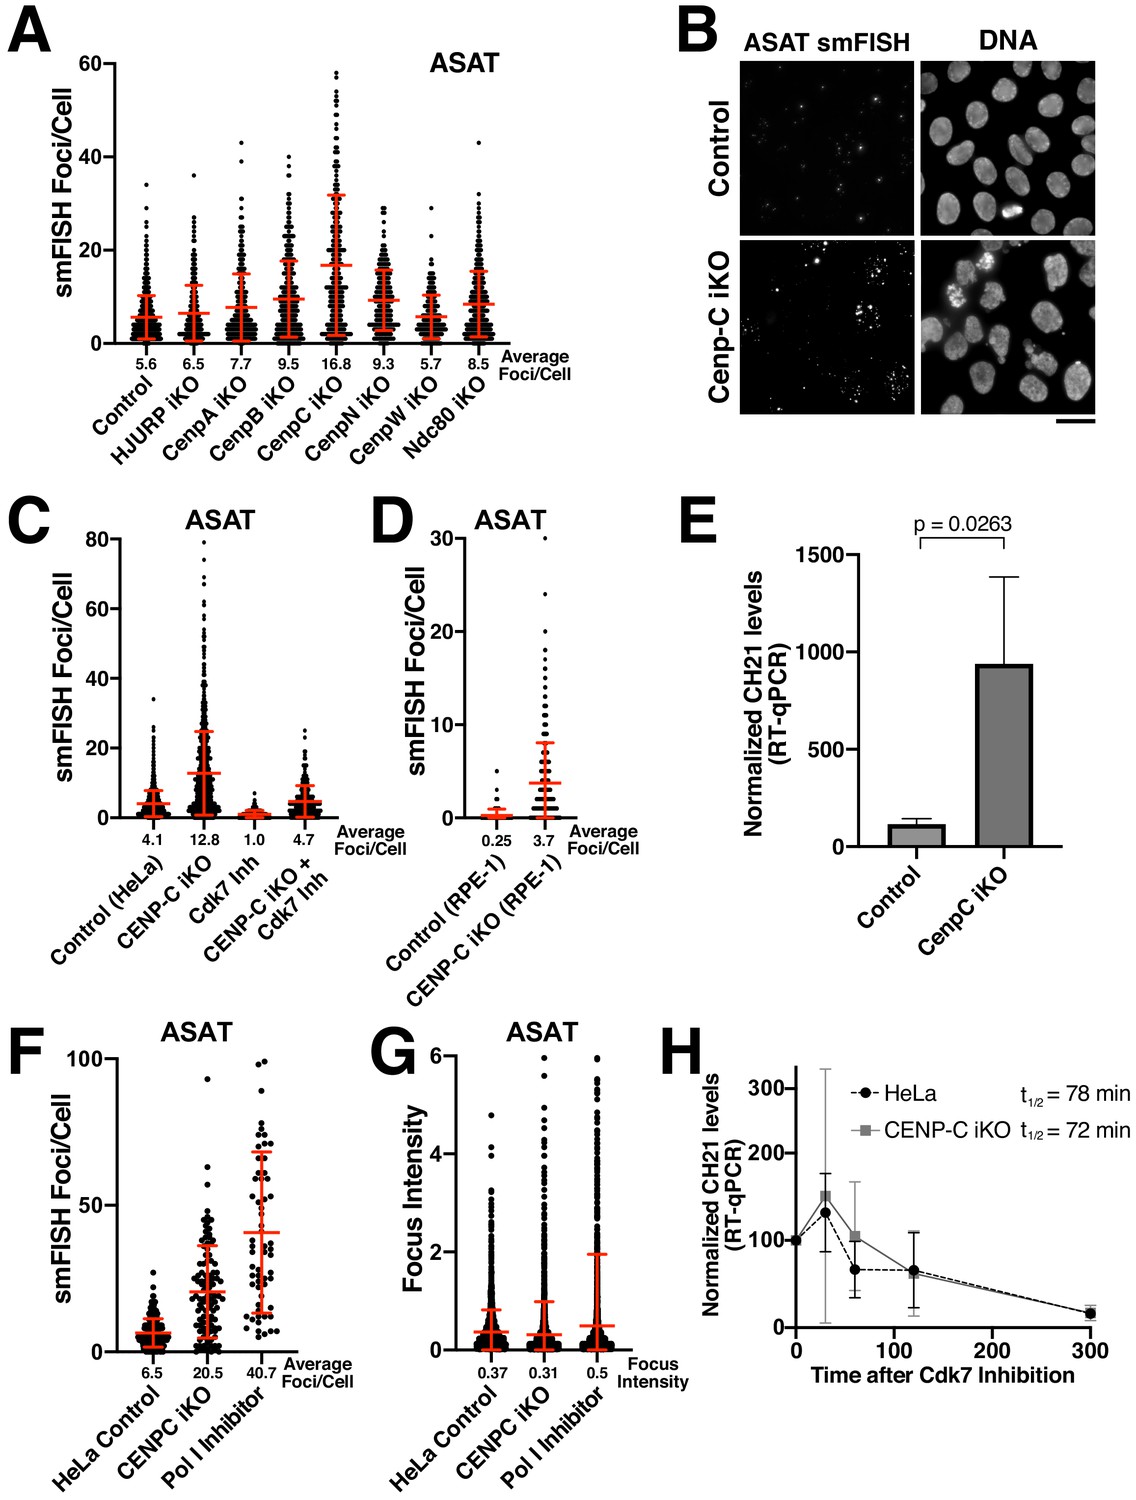
(A) Quantification of smFISH foci (ASAT probe set) after elimination of selected centromere and kinetochore components reveals that centromere components are not required for the production of alpha-satellite transcripts. Inducible knockouts were generated using Cas9 using previously described cell lines (McKinley and Cheeseman, 2017; McKinley et al., 2015). Notably, inducible knockout of CENP-C results in a substantial increase in smFISH foci. Error bars represent the mean and standard deviation of at least 240 cells. (B) Representative images showing the substantial increase in smFISH foci after elimination of the centromere component CENP-C. (C) Quantification of ASAT smFISH foci under the indicated conditions. The increase in alpha-satellite transcripts in cells depleted for CENP-C depends on RNA Polymerase II, as THZ1 treatment (Cdk7 inhibition; 5 hr) resulted in a substantial reduction in smFISH foci in both control cells and CENP-C inducible knockout cells. (D) Quantification of smFISH foci in CENP-C inducible knockout RPE-1 cells reveals that the increase in alpha-satellite transcripts following CENP-C knockout is not specific to HeLa cells. Error bars represent the mean and standard deviation of at least 170 cells. (E) RT-qPCR for alpha-satellite transcripts from chromosome 21 indicates a substantial increase in steady state alpha-satellite RNA levels in HeLa CENP-C inducible knockout cells. The mean of three biological replicates for control and four biological replicates for the CENP-C inducible knockouts was plotted. Error bars represent the standard deviation. P-value represents the results of a T-test. (F) Quantification of smFISH foci number in CENP-C inducible KO cells and Pol I-inhibited (24 hr treatment) cells compared to HeLa cell controls. (G) Quantification of the intensity of individual smFISH foci from the same experiment tested in F showing similar intensities despite the increase in foci number. (H) The half-life of alpha-satellite RNAs derived from chromosome 21 was determined in HeLa and CENP-C inducible knockout cells by RT-qPCR various times following RNA polymerase II inhibition (THZ1 treatment). The level of chromosome 21 alpha-satellite RNA was normalized to GAPDH, a stable mRNA. The half-life of these centromeric transcripts is 78 and 72 min in HeLa and CENP-C inducible knockout cells, respectively. Graph shows mean and standard deviation for two biological replicates. Scale bars, 25 µm.
-
Figure 4—source data 1
Source data for the RT-qPCR experiments shown in Figure 4D and H.
- https://cdn.elifesciences.org/articles/59770/elife-59770-fig4-data1-v2.xlsx
Figure 4—figure supplement 1
Analysis of alpha-satellite transcripts following disruption of cell division factors.
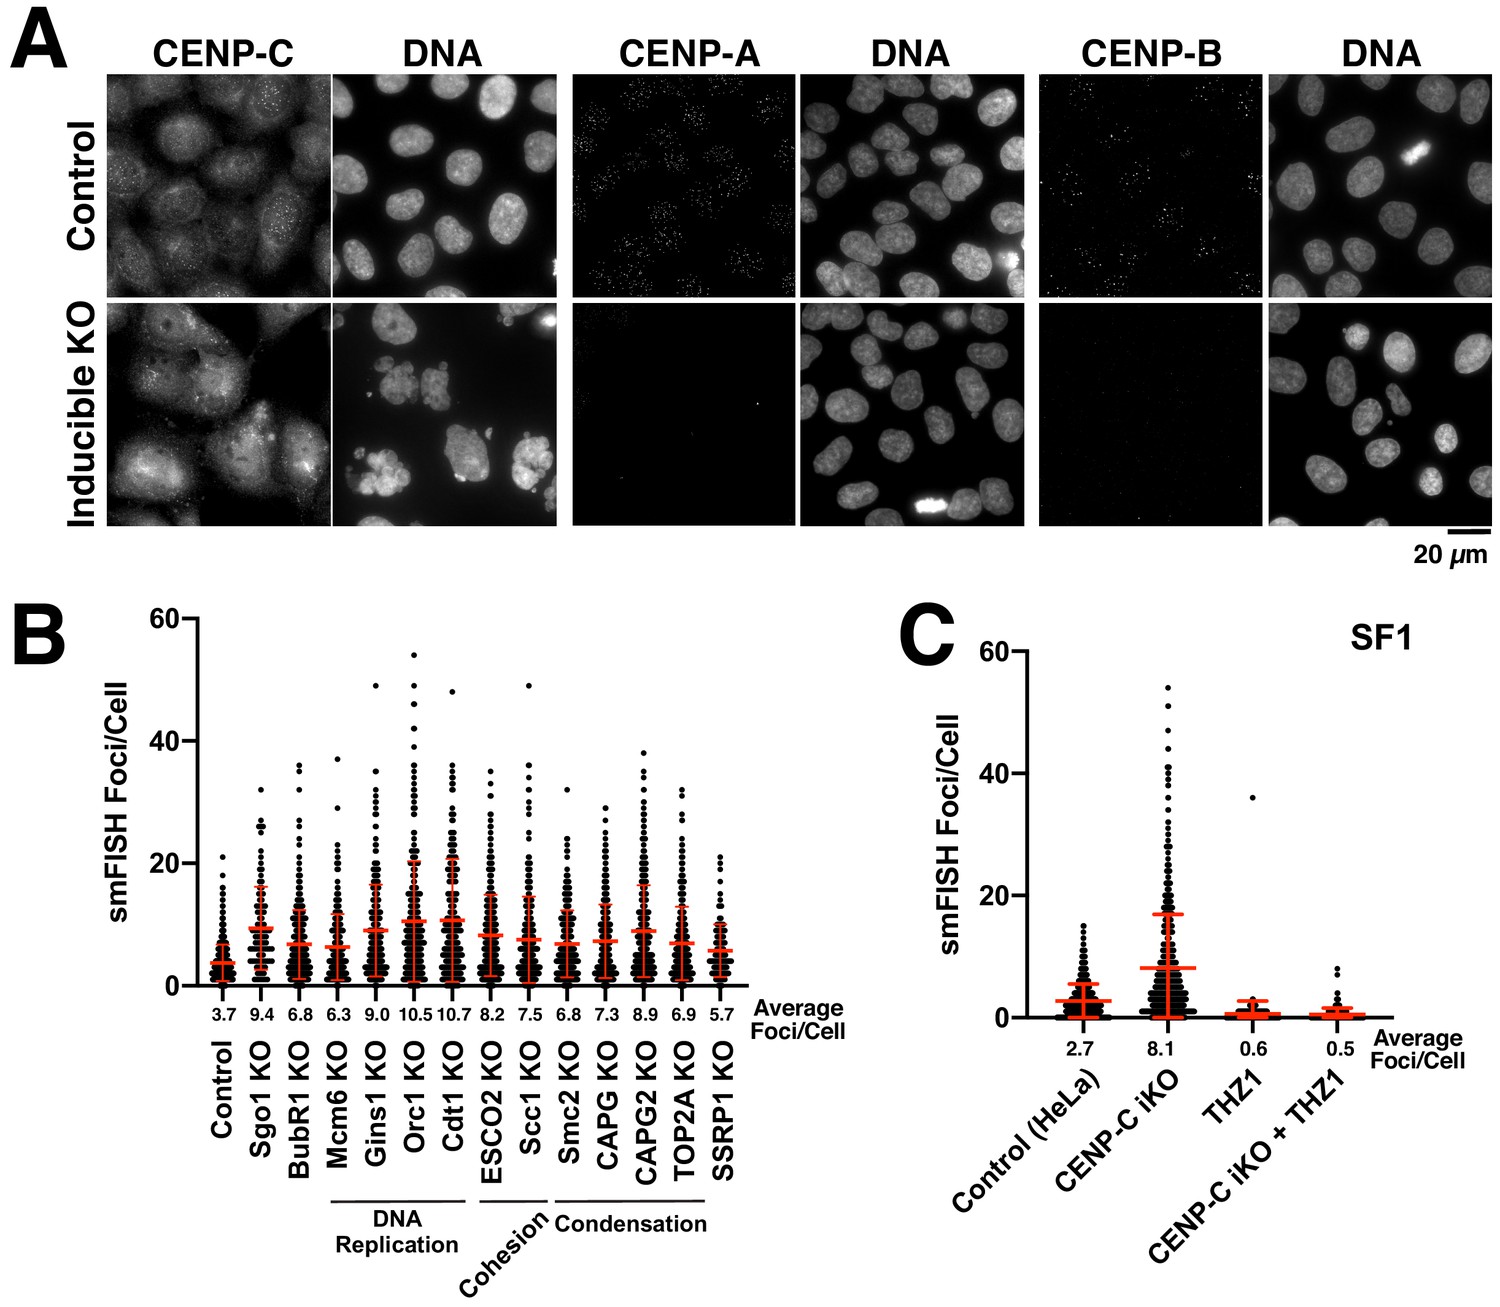
(A) Immunofluorescence images (using anti-CENP-C, anti-CENP-A and anti-CENP-B antibodies) confirming the effective elimination of the corresponding gene targets throughout the population. Control cells (top) and inducible knockout cells (bottom). Scale bar, 20 µm. (B) Analysis of alpha-satellite smFISH transcripts (ASAT probe set) for cells depleted for diverse cell division components; proteins involved in centromere regulation (Sgo1 and BubR1), DNA replication (Mcm6, Gins1, Orc1, and Cdt1), sister chromatid cohesion (ESCO2, Scc1), chromosome condensation (Smc2, CAPG, CAPG2, TOP2A), and nucleosome remodeling (SSRP1) were targeted using Cas9. Despite the diverse roles of these proteins in different aspects of centromere function, none of these inducible knockouts resulted in reduced levels of ASAT alpha-satellite transcripts as detected by smFISH analysis. Error bars represent the mean and standard deviation of at least 240 cells. (C) The increase in alpha-satellite transcripts in cells depleted for CENP-C depends on RNA Polymerase II as THZ1 treatment resulted in a substantial reduction in smFISH foci in both control cells and CENP-C inducible knockout cells using SF1 probes.
Figure 5 with 1 supplement
The nucleolus represses centromere RNA production.
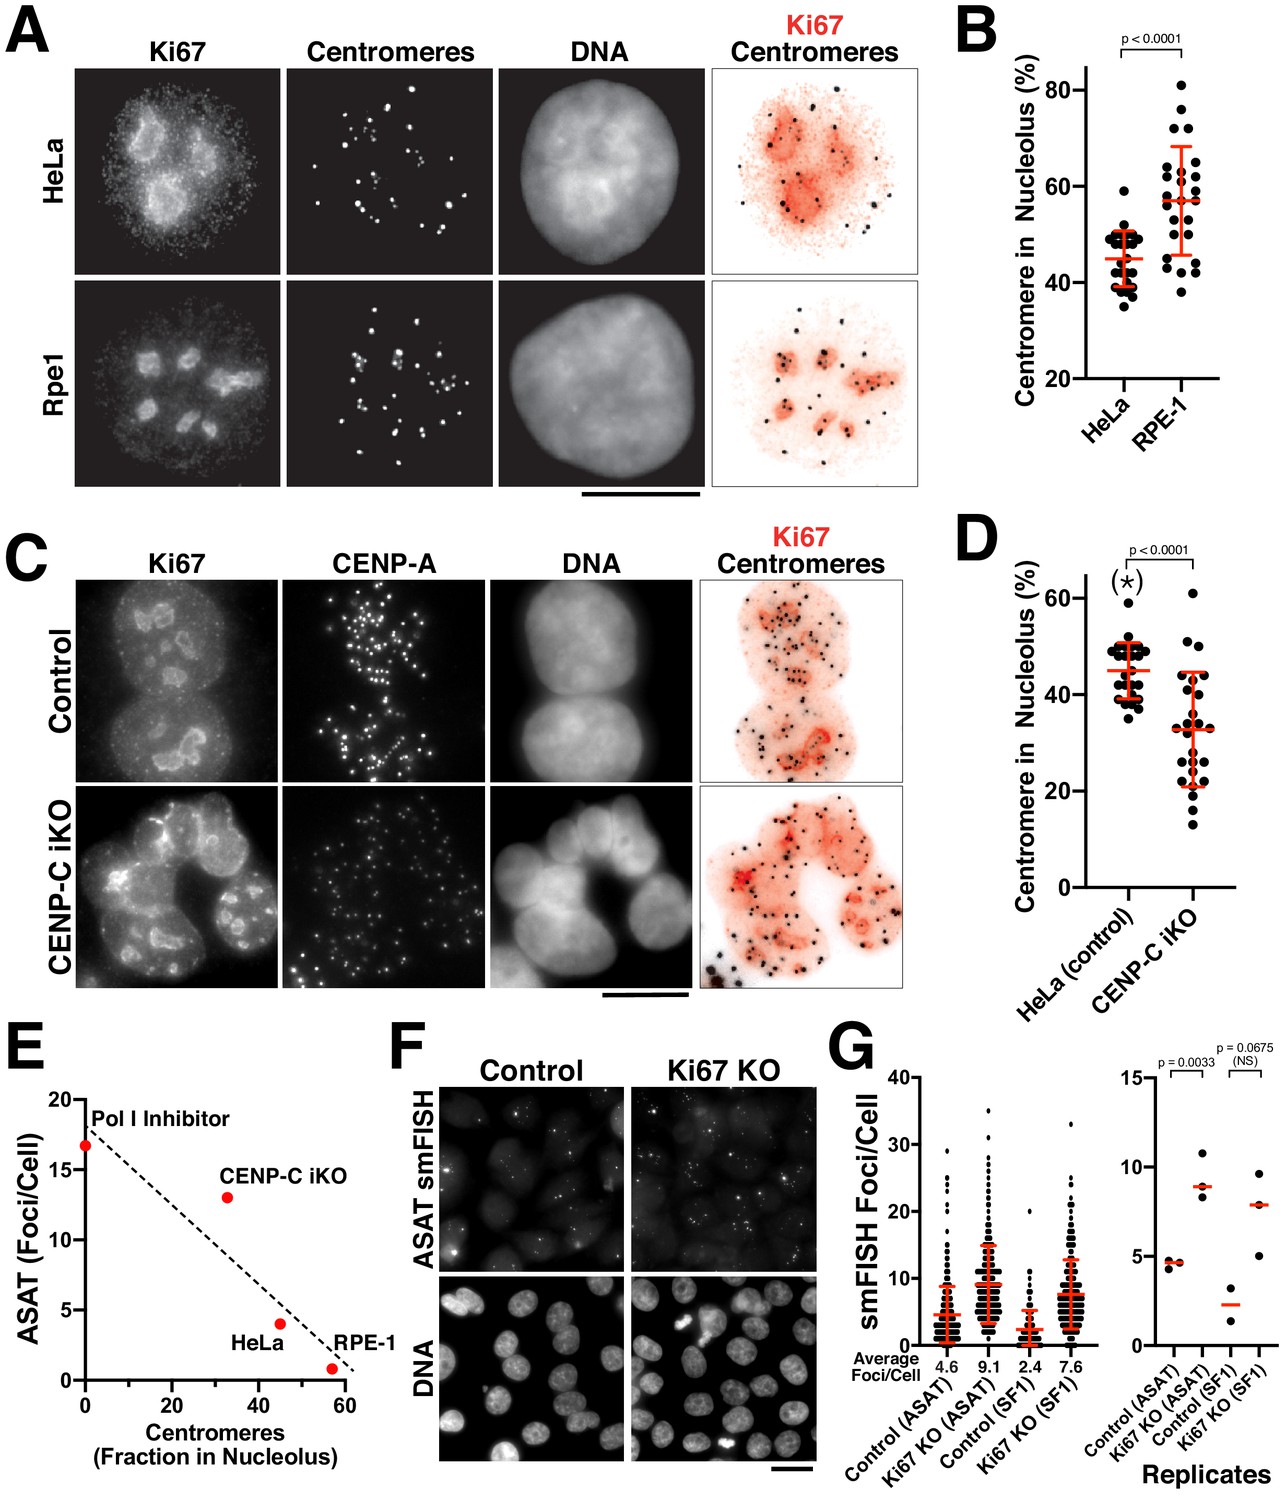
(A) Immunofluorescence of HeLa (Top) and RPE1 (Bottom) cells showing the colocalization of centromeres with the nucleolus, as marked with antibodies against Ki-67 and anti-centromere antibodies (ACA). Scale bars, 10 µm. (B) Quantification reveals RPE1 cells have a greater fraction of centromeres that overlap with nucleoli (57%) compared to HeLa cells (44.6%). Error bars represent the mean and standard deviation of 25 cells. (C) Immunofluorescence of HeLa control (top) and HeLa CENP-C iKO (bottom) cells showing the colocalization of centromeres with the nucleolus, as marked with antibodies against Ki-67 and CENP-A. Scale bar, 10 µm. (D) Quantification reveals that depletion of CENP-C results in a reduced fraction of nucleoli-localized centromeres (32.8%) compared to control cells (44.6%). The asterisk indicates that the data from control cells is repeated from (B). Error bars represent the mean and standard deviation of 25 cells. (E) Graph showing the relationship between the number of ASAT smFISH foci (summarized from data in Figures 1–4) and the fraction of nucleolar-localized centromeres in the indicated conditions. RNA Polymerase I inhibition should eliminate nucleolar function, and so is listed as ‘0’ for nucleolar centromeres. Dashed line shows a linear fit trendline. (F) smFISH analysis reveals an increase of alpha-satellite transcripts in Ki67 knockout cells (right) when compared to control (left). Scale bar, 25 µm. (G) Quantification reveals a 2–3 fold increase in alpha-satellite transcript levels for both the ASAT and SF1 smFISH probes in Ki67 stable knockout cells. Error bars represent the mean and standard deviation of at least 100 cells. Right, graph showing replicates of the indicated data. P-values indicate T-tests for ASAT and SF1 replicates for Ki67 knockout cells compared to the corresponding control.
Figure 5—figure supplement 1
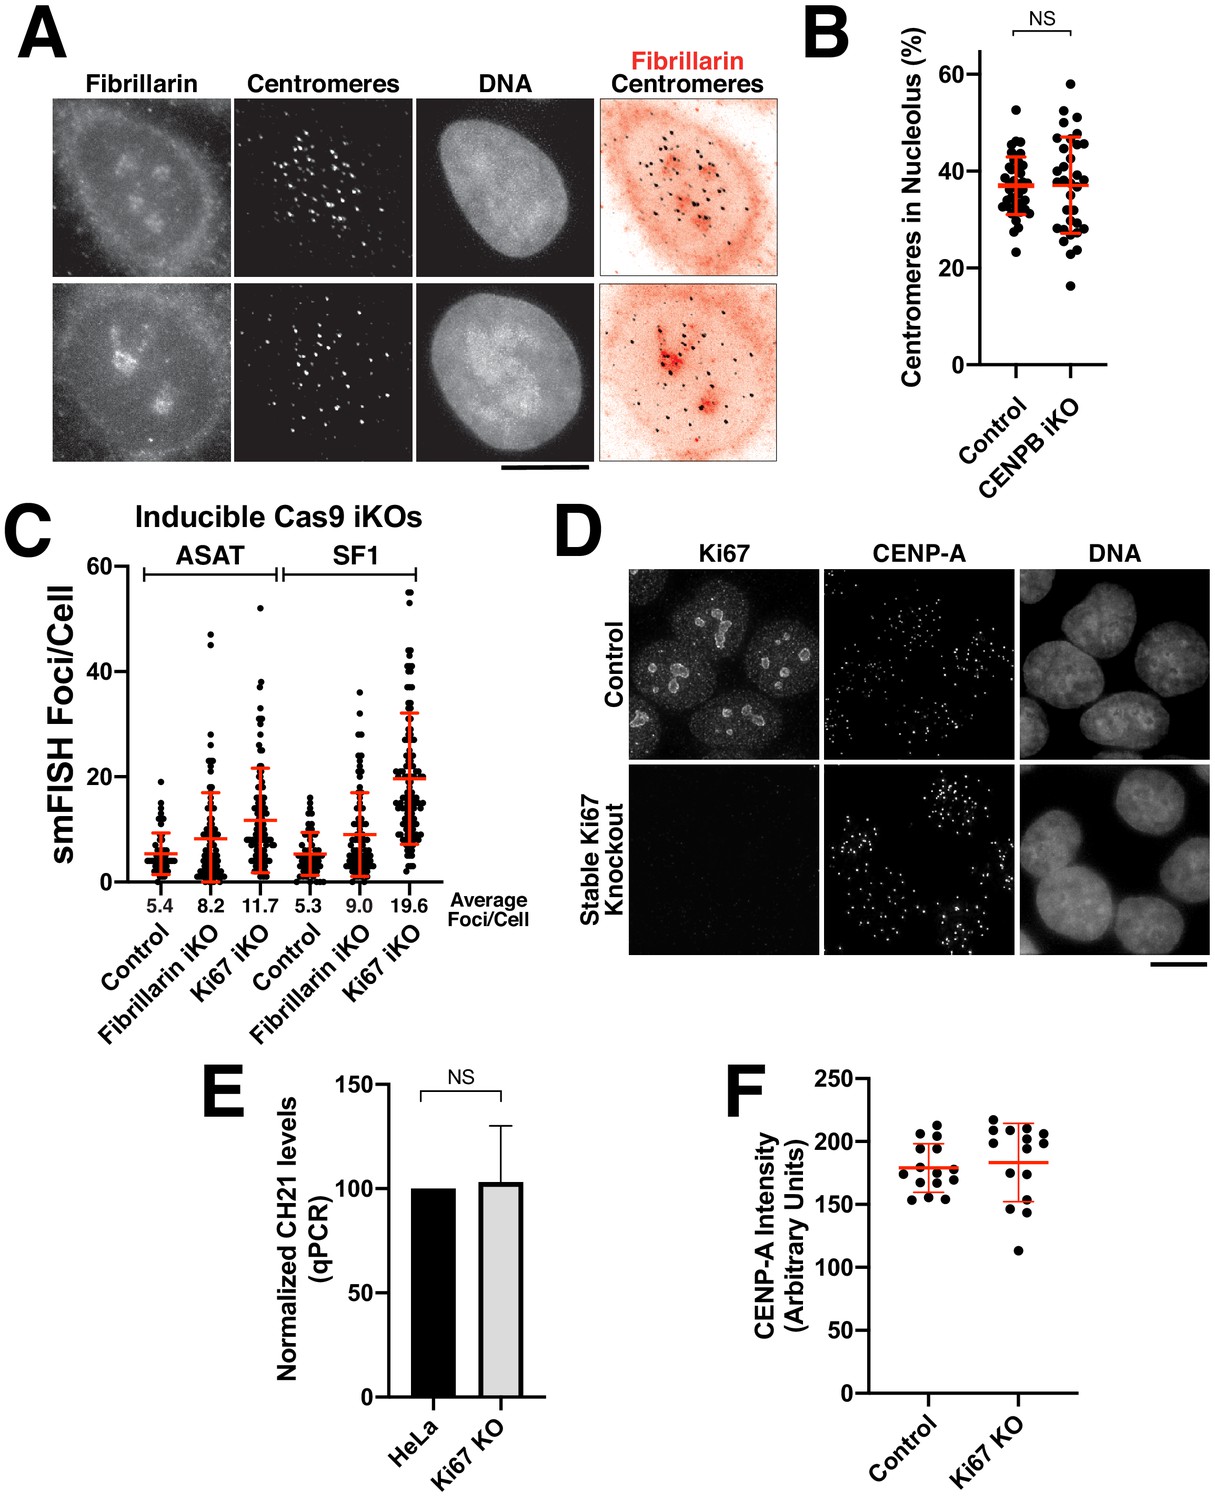
Analysis of centromere-nucleolar contacts.
(A) Immunofluorescence of HeLa (top) and RPE-1 cell (bottom) showing the colocalization of centromeres with the nucleolus, as marked with antibodies against Fibrillarin and centromeres (ACA). (B) Quantification reveals that depletion of CENP-B does not affect centromere-nucleolar associations. (C) Induction of Ki67 and Fibrillarin knockouts results in increased levels of alpha-satellite transcription, particularly for Ki-67, as tested by both ASAT and SF1 probe sets. The cell lines used for this experiment represent inducible knockout cells, in contrast to the stable Ki67 knockout analyzed in Figure 5F,G. Error bars represent the mean and standard deviation of at least 240 cells. (D) Validation of Ki67 stable knockout via immunofluorescence using antibodies against Ki67. Control cells (top) display clear Ki67 localization when compared to the clonal knockout cell line (bottom). Despite the persistently increased alpha-satellite transcript levels, there was no notable consequences to centromere protein levels (based on the localization of CENP-A). (E) RT-qPCR for alpha-satellite transcripts from chromosome 21 reveals no significant change in alpha-satellite transcript levels for the Ki67 knockout despite a 2–3 fold increase in alpha-satellite transcript levels for both the ASAT and SF1 smFISH probes (Figure 5F,G). The mean of 3 biological replicates was plotted and error bars represent the standard deviation. (F) Graph showing quantification CENP-A intensity in control and Ki67 stable knockout cells. Each point represents the average of the centromeres within a single cell. N = 15 cells/condition. Scale bars, 10 µm.
-
Figure 5—figure supplement 1—source data 1
Source data for the RT-qPCR experiments shown in Figure 5—figure supplement 1 – panel E.
- https://cdn.elifesciences.org/articles/59770/elife-59770-fig5-figsupp1-data1-v2.xlsx
Tables
Key resources table
| Reagent type (species) or resource | Designation | Source or reference | Identifiers | Additional information |
|---|---|---|---|---|
| Cell line (H. sapiens) | HeLa | Don Cleveland lab (UCSD) | HeLa | Cell line maintained in the Cheeseman Lab |
| Cell line (H. sapiens) | U20S | Don Cleveland lab (UCSD) | U20S | Cell line maintained in the Cheeseman Lab initially received from the Cleveland lab |
| Cell line (H. sapiens) | MCF7 | American Type Culture Collection | MCF7 | Cell line maintained in the Cheeseman Lab initially received from American Type Culture Collection |
| Cell line (H. sapiens) | RPE1 | Prasad Jallepalli Lab (MSKCC) | RPE1 | Cell line maintained in the Cheeseman Lab initially received from Dr. Prasad Jallepalli |
| Cell line (H. sapiens) | cTT20 (inducible Cas9 in HeLa) | PMID:26698661 | cTT20 | Cell line maintained in the Cheeseman Lab initially generated by Tonia Tsinman |
| Cell line (H. sapiens) | cTT33 (inducible Cas9 in RPE1) | PMID:28216383 | cTT33.1 | Cell line maintained in the Cheeseman Lab initially generated by Tonia Tsinman |
| Cell line (H. sapiens) | CENP-C iKO (in HeLa/cTT20) | PMID:26698661 | cKM153 | Cell line maintained in the Cheeseman Lab initially generated by Dr. Kara McKinley |
| Cell line (H. sapiens) | CENP-B iKO (in HeLa/cTT20) | PMID:28216383 | cKMKO C1.1 | Cell line maintained in the Cheeseman Lab initially generated by Dr. Kara McKinley |
| Cell line (H. sapiens) | CENP-A iKO (in HeLa/cTT20) | PMID:28216383 | cKMKO B12.1 | Cell line maintained in the Cheeseman Lab initially generated by Dr. Kara McKinley |
| Cell line (H. sapiens) | CENPN iKO (in HeLa/cTT20) | PMID:26698661 | cKMKO | Cell line maintained in the Cheeseman Lab initially generated by Dr. Kara McKinley |
| Cell line (H. sapiens) | HJURP iKO (in HeLa/cTT20) | PMID:28216383 | cKMKO E4.1 | Cell line maintained in the Cheeseman Lab initially generated by Dr. Kara McKinley |
| Cell line (H. sapiens) | CENPW iKO (in HeLa/cTT20) | PMID:28216383 | cKMKO H3.3 | Cell line maintained in the Cheeseman Lab initially generated by Dr. Kara McKinley |
| Cell line (H. sapiens) | Ndc80 iKO (in HeLa/cTT20) | PMID:28216383 | cKMKO F11.1 | Cell line maintained in the Cheeseman Lab initially generated by Dr. Kara McKinley |
| Cell line (H. sapiens) | Fibrillarin iKO (in HeLa/cTT20) | This Paper | cBM002 | Cell line maintained in the Cheeseman Lab initially generated by Brittania Moodie |
| Cell line (H. sapiens) | Ki67 iKO (in HeLa/cTT20) | This Paper | cBM3.10 | Cell line maintained in the Cheeseman Lab initially generated by Brittania Moodie |
| Cell line (H. sapiens) | Sgo1 iKO (in HeLa/cTT20) | PMID:28216383 | cKMKO H1.1 | Cell line maintained in the Cheeseman Lab initially generated by Dr. Kara McKinley |
| Cell line (H. sapiens) | BubR1 iKO (in HeLa/cTT20) | PMID:28216383 | cKMKO A8.1 | Cell line maintained in the Cheeseman Lab initially generated by Dr. Kara McKinley |
| Cell line (H. sapiens) | Mcm6 iKO (in HeLa/cTT20) | PMID:28216383 | cKMKO E2.2 | Cell line maintained in the Cheeseman Lab initially generated by Dr. Kara McKinley |
| Cell line (H. sapiens) | Gins1 iKO (in HeLa/cTT20) | PMID:28216383 | cKMKO D11.1 | Cell line maintained in the Cheeseman Lab initially generated by Dr. Kara McKinley |
| Cell line (H. sapiens) | Orc1 iKO (in HeLa/cTT20) | PMID:28216383 | cKMKO G2.1 | Cell line maintained in the Cheeseman Lab initially generated by Dr. Kara McKinley |
| Cell line (H. sapiens) | Cdt1 iKO (in HeLa/cTT20) | PMID:28216383 | cKMKO B9.1 | Cell line maintained in the Cheeseman Lab initially generated by Dr. Kara McKinley |
| Cell line (H. sapiens) | ESCO2 iKO (in HeLa/cTT20) | PMID:28216383 | cKMKO C9.2 | Cell line maintained in the Cheeseman Lab initially generated by Dr. Kara McKinley |
| Cell line (H. sapiens) | Scc1 iKO (in HeLa/cTT20) | PMID:28216383 | cKMKO G11.1 | Cell line maintained in the Cheeseman Lab initially generated by Dr. Kara McKinley |
| Cell line (H. sapiens) | Smc2 iKO (in HeLa/cTT20) | PMID:28216383 | cKMKO H5.1 | Cell line maintained in the Cheeseman Lab initially generated by Dr. Kara McKinley |
| Cell line (H. sapiens) | CAPG iKO (in HeLa/cTT20) | PMID:28216383 | cKMKO E9.2 | Cell line maintained in the Cheeseman Lab initially generated by Dr. Kara McKinley |
| Cell line (H. sapiens) | CAPG2 iKO (in HeLa/cTT20) | PMID:28216383 | cKMKO E11.2 | Cell line maintained in the Cheeseman Lab initially generated by Dr. Kara McKinley |
| Cell line (H. sapiens) | TOP2A iKO (in HeLa/cTT20) | PMID:28216383 | cKMKO G11.2 | Cell line maintained in the Cheeseman Lab initially generated by Dr. Kara McKinley |
| Cell line (H. sapiens) | SSRP1 iKO (in HeLa/cTT20) | PMID:28216383 | cKMKO G10.2 | Cell line maintained in the Cheeseman Lab initially generated by Dr. Kara McKinley |
| Antibody | DM1a (anti-tubulin); mouse monoclonal | Sigma Aldrich | T9026-.2ML | (1:10000) |
| Antibody | ACA (anti-centromere antibodies; human auto-immune serum) | Antibodies, Inc | 15-234-0001 | (1:1000) |
| Antibody | Anti-CENP-A (mouse monoclonal) | Abcam | ab13939 | (1:1000) |
| Antibody | Anti-Ki67 (rabbit polyclonal) | Abcam | ab15580 | (1:100) |
| Antibody | Anti-Fibrillarin (rabbit polyclonal) | Abcam | ab5821 | (1:300) |
| Antibody | Anti-CENP-C (rabbit polyclonal) | Cheeseman Lab (Whitehead Institute) | N/A | (1:1000) |
| Antibody | Anti-CENP-B (rabbit polyclonal) | Abcam | ab25734 | (1:1000) |
| Commercial assay or kit | Custom Stellaris RNA FISH probes (Quasar570 or Quasar670) | Biosearch Technologies; PixelBiotech GmbH | N/A | Probe sequences may be found in Supplementary file 2 |
| Commercial assay or kit | Custom HuluFISH probes (Atto565) | PixelBiotech GmbH | N/A | Probe sequences may be found in Supplementary file 2 |
| Commercial assay or kit | Maxima First Strand cDNA Synthesis Kit for RT-qPCR | Life Technologies (Thermo Scientific) | K1671 | |
| Commercial assay or kit | SYBR Green PCR Master Mix | Thermo Fisher Scientifc | A25742 | |
| Chemical compound, drug | TRIzol Reagent (Tri Reagent solution) | Life Technologies | AM9738 | |
| Chemical compound, drug | RNase A | Qiagen | 19101 | 1:1000 |
| Chemical compound, drug | BMH-21; Pol I Inh | Millipore; Sigma Aldrich | 509911; SML1183 | 1 µM |
| Chemical compound, drug | ML-60218; Pol III Inh | Fisher Scientific (Thermo Fisher Scientific) | 557403 | 20 µM |
| Chemical compound, drug | THZ1; Cdk7 Inh | Fisher Scientific (Thermo Fisher Scientific) | 5323720001 | 1 µM |
| Chemical compound, drug | Formamide (Deionized) | Life Technologies | AM9342 | |
| Chemical compound, drug | Ribonucleoside vanadyl complexes | Sigma Aldrich | R3380-5ML |
Additional files
-
Supplementary file 1
Table showing sequences for smFISH probes.
- https://cdn.elifesciences.org/articles/59770/elife-59770-supp1-v2.xlsx
-
Supplementary file 2
Table showing analysis of matches of smFISH probe sequences to centromere reference sequences.
- https://cdn.elifesciences.org/articles/59770/elife-59770-supp2-v2.xlsx
-
Transparent reporting form
- https://cdn.elifesciences.org/articles/59770/elife-59770-transrepform-v2.docx
Download links
A two-part list of links to download the article, or parts of the article, in various formats.
Downloads (link to download the article as PDF)
Open citations (links to open the citations from this article in various online reference manager services)
Cite this article (links to download the citations from this article in formats compatible with various reference manager tools)
Alpha-satellite RNA transcripts are repressed by centromere–nucleolus associations
eLife 9:e59770.
https://doi.org/10.7554/eLife.59770


