Characterization and prediction of clinical pathways of vulnerability to psychosis through graph signal processing
- Developmental Imaging and Psychopathology Laboratory, University of Geneva School of Medicine, Switzerland
- Institute of Bioengineering, Ecole Polytechnique Fédérale de Lausanne, Switzerland
- Center for Contextual Psychiatry, Research Group Psychiatry, Department of Neuroscience, KU Leuven, Belgium
- Orygen, Australia
- The Centre for Youth Mental Health, The University of Melbourne, Australia
- Department of Psychiatry and Psychotherapy, Clinical Division of Social Psychiatry, Medical University Vienna, Austria
- Department of Psychiatry, University Hospital Jena, Germany
- Brain and Mind Centre, University of Sydney, Australia
- Child and Adolescent Psychiatric Service of the Canton of Zurich, Switzerland
- Department of Psychiatry, University of Hong Kong, China
- Department of Psychiatry, Amsterdam University Medical Centers, Netherlands
- Psychiatric Centre Bispebjerg, Denmark
- University of Basel, Switzerland
- Institute of Mental Health, Singapore
- Division of Mental Health and Wellbeing, Warwick Medical School, University of Warwick, United Kingdom
- North Warwickshire Early Intervention in Psychosis Service, Conventry and Warwickshire National Health Service Partnership Trust, United Kingdom
- Division of Psychology and Mental Health, University of Manchester, United Kingdom
- Greater Manchester Mental Health NHS Foundation Trust, United Kingdom
- Department of Radiology and Medical Informatics, University of Geneva, Switzerland
- Department of Genetic Medicine and Development, University of Geneva School of Medicine, Switzerland
Figures
Figure 1
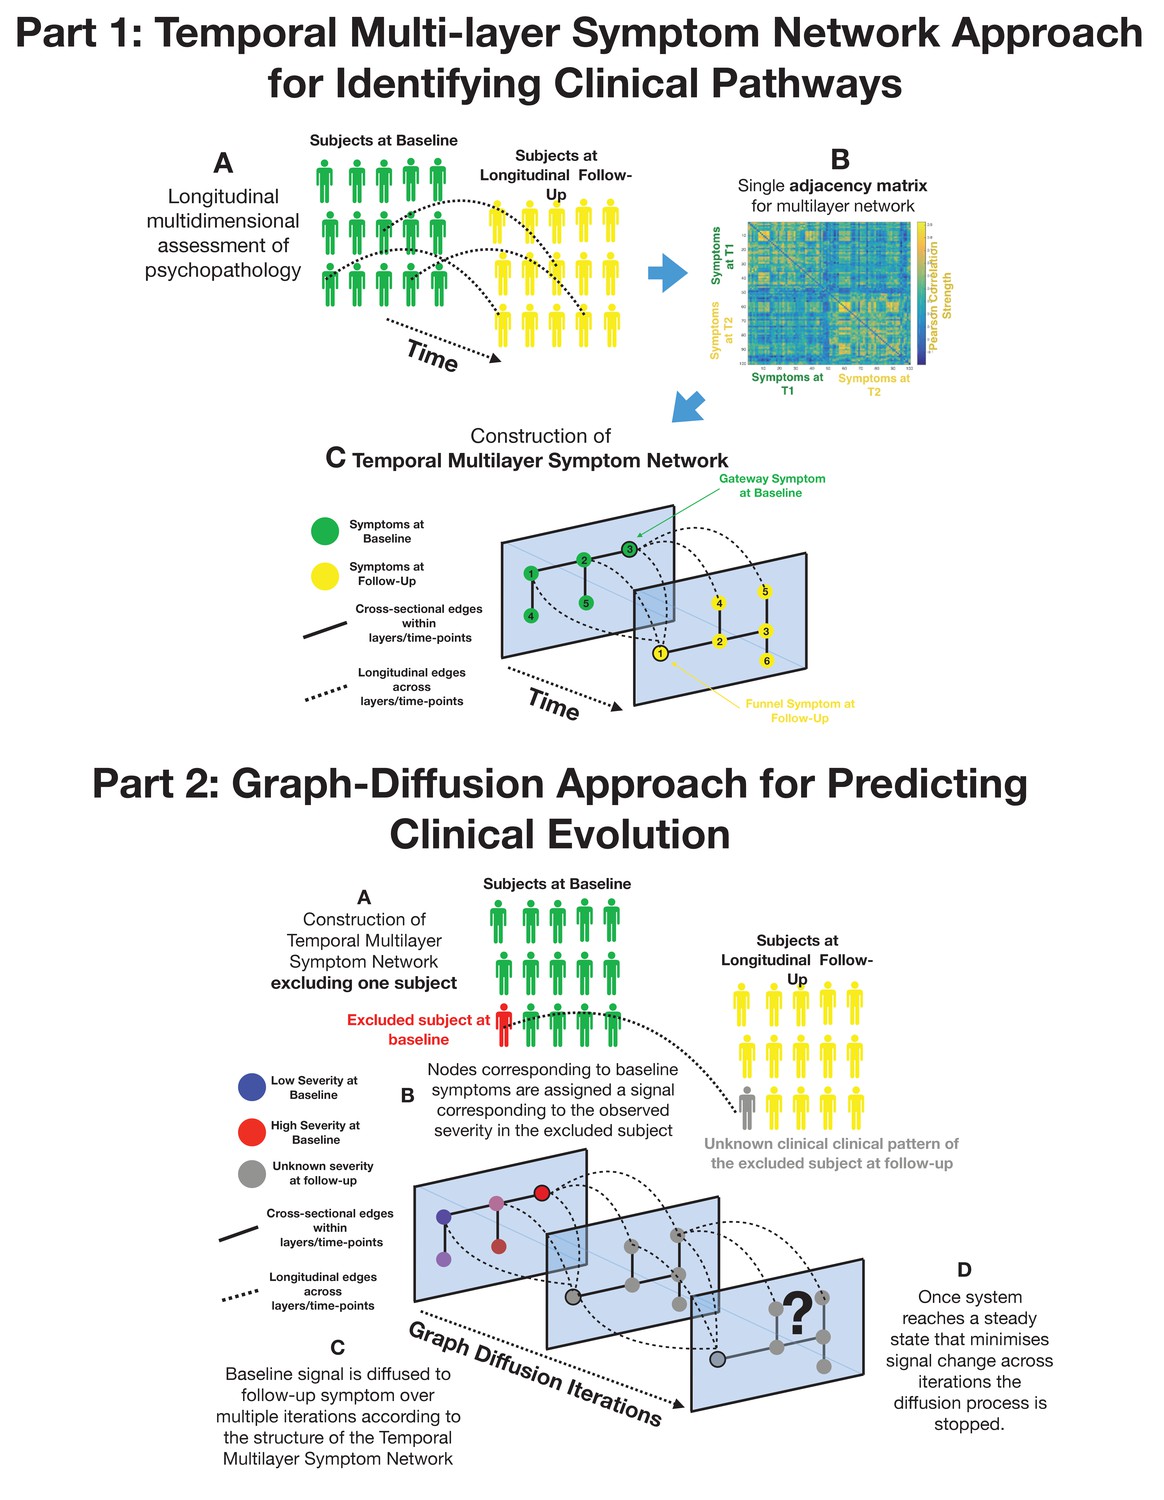
Part 1: Methodological pipeline for construction of Temporal MultiLayer Symptom Network (TMSN).
(A) Clinical assessment of multiple symptoms is performed for a cohort of participants over two time points (baseline and follow-up). (B) A single adjacency matrix is constructed, containing cross-sectional correlations between symptoms measured at baseline and follow-up which are located respectively in the upper left and lower right quadrants. The off-diagonal quadrant is composed of longitudinal correlations between each symptom at baseline and each symptom at follow-up. (C) Graphical representation of the multilayer symptom network. A first network layer is composed of correlation between baseline symptoms, represented in green and a second layer is composed of correlations between symptoms at follow-up, represented in yellow. The two cross-sectional layers are connected by longitudinal edges composed of correlations between baseline and follow-up symptoms represented as dashed lines. Such intuitive graphical representation is achieved empirically through topological embedding of symptoms according to dimensions derived from Eigen-decomposition of the multilayer adjacency matrix. Graph theory is employed to identify longitudinal clinical pathways (shortest paths) connecting symptoms across temporal layers. Baseline symptoms that broadly influence symptoms at follow-up, have high longitudinal centrality, and can be conceptualized as gateways of psychopathology (schematically represented as symptom three at baseline). Follow-up symptoms with high longitudinal centrality are broadly influenced by symptoms at baseline, and can be conceptualized by funnels of psychopathology (schematically represented as symptom one at follow-up). Part 2: Methodological pipeline for Graph Diffusion-based prediction of clinical evolution. (A) A TMSN is reconstructed excluding the individual for whom clinical prediction is performed, in a leave-one-out cross-validation loop. (B) In a graph-signal-processing framework node corresponding to baseline symptoms are assigned a signal that corresponds to their empirically observed severity in the excluded individual. At the beginning of the diffusion process severity of symptoms at follow-up is considered to be unknown and corresponding nodes are assigned a value of 0. (C) Using a finite-difference graph diffusion approach signal corresponding to the observed clinical pattern at baseline is diffused on the TMSN. Compared to simple regression analysis prediction keeps into account both the structure of longitudinal correlations connecting layers of baseline and follow-up symptoms, which are represented schematically as dashed lines, and the structure of cross-sectional correlations between symptoms at follow-up. This diffusion approach leads to a progressive evolution of the predicted symptom pattern at follow-up over multiple diffusion iterations. The symptom pattern at baseline is considered to be known, and is hence re-initialized at each diffusion iteration. This is conceptually similar to modeling the spread of information in a social network as a function of friendship ties between individuals or the diffusion of temperature as a function of distance between spatial locations. (D) For temperature, information or psychopathology, the diffusion algorithm will evolve the predicted signal until the system converges toward an equilibrium that minimizes signal change across time, at which point prediction is considered to be stable the iterative diffusion will be stopped. This process was repeated to predict symptom severity at follow-up for each individual included in the cohort, in a leave-one-our cross-validation loop.
Figure 2
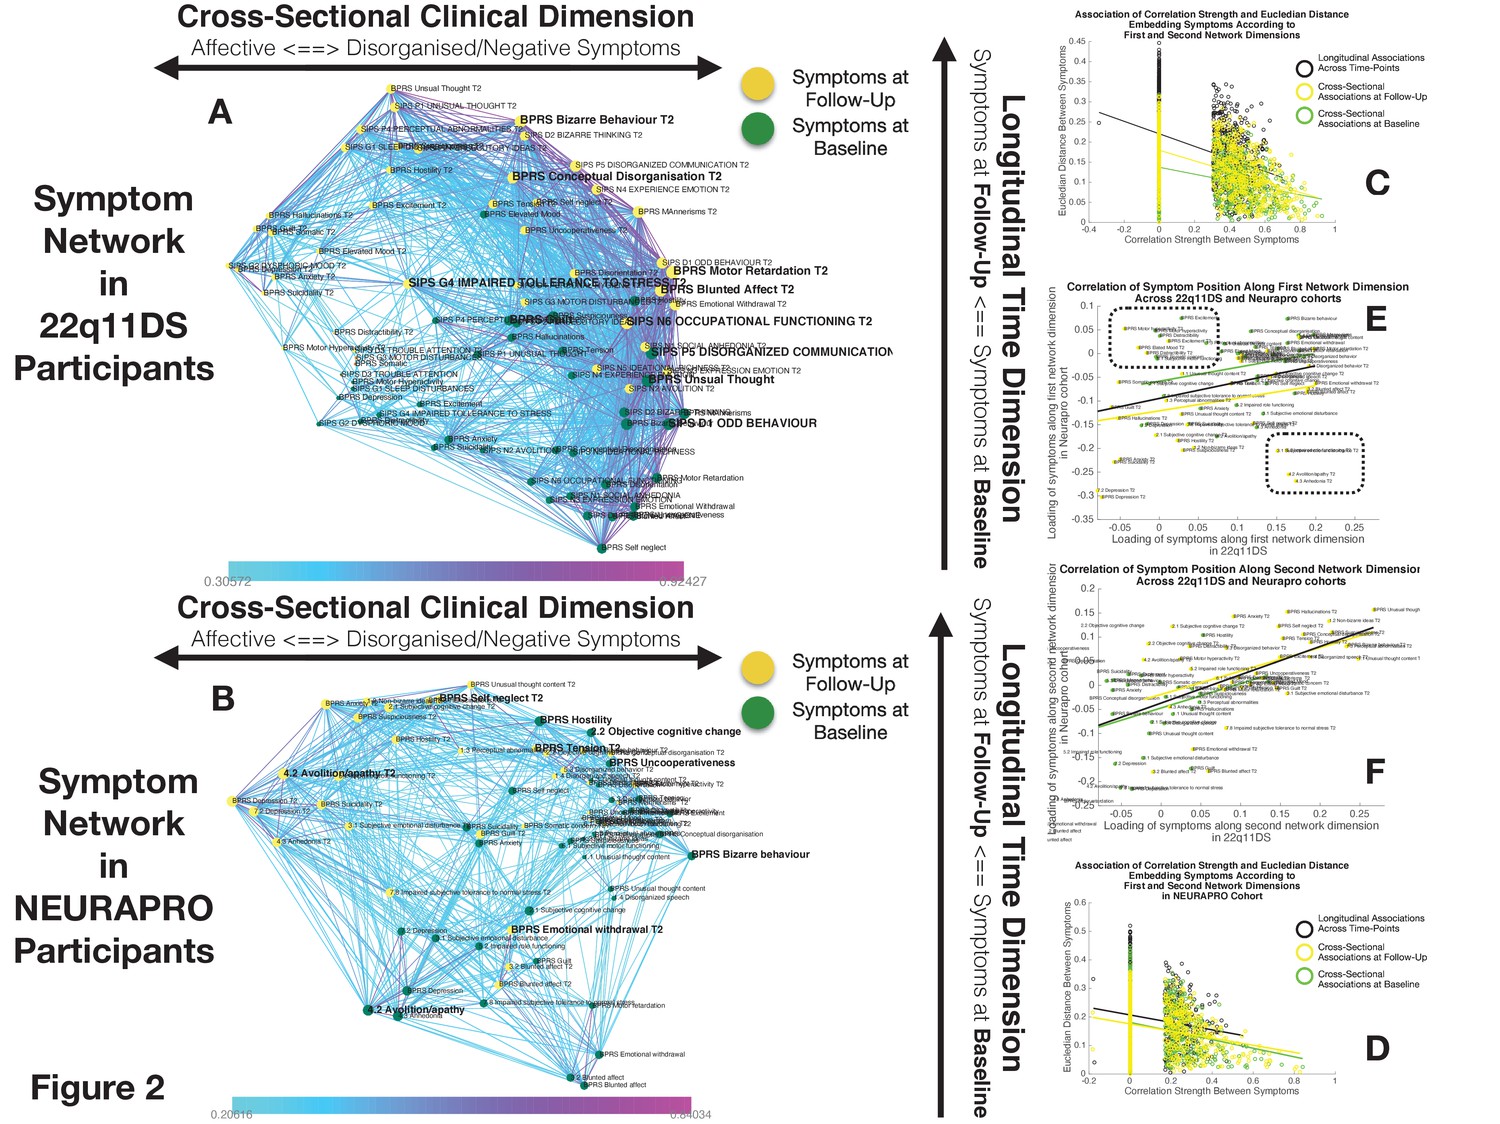
Structure of Longitudinal Symptom Networks.
(A, B) Structure of longitudinal symptom networks in 22q11DS (A) and NEURAPRO samples (B). Spatial embedding of symptoms according to network dimensions derived from singular value decomposition. The first dimension is plotted along the horizontal X-axis whereas the second dimension is plotted along the vertical Y-axis. Lines connecting symptoms represent correlations that survive correction for multiple comparisons at p<0.05 color-coded according to the correlation strength. Symptoms at baseline are displayed in green and symptoms at follow-up are displayed in yellow. Size of nodes is scaled according to the mean connectivity strength of each symptom. Symptoms that present a higher than random centrality in mediating clinical pathways going from baseline to follow-up are displayed in bold. (C, D) Association of Euclidean distance between symptoms after spatial embedding according to the first and second network dimensions and empirically observed correlation strength between symptoms in 22q11DS (C) and NEURAPRO samples (D). Cross-sectional associations between symptoms at baseline are displayed in green and between symptoms at follow-up are displayed in yellow. Longitudinal associations between symptoms at baseline and symptoms at follow-up are displayed in black. (E) Association between the position of symptoms according to the first network dimension across 22q11DS and NEURAPRO cohorts. Two clusters of symptoms that contribute negatively to the correlation between structures of symptom networks across the two cohorts, suggesting a different pattern of correlation with other forms of psychopathology, are circled. (F) Association between the position of symptoms according to the second network dimension across 22q11DS and NEURAPRO cohorts.
Figure 3
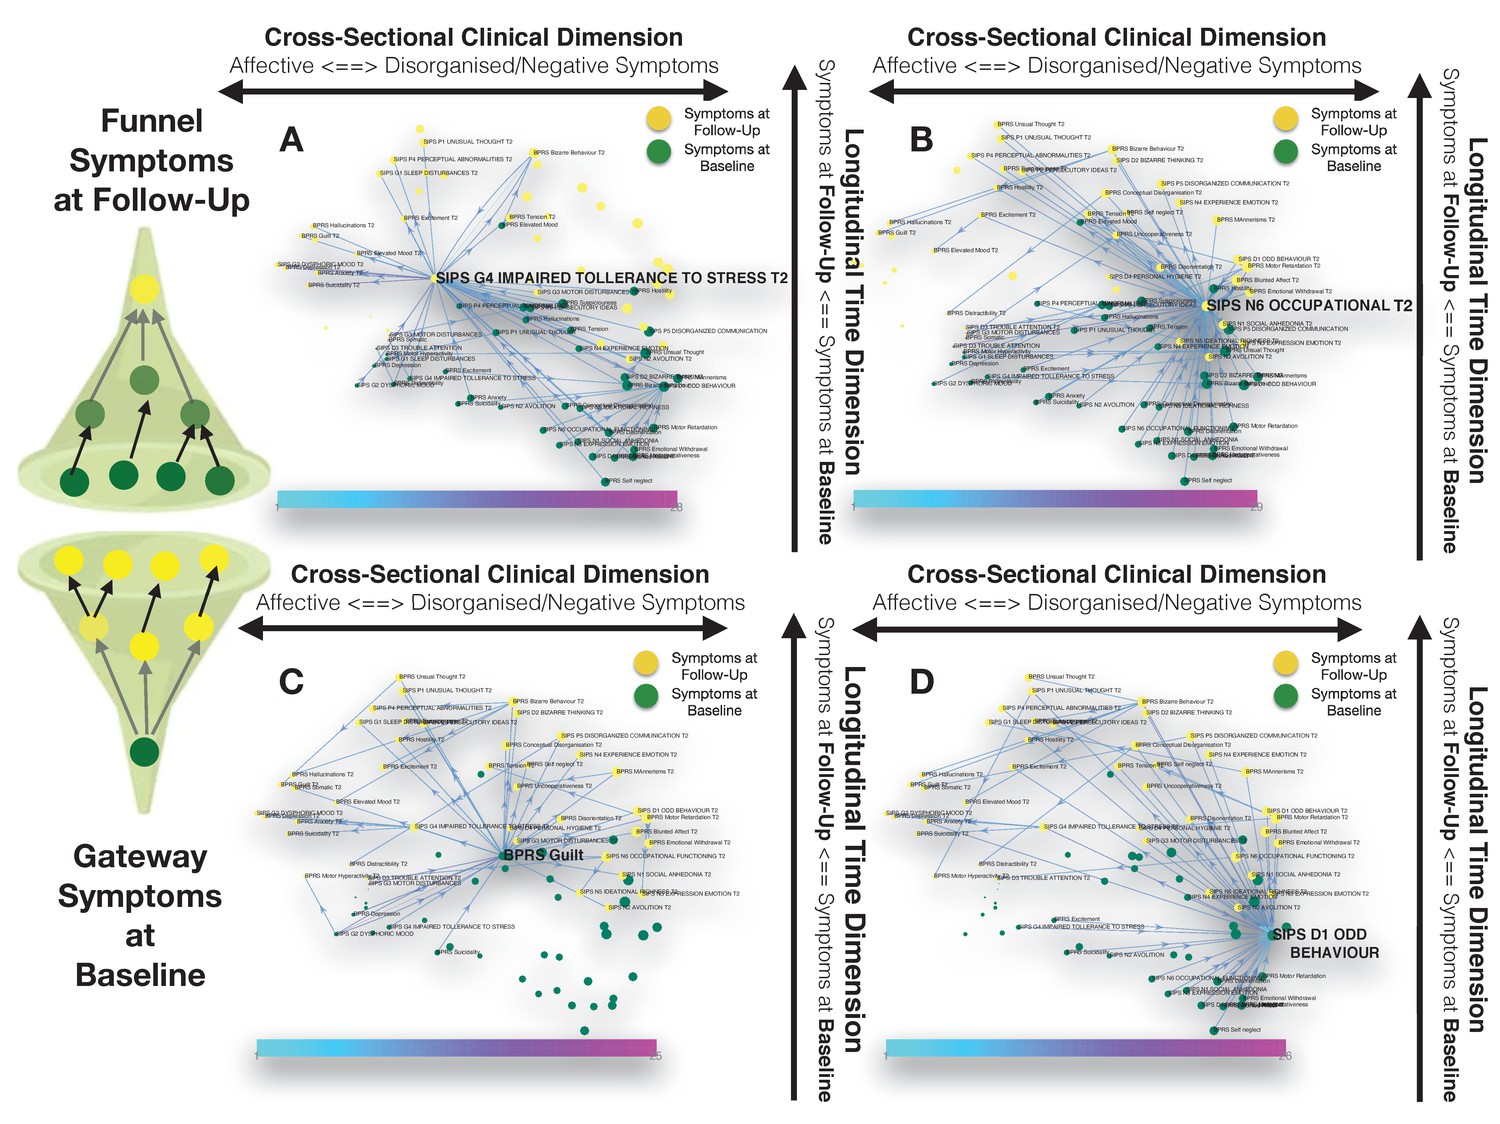
Longitudinal clinical pathways running through gateway symptoms at baseline (C, D) and funnel symptoms at follow-up (A, B) in the 22q11DS sample.
(A) Impaired tolerance to daily stress at follow-up acts as a funnel by broadly mediating the effects of baseline of thought disturbances on follow-up affective symptoms and of baseline affective symptoms on follow-up thought disturbances. (B) Reduced occupational functioning at follow-up, acted as a funnel by broadly mediating the effects of negative, disorganized symptoms and ADHD symptoms at baseline on the persistence of negative and disorganized symptoms at follow-up. (C) BPRS guilt at baseline acts as a gateway by mediating the effects of affective symptoms at baseline on both affective and thought disturbance symptoms at follow-up. (D) SIPS Odd Behavior acted as a gateway by broadly mediating the effects of negative symptoms at baseline on both disorganized and negative symptoms at follow-up.
Figure 4
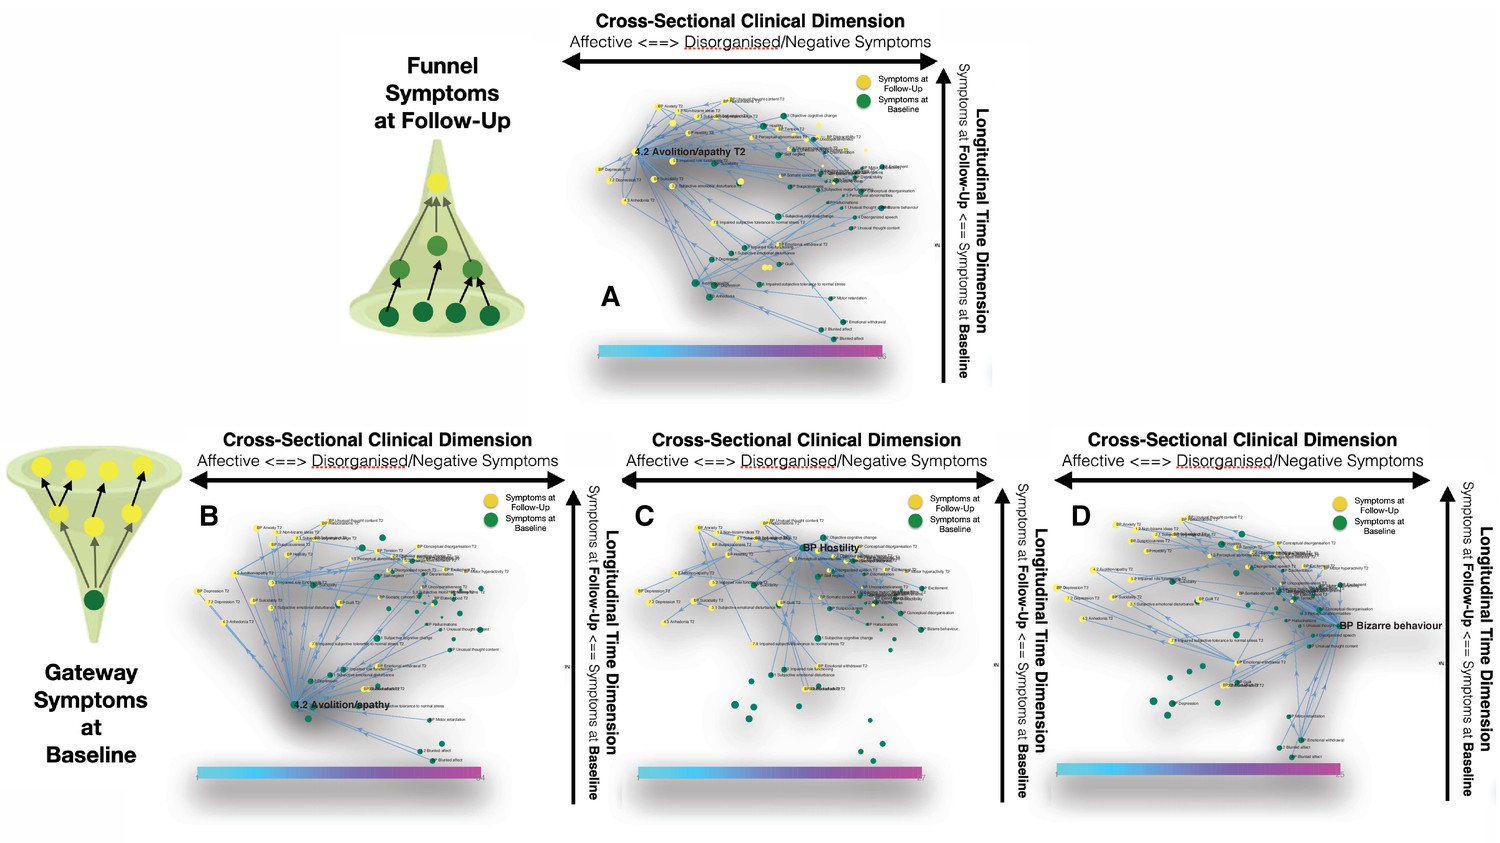
Longitudinal clinical pathways running through gateway symptoms at baseline (B, D) and funnel symptoms at follow-up (A) in the NEURAPRO sample.
(A) Avolition-apathy at follow-up was also highlighted as a key funnel symptom that broadly mediated the effects of baseline avolition and affective disturbances on subsequent psychopathology. (B) Avolition-apathy was located on the left side of the graph and was directly associated with subsequent affective symptoms and indirectly associated with negative and disorganized symptoms, through the mediating role of persistent avolition-apathy at follow-up. (C) BPRS hostility was also located in proximity to negative and disorganized symptoms at baseline and appeared central in mediating their effects on subsequent symptoms of mood disturbance. (D) BPRS bizarre behavior was located on the right side of the graph and appeared to broadly affect negative and disorganized symptoms at follow-up. Moreover, bizarre behavior indirectly affected subsequent affective disturbances p through the mediating role of emotional withdrawal at follow-up.
Figure 5
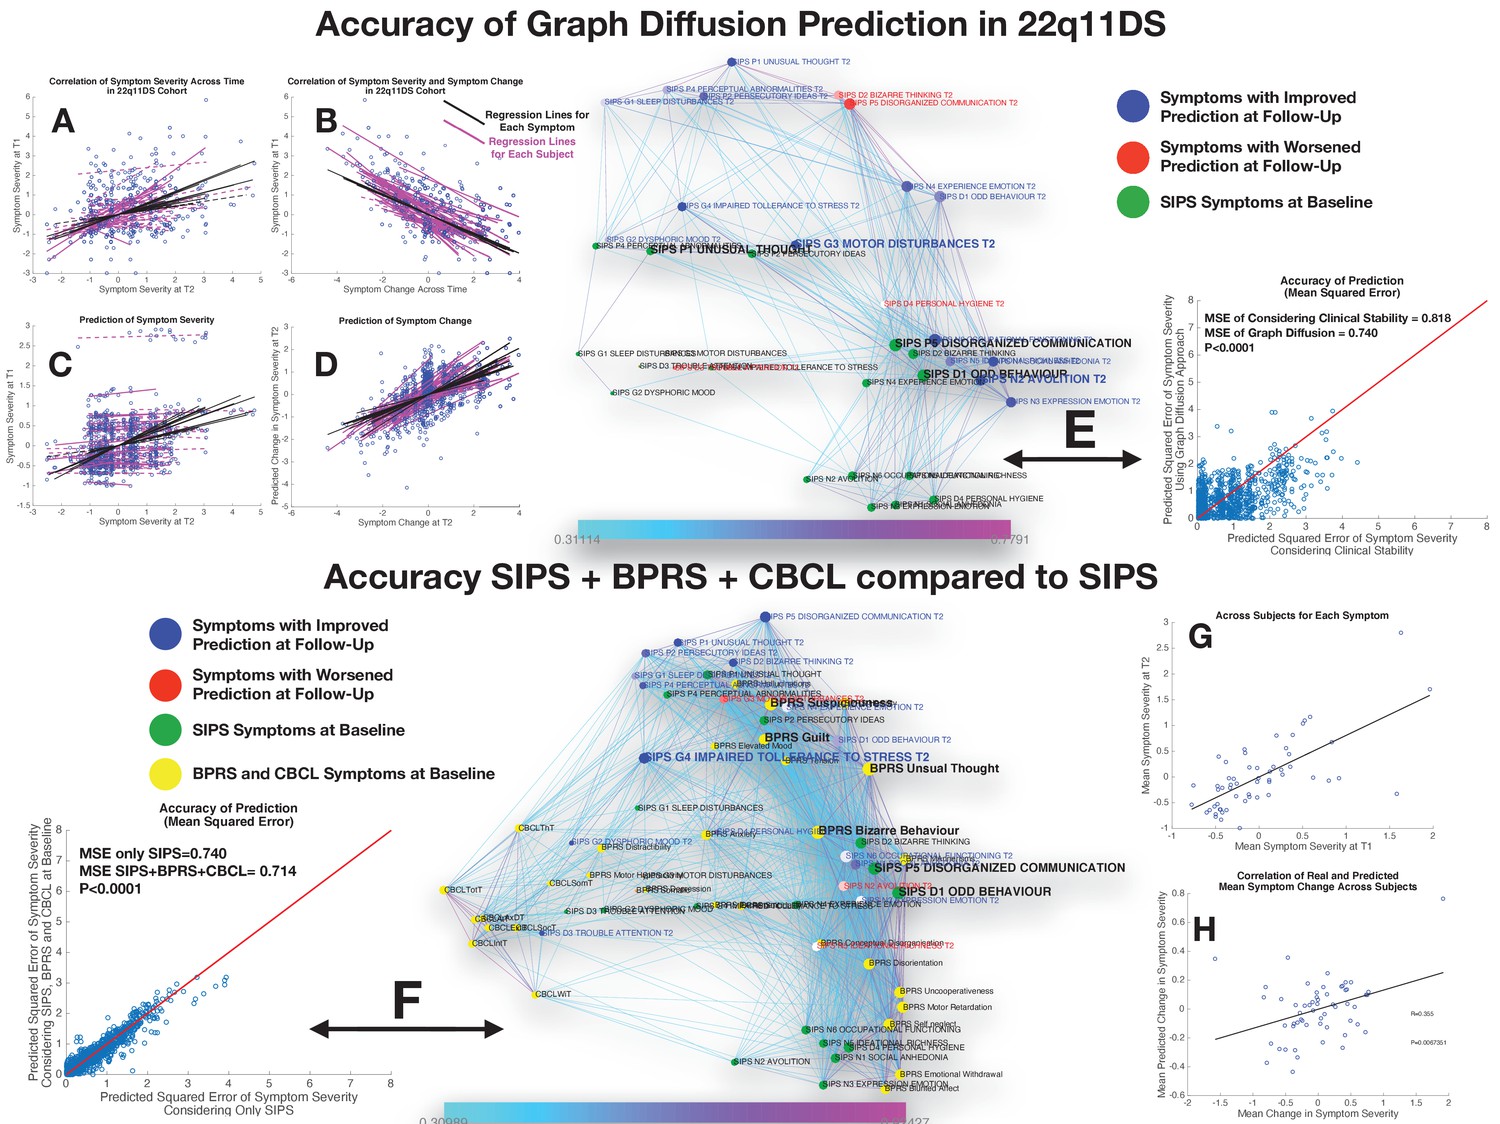
Performance of graph diffusion approach in predicting patterns of SIPS psychopathology at longitudinal follow-up in the 22q11DS sample.
(A) Correlation of symptom severity across time points for all symptoms across participants. Regression lines for symptoms are displayed in black with dashed lines indicating correlations that are not significant at p<0.05. Regression lines for individuals are displayed in purple with dashed lines indicating correlations that are not significant at p<0.05. (B) Correlation between symptom severity at baseline and change in symptom severity between baseline and follow-up for all symptoms across all participants. (C) Correlation between real and predicted symptom severity at follow-up. (D) Correlation between real and predicted symptom change between baseline and follow-up. (E) Comparison of accuracy in predicting SIPS at follow-up, between considering clinical stability and graph diffusion approach using SIPS at baseline. Symptoms are spatially embedded according to two main network dimensions derived from SVD. Symptoms at baseline are displayed in green. Symptoms at follow-up are color-coded according to the prediction accuracy of graph diffusion compared to considering clinical stability, with blue symptoms having higher accuracy using graph diffusion and red symptoms having worsened accuracy. (F) Prediction accuracy of considering the combination of SIPS, BPRS, and CBCL at baseline compared to using only items of the SIPS. Symptoms are spatially embedded according to two main network dimensions derived from SVD. Symptoms of the SIPS at baseline are displayed in green. Items of additional clinical instruments are displayed in yellow. Symptoms at follow-up are color-coded according to the prediction accuracy of considering an additional clinical instrument compared to the accuracy achieved by using only items of the SIPS, with blue symptoms having higher accuracy and red symptoms having worsened accuracy. (G) Correlation between mean symptom severity at follow-up and mean predicted symptom severity at follow-up. (H) Correlation between mean symptom change across time points and mean predicted symptom change.
Figure 6

Performance of graph diffusion approach in predicting patterns of CAARMS psychopathology at longitudinal follow-up in the NEURAPRO sample.
(A) Correlation of symptom severity across time points for all symptoms across participants. Regression lines for symptoms are displayed in black with dashed lines indicating correlations that are not significant at p<0.05. Regression lines for individuals are displayed in purple with dashed lines indicating correlations that are not significant at p<0.05. (B) Correlation between symptom severity at baseline and change in symptom severity between baseline and follow-up for all symptoms across all participants. (C) Correlation between real and predicted symptom severity at follow-up. (D) Correlation between real and predicted symptom change between baseline and follow-up. (E) Comparison of accuracy in predicting CAARMS at follow-up, between considering clinical stability and graph diffusion approach using CAARMS at baseline. Symptoms are spatially embedded according to two main network dimensions derived from SVD. Symptoms at baseline are displayed in green. Symptoms at follow-up are color-coded according to the prediction accuracy of graph diffusion compared to considering clinical stability, with blue symptoms having higher accuracy using graph diffusion and red symptoms having worsened accuracy. (F) Prediction accuracy of considering the combination of CAARMS and BPRS at baseline compared to using only items of the CAARMS. Symptoms are spatially embedded according to two main network dimensions derived from SVD. Symptoms of the CAARMS at baseline are displayed in green. Items of BPRS at baseline are displayed in yellow. Symptoms of CAARMS at follow-up are color-coded according to the prediction accuracy of considering an additional clinical instrument compared to the accuracy achieved by using only items of the CAARMS, with blue symptoms having higher accuracy and red symptoms having worsened accuracy. (G) Correlation between mean symptom severity at follow-up and mean predicted symptom severity at follow-up. (H) Correlation between mean symptom change across time points and mean predicted symptom change.
Appendix 1—figure 1
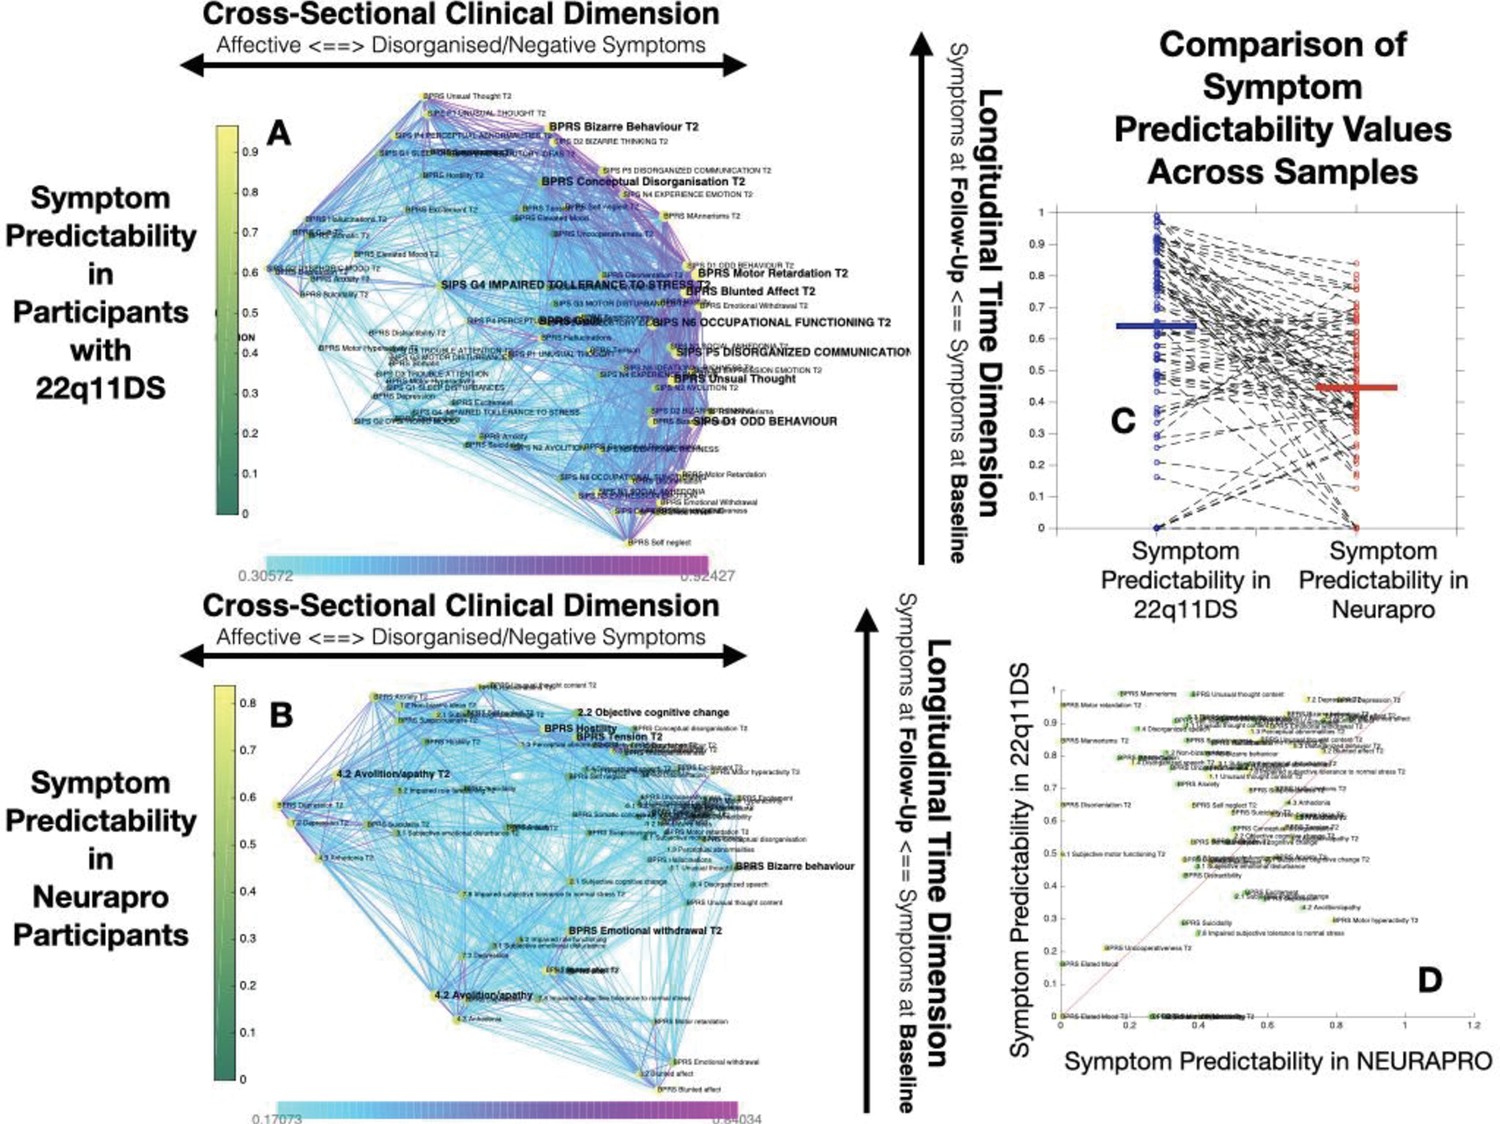
Comparison of Symptom Predictaiblity in 22q11DS and NEURAPRO Samples.
(A) Representation of symptom predictability according to the multilayer temporal symptom network in the 22q11DS sample. Symptoms are spatially embedded according to the two main network dimensions derived from network eigendecomposition as described in the main text. As described in the main text, node size is scaled according to symptom connectivity strength. The specificity of this analysis is that node color is shaded according to network predictability, both symptoms at baseline and at follow-up. (B) Representation of symptom predictability according to the multilayer temporal symptom network in the 22q11DS sample. (C) Comparison of symptom predictability according to the structure of the multilayer symptom network across 22q11DS and NEURAPRO samples. Each point represents a predictability estimate for one symptom. Dashed lines connect predictability estimates for homologous symptoms across samples. (D) Comparison of symptom predictability according to the structure of the multilayer symptom network across 22q11DS and NEURAPRO samples. Each point represents a predictability estimate for one symptom. Symptoms at baseline are represented in green whereas symptoms at follow-up are represented in yellow. The red line separates symptoms with higher predictability in the 22q11DS sample from symptoms with higher predictability in the NEURAPRO sample.
Appendix 1—figure 2
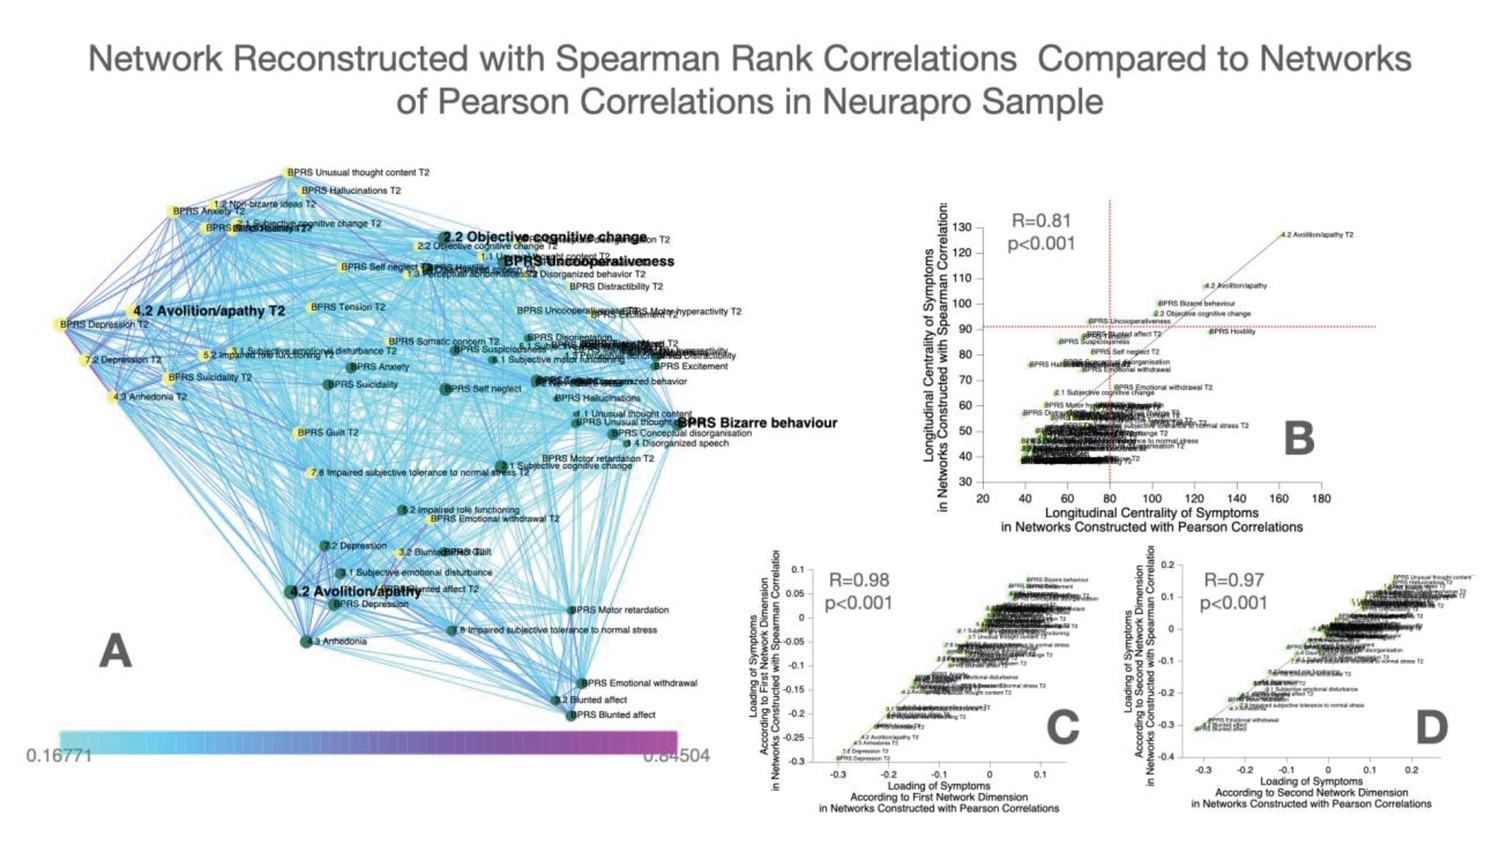
Construction and comparison of multilayer symptom network constructed using Spearman’s rank correlation compared to Pearson correlation in the NEURAPRO sample.
(A) Multilayer symptom network reconstructed from Spearman rank correlations in the NEURAPRO sample, employing the same procedure as described in the main text. (B) Correlation of longitudinal betweenness centrality measures computed in networks constructed using Spearman versus Pearson correlations. The horizontal red dashed line separates symptoms that had higher longitudinal centrality estimates than expected by chance, in the Spearman correlation networks. The vertical dashed line separates symptoms that had higher longitudinal centrality estimates than expected by chance, in the Pearson correlation network. (C) Correlation of loading of symptoms across the first dimension of Spearman versus Pearson correlation networks in the NEURAPRO sample. (D) Correlation of loading of symptoms across the second dimension of Spearman versus Pearson correlation networks in the NEURAPRO sample.
Appendix 1—figure 3
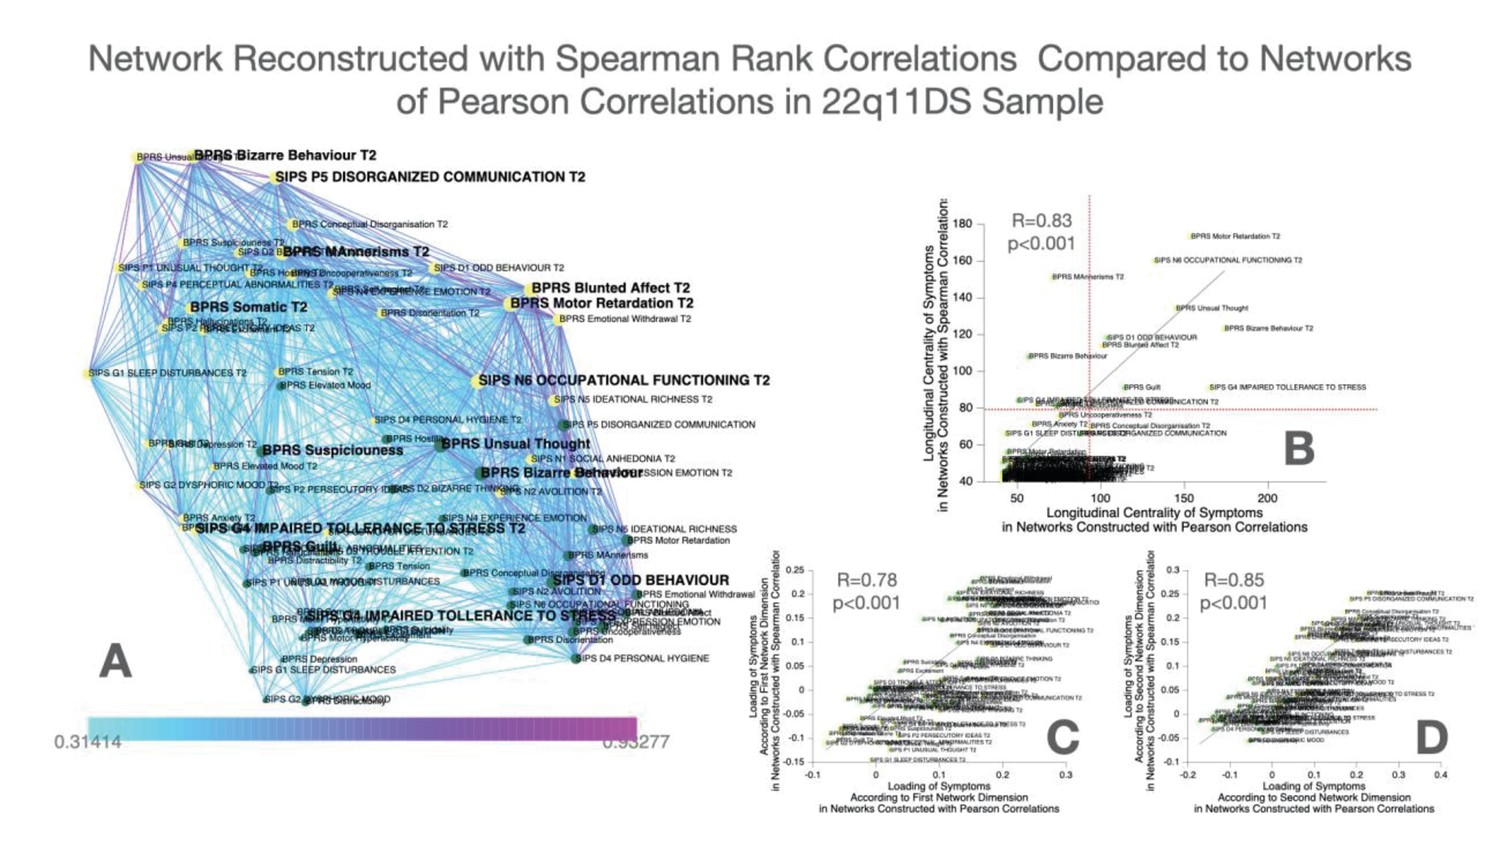
Construction and comparison of multilayer symptom network constructed using Spearman’s rank correlation compared to Pearson correlation in the 22q11DS sample.
(A) Multilayer symptom network reconstructed from Spearman rank correlations in 22q11DS, employing the same procedure as described in the main text. (B) Correlation of longitudinal betweenness centrality measures computed in networks constructed using Spearman versus Pearson correlations. The horizontal red dashed line separates symptoms that had higher longitudinal centrality estimates than expected by chance, in the Spearman ccorrelation networks. The vertical dashed line separates symptoms that had higher longitudinal centrality estimates than expected by chance, in the Pearson correlation network. (C) Correlation of loading of symptoms across the first dimension of Spearman versus Pearson correlation networks in the 22q11DS sample. (D) Correlation of loading of symptoms across the second dimension of Spearman versus Pearson correlation networks in the 22q11DS sample.
Appendix 1—figure 4
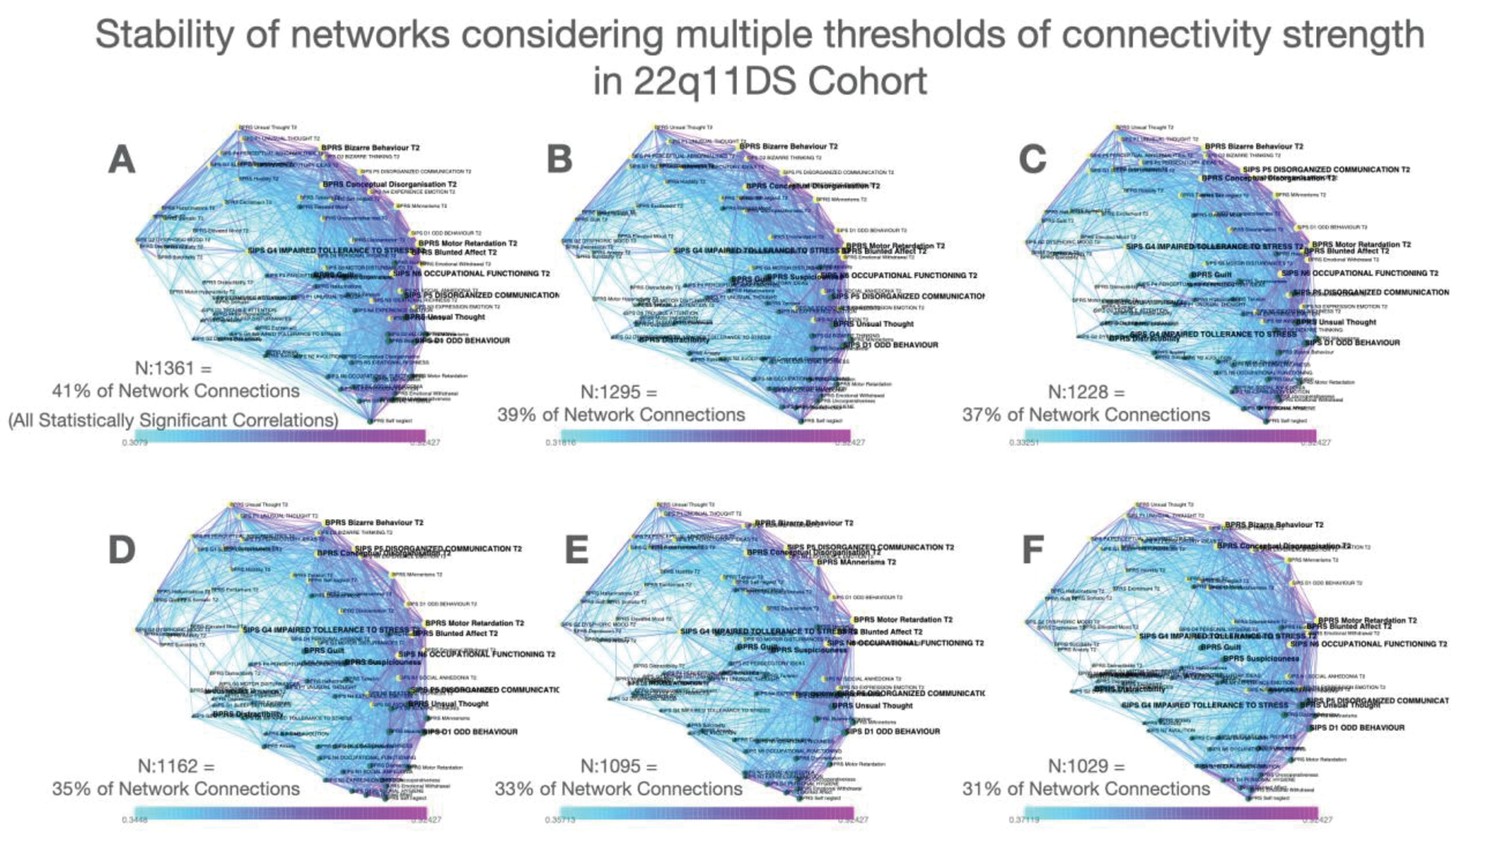
Stability of networks constructed considering multiple thresholds of connectivity strength in the 22q11DS cohort.
(A–F) Multilayer temporal symptom networks constructed considering a range of connectivity strength thresholds. For the most lenient threshold, we considered all correlations that were significant at p<0.05 after FDR correction for multiple comparisons (Panel A, 41% of possible connections). We progressively pruned 2% of the least significant connections until reaching the most stringent connectivity threshold that still yielded a fully connected network (Panel F, 31% of possible connections).
Appendix 1—figure 5
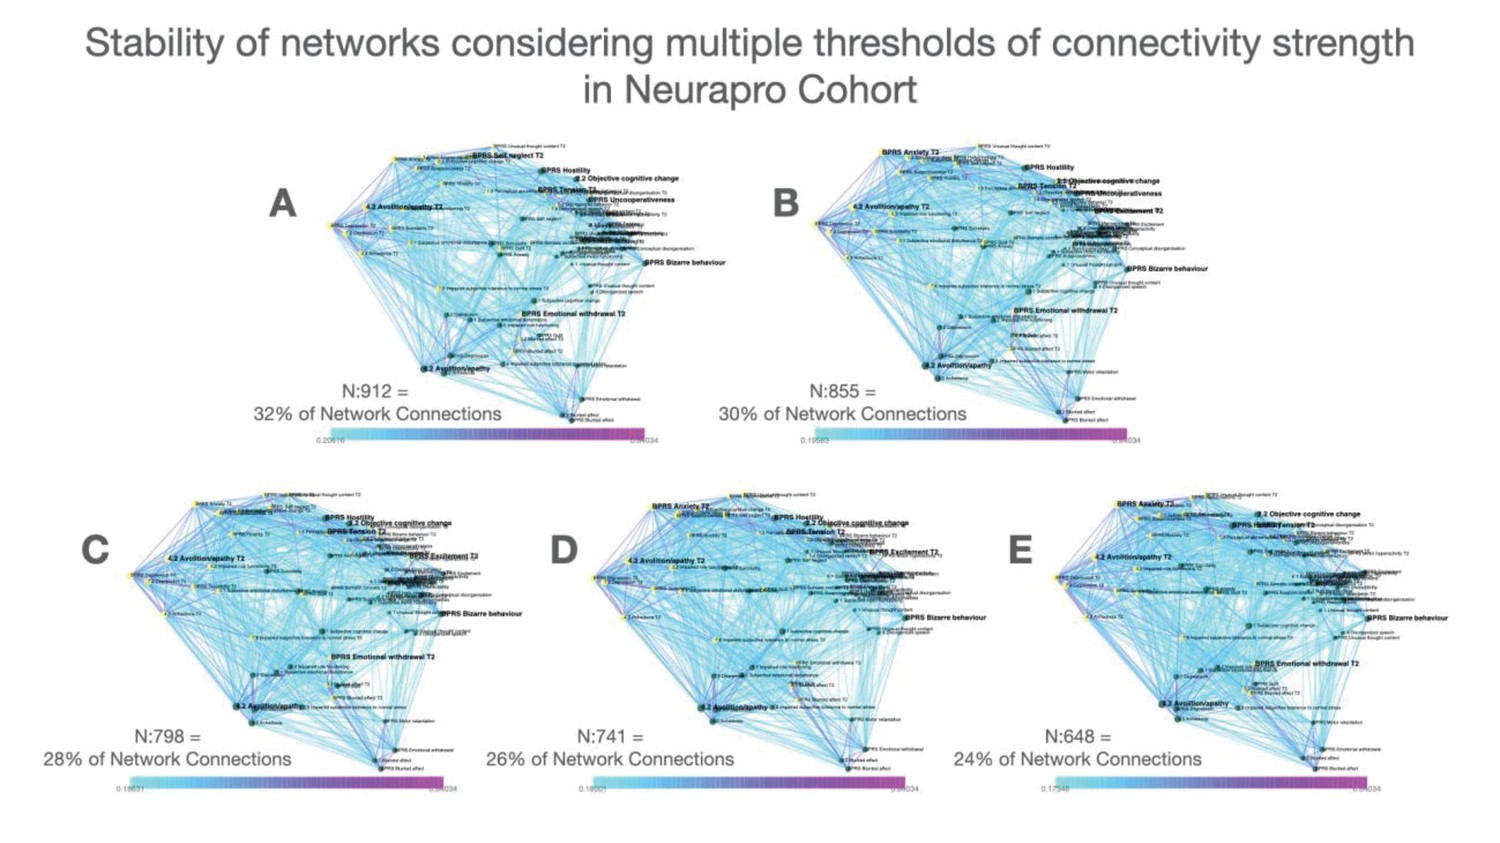
Stability of networks constructed considering multiple thresholds of connectivity strength in the NEURAPRO cohort.
(A–D) Multilayer temporal symptom networks constructed considering a range of connectivity strength thresholds. For the most lenient threshold, we considered all correlations that were significant at p<0.05 after FDR correction for multiple comparisons(Panel A, 32% of possible connections). We progressively pruned 2% of the least significant connections until reaching the most stringent connectivity threshold that still yielded a fully connected network (Panel E, 24% of possible connections).
Appendix 1—figure 6
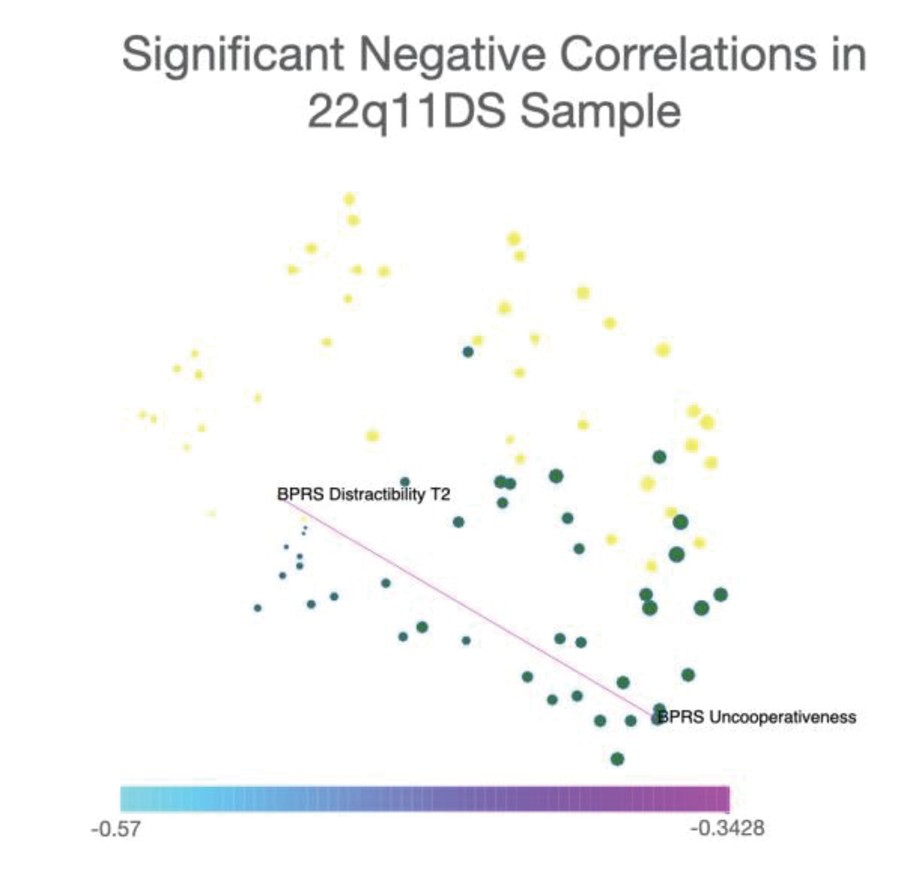
Representation of only significant negative correlations between symptoms in the 22q11DS sample.
Network visualization of significant negative correlations between symptoms in the 22q11DS cohort. Spatial embedding of symptoms is performed according to the eigendecomposition of networks composed of both significant positive and negative correlations. Results in 22q11DS indicated a single negative correlation that was significant at p<0.05 after FDR correction for multiple comparisons, connecting BPRS assessment of uncooperativeness at baseline assessment with BRPS assessment of distractibility and longitudinal follow-up.
Appendix 1—figure 7

Representation of only significant negative correlations between symptoms in the NEURAPRO sample.
Network visualization of significant negative correlations between symptoms in the NEURAPRO cohort. Spatial embedding of symptoms is performed according to the eigendecomposition of networks composed of both significant positive and negative correlations. Results in NEURAPRO indicated a total of eight negative correlations that were significant at p<0.05 after FDR correction for multiple comparisons. Such negative correlations mainly connected symptoms of blunted affect with symptoms of distractibility and motor hyperactivity.
Appendix 1—figure 8
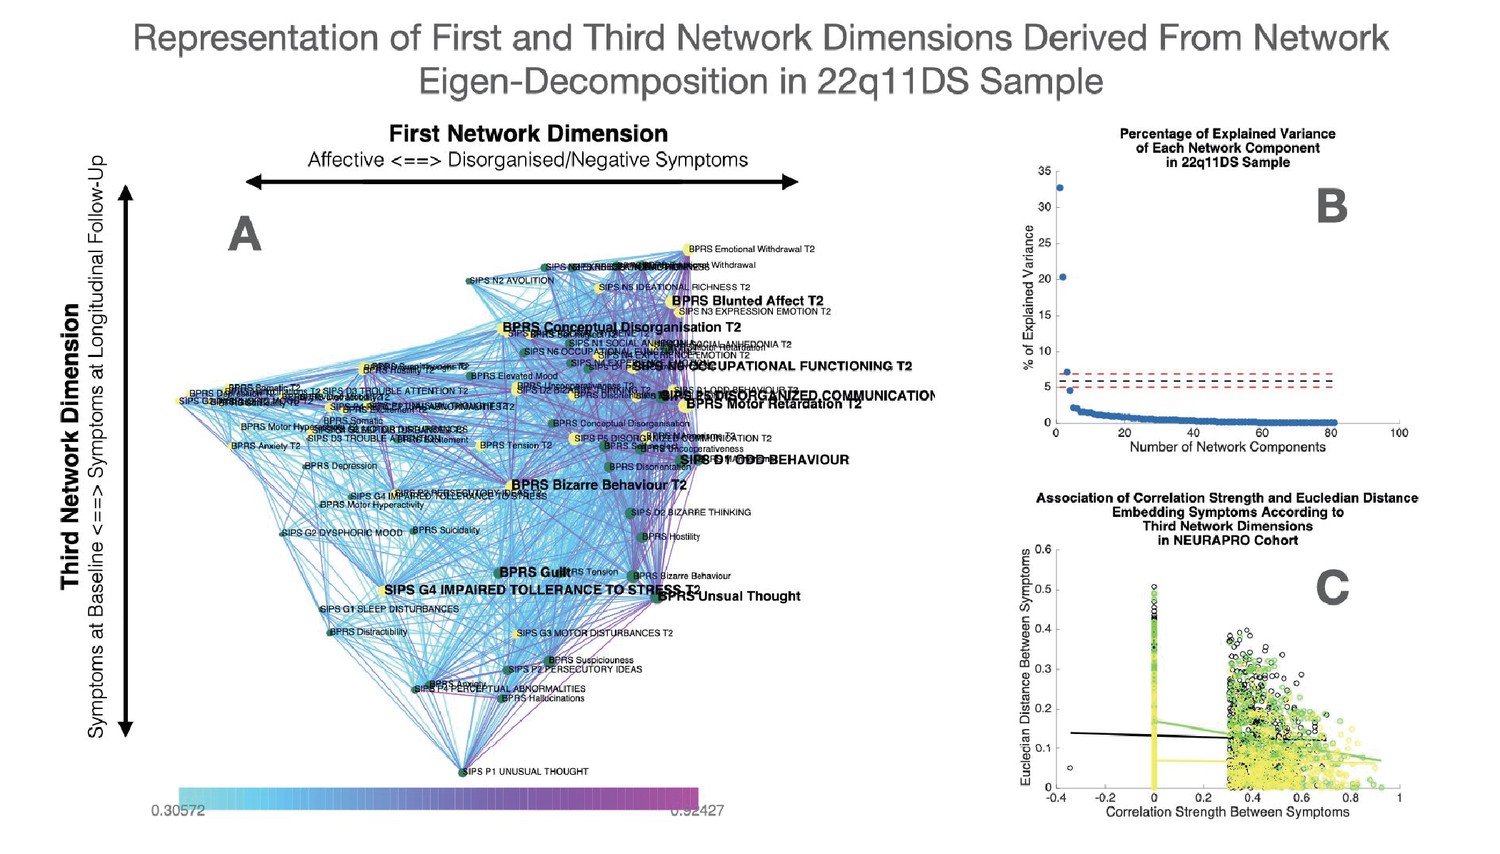
Representation of first and third network dimensions derived from network eigendecomposition in the 22q11DS sample.
(A) Network spatial embedding according to the first network dimension along the horizontal axis and third network dimension along the vertical axis in the 22q11DS sample. The third network dimension mainly separated symptoms at baseline assessment, displayed in green and mostly found at the bottom of the graph, from symptoms at follow-up assessment displayed in yellow and mostly found on the top of the graph. (B) Representation of percentage of network variance explained by each network component from the first components on the left to the last components on the right. Red dashed lines indicate the minimum and maximum percentage of variance explained by eigendecomposition of a network composed of 1000 networks composed of the same edges but with randomized structure. Network components located below the dashed lines are considered to be non-meaningful as they explain less percentage of network structure than what observed in a network with random structure. (C) Correlation of Euclidean distance between symptoms according to the third network dimension and empirically observed correlation strength between symptoms. The association of Euclidean distance and correlation strength is computed separately for cross-sectional correlations between symptoms at baseline assessment displayed in green and between symptoms at longitudinal follow-up displayed in yellow, as well as for longitudinal correlations between symptoms across time displayed in black.
Appendix 1—figure 9
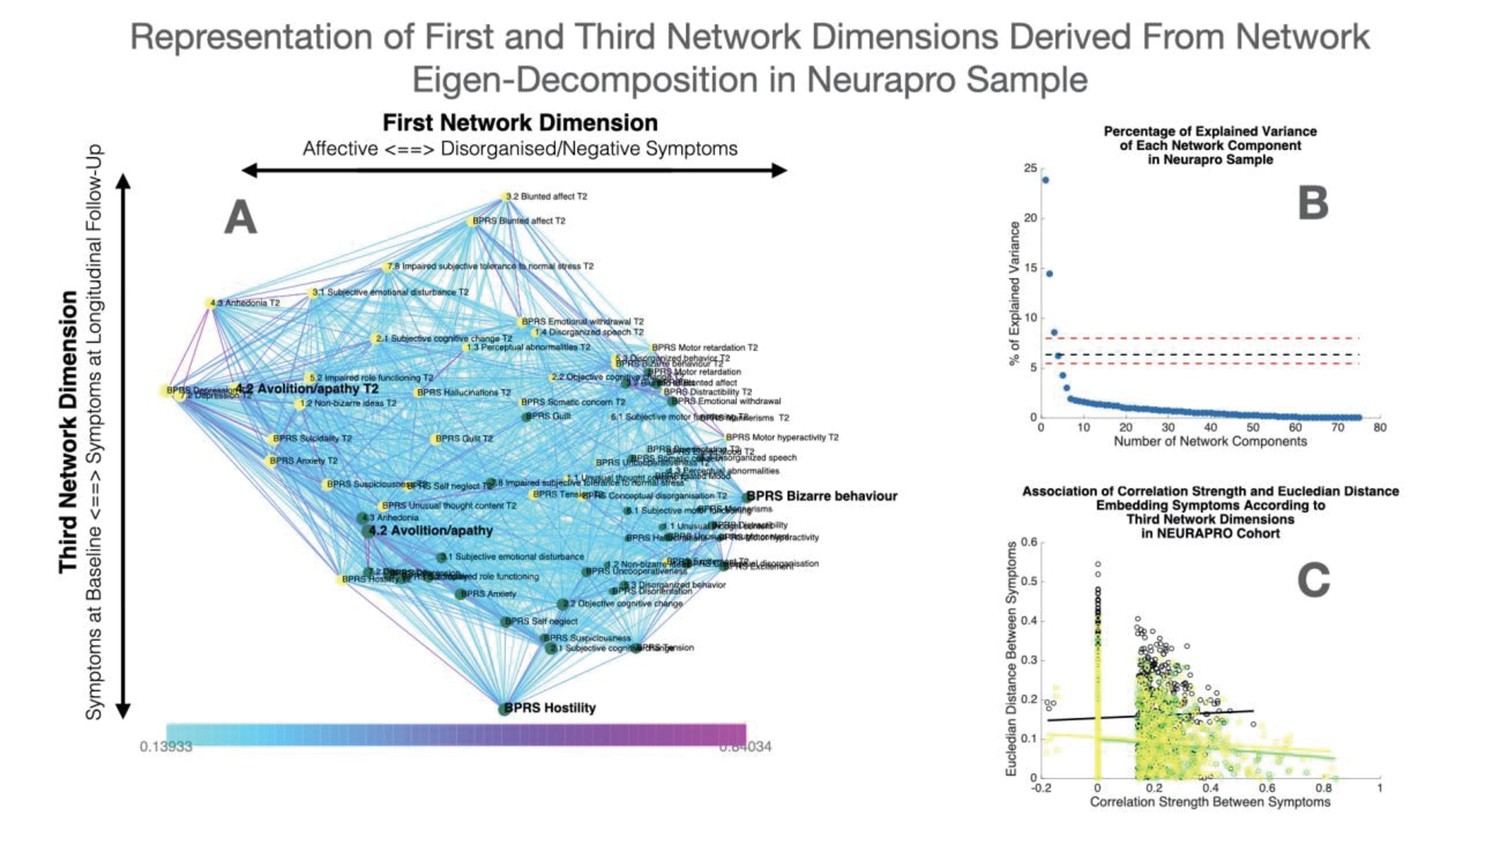
Representation of first and third network dimensions derived from network eigendecomposition in the NEURAPRO sample.
(A) Network spatial embedding according to the first network dimension along the horizontal axis and third network dimension along the vertical axis in NEURAPRO sample. The third network dimension mainly separated symptoms at baseline assessment, displayed in green and mostly found at the bottom of the graph, from symptoms at follow-up assessment displayed in yellow and mostly found on the top of the graph. (B) Representation of percentage of network variance explained by each network component from the first components on the left to the last components on the right. Red dashed lines indicate the minimum and maximum percentage of variance explained by eigendecomposition of a network composed of 1000 networks composed of the same edges but with randomized structure. Network components located below the dashed lines are considered to be non-meaningful as they explain less percentage of network structure than what observed in a network with random structure. (C) Correlation of Euclidean distance between symptoms according to the third network dimension and empirically observed correlation strength between symptoms. The association of Euclidean distance and correlation strength is computed separately for cross-sectional correlations between symptoms at baseline displayed in green and at longitudinal follow-up displayed in yellow, as well as for longitudinal correlations between symptoms across time displayed in black.
Appendix 1—figure 10

Association of Euclidean distance and correlation strength not considering negative correlations.
(A) Association of Euclidean distance between symptoms according to the first two network dimensions and empirically observed correlation strength, not considering negative correlations, in the 22q11DS sample. (B) Association of Euclidean distance between symptoms according to the first two network dimensions and empirically observed correlation strength, not considering negative correlations, in the NEURAPRO sample. For both samples, the association of Euclidean distance and correlation strength is computed separately for cross-sectional correlations between symptoms at baseline displayed in green and at longitudinal follow-up displayed in yellow, as well as for longitudinal correlations between symptoms across time displayed in black.
Tables
Table 1
Correspondence of items of SIPS and CAARMS clinical interviews.
| Corresponding items of SIPS | Corresponding items of CAARMS | Missing items of SIPS | Missing items of CAARMS | |
|---|---|---|---|---|
| P1 Unusual thought | 1.1 Unusual thought content | D2 Bizarre thinking | 3.3 Inadequate affect | |
| P2 Persecutory ideas | 1.2 Non-bizarre ideas | D4 Personal hygiene | 4.1 Alogia | |
| P4 Pperceptual abnormalities | 1.3 Perceptual abnormalities | G1 Sleep disturbances | 5.1 Social isolation' | |
| P5 Disorganized communication | 1.4 Disorganized speech | 5.4 Aggressive behavior | ||
| N1 Social anhedonia | 4.3 Anhedonia | 6.2 Objective motor functioning | ||
| N2 Avolition | 4.2 Avolition/apathy | 6.3 Subjective bodily sensation | ||
| N3 Expression emotion | 3.2 Blunted affect | 6.4 Subjective autonomic functioning | ||
| N4 Experience emotion | 3.1 Subjective emotional disturbance | 7.1 Mania | ||
| N5 Ideational richness | 2.2 Objective cognitive change | 7.3 Suicidality/self-harm | ||
| N6 Occupational functioning | 5.2 Impaired role functioning | 7.4 Affective instability | ||
| D1 Odd behavior | 5.3 Disorganized behavior | 7.5 Anxiety | ||
| G2 Dysphoric mood | 7.2 Depression | 7.6 OCD | ||
| G3 Motor disturbances | 6.1 Subjective motor functioning | 7.7 Dissociative symptoms' | ||
| G4 Impaired tolerance to stress | 7.8 Impaired subjective tolerance to normal stress | BPRS grandiosity | ||
| D3 Trouble attention | 2.1 Subjective cognitive change |
Additional files
-
Supplementary file 1
Comparison of severity of CAARMS items at baseline between subjects excluded from the NEURAPRO cohort due to missing data and the rest of the sample.
- https://cdn.elifesciences.org/articles/59811/elife-59811-supp1-v2.docx
-
Supplementary file 2
Comparison of severity of CAARMS items at longitudinal follow-up between subjects excluded from the NEURAPRO cohort due to missing data and the rest of the sample.
- https://cdn.elifesciences.org/articles/59811/elife-59811-supp2-v2.docx
-
Source data 1
Source Data for Longitudinal Symptom Network in 22q11DS Sample.
- https://cdn.elifesciences.org/articles/59811/elife-59811-data1-v2.xlsx
-
Source data 2
Source Data for Longitudinal Symptom Network in NEURAPRO Sample.
- https://cdn.elifesciences.org/articles/59811/elife-59811-data2-v2.xlsx
-
Transparent reporting form
- https://cdn.elifesciences.org/articles/59811/elife-59811-transrepform-v2.docx
Download links
A two-part list of links to download the article, or parts of the article, in various formats.
Downloads (link to download the article as PDF)
Open citations (links to open the citations from this article in various online reference manager services)
Cite this article (links to download the citations from this article in formats compatible with various reference manager tools)
Characterization and prediction of clinical pathways of vulnerability to psychosis through graph signal processing
eLife 10:e59811.
https://doi.org/10.7554/eLife.59811


