Sources of widefield fluorescence from the brain
- Allen Institute for Brain Science, United States
Figures
Figure 1
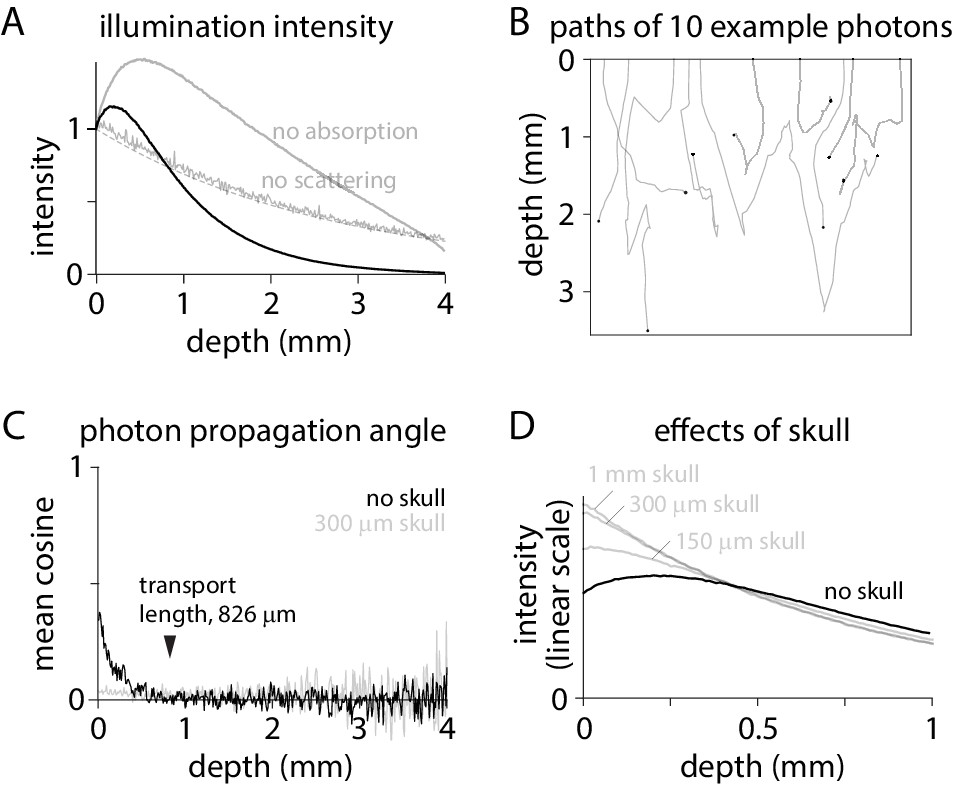
Excitation intensity under widefield illumination.
(A) Intensity as a function of depth, normalized to the intensity at the tissue surface. Dashed line, exponential decay described by the absorption length constant: normalized intensity = exp(- depth * length constant). (B) Trajectories in tissue for 10 photons. Tissue surface is at depth = 0. Black circle: location at which each photon was absorbed by the tissue. (C) Cosine of the mean propagation angle, relative to the optical axis and perpendicular to the tissue surface. Grey: after 300 µm of skull. (D) Intensity in brain tissue without (black) and with skull (grey; 1 mm, 300 µm and 100 µm skull), normalized to the total intensity in brain tissue.
Figure 2
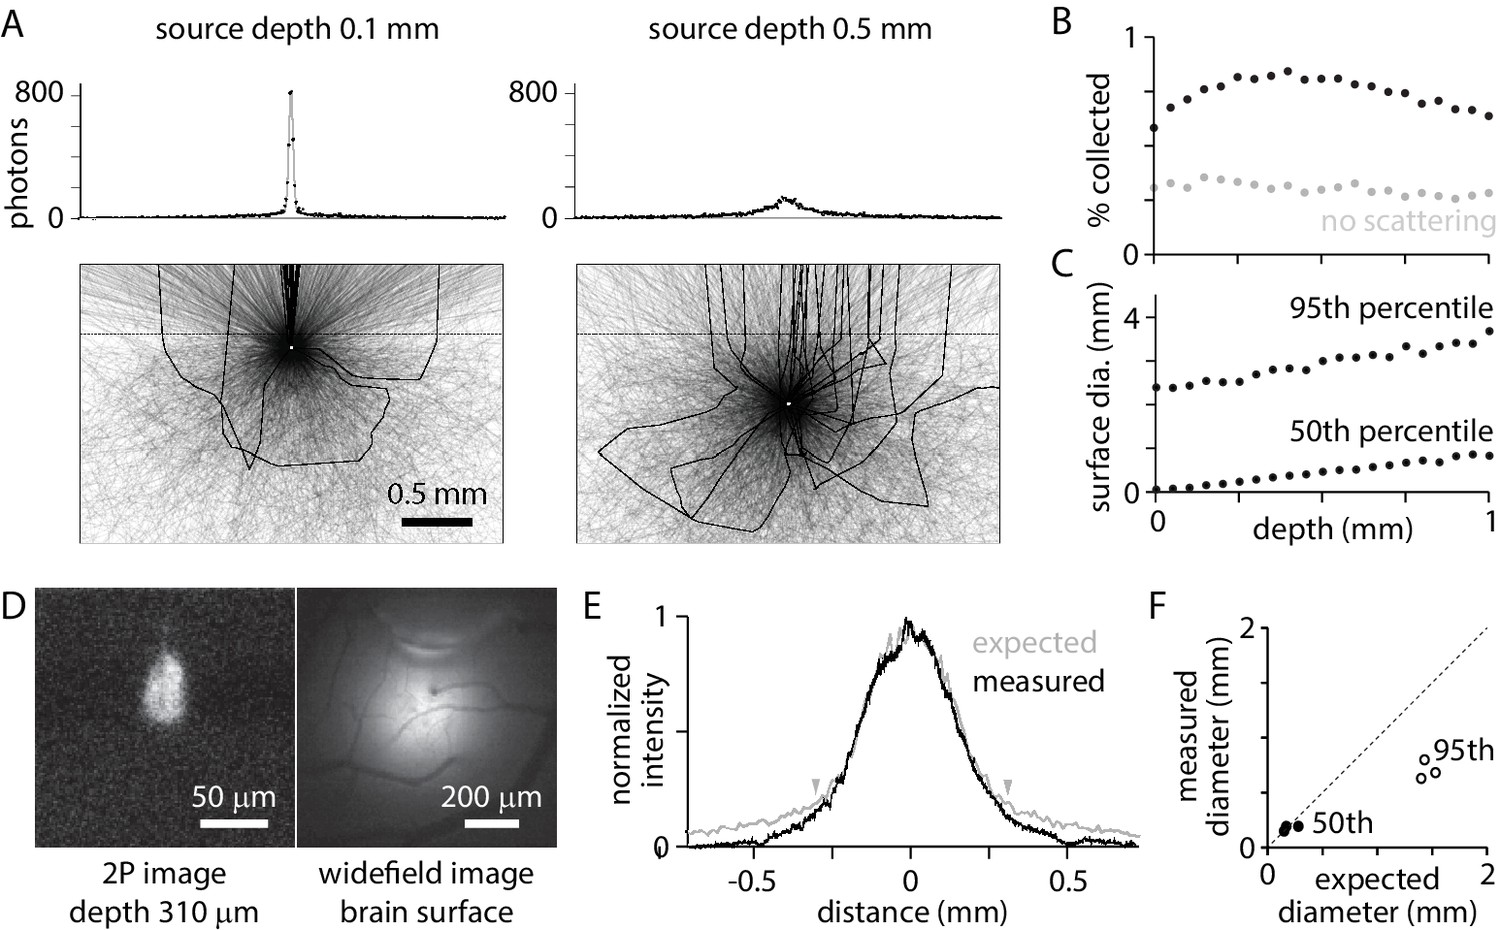
Widefield fluorescence collection.
(A) Trajectories of 3000 photons from a point source (white circle) at 0.1 mm (left) and 0.5 mm (right) below the tissue surface. Black: trajectories of collected photons (23 photons from 0.1 mm, 22 photons from 0.5 mm). Grey: trajectories of photons absorbed in tissue or that exit tissue outside the collection angle of the objective. Dashed line, tissue surface. Histograms: sum of photons at different surface locations. 106 photons (~5000 collected) in 10 µm bins. (B) Percentage of photons collected, as a function of source depth. (C) Diameter of the patch of fluorescence at the surface, for sources at different depths. Plot illustrates the diameters that include 50% and 95% of captured photons. (D) 2-photon and widefield images of a bolus of fluorescent beads injected into mouse cortex, with the focal planes 310 µm below and at the brain surface, respectively. (E) Measured surface distribution (from the example in D) and the expected fluorescence distribution, simulated for a point source at a depth of 310 µm. Arrowheads mark the locations between which 75% of photons are expected at the surface. (F) Comparison of measured and expected diameters that include 50% (black) and 95% (grey) of photons at the surface, for three experiments with beads at depths of 165, 190, and 310 µm.
Figure 3
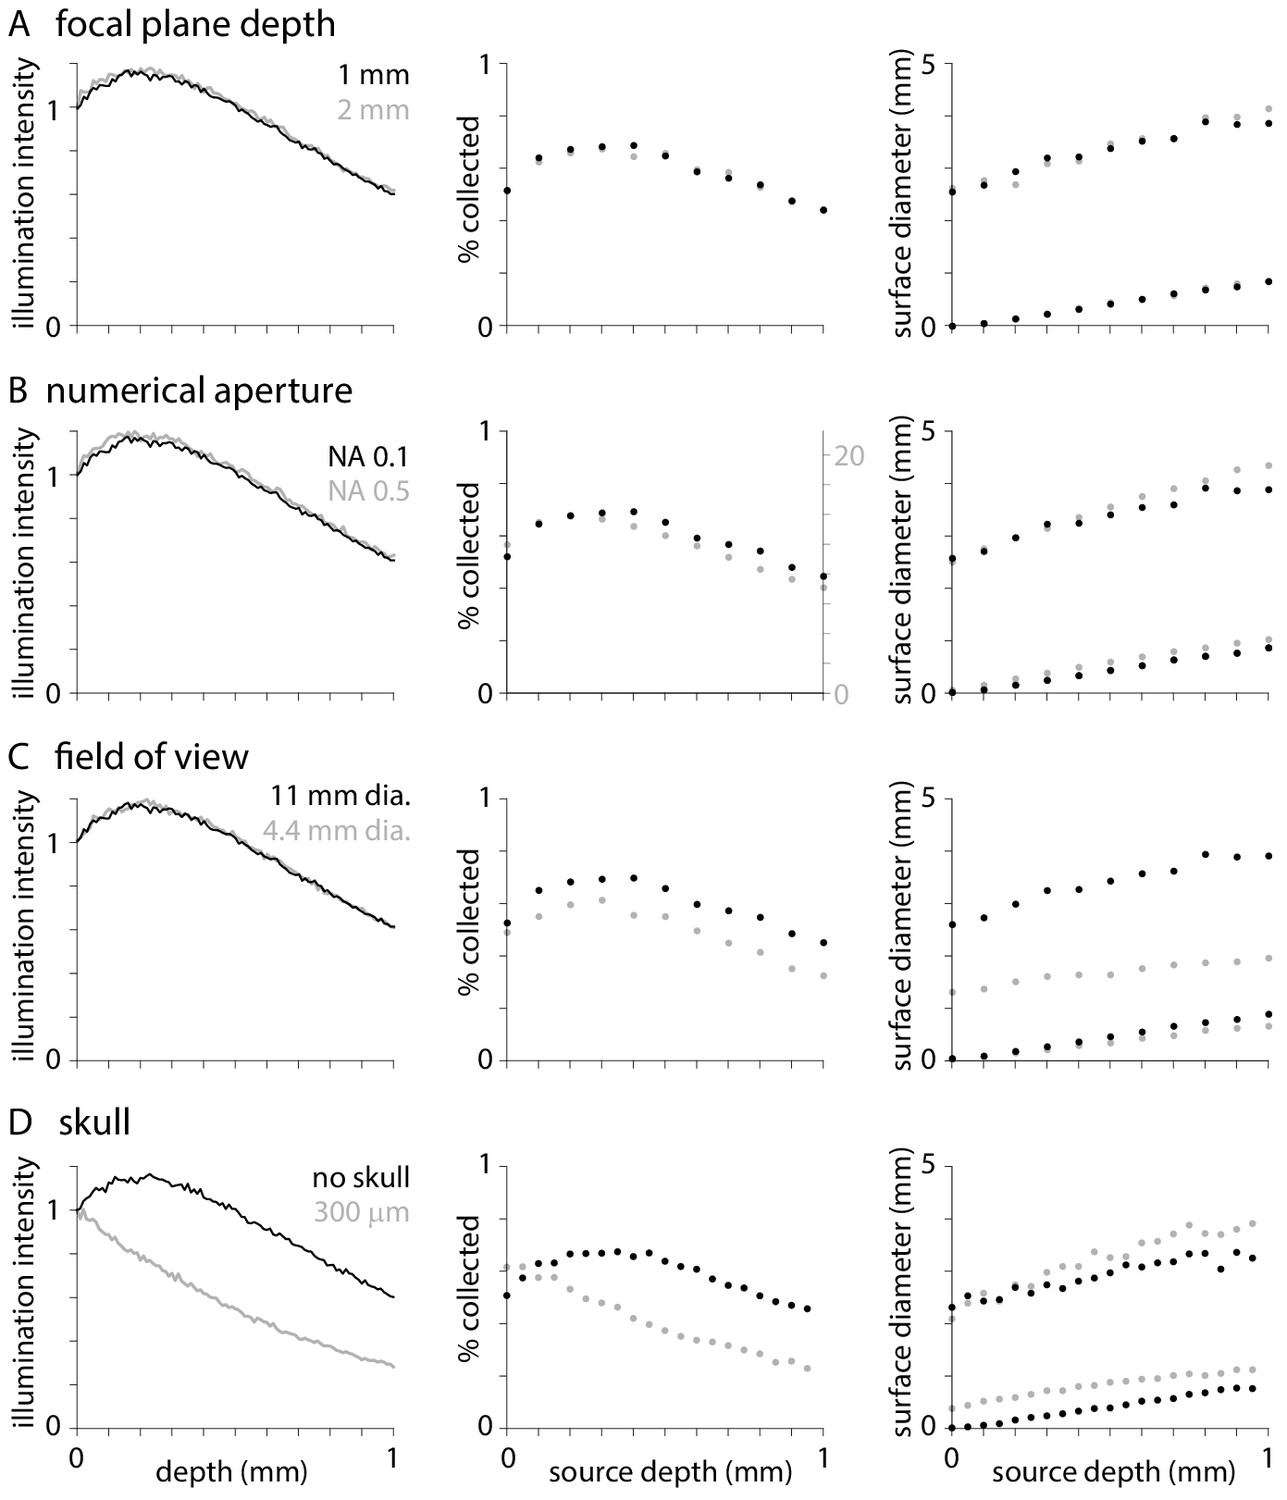
Effects of optical parameters on illumination and fluorescence collection.
Normalized illumination intensity (c.f.Figure 1A), percentage of photons collected (c.f. Figure 2B) and diameters that include 50 and 95% of surface fluorescence (c.f. Figure 2C) with the objective focused at depths of 1 and 2 mm below the tissue surface (A), with objectives of numerical aperture 0.1 and 0.5 (B), with objectives of 11 and 4.4 mm field of view (C), and when imaging through no and 300 µm of skull. In each plot, black symbols represent results with an objective with NA 0.1 and 11 mm field of view focused 1 mm below the tissue surface with no overlying skull. For collection efficiency, results from different numerical apertures are displayed on different y-axes to facilitate comparison.
Figure 4

Illumination and fluorescence collection under blood vessels.
(A and B) Images illustrating illumination intensity around 100 µm and 250 µm radius surface blood vessels. (C and D) Illumination intensity (normalized to the brain surface with no blood vessel) and fluorescence collection as a function of depth below the center of the blood vessel.
Figure 5
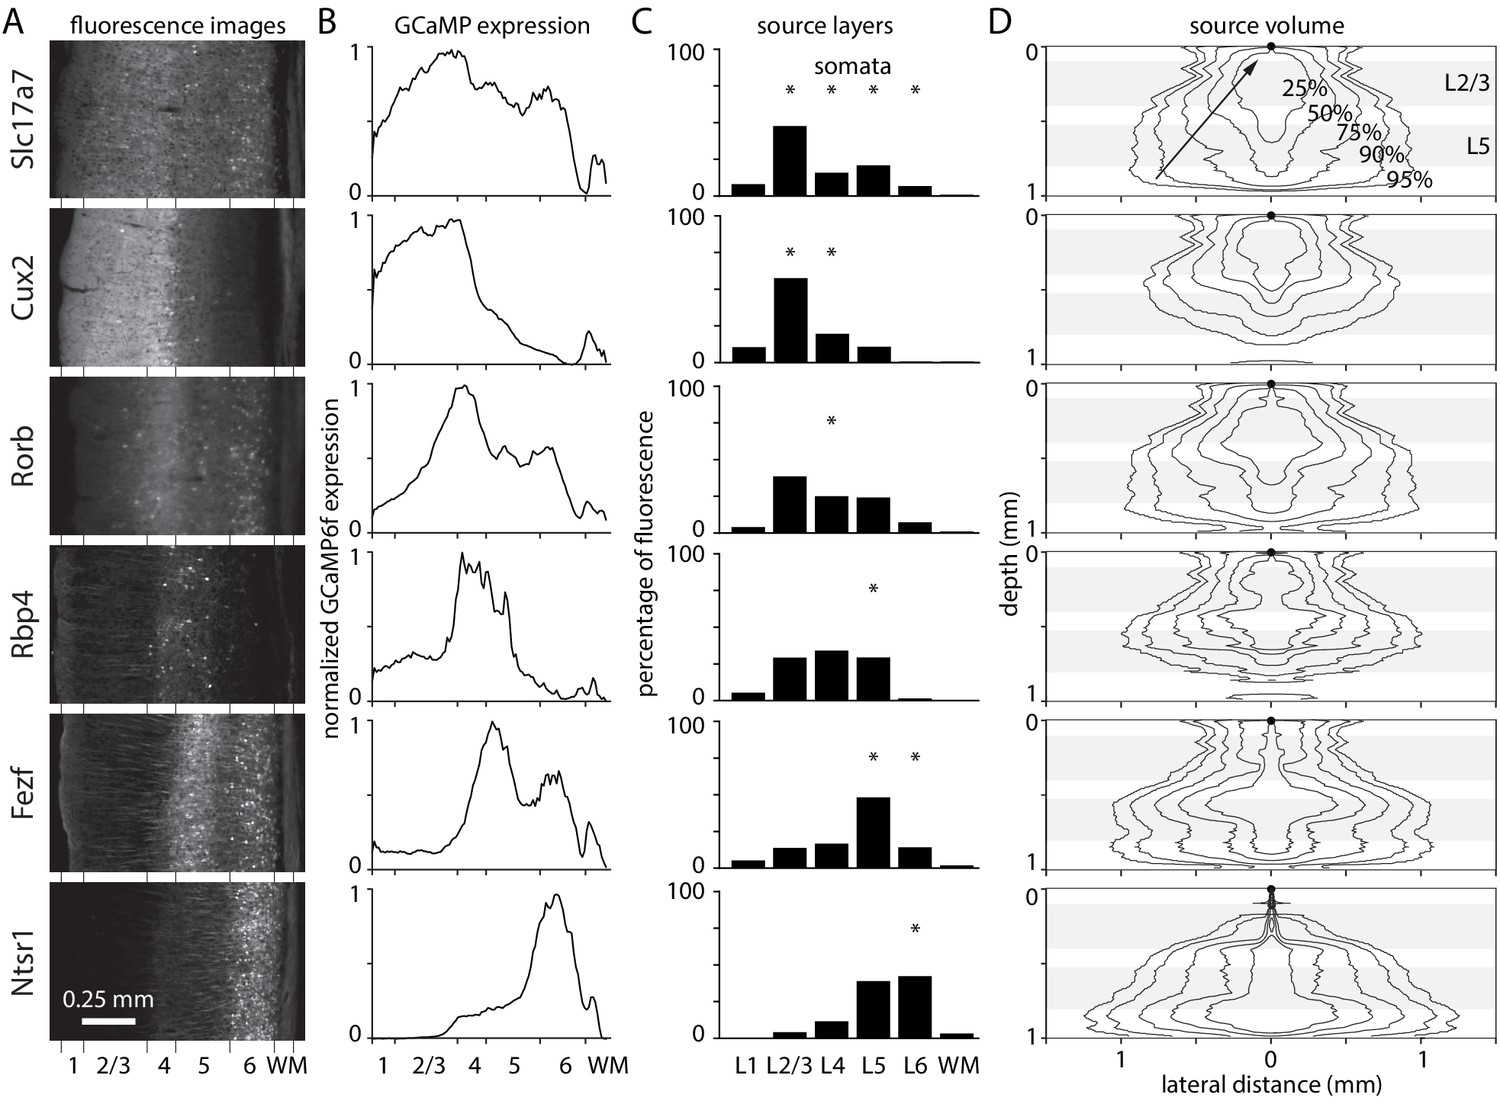
Laminar fluorescence in GCaMP mouse lines.
(A) Fluorescence images from coronal sections of mouse primary visual cortex in six mouse lines, from the Allen Brain Observatory. (B) Fluorescence in coronal sections in panel A, as a function of depth and normalized to maximum for each mouse. (C) Widefield fluorescence in vivo, the product of expression (panel B), excitation intensity through a cranial window (Figure 1), and percentage of fluorescence photons collected (Figure 2). Widefield fluorescence is expressed by layer, as a percentage of total fluorescence from pia to the base of white matter. Asterisks: layers with most somata. (D) 2-dimensional illustrations of the volume of tissue from which photons propagate to a single location on the brain surface (black circle at 0 depth, 0 lateral distance), arriving within the collection angle of the objective lens. Lines encircle the voxels contributing the most photons, that together contribute 25, 50, 75, 90, and 95% of collected photons. Grey bands indicate the depths of layers 2/3 and 5.
Additional files
Download links
A two-part list of links to download the article, or parts of the article, in various formats.
Downloads (link to download the article as PDF)
Open citations (links to open the citations from this article in various online reference manager services)
Cite this article (links to download the citations from this article in formats compatible with various reference manager tools)
Sources of widefield fluorescence from the brain
eLife 9:e59841.
https://doi.org/10.7554/eLife.59841


