Ordered dephosphorylation initiated by the selective proteolysis of cyclin B drives mitotic exit
- Department of Biochemistry, University of Oxford, United Kingdom
Figures
Figure 1
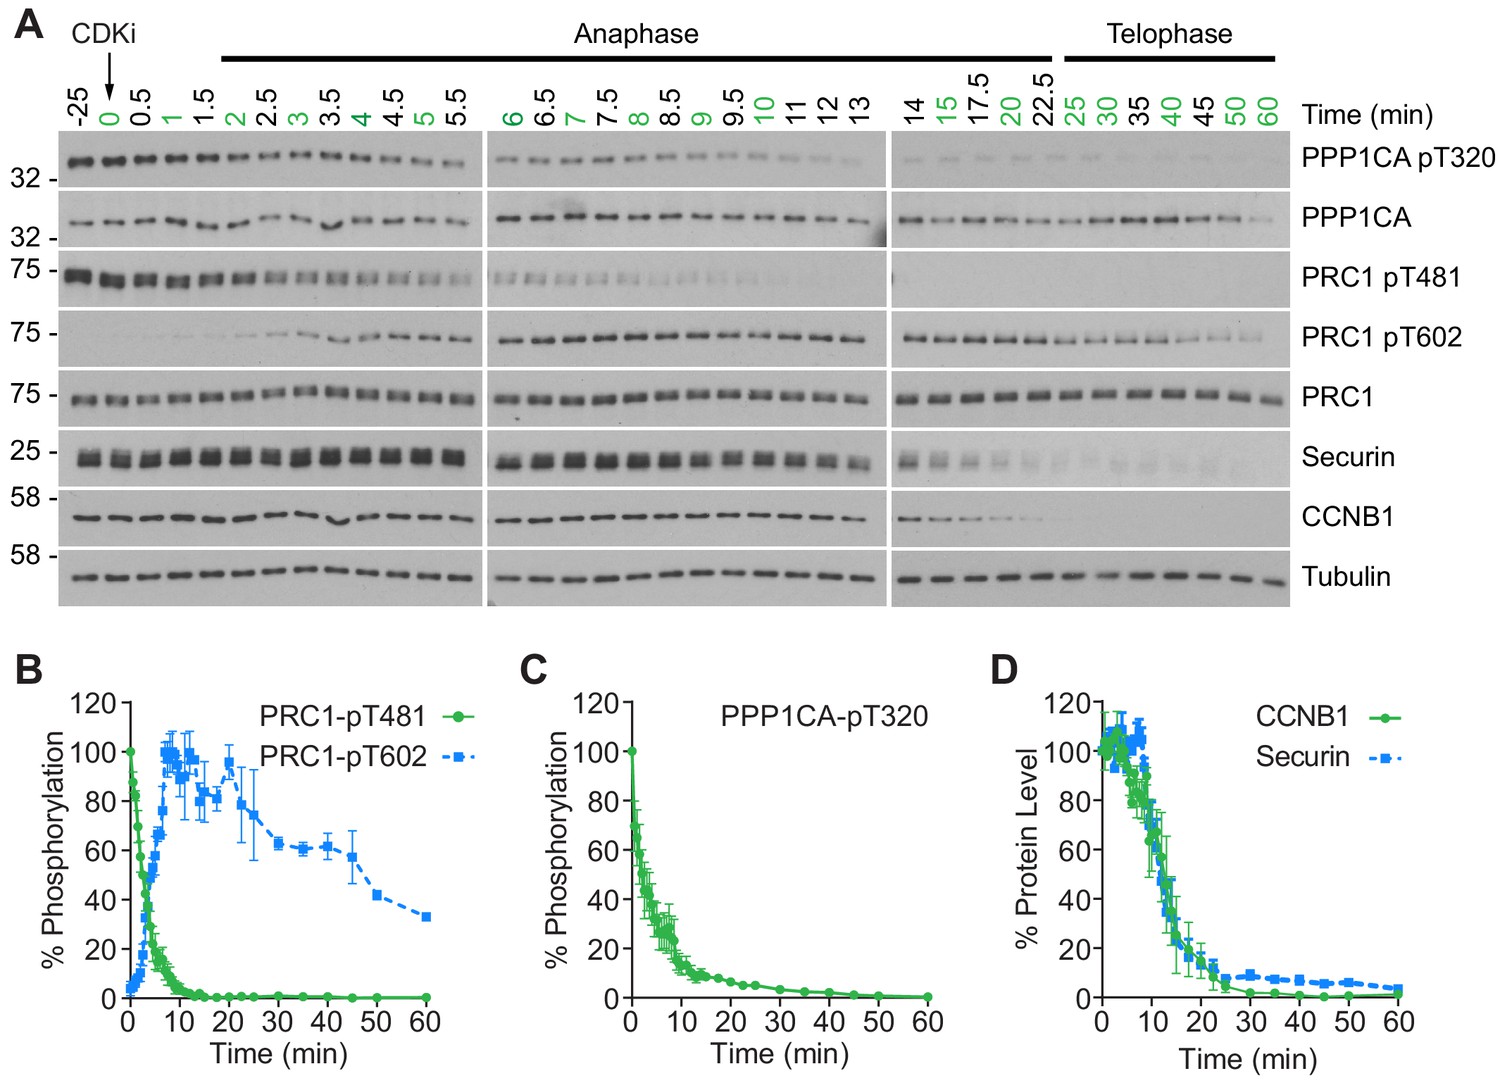
CDK inhibition promotes orderly mitotic exit.
(A) Mitotically arrested cells were washed out from nocodazole, at 37°C 5% CO2, and the CDK inhibitor (CDKi) flavopiridol was added at 0 min. Samples were taken at the indicated timepoints, with those used for subsequent mass spectrometry analysis highlighted in green. Densitometric quantification of repeat experiments, as in (A) (Mean ± SEM) is shown for (B) PRC1-pT481 (n = 3), pT602 (n = 2), (C) PPP1CA-pT320 (n = 3), and for (D) CCNB1 and securin protein level (n = 3).
Figure 2 with 1 supplement
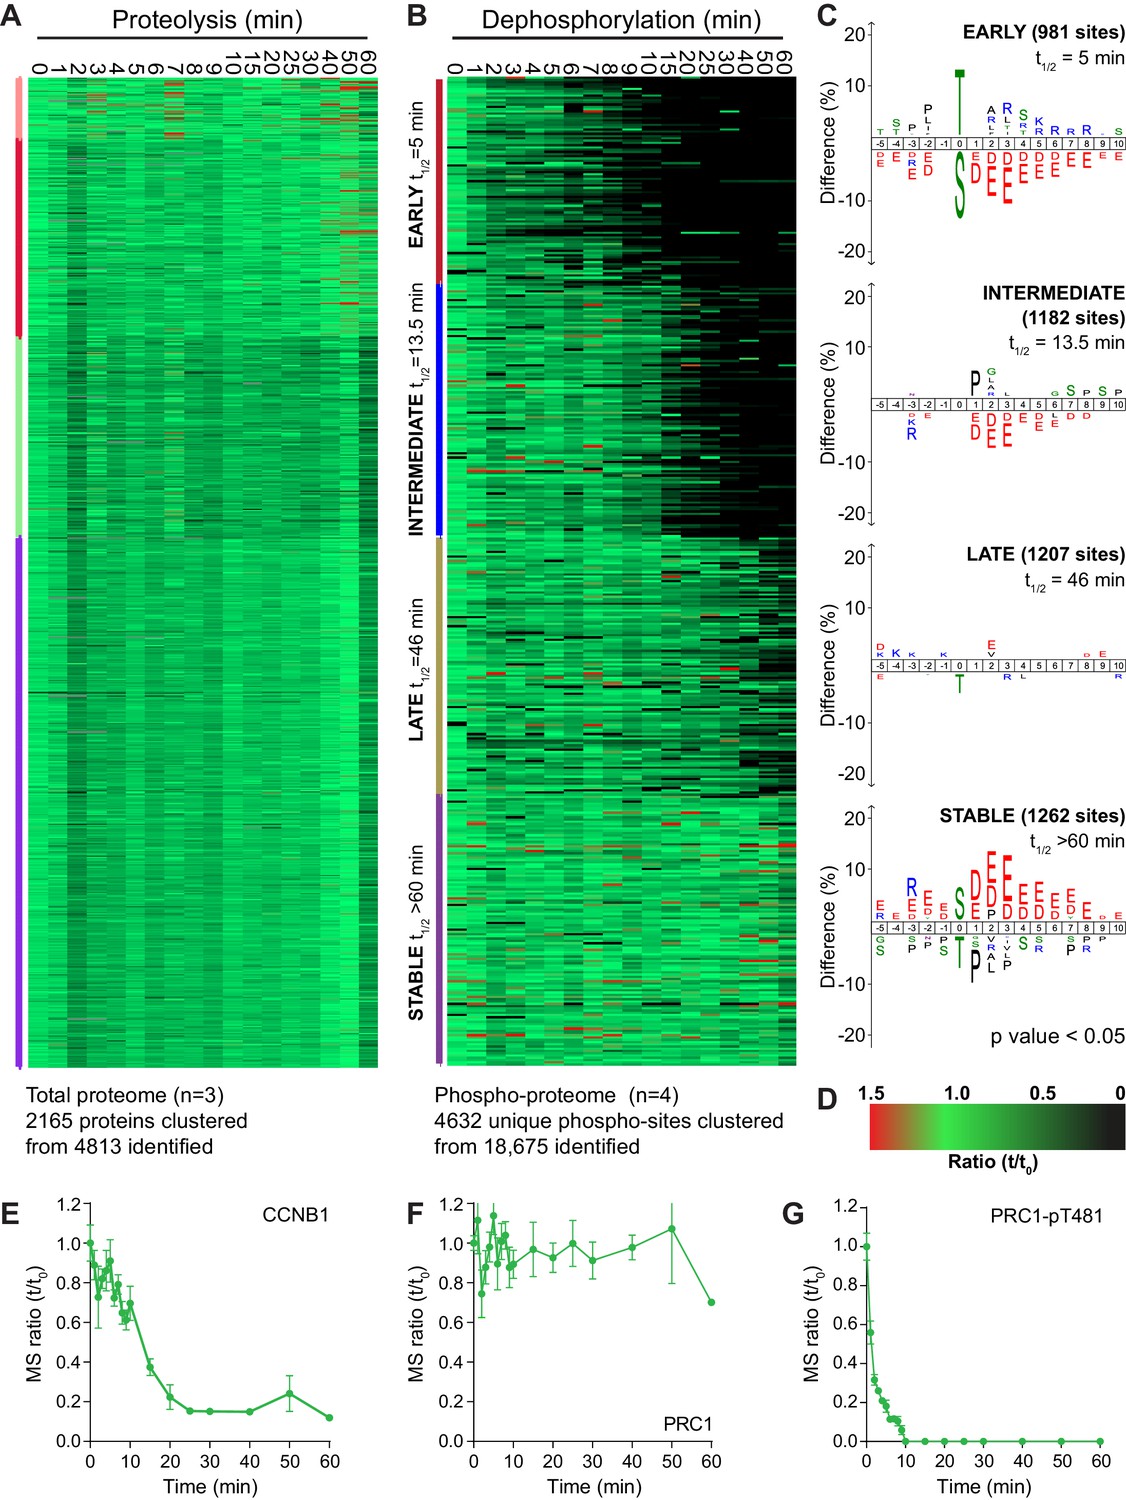
An ordered cascade of dephosphorylation during mitotic exit.
HeLa cells were arrested in mitosis and mitotic exit triggered as previously described in Figure 1. Heatmap of (A) protein groups (Figure 2—source data 1) or (B) phospho-sites (Figure 2—source data 2) clustered based on trends over time. The coloured bar adjacent to each heatmap indicates the limits of each cluster, with each coloured section corresponding to one cluster. Time is shown in minutes. (C) Sequence logo analysis showing the relative enrichment of residues in the adjacent cluster from (B). The number of phospho-sites and average half-life for each cluster is indicated. (D) Key linking heatmap colour with observed ratio. Quantitative ratio of (E-F) CCNB1 and PRC1 protein level (n = 3) or (G) PRC1-pT481 phosphorylation (Mean ± SEM, n = 4).
-
Figure 2—source data 1
Total proteome data and clustering analysis of mitotic exit triggered using CDK inhibtion.
- https://cdn.elifesciences.org/articles/59885/elife-59885-fig2-data1-v3.xlsx
-
Figure 2—source data 2
Phospho-proteome data and clustering analysis of mitotic exit triggered using CDK inhibtion.
- https://cdn.elifesciences.org/articles/59885/elife-59885-fig2-data2-v3.xlsx
-
Figure 2—source data 3
Total and phospho-proteomic data and clustering analysis of mitotic exit triggered using MPS1 inhibtion.
- https://cdn.elifesciences.org/articles/59885/elife-59885-fig2-data3-v3.xlsx
Figure 2—figure supplement 1
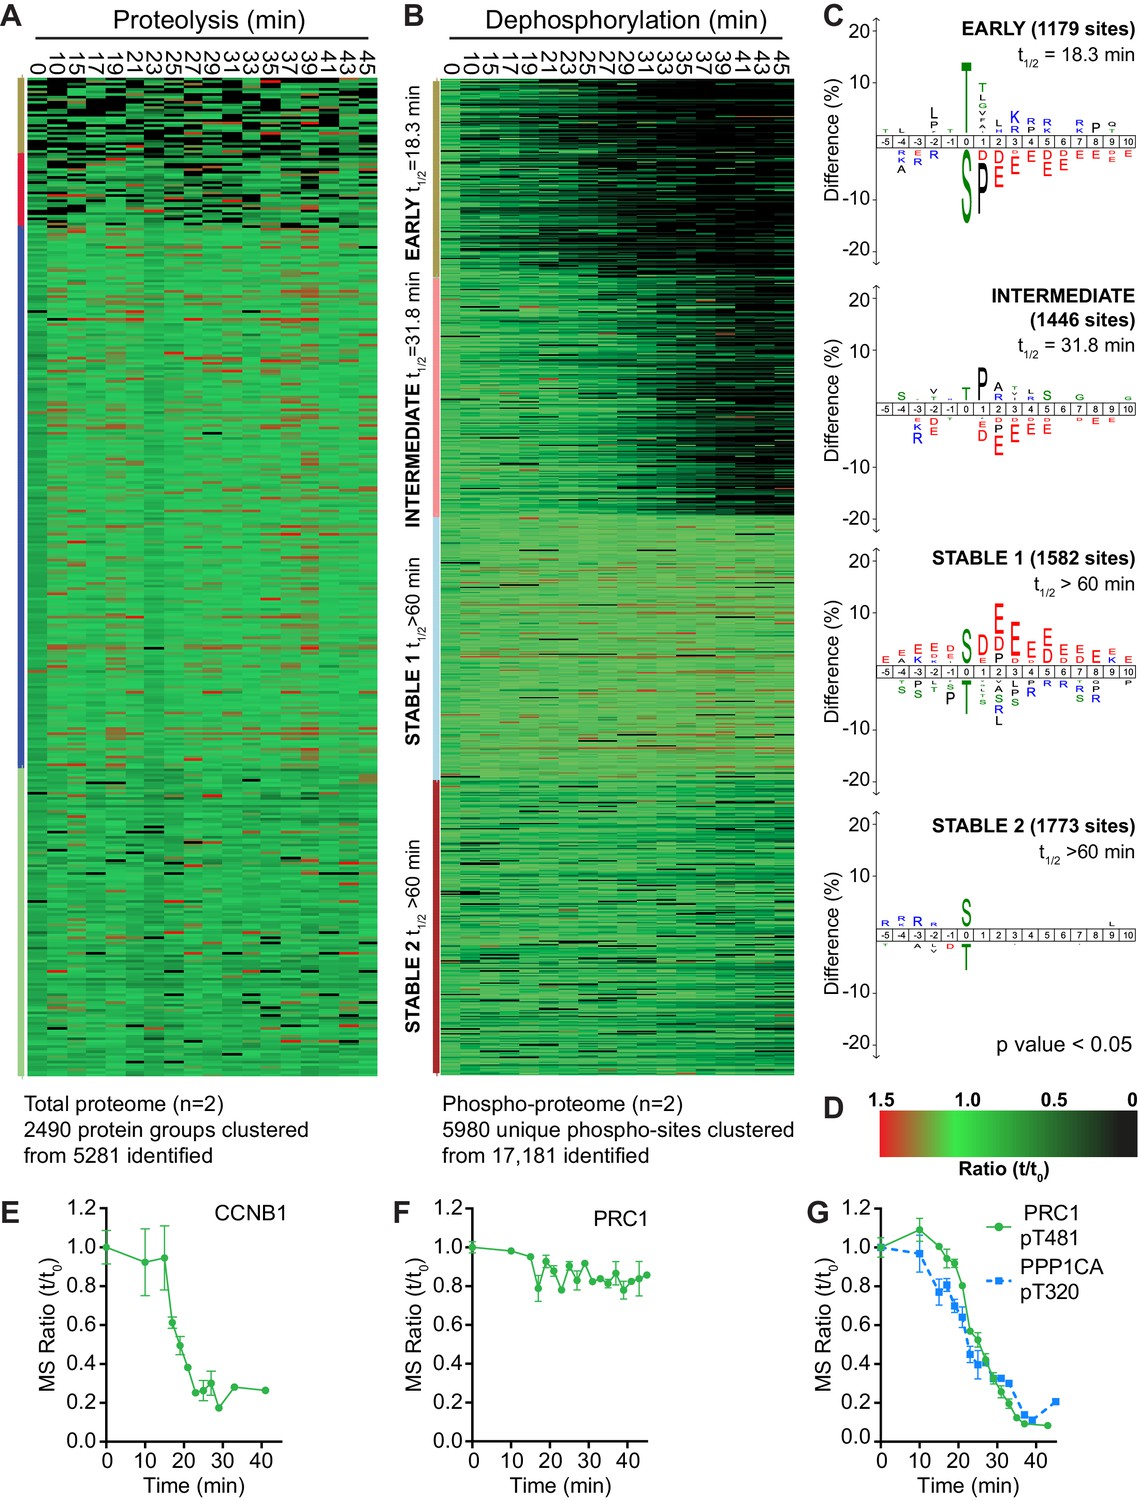
An ordered cascade of dephosphorylation in anaphase A and B.
HeLa cells were arrested in mitosis and mitotic exit triggered by MPS1 inhibition with AZ3146 (Hayward et al., 2019). Heatmap of (A) protein groups or (B) phospho-sites clustered based on trends over time (Figure 2—source data 3). The coloured bar adjacent to each heatmap indicates the limits of each cluster, with each coloured section corresponding to one cluster. Time is shown in minutes. (C) Sequence logo analysis showing the relative enrichment of residues in the adjacent cluster from (B). The number of phospho-sites and average half-life of each cluster is indicated. (D) Key linking heatmap colour with observed ratio. Quantitative ratio of (E-F) CCNB1 and PRC1 protein level or (G) PPP1CA-pT320 and PRC1-pT481 phosphorylation (Mean ± SEM, n = 2).
Figure 3 with 1 supplement
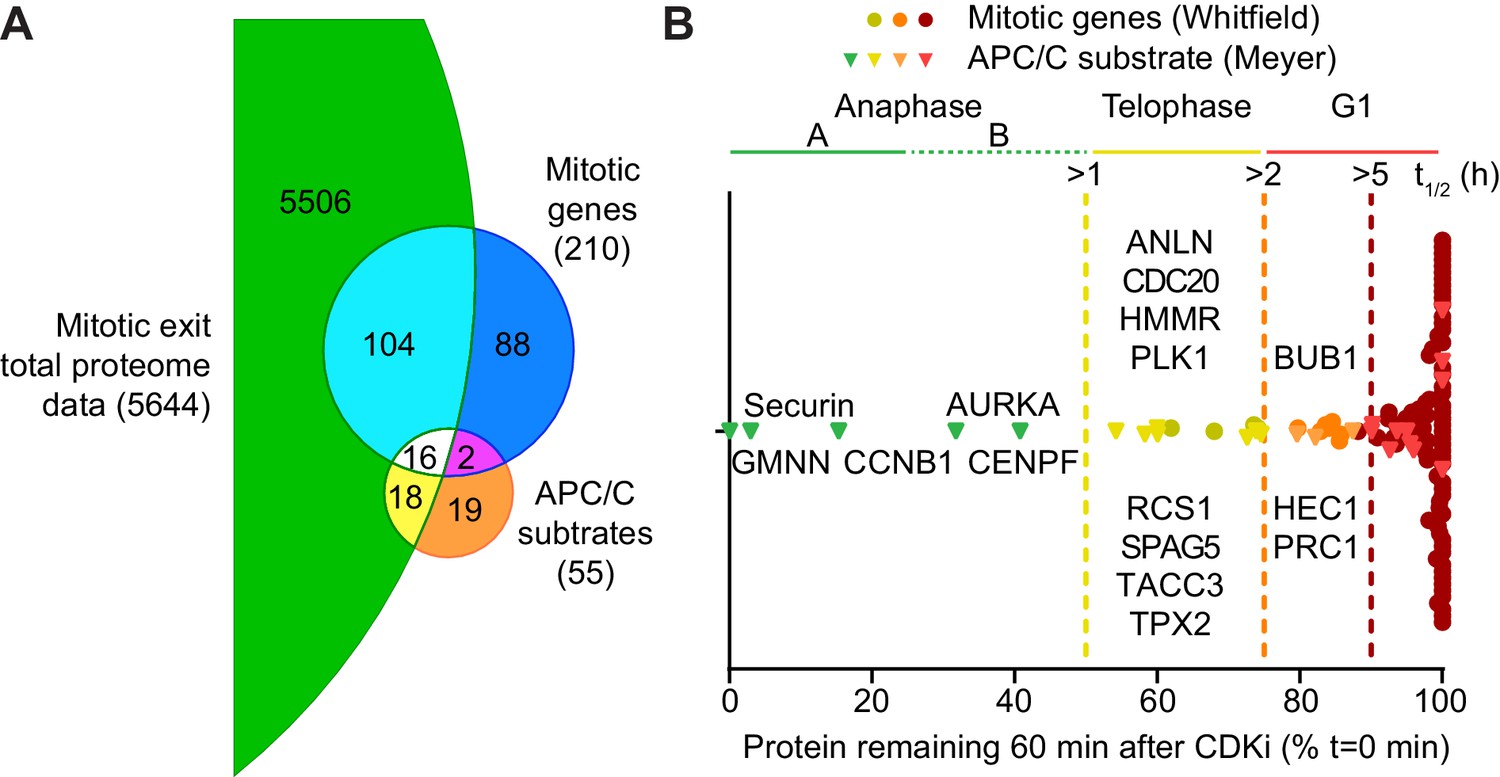
Selective proteolysis of cyclin B, geminin and securin in anaphase A.
(A) Venn diagram comparison of the proteins identified here by mass spectrometry with mitotic genes transcribed in G2 of the cell cycle and validated APC/C substrates. These reference lists were obtained from Whitfield et al., 2002 and Meyer and Rape, 2011, respectively. Numbers indicate how many identifications are in each region. (B) Proteins identified by mass spectrometry plotted according to the percentage of protein remaining 60 min after CDK inhibition (Figure 3—source data 1). Corresponding western blot samples were used for the analysis of securin levels following CDK inhibition. Vertical lines indicate various set half-lives for degrading proteins. The corresponding cell cycle stage is indicated above the graph. Proteins found in both the Whitfield and Meyer papers were classified as APC/C substrates.
-
Figure 3—source data 1
Fractionated total proteome data and clustering analysis of mitotic exit triggered using CDK inhibtion.
- https://cdn.elifesciences.org/articles/59885/elife-59885-fig3-data1-v3.xlsx
Figure 3—figure supplement 1
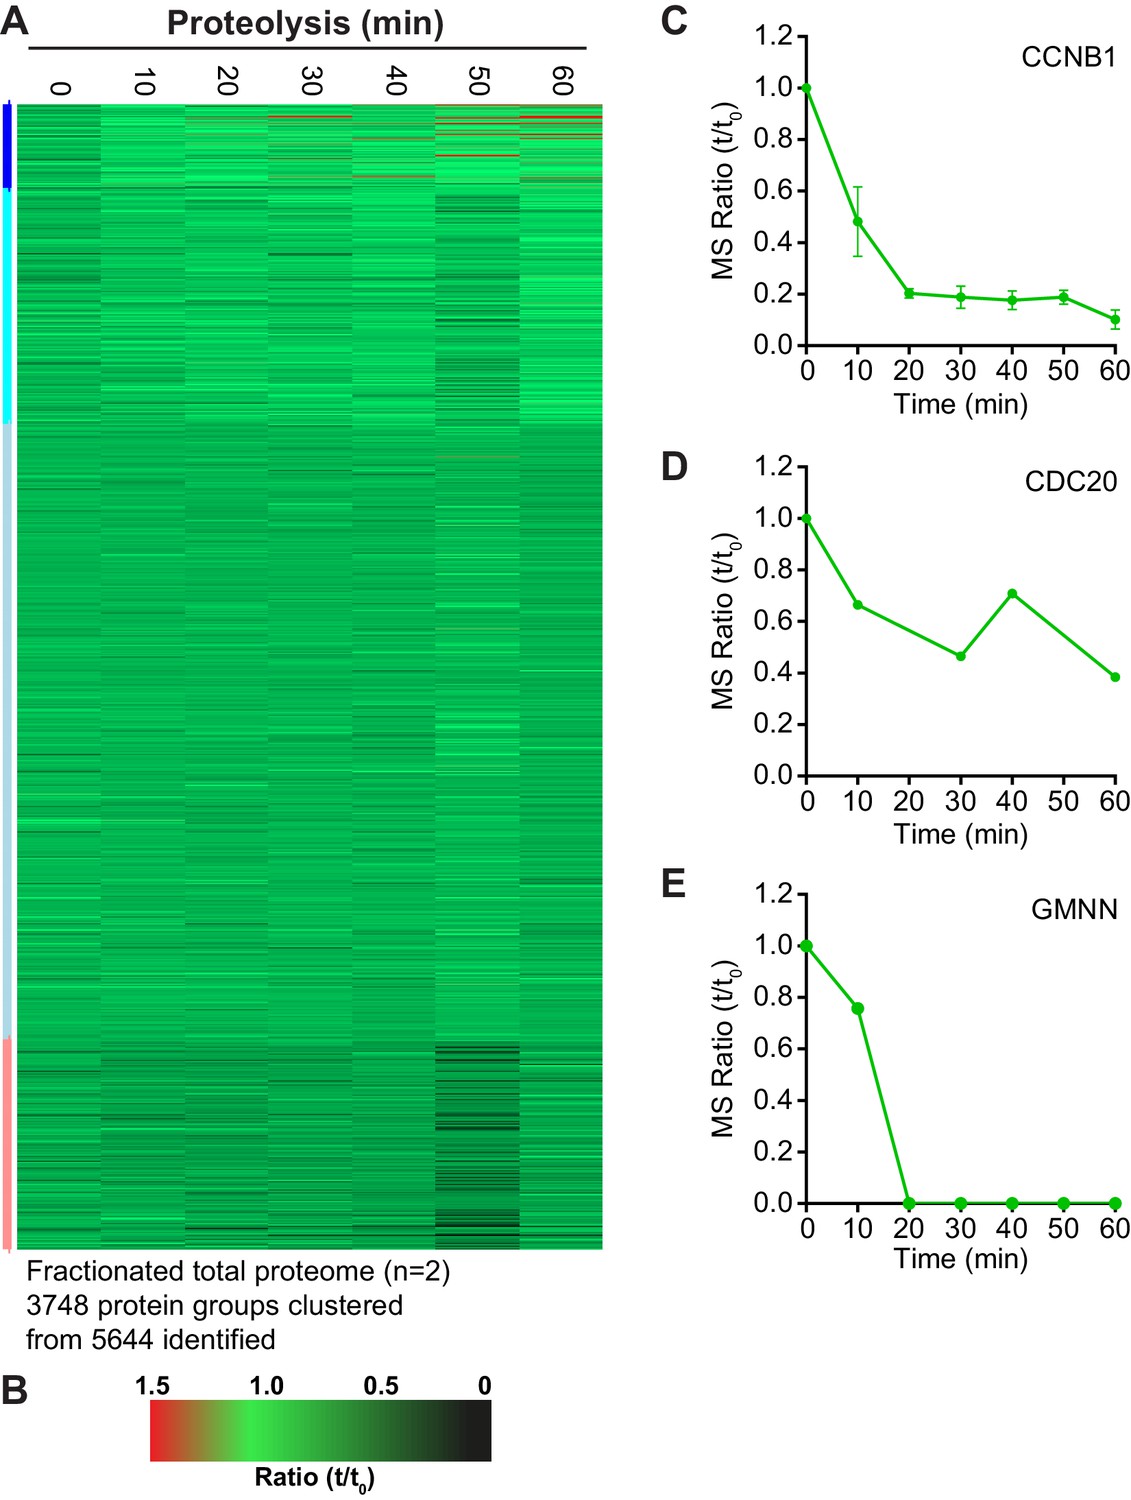
Clustering analysis of fractionated anaphase proteomes.
(A) Heatmap of clustered protein groups generated from fractionated total proteome samples (n = 2) (Figure 3—source data 1). The coloured bar adjacent to the heatmap indicates the limits of each cluster, with each coloured section corresponding to one cluster (B) Key linking heatmap colour with observed ratio. Quantitative ratio of the protein levels of (C) CCNB1 (Mean ± SEM, n = 2), (D) CDC20 (n = 1) and (E) Geminin (GMNN) (n = 1).
Figure 4 with 1 supplement
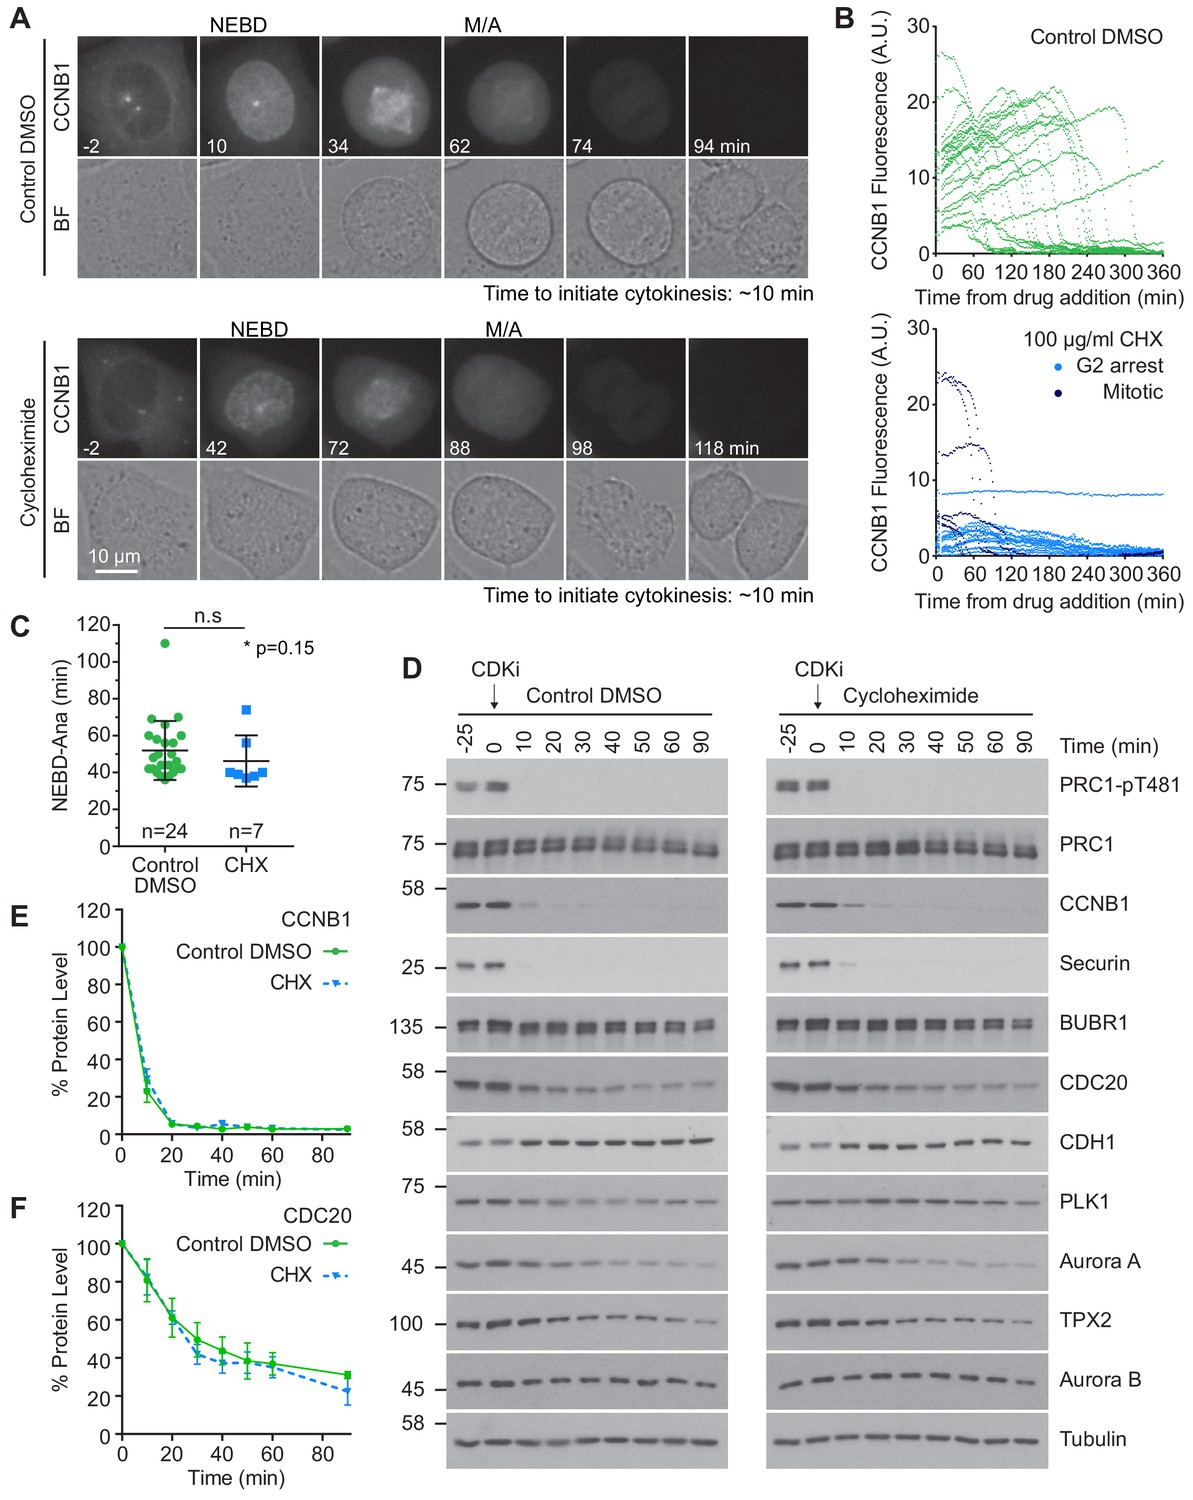
Protein synthesis does not impact mitotic progression nor account for the differences in the apparent rate of proteolysis during mitotic exit.
(A) Live cell imaging of endogenously CRISPR-tagged CCNB1, following addition of either DMSO as a control or 100 µg/ml cycloheximide (CHX). (B) Fluorescence intensity plot of all cells within the field of view following drug addition (DMSO n = 24, CHX n = 21, from a single experiment). Times shown in (A–B) are relative to the point of drug addition. (C) Statistical analysis of the time cells from (A) spent in mitosis using a Mann-Whitney test, * denotes the calculated p-value (DMSO n = 24, CHX n = 7). Images shown are sum intensity projections, quantification was carried out on sum intensity projections. (D) Mitotically arrested HeLa cells were washed out from nocodazole and treated with either DMSO or 100 µg/ml CHX for 25 min prior to CDK inhibition with flavopiridol. Samples were harvested as indicated and analysed by western blot. (E–F) Densitometric quantification of protein level, from western blot data (D), for indicated protein (Mean ± SEM, n = 3).
Figure 4—figure supplement 1
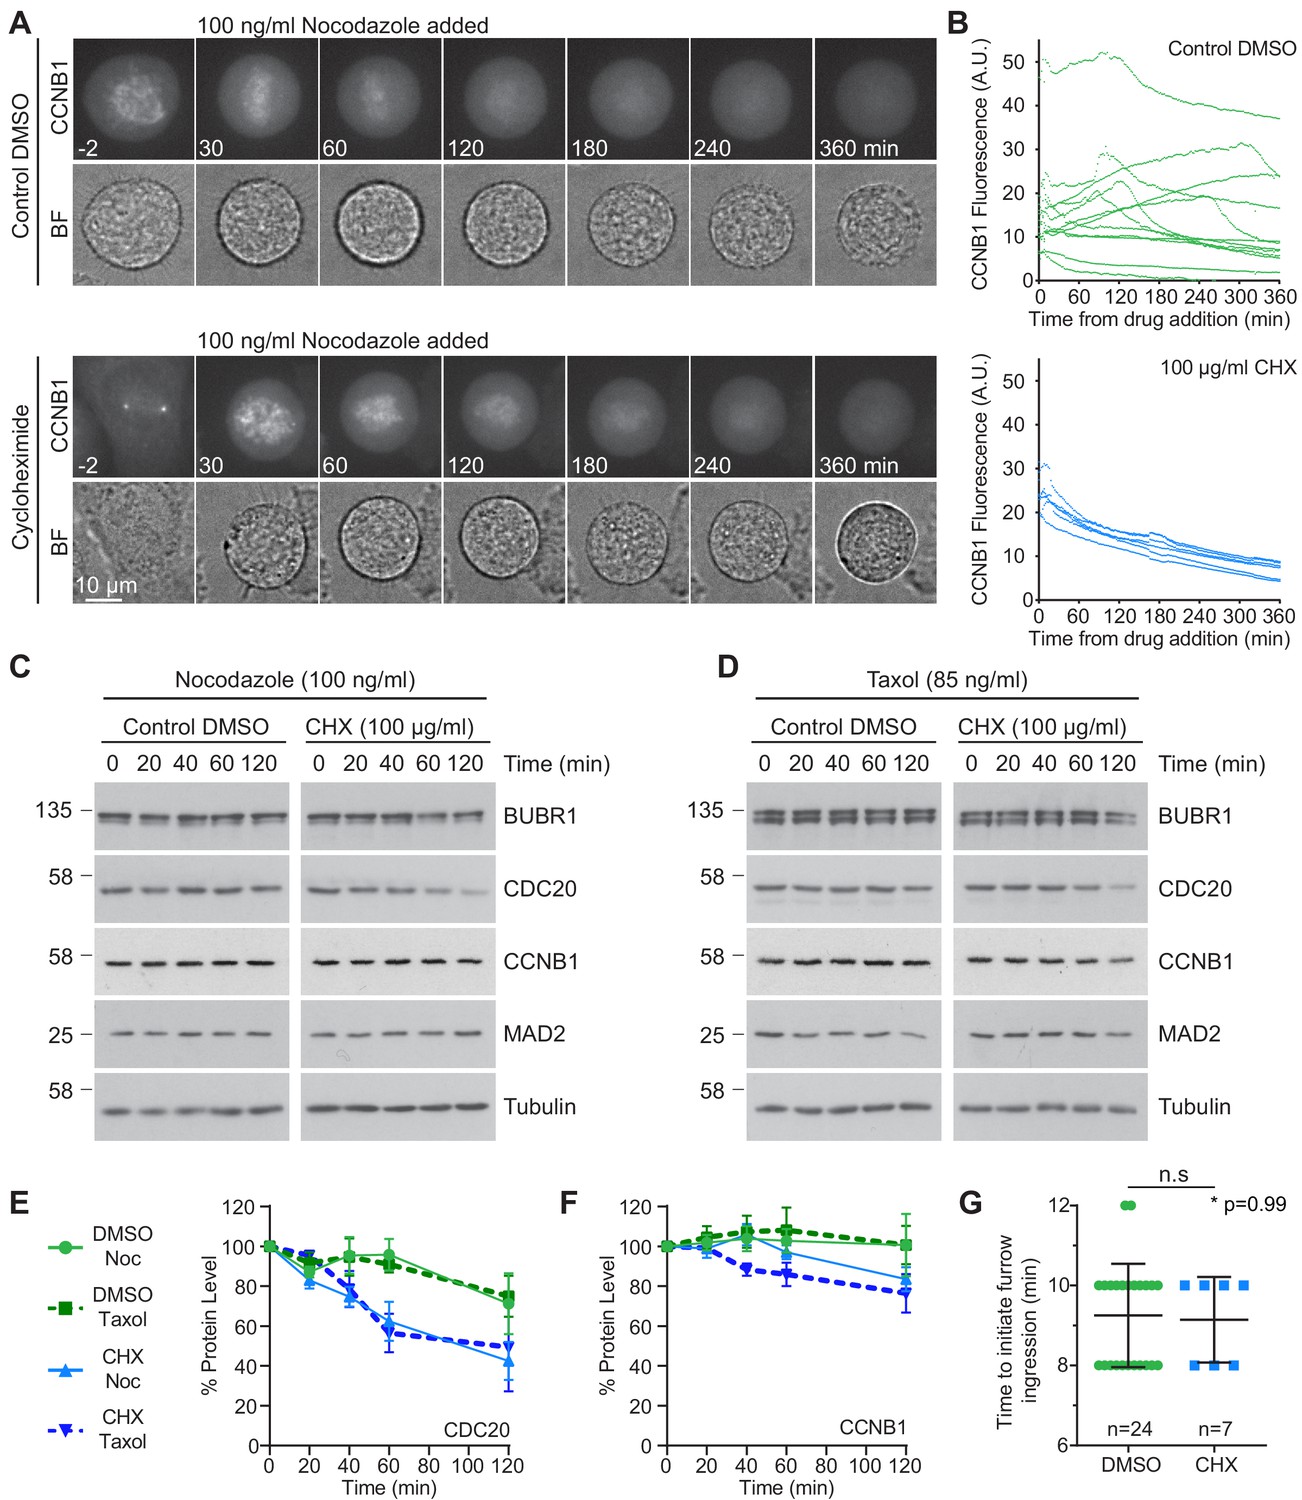
Ongoing protein synthesis is not required to maintain spindle assembly checkpoint-dependent arrest during mitosis.
(A) Live cell imaging of endogenously CRISPR-tagged CCNB1, following addition of 100 ng/ml nocodazole with either DMSO as a control or 100 µg/ml cycloheximide (CHX). (B) Raw fluorescence intensity plot of cells over time after drug addition (DMSO n = 12, CHX n = 6, from a single experiment). Only cells which enter mitosis are shown on the graph. Images shown are sum intensity projections, quantification was carried out on sum intensity projections. All times shown are relative to the point of drug addition. (C–D) Cells were arrested in mitosis using (C) nocodazole or (D) taxol, prior to the addition of either DMSO or 100 µg/ml CHX, to inhibit protein synthesis. Changes in protein level were then followed by western blot. Densitometric quantification of western blot data from (C–D) for (E) CDC20 or (F) CCNB1 (Mean ± SEM, n = 3). (G) Statistical analysis of the time taken for cells from Figure 4A to initiate cleavage furrow ingression following chromosome separation using a Mann-Whitney test, * denotes the calculated p-value.
Figure 5
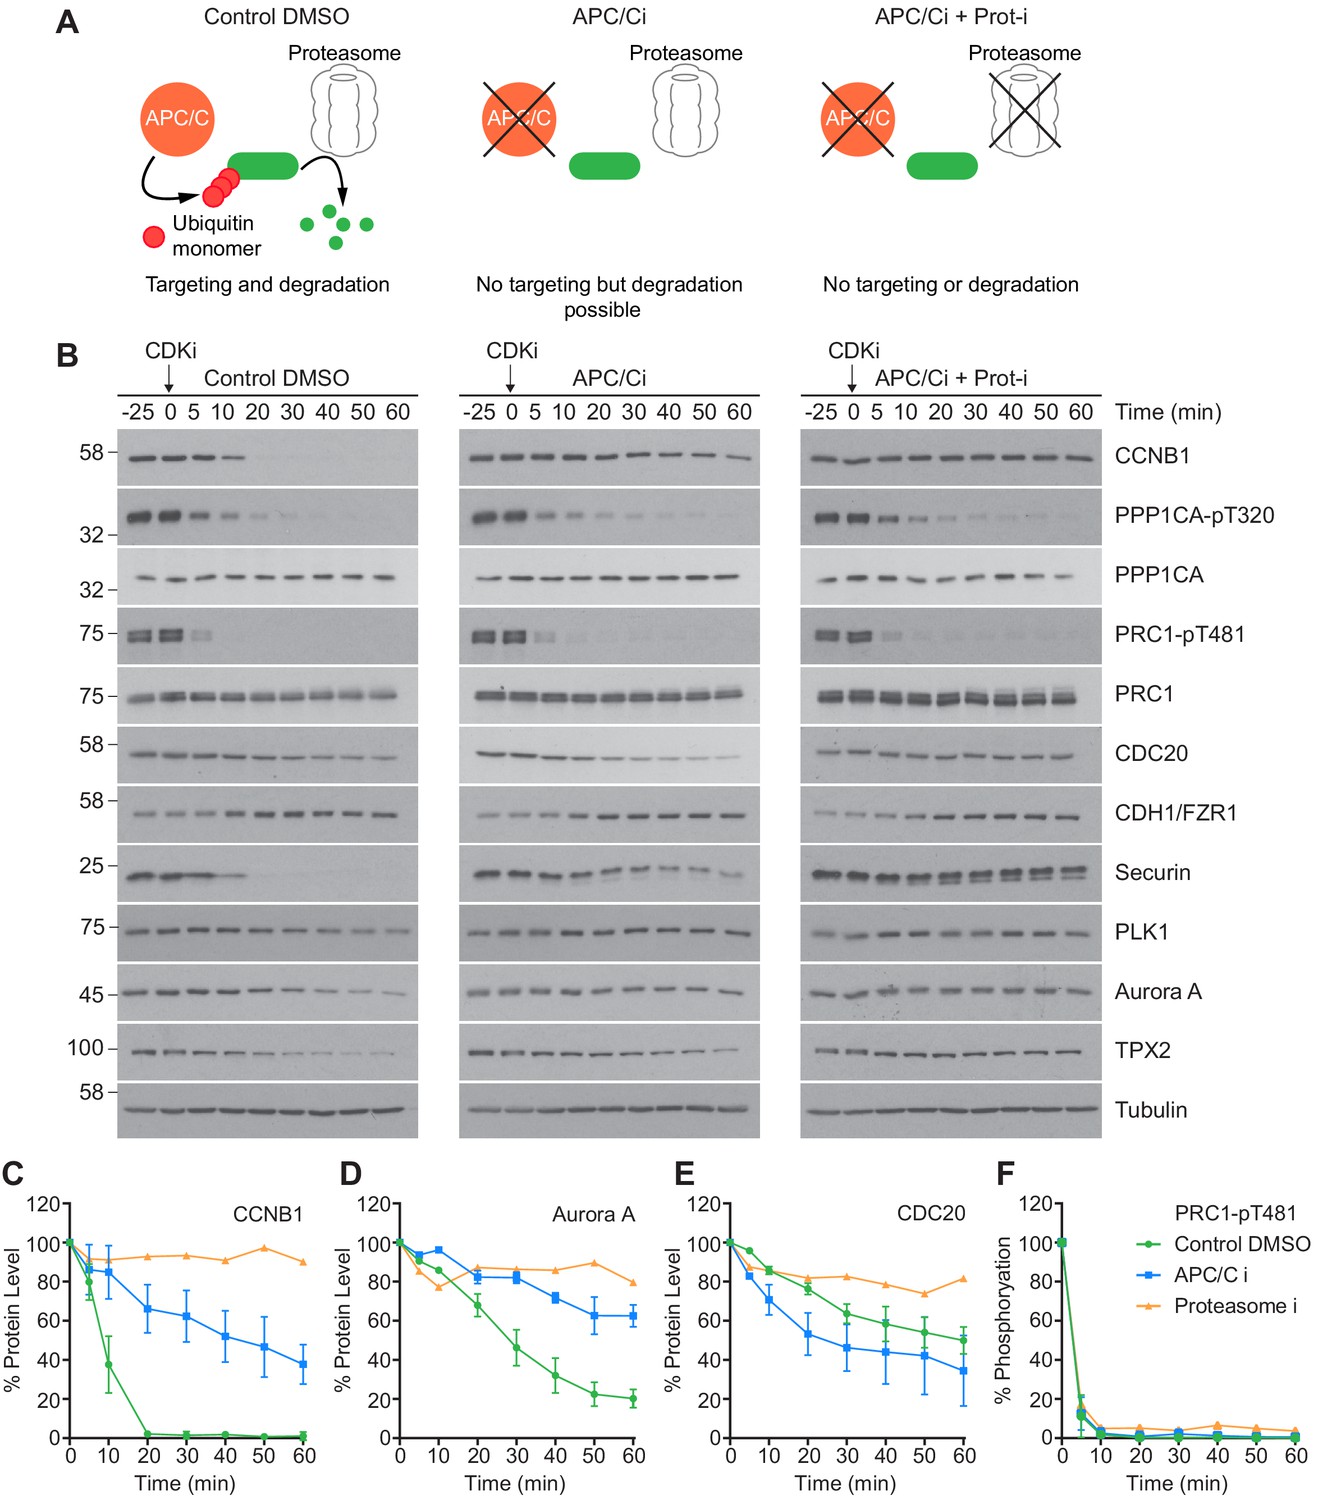
CDK inhibition in the absence of APC/C or proteasome activity triggers mitotic exit.
HeLa cells were arrested in mitosis as previously described. (A) Schematic detailing the APC/C and proteolytic activities in each condition. (B) Western blot showing the protein levels and phosphorylation state in mitotically arrested HeLa cells, following CDK inhibition, in the presence or absence of APC/C inhibitors (APC/Ci), 400 µM apcin and 25 µM pro-TAME, or APC/C and proteasome inhibitors (Proteasome-i), 40 µM MG-132. Densitometric quantification of the levels of (C) CCNB1, (D) Aurora A, (E) CDC20 and (F) PRC1-pT481 (Mean ± SEM, Control and APC/Ci n = 2, proteasome-i n = 1).
Figure 6 with 1 supplement
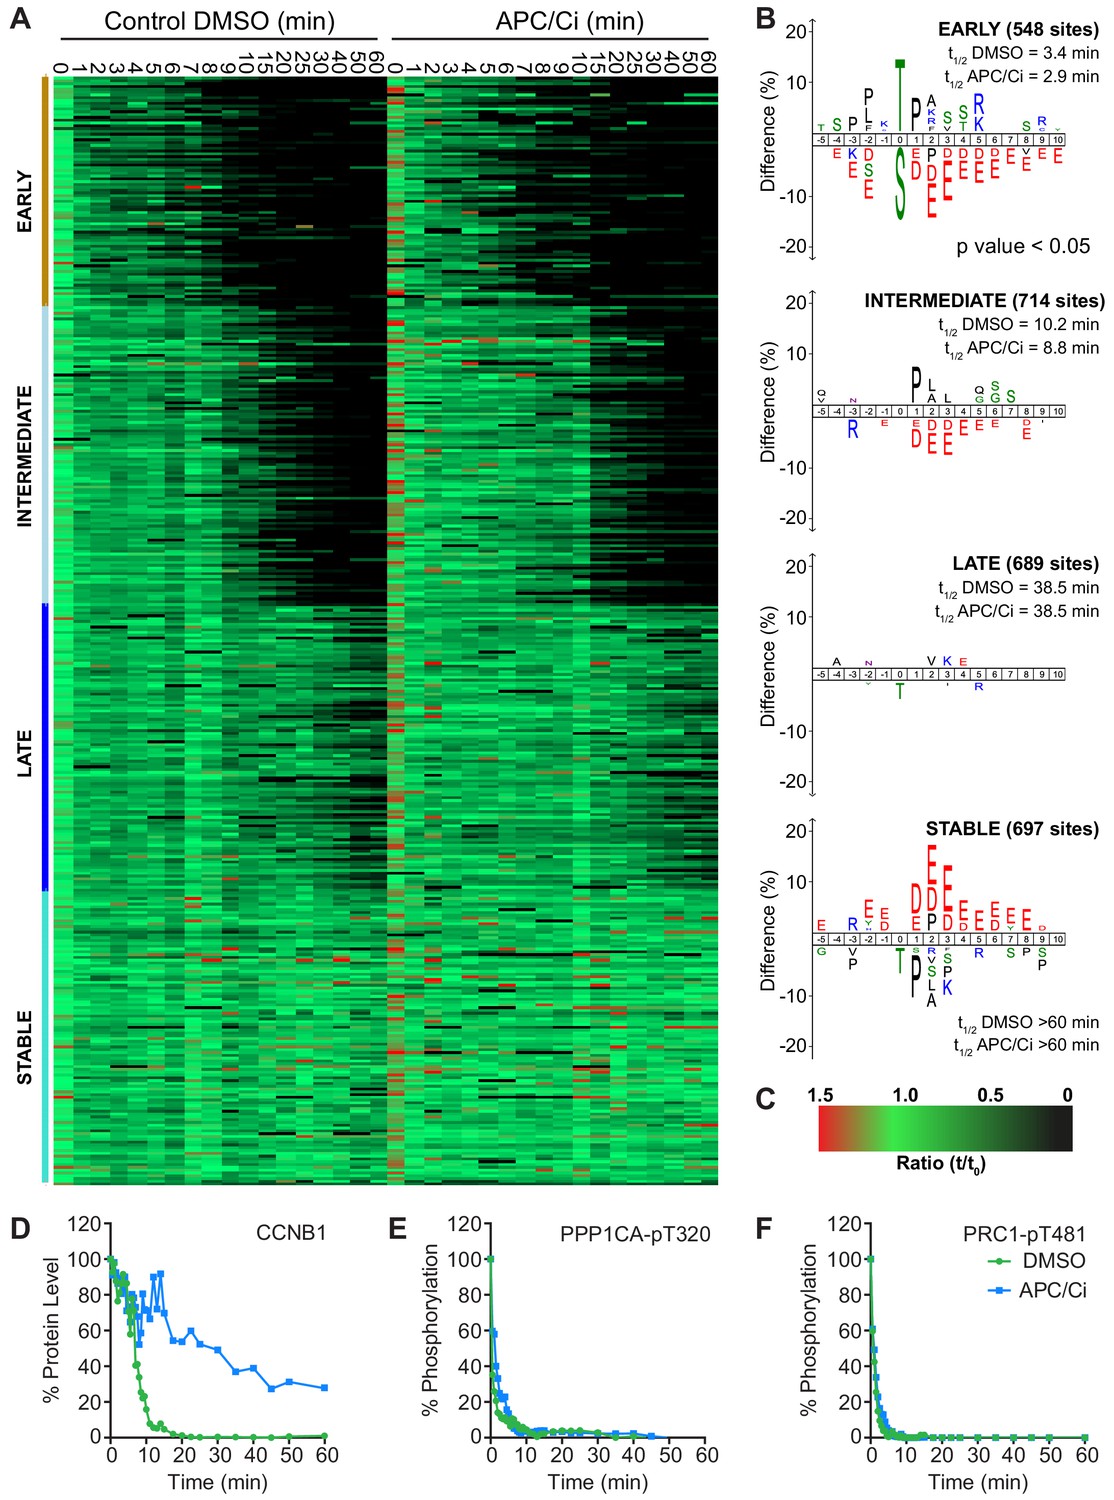
APC/C-dependent proteolysis is not necessary for ordered dephosphorylation during mitotic exit.
HeLa cells were arrested in mitosis and mitotic exit triggered as previously. (A) Heatmap of phospho-sites clustered based on their behaviour over time, following CDK inhibition, in the presence of either DMSO or APC/C inhibitors (APC/Ci), 400 µM apcin and 25 µM pro-TAME (Figure 6—source data 1). Clusters are colour-coded with a bar to the left side, and named accordingly to correspond to the early, intermediate, late and stable groups described in Figure 2. (B) Sequence logo analysis showing the relative enrichment of residues in the adjacent cluster when compared against the sequences of all clustered phospho-peptides. Number of phospho-sites and the average half-life of each cluster is indicated. (C) Key linking heatmap colour with observed ratio. (D-F) Densitometric quantification of western blot samples (Figure 6—figure supplement 1), corresponding to those used for mass spectrometric analysis, is shown for (D) CCNB1, (E) PPP1CA-pT320 and (F) PRC1-pT481 (n = 1).
-
Figure 6—source data 1
Phospho-proteome data and clustering analysis of mitotic exit triggered using CDK inhibtion under either control or APC/C inhibited conditions.
- https://cdn.elifesciences.org/articles/59885/elife-59885-fig6-data1-v3.xlsx
Figure 6—figure supplement 1
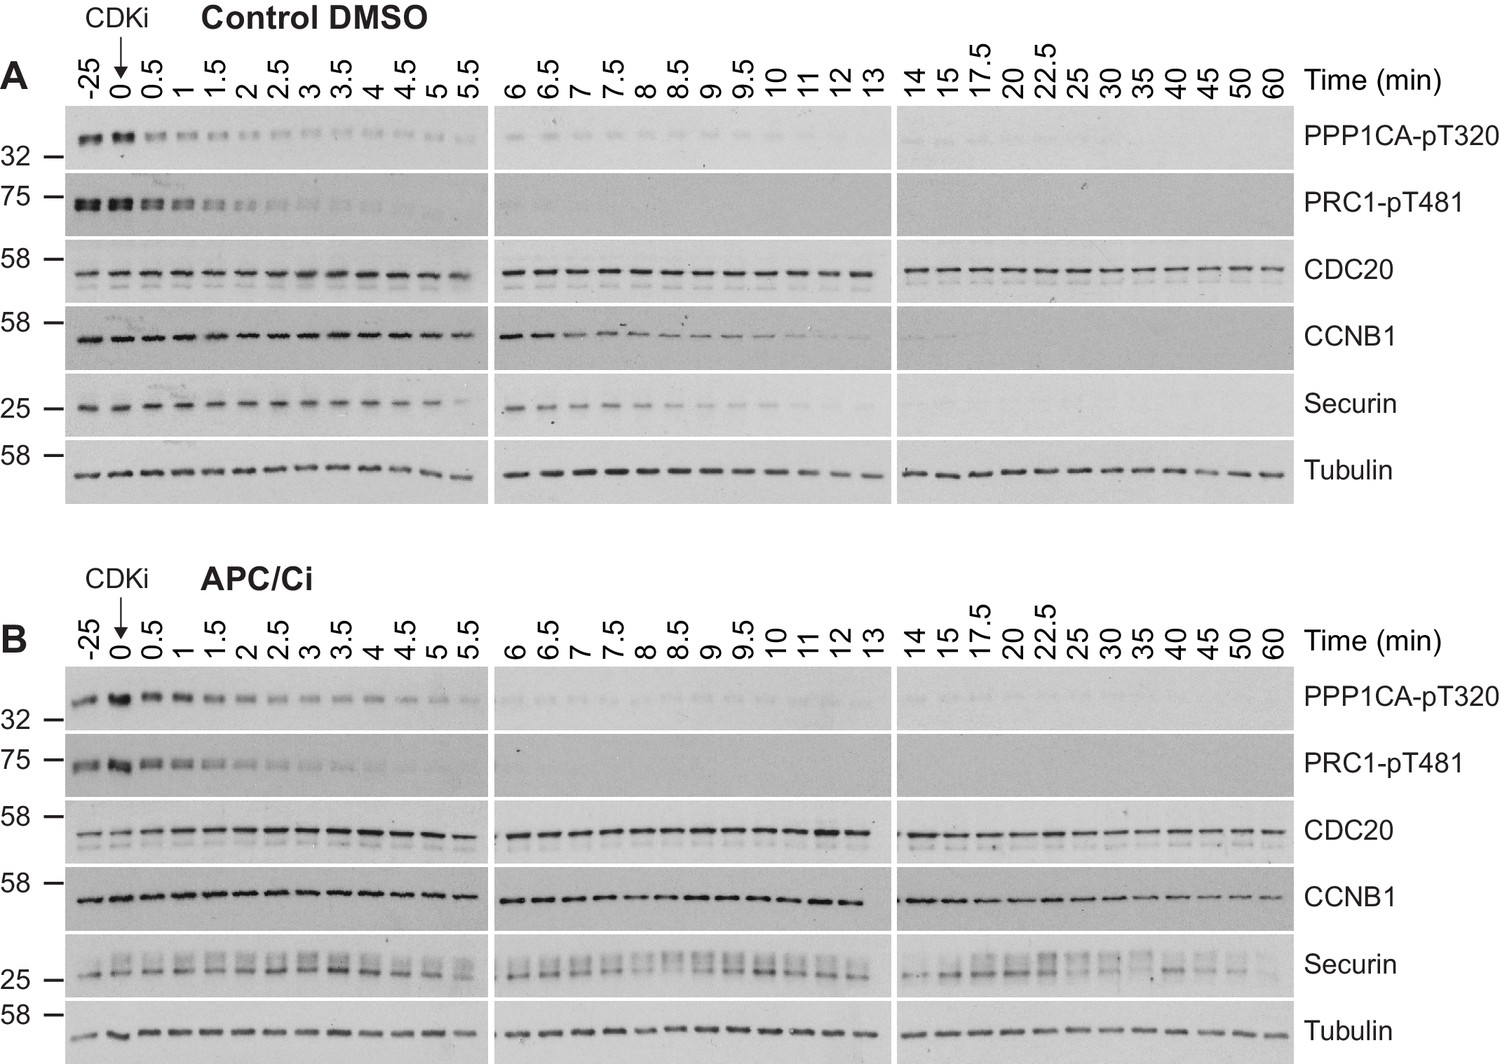
High-resolution analysis of mitotic exit following APC/C inhibition.
Western blot analysis of samples generated from mitotically arrested HeLa cells following treatment with either (A) DMSO or (B) APC/C inhibitors (APC/Ci), 400 µM apcin and 25 µM pro-TAME, prior to CDK inhibition (CDKi). Samples were taken at the indicated timepoints.
Figure 7 with 1 supplement

Depletion of PP1 increases the half-life of protein phosphorylation during mitotic exit.
HeLa cell samples depleted of either control or PPP1CA/C were processed for mass spectrometry and analysed as described previously (Bancroft et al., 2020). (A) Clustering heat-map comparing the trends in phosphorylation over time in control and PPP1CA/C depleted cells following CDK1 inhibition (Figure 7—source data 1). Times shown are in minutes. Clusters are colour-coded with a bar to the left side, and named accordingly to correspond to the early, intermediate (inter), late and stable groups described in Figure 2. Clusters where the average siPPP1CA/C half-life is >50% more than that of siControl are marked with an orange line to the right of the heatmap. (B) Sequence logo analysis showing the relative enrichment of residues in the correspondingly labelled cluster when compared against the sequences of all clustered phospho-peptides. Number of phospho-sites and the average half-life of each cluster is indicated. (C) Key linking heatmap colour with observed MS ratio.
-
Figure 7—source data 1
Phospho-proteome data and clustering analysis of mitotic exit triggered using CDK inhibtion under either control or PP1 depleted conditions.
- https://cdn.elifesciences.org/articles/59885/elife-59885-fig7-data1-v3.xlsx
Figure 7—figure supplement 1

Depletion of PP1 increases the steady-state level of a subset of mitotic phosphorylations.
(A) Scatter plot showing the distribution of starting ratios for individual phosphorylated peptides in Control and PPP1CA/C depleted conditions. Heavy/light ratios were logged to base two prior to plotting. Phosphorylated-sites from selected proteins where the starting ratio more than doubled following PPP1CA/C depletion are highlighted with filled circles (BUB1, blue; INCENP, green; Ki-67, pink). Phosphorylated-sites where the ratio did not double are marked with unfilled circles. For clarity, not all sites in Ki-67 are marked. Schematics of (B) BUB1, (C) INCENP and (D) Ki-67 marking the position of phospho-sites highlighted in (A) relative to domains within the protein. Colours, corresponding to those from (A), denote whether the steady-state level of each site was doubled or not following PPP1CA/C depletion. CPC, chromosomal passenger complex; FHA, forkhead-associated domain; KEN, KEN box degron motif; MELT, MPS1 phosphorylation motif; SAH, single α-helix; TPR, tetratricopeptide repeat.
Figure 8
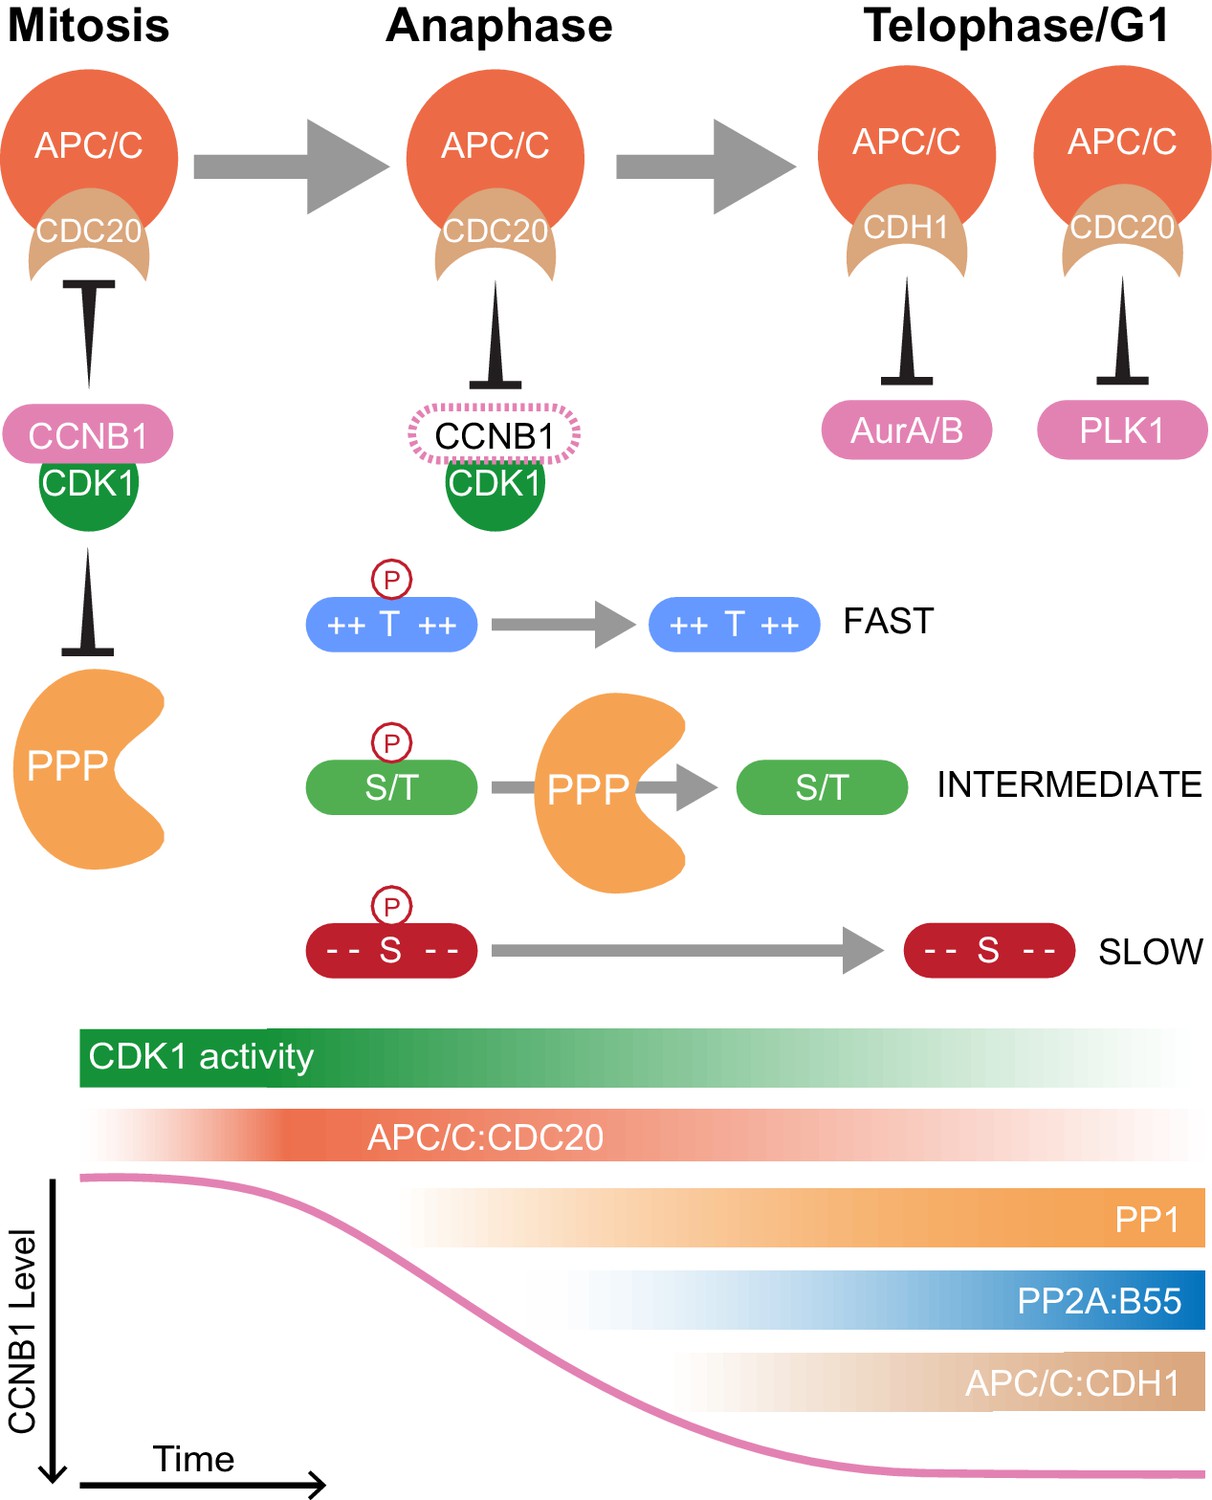
Selective proteolysis of Cyclin B1 initiates ordered dephosphorylation to drive mitotic exit.
Model highlighting the distinct roles of ubiquitin-mediated proteolysis and phospho-protein phosphatases (PPP) in the regulation of mitotic exit. The activities depicted in the lower panel scale from maximum (dark shading) to non-zero, minimum (light shading) values. During metaphase, high levels of CDK1:CCNB1 activity maintains the inhibition of PP1 and PP2A-B55 as well as APC/CCDC20. This ensures that mitotic phosphorylations are protected and cells cannot leave mitosis prematurely, before the proper alignment and attachment of chromosomes. Following spindle checkpoint silencing, APC/CCDC20 can target CCNB1 for destruction leading to gradual CDK1 inactivation and sister chromatid separation. As CDK1 activity falls, inhibition of PP1 and PP2A-B55 is relieved triggering a cascade of dephosphorylations. The rate of dephosphorylation is encoded into the system based on the charge characteristics of each phosphorylation site and their suitability for interaction with the PPP active site, as determined by amino acid sequence. These dephosphorylations co-ordinate the many, rapid changes which must occur to create two new daughter cells. Later, in telophase or G1, APC/CCDC20 and APC/CCDH1 target the remaining the mitotic factors for destruction to reset the cell for the subsequent G1 phase. The late-APC/C substrates include accessory mitotic kinases, such as Aurora A/B and PLK1, and kinetochore proteins, such as BUBR1 and CENPF.
Author response image 1

Relative levels of CCNA2 and CCNB1 following wash-out from nocodazole arrest.
Mitotically arrested HeLa cells were washed out from nocodazole for 25 minutes prior to CDK inhibition with flavopiridol. Samples were harvested as indicated and analysed by Western blot, with 8 µg of total lysate loaded per lane. Film exposure times are indicated next to the corresponding label. Antibodies and dilutions used are as follows: PRC1-pT481 1:4000 (AbCam; EP1514Y/ab62366), Cyclin A2 1:2000 (AbCam; ab32498), Cyclin B1 1:5000 (Millipore; 05-373), Tubulin 1:10,000 (Sigma; T6199).
Tables
Key resources table
| Reagent type (species) or resource | Designation | Source or reference | Identifiers | Additional information |
|---|---|---|---|---|
| Cell line (Homo sapiens) | HeLa S3 | ATCC | ID_source:CCL-2.2; RRID:CVCL_0058 | Mycoplasma negative |
| Cell line (Homo sapiens) | HeLa S3: CCNB1-GFP | Alfonso-Pérez et al., 2019; Hayward et al., 2019 | Mycoplasma negative Generated from RRID:CVCL_0058 HeLa S3 cells. Validated through sequencing around CCNB1 locus, Western blot and imaging, both fixed and live cell. | |
| Antibody | Anti-Aurora A (rabbit monoclonal) | Cell Signalling | ID_source:4718S; RRID:AB_2061482 | WB (1:2000) |
| Antibody | Anti-Aurora B (mouse monoclonal) | BD Transduction Labs | ID_source:611083; RRID:AB_398396 | WB (1:1000) |
| Antibody | Anti-BUBR1 (rabbit polyclonal) | Bethyl | ID_source:A300-386A; RRID:AB_386097 | WB (1:2000) |
| Antibody | Anti-CDC20 (rabbit polyclonal) | Proteintech | ID_source:10252–1; RRID:AB_2229016 | WB (1:1000) |
| Antibody | Anti-CDH1/fzr (mouse monoclonal) | Santa Cruz | ID_source:sc-56312; RRID:AB_783404 | WB (1:500) |
| Antibody | Anti-Cyclin B1 (mouse monoclonal) | Millipore | ID_source:05–373; RRID:AB_309701 | WB (1:5000) |
| Antibody | Anti-MAD2 (sheep polyclonal) | Barr/Gruneberg Labs. This paper. | Raised in sheep (Scottish Blood Transfusion Service) using full length human 6His-MAD2 expressed in bacteria and coupled to KLH as the antigen. The serum was affinity purified using GST-tagged MAD2. | WB (1:1000) |
| Antibody | Anti-PLK1 (goat polyclonal) | Neef et al., 2003 | WB (1:2000) | |
| Antibody | Anti-PPP1CA (rabbit polyclonal) | Bethyl | ID_source:A300-904A; RRID:AB_2284190 | WB (1:1000) |
| Antibody | Anti-PPP1CA-pT320 (rabbit monoclonal) | AbCam | ID_source:ab62334; RRID:AB_956236 | WB (1:2000) |
| Antibody | Anti-PRC1 (rabbit polyclonal) | Gruneberg et al., 2006 | WB (1:2000) | |
| Antibody | Anti-PRC1-pT481 (rabbit monoclonal) | AbCam | ID_source:EP1514Y; ab62366; RRID:AB_944969 | WB (1:4000) |
| Antibody | Anti-PRC1-pT602 (rabbit polyclonal) | Neef et al., 2007 | WB (1:1000) | |
| Antibody | Anti-Securin (rabbit monoclonal) | AbCam | ID_source:EPR3240; ab79546; RRID:AB_2173411 | WB (1:1000) |
| Antibody | Anti-TPX2 (mouse monoclonal) | AbCam | ID_source:ab32795; RRID:AB_778561 | WB (1:2000) |
| Antibody | Anti-tubulin (mouse monoclonal) | Sigma | ID_source:T6199; Clone DM1A; RRID:AB_477583 | WB (1:10,000) |
| Antibody | Anti-mouse 2°-HRP (donkey polyclonal) | Jackson | ID_source:715-035-150; RRID:AB_2340770 | WB (1:2000) |
| Antibody | Anti-rabbit-2°-HRP (donkey polyclonal) | Jackson | ID_source:711-035-152; RRID:AB_10015282 | WB (1:2000) |
| Antibody | Anti-Sheep 2°-HRP (donkey polyclonal) | Jackson | ID_source:713-035-147; RRID:AB_2340710 | WB (1:2000) |
| Aeptide, recombinant protein | Lysyl-endopeptidase | Wako Pure Chemical Industries | ID_source:121–05063 | |
| Peptide, recombinant protein | Trypsin Gold | Promega | ID_source:V5280 | |
| Chemical compound, drug | Apcin | Tocris | ID_source:5747/10 | Resuspend in DMSO to 50 mM for stock |
| Chemical compound, drug | AZ3146 | Tocris | ID_source:3994/10 | Resuspend in DMSO to 5 mM for stock |
| Chemical compound, drug | Cycloheximide | Cell Signalling | ID_source:2112S | Resuspend in DMSO to 100 mM for stock |
| Chemical compound, drug | Flavopiridol | Tocris | ID_source:3094/10 | Resuspend in DMSO to 5 mM for stock |
| Chemical compound, drug | MG-132 | CalBiochem | ID_source:47490 | Resuspend in DMSO to 20 mM for stock |
| Chemical compound, drug | Nocodazole | CalBiochem | ID_source:487928 | Resuspend in DMSO to 200 µg/ml for stock |
| Chemical compound, drug | Okadaic Acid | Enzo | ID_source:ALX-350–003 | Resuspend in DMSO to 500 µM for stock |
| Chemical compound, drug | Pro-TAME | Boston Biochem | ID_source:I-440 | Resuspend in DMSO to 20 mM for stock |
| Chemical compound, drug | Taxol | CalBiochem | ID_source:580555 | Resuspend in DMSO to 200 µg/µl for stock |
| Chemical compound, drug | Thymidine | CalBiochem | ID_source:6060 | Resuspend in Millipore filtered water to 100 mM for stock. |
| Sequence-based reagent | siControl | Bancroft et al., 2020, Dharmacon | Custom Sequence 5’ cguacgcggaauacuucgauu | |
| Sequence-based reagent | siPPP1CA | Bancroft et al., 2020, Dharmacon | ID_source: NM_002708.3 n | Custom Sequence 5’ uggauugauuguacagaaauu |
| Sequence-based reagent | siPPP1CB | Bancroft et al., 2020, Dharmacon | ID_source: NM_002709.2 | Custom Sequence 5’ gggaagagcuuuacagacauu |
| Sequence-based reagent | siPPP1CC | Bancroft et al., 2020, Dharmacon | ID_source: NM_002710.3 | Custom Sequence 5’ gcggugaaguugaggcuuauu |
| Commercial assay or kit | Protein Assay Dye-Reagent Concentrate | Bio-Rad | ID_source:5000006 | |
| Commercial assay or kit | ECL Blotting Reagents | GE Healthcare | ID_source:GERPN2109 | |
| Software, algorithm | Adobe Illustrator CS4 | Adobe Systems Inc | ID_source:RRID:SCR_010279 | |
| Software, algorithm | Adobe Photoshop CS4 | Adobe Systems Inc | ID_source:RRID:SCR_014199 | |
| Software, algorithm | Fiji 1.52 p | National Institues of Health, USA | ID_source:RRID:SCR_002285 | |
| Software, algorithm | IceLogo 1.2 | Colaert et al., 2009 | ID_source:RRID:SCR_012137 | |
| Software, algorithm | MaxQuant | Tyanova et al., 2016a | ID_source:RRID:SCR_014485 | |
| Software, algorithm | Perseus | Tyanova et al., 2016b | ID_source:RRID:SCR_015753 | |
| Software, algorithm | Prism 8.3.1 | GraphPad Software | ID_source:RRID:SCR_002798 | |
| Other | C18 Discs | Empore | ID_source:3M2215 | |
| Other | Phospho-peptide Enrichment TopTip | Glygen | ID_source:TT1TIO | |
| Other | SepPak Reverse-Phase C18 Columns | Waters | ID_source:WAT023501 |
Additional files
Download links
A two-part list of links to download the article, or parts of the article, in various formats.
Downloads (link to download the article as PDF)
Open citations (links to open the citations from this article in various online reference manager services)
Cite this article (links to download the citations from this article in formats compatible with various reference manager tools)
Ordered dephosphorylation initiated by the selective proteolysis of cyclin B drives mitotic exit
eLife 9:e59885.
https://doi.org/10.7554/eLife.59885


