An atlas of neural crest lineages along the posterior developing zebrafish at single-cell resolution
- Department of BioSciences, Rice University, United States
Figures
Figure 1 with 5 supplements
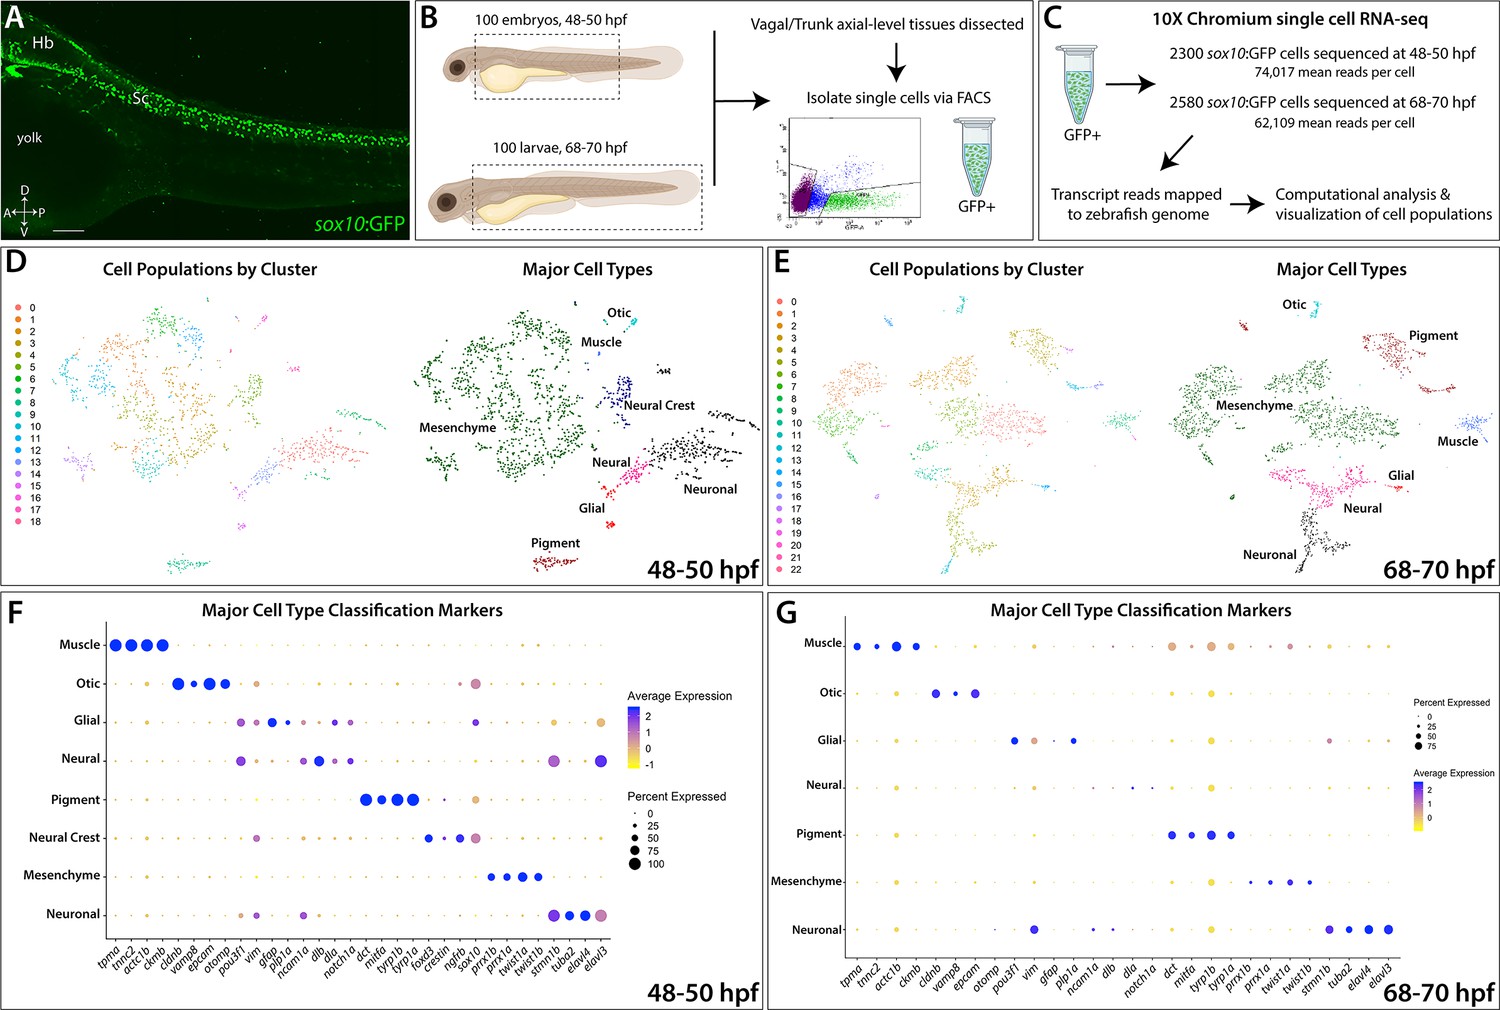
Single-cell profiling strategy and cell population composition of posterior sox10:GFP+ cells from the posterior zebrafish during the embryonic to larval stage transition.
(A) Confocal image of a sox10:GFP+ embryo at 48 hpf; Hb: Hindbrain; Sc: Spinal cord. A: Anterior, P: Posterior, D: Dorsal, V: Ventral. Scale bar: 50 μM (B) Cartoon illustrations of a zebrafish embryo at 48–50 hpf and an early larval fish at 68–70 hpf depicted laterally to summarize the dissection workflow used to collect posterior sox10:GFP+ cells. (C) Schematic of the 10X Genomics Chromium and data analysis pipeline. (D) tSNE plots showing the arrangement of Clusters 0–18 and where the major cell types identified among sox10:GFP+ cells arrange in the 48–50 hpf dataset. (E) tSNE plots showing the arrangement of Clusters 0–22 and where the major cell types identified among sox10:GFP+ cells arrange in the 68–70 hpf dataset. (F,G) Dot plots of the identifying gene markers for each major cell type classification in the 48–50 hpf and 68–70 hpf datasets, respectively. Dot size depicts the cell percentage for each marker within the dataset and the color summarizes the average expression levels for each gene.
-
Figure 1—source data 1
List of marker genes per cluster in the sox10:GFP scRNA-seq datasets.
Tables reporting the Seurat output for genes for each cluster at the 48–50 hpf (Tab 1) and 68–70 hpf (Tab 2) time points, including p-values (<0.01), average log-fold change (≥0.25), adjusted p-values (≤1.0), pct.1 summarizing proportion of cells expressing the individual gene in the cluster, pct.2 showing the proportion of cells expressing the individual gene in all other clusters in the dataset.
- https://cdn.elifesciences.org/articles/60005/elife-60005-fig1-data1-v1.xlsx.zip
-
Figure 1—source data 2
Table summarizing the top identity markers used for major cell type and subtype cellular classifications for each cluster at 48–50 and 68–70 hpf.
References cited: Barske et al., 2016; Carney et al., 2006; Ding et al., 2013; Du et al., 2003; Dutton et al., 2001; Farnsworth et al., 2020; Feregrino et al., 2019; Gaudet et al., 2011; Heanue and Pachnis, 2008; Knight et al., 2003; Lister et al., 1999; Ludwig et al., 2004; Lu et al., 2019; Luo et al., 2001; Minchin and Hughes, 2008; Nakamura et al., 2016; Nord et al., 2016; Parichy et al., 2000; Petratou et al., 2018; Petratou et al., 2019; Quigley and Parichy, 2002; Saunders et al., 2019; Shepherd et al., 2004; Soldatov et al., 2019; Sperber and Dawid, 2008; Sperber et al., 2008; Stewart et al., 2006; Taylor et al., 2016; Thisse et al., 2001; Thisse and Thisse, 2004; Thisse and Thisse, 2005; Uyttebroek et al., 2010; Yelon et al., 2000.
- https://cdn.elifesciences.org/articles/60005/elife-60005-fig1-data2-v1.pdf
Figure 1—figure supplement 1
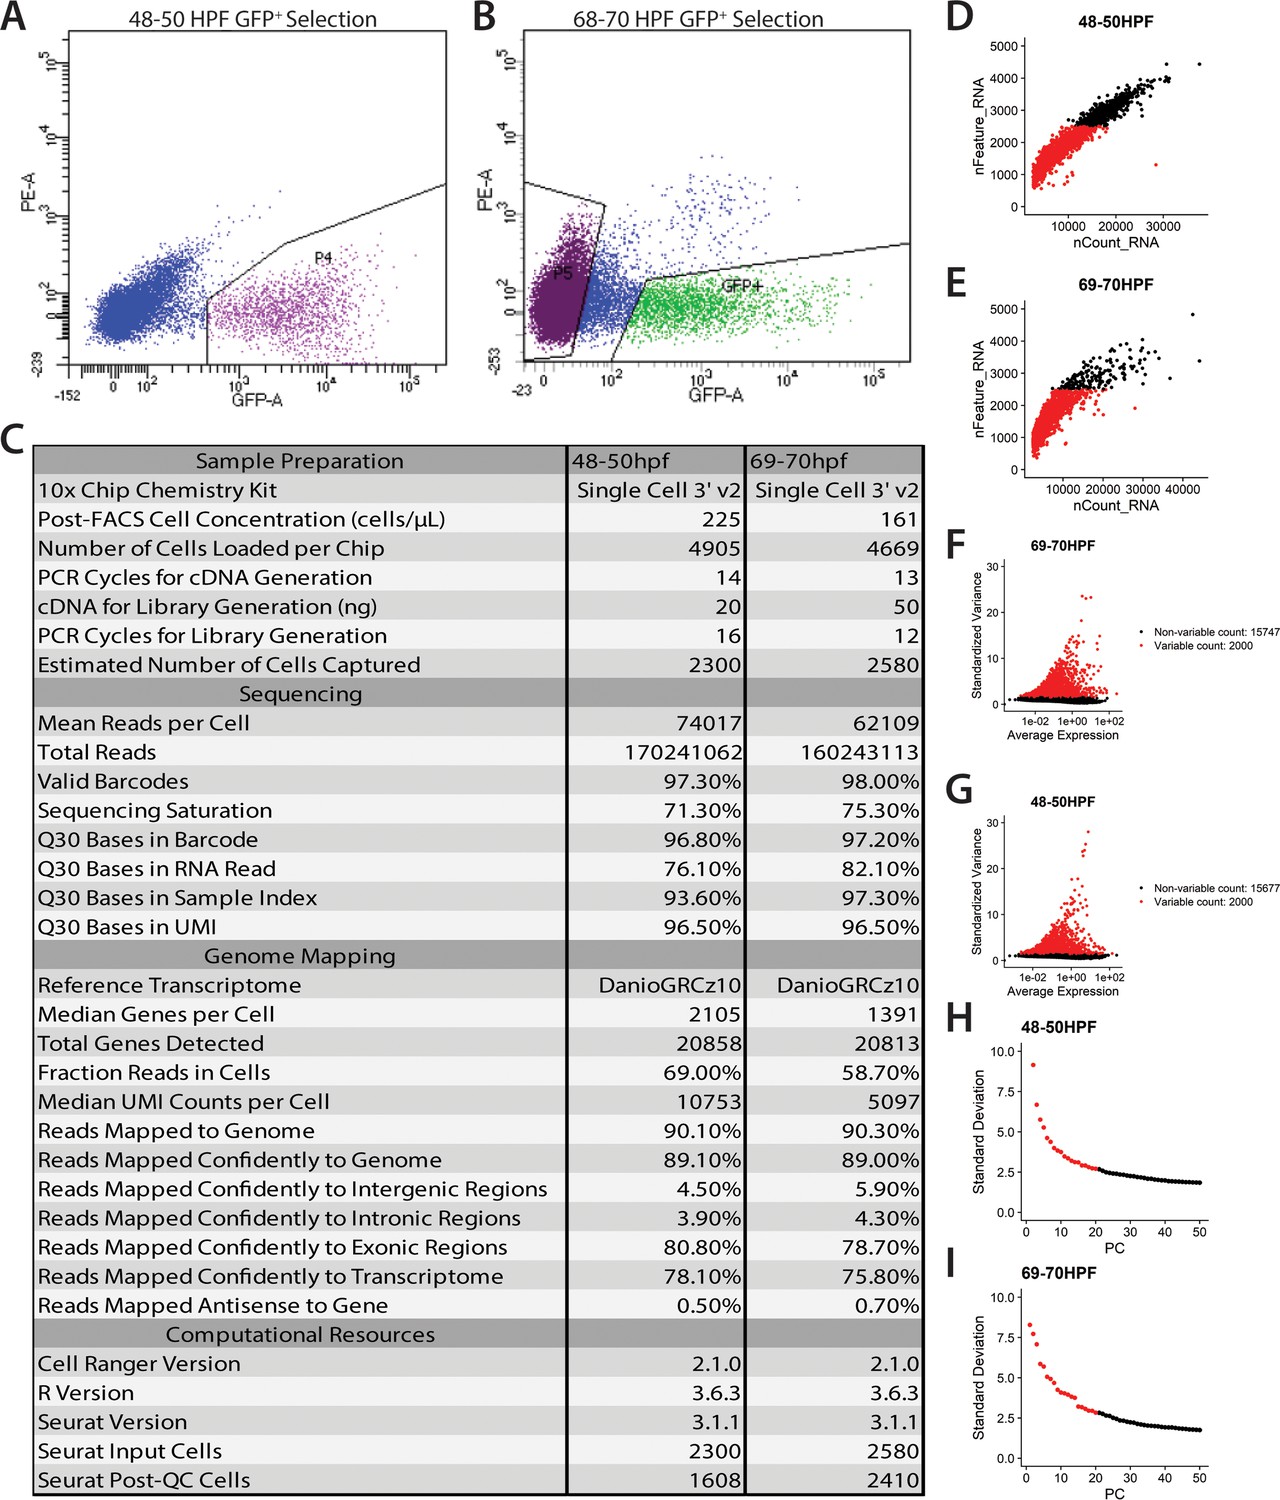
Statistics on generation and filtering of single cell transcriptomes at 48–50 hpf and 68–70 hpf.
(A,B) Fluorescence activated cell sorting plots highlighting the GFP+ cell population sorted at 48–50 hpf (A) and 68–70 hpf (B). (C) Table of general statistics pertaining to the sequencing and alignment of reads from the Cell Ranger pipeline. Additional metrics provided were derived from the Seurat R package as described in the Materials and Methods section. (D,E) Plots showing the feature selection for both the 48–50 hpf (D) and 68–70 hpf (E) datasets. Cells were selected such that they had fewer than 2500 features to reduce spuriously sorted cells. (F,G) Top 2000 most variably expressed genes were identified and used for further downstream identification of significant principal components, as described in the Materials and Methods section. (H,I) Most significant principal components (top 20 for both datasets) were selected to be used for subsequent cluster identification and cell embedding in tSNE and UMAP spaces.
Figure 1—figure supplement 2
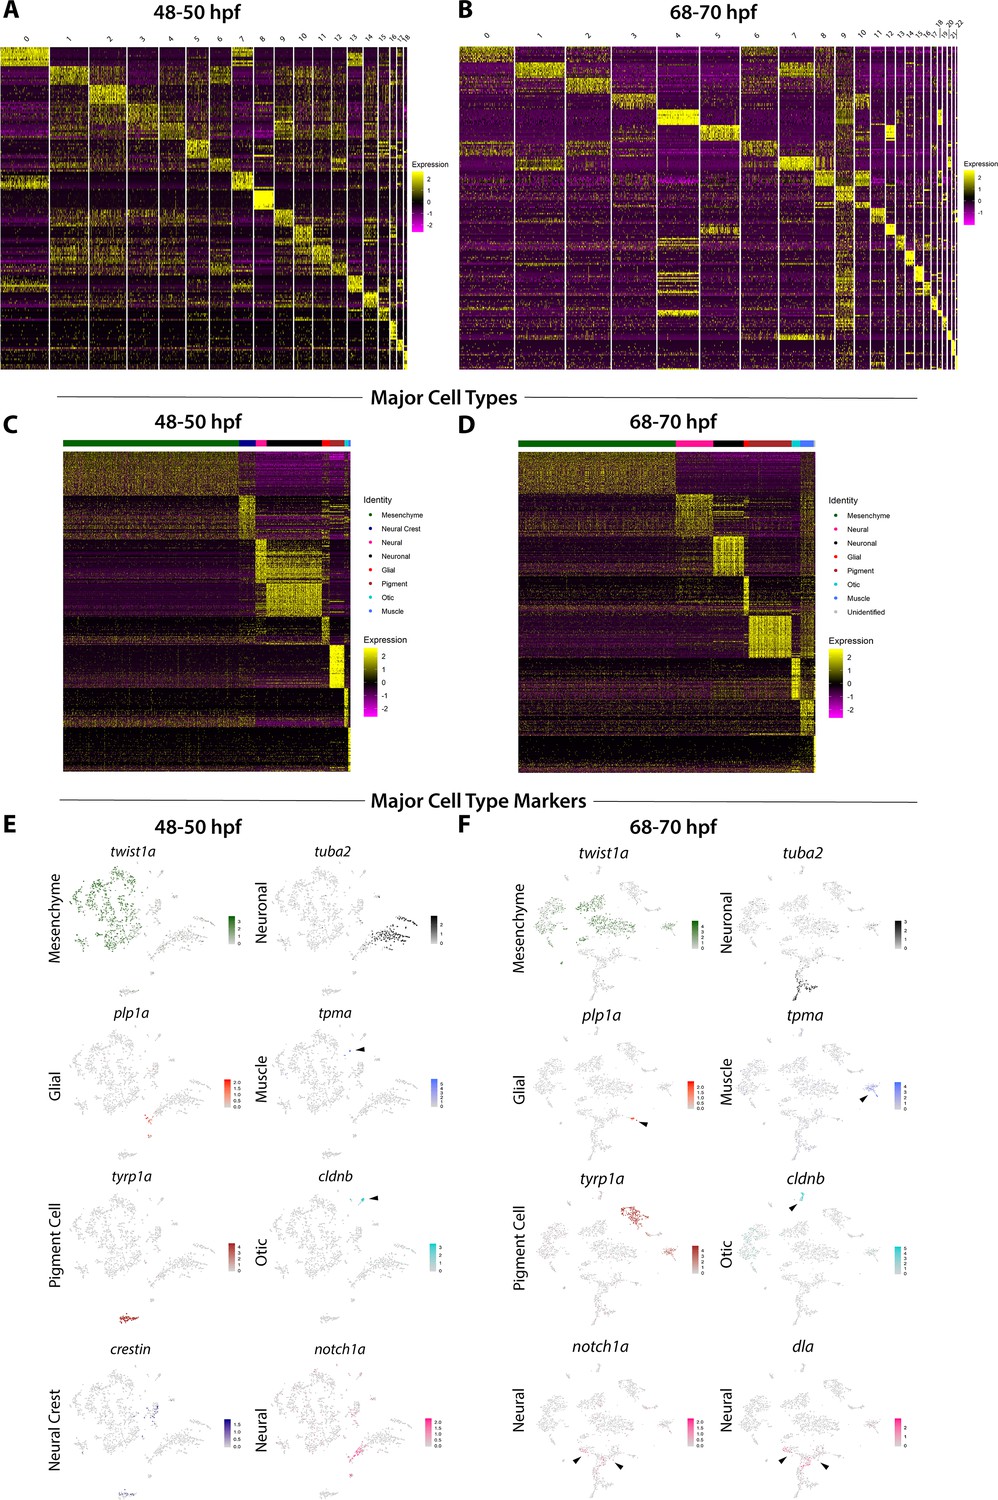
Major cell type annotations among sox10:GFP+ cells.
(A,B) Heatmap summarizing the top 10 genes significantly expressed in each cluster, for 48–50 and 68–70 hpf, respectively. Relative expression levels within each cluster is summarized within the color key, where yellow to magenta color indicates high to low gene expression levels. (C,D) Heatmaps summarizing the top 30 genes significantly expressed among the major cell types identified among sox10:GFP+ cells, for 48–50 and 68–70 hpf, respectively. Relative expression levels within each major cell type cluster is summarized within the color key, where yellow to magenta color indicates high to low gene expression levels. (E,F) tSNE plots depicting the major cell type classification representative gene marker for each major cell type category, for 48–50 and 68–70 hpf, respectively. Relative expression levels are summarized within the color keys, where color intensity is proportional to expression level of each gene depicted.
Figure 1—figure supplement 3
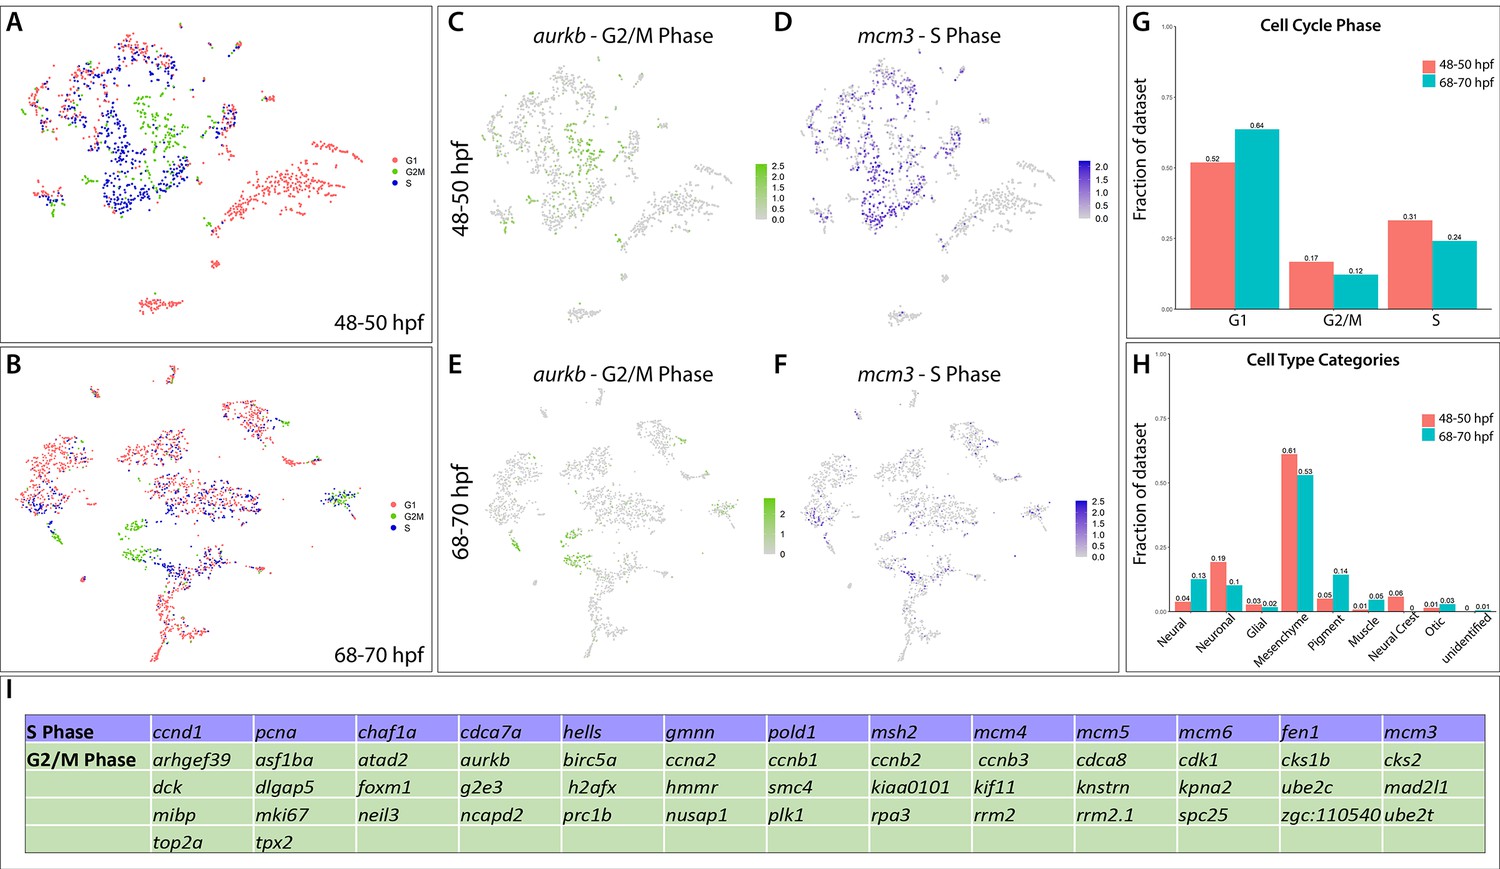
Major cell type categories and cell cycle distributions of the scRNA-seq datasets.
(A,B) tSNE plots summarizing the G1, S, and G2/M phase cell cycle phase occupancies of the cells in the 48–50 and 68–70 hpf time points, respectively. (C,E) A tSNE plot depicting the expression of aurkb, a G2/M phase marker, within the 48–50 and 68–70 hpf datasets, respectively. Relative expression levels are summarized within the color keys, where color intensity is proportional to expression level of each gene depicted. (D,F) A tSNE plot depicting the expression of mcm3, a S phase marker, within the 48–50 and 68–70 hpf datasets, respectively. Relative expression levels are summarized within the color keys, where color intensity is proportional to expression level of each gene depicted. (G) Bar graphs summarizing the cell cycle phase occupancies, as a fraction of cells within the total datasets for each time point. (H) Bar graphs summarizing the major cell type categories, as a fraction of cells within the total datasets for each time point. (I) Table summarizing the cell cycle genes used to demarcate cell cycle phase occupancy categories within the scRNA-seq datasets.
Figure 1—figure supplement 4
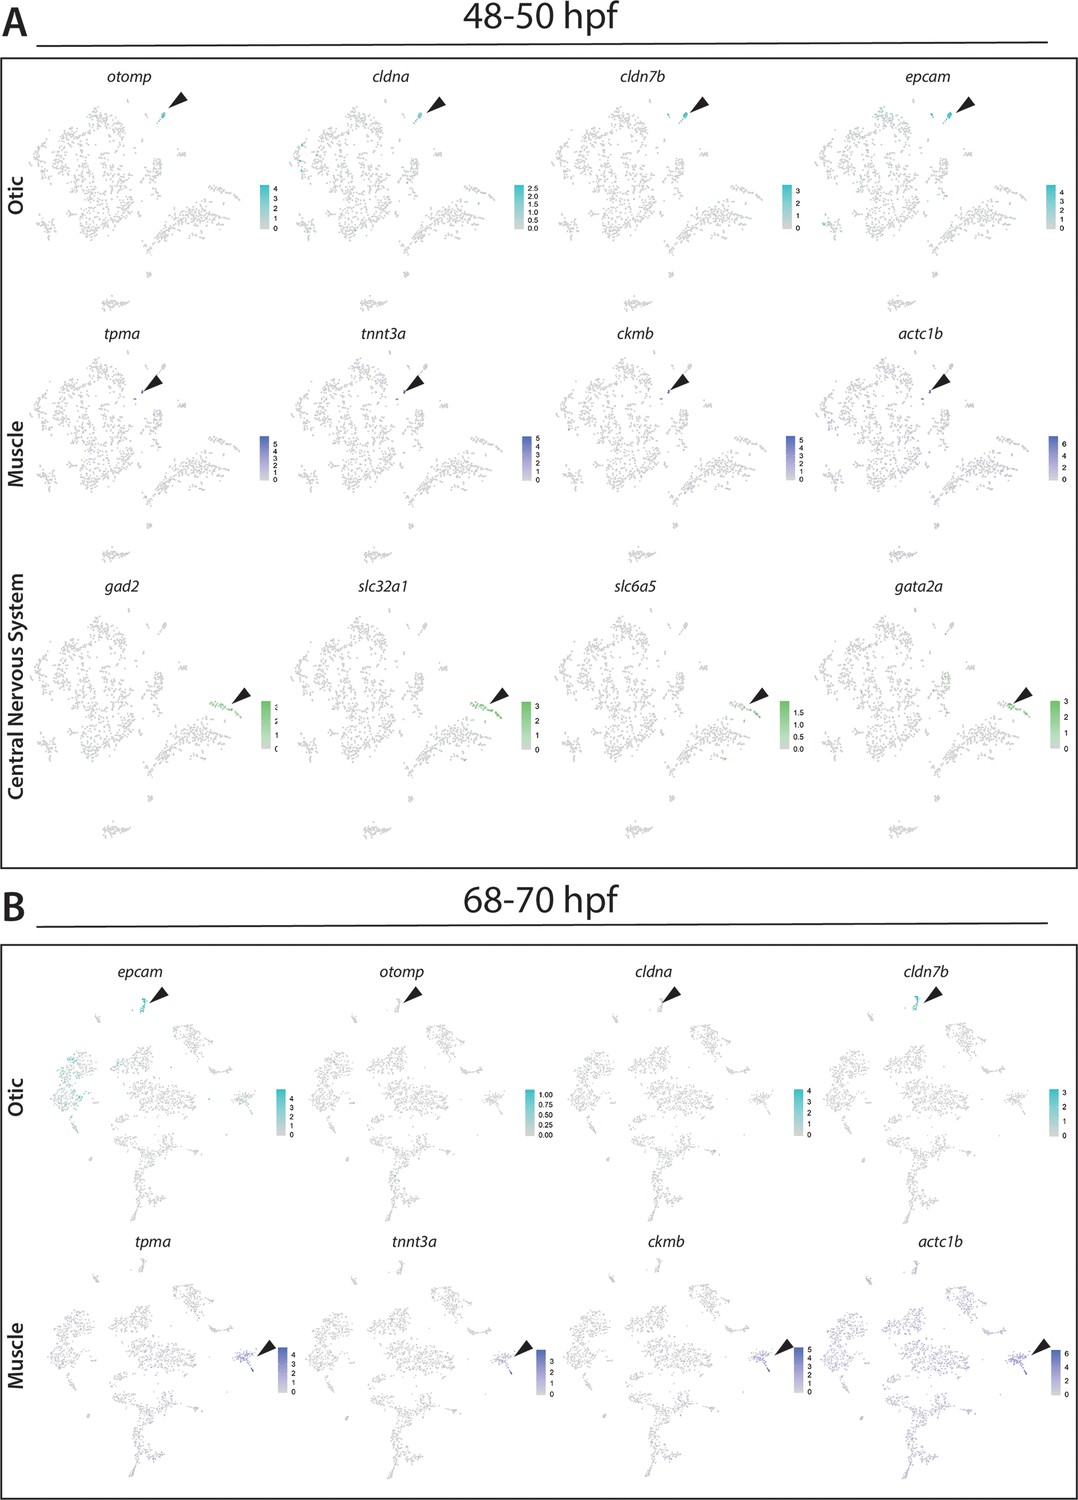
Identification of otic vesicle, muscle, and central nervous system (CNS) cellular populations.
(A) Panel of tSNE feature plots at 48–50 hpf that identify combinatorial expression of otic vesicle (otomp, cldna, cldn7b and epcam), muscle (ckmb, actc1b, tnnt3a and tpma), or CNS (slc32a1, gad1b, slc6a5, gata2a) markers. Cluster of interest denoted by black arrows. (B) Panel of tSNE feature plots at 68–70 hpf that identify combinatorial expression of otic vesicle markers (otomp, cldna, cldn7b, and epcam) or muscle (ckmb, actc1b, tnnt3a, and tpma). Cluster of interest denoted by black arrows.
Figure 1—figure supplement 5
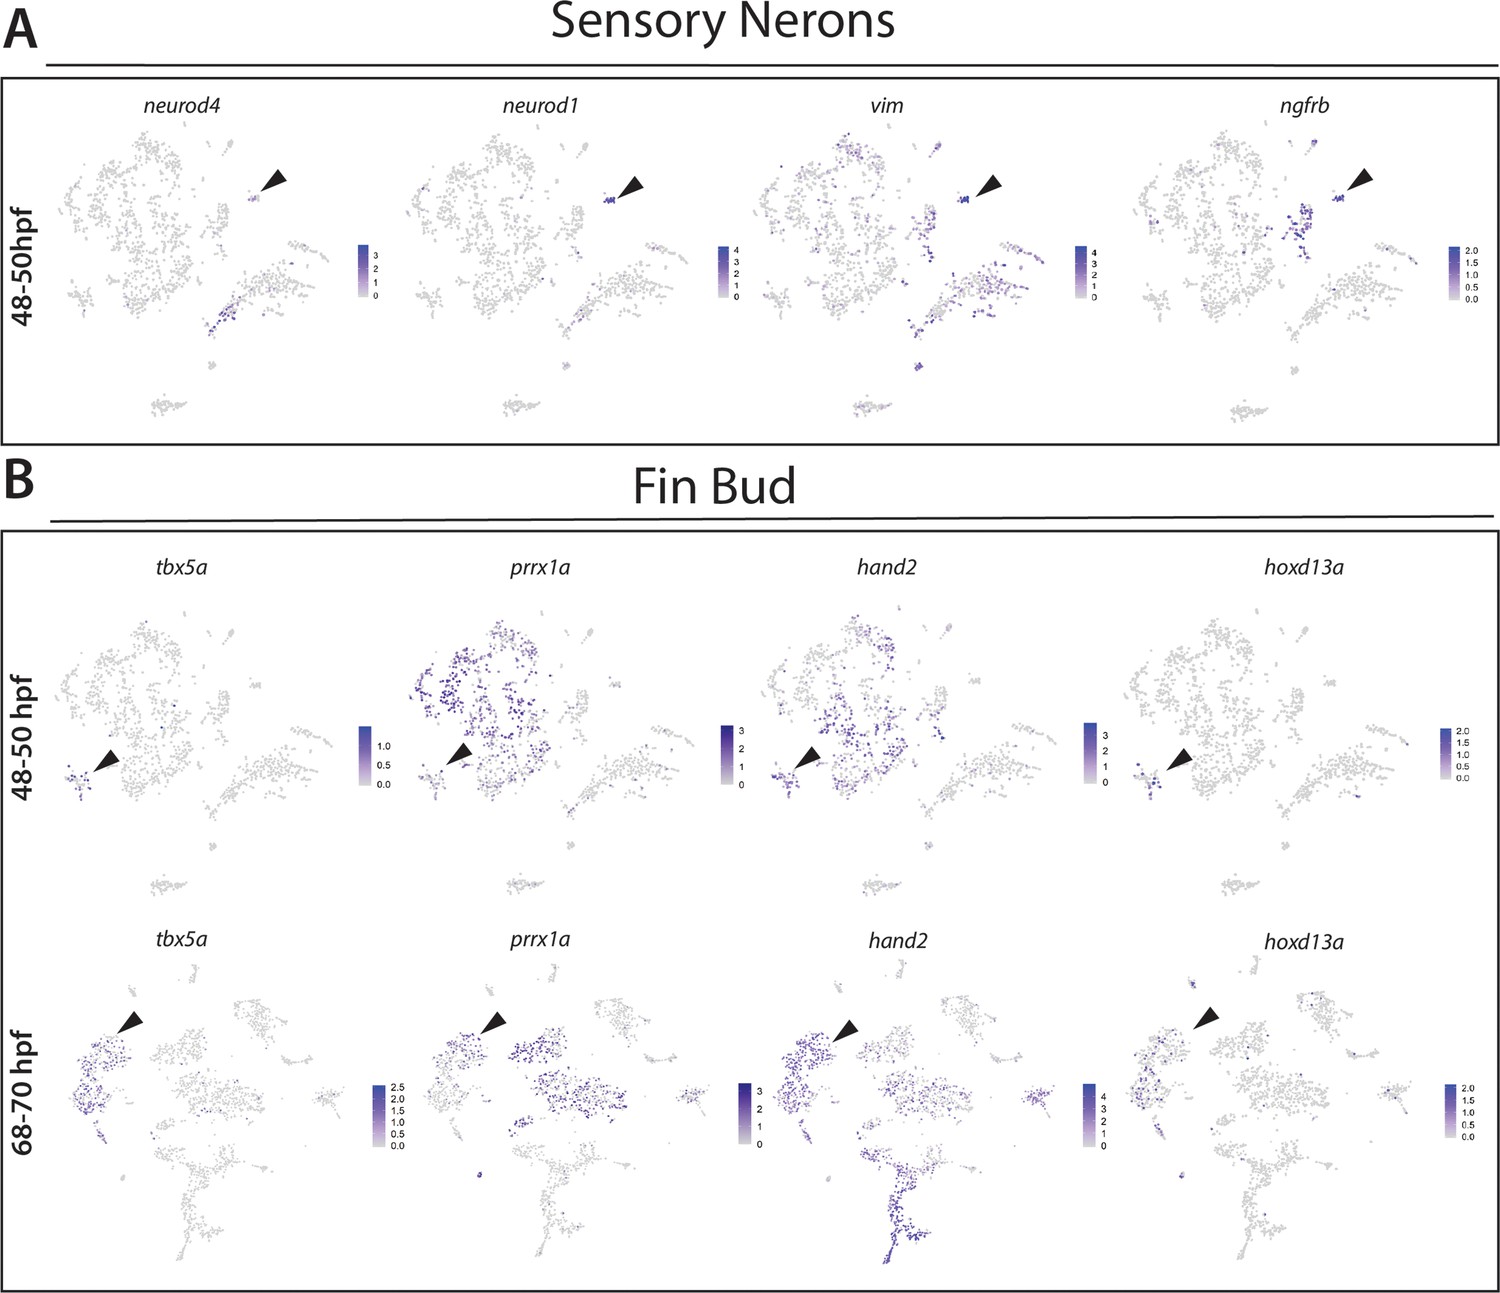
Identification of fin bud and sensory neuronal progenitor cellular populations.
(A) Panel of tSNE feature plots of sensory neuronal progenitor markers at 48–50 hpf that show combinatorial expression of neurod4, neurod1, vim, and ngfrb, Cluster of interest denoted by black arrows. (B) Panel of tSNE feature plots of fin bud makers at 48–50 hpf (top) and 68–70 hpf (bottom) that show combinatorial expression of tbx5a, hand2, hoxd13a, and prrx1a. Cluster of interest denoted by black arrows.
Figure 2
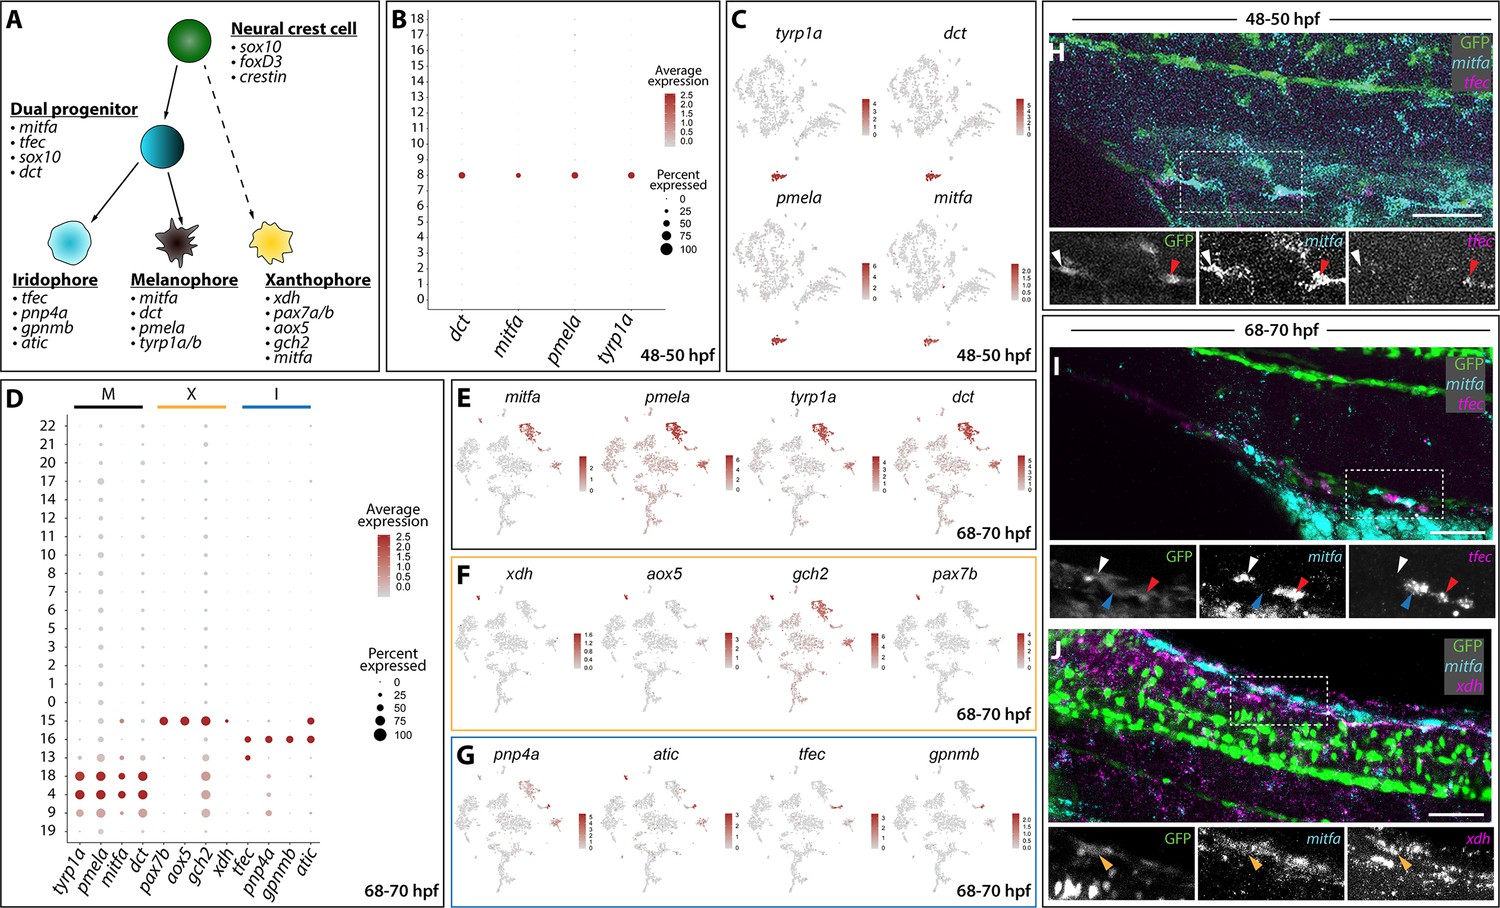
Distinct pigment cell populations are present among sox10:GFP+ cells during embryonic to larval transition.
(A) Cartoon schematic depicting the model for neural crest delineation into pigment cell lineages and the genes that were used to identify each pigment cell population. (B) Dot plot identifying melanophore markers within the 48–50 hpf dataset. Dot size depicts the cell percentage for each marker within the dataset and the color summarizes the average expression levels for each gene. (C) tSNE plots depicting melanophore signature in the 48–50 hpf dataset. Relative expression levels are summarized within the color keys, where color intensity is proportional to expression level of each gene depicted. (D) Dot plot showing distinct pigment chromatophore markers within the 68–70 hpf dataset. Dot size depicts the cell percentage for each marker within the dataset and the color summarizes the average expression levels for each gene. M: melanophore markers; X: xanthophore markers; I: iridophore markers. (E–G) tSNE plots revealing the location of melanophores (E), xanthophores (F), and iridophores (G) in the 68–70 hpf dataset. Relative expression levels are summarized within the color keys, where color intensity is proportional to expression level of each gene depicted. (H) HCR against mitfa and tfec at 48–50 hpf reveals mitfa+ melanophores (white arrowhead) and mitfa+/tfec+ pigment progenitors (red arrowhead). Cropped panels show individual fluorescent channels. (I) HCR against mitfa and tfec at 68–70 hpf presents mitfa+ melanophores (white arrowhead), tfec+ iridophores (blue arrowhead), and mitfa+/tfec+ pigment progenitors (red arrowhead). Cropped panels show individual fluorescent channels. (J) HCR against mitfa and xdh at 68–70 hpf shows mitfa+/xdh+ xanthophores (orange arrowhead). Cropped panels show individual fluorescent channels. Scale bar in H-J: 50 µm.
-
Figure 2—source data 1
Melanophore populations, shared and unique genes at 68–70 hpf.
Table summarizing the genes (‘elements’) exclusively found in Cluster 4, exclusively found in Cluster 18, and genes found in both Clusters 4 and 18 at the 68–70 hpf time point scRNA-seq dataset.
- https://cdn.elifesciences.org/articles/60005/elife-60005-fig2-data1-v1.xlsx.zip
Figure 3 with 1 supplement
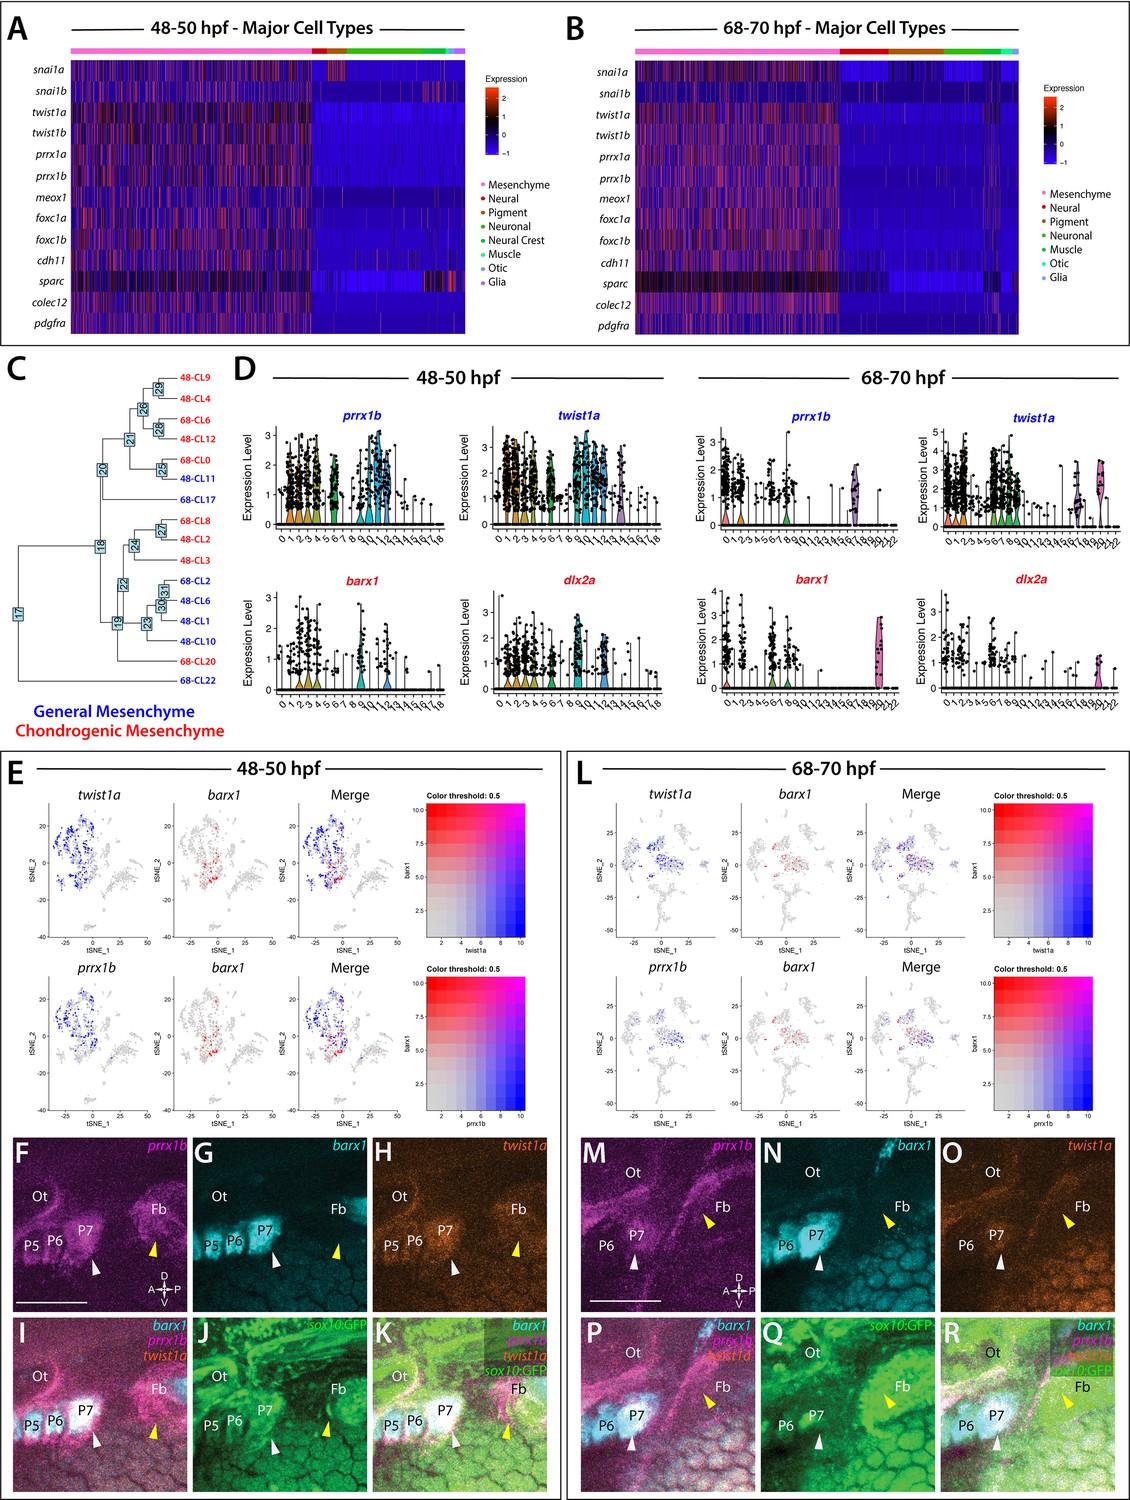
Global analysis of mesenchyme cell signatures among sox10:GFP+ cells.
(A,B) A heatmap of signature mesenchyme identity genes within the major cell type classified cells at 48–50 and 68–70 hpf, respectively. Relative expression levels within each cluster is summarized within the color key, where red to blue color indicates high to low gene expression levels. (C) A cluster tree depicting the relationship between general and chondrogenic mesenchyme cellular subtypes. (D) Violin plots summarizing the expression levels for select mesenchyme identity markers within individual clusters at the 48–50 and 68–70 hpf time points, respectively. Data points depicted in each cluster represent single cells expressing each gene shown. (E,L) tSNE plots depicting the co-expression of twist1a (blue) and barx1 (red) or prrx1b (blue) and barx1 (red) in the 48–50 and 68–70 hpf datasets, respectively. Relative expression levels are summarized within the color keys, where color intensity is proportional to expression level of each gene depicted. (F–K) Whole mount HCR analysis reveals the spatiotemporal expression of prrx1b (F), barx1 (G), twist1a (H), sox10:GFP (J) in 48 hpf embryos. (I) A merge of barx1, prrx1b, and twist1a is shown. (K) A merge of barx1, prrx1b, twist1a, and sox10:GFP is shown. White arrowheads denote expression in posterior pharyngeal arch, while yellow arrowheads highlight fin bud expression. (M–R) Whole mount HCR analysis reveals the spatiotemporal expression of prrx1b (M), barx1 (N), twist1a (O), sox10:GFP (Q) in 68 hpf embryos. (P) A merge of barx1, prrx1b, and twist1a is shown. (R) A merge of barx1, prrx1b, twist1a, and sox10:GFP is shown. White arrowheads denote expression in posterior pharyngeal arch, while yellow arrowheads highlight fin bud expression. Ot: otic; Fb: Fin bud. Scale bar: 100 µm.
Figure 3—figure supplement 1
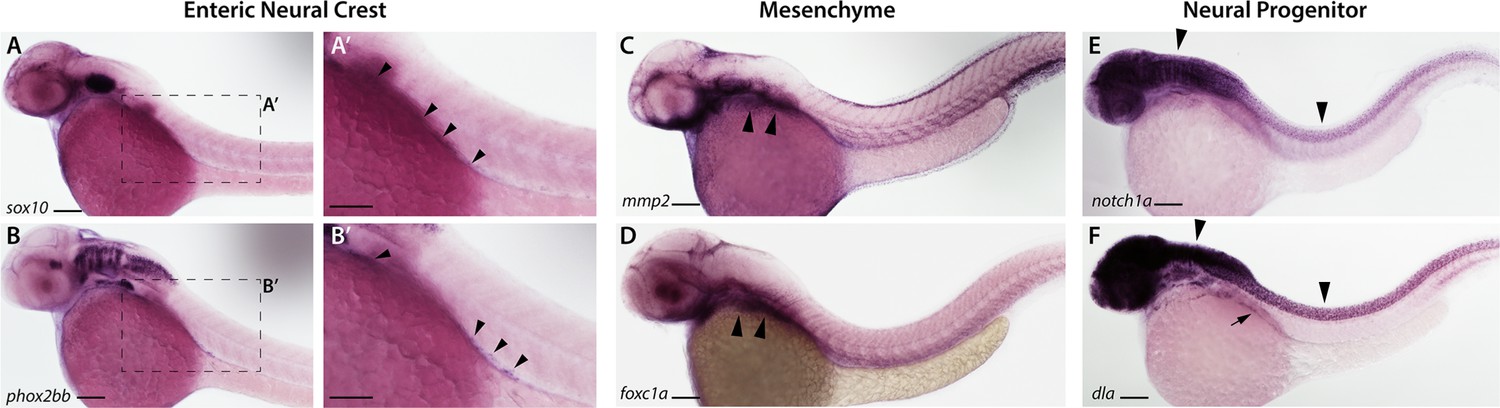
Whole mount in situ hybridization of select ENCC, mesenchyme and neural markers at 48–50 hpf.
(A,A’) The marker sox10 is shown along the vagal region and within ENCC along the foregut in (A’; highlighted via arrowheads). Scale bar in (A): 60 μM, in (A’): 40 μM. (B, B’) Expression of phox2bb is shown within the hindbrain-axial level of the embryo, as well as within ENCC within the foregut (B’; highlighted via arrowheads). Scale bar in (A): 60 μM, in (A’): 40 μM. (C,D) The mesenchyme markers mmp2 (C; highlighted via arrowheads) and foxc1a (D; highlighted via arrowheads) are expressed within the posterior pharyngeal arches and the ventral mesenchyme. (E,F) The neural markers notch1a (E) and dla (F) are expressed within the hindbrain and spinal cord (arrowheads). (F) dla expression is seen in the ENCC (arrow). Scale bar in (C–F): 60 μM.
Figure 4
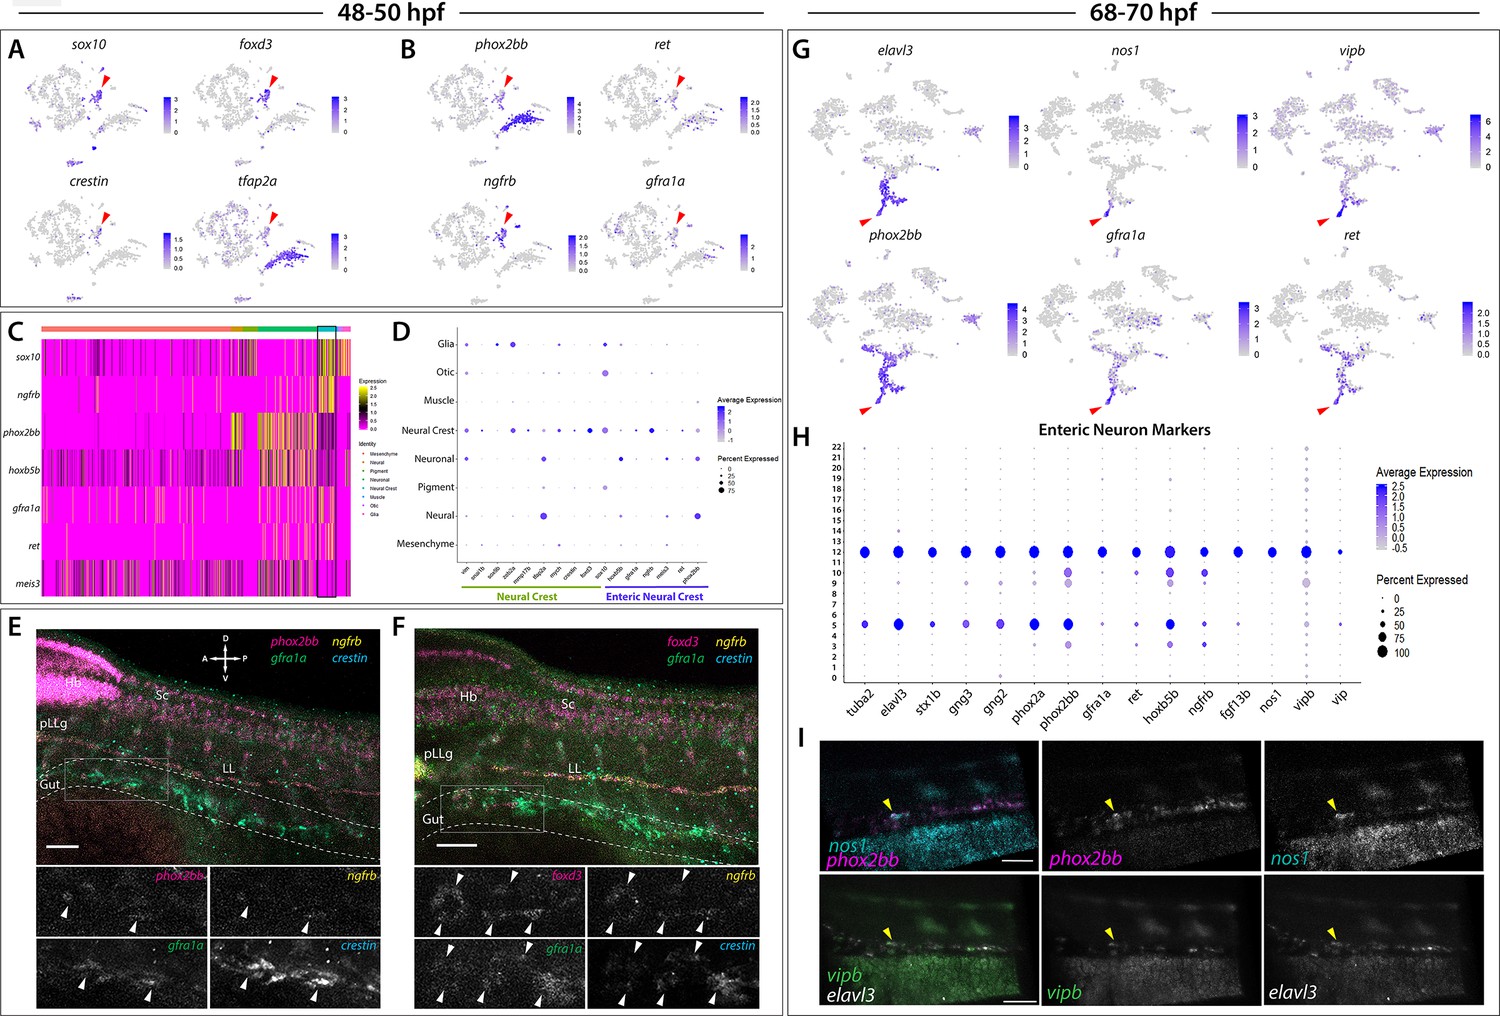
Enteric neural crest cells and differentiating enteric neurons are present among posterior sox10:GFP+ cell populations.
(A) tSNE feature plots reveal expression of core neural crest cell markers sox10, foxd3, crestin, and tfap2a mapping to the neural crest cell cluster (red arrowhead). (B) tSNE feature plots depict expression of the enteric neural crest cell markers phox2bb, ret, ngfrb and gfra1a within the neural crest cell cluster (red arrowhead). Relative expression levels are summarized within the color keys in (A) and (B), where color intensity is proportional to expression level of each gene depicted. (C) A heatmap reveals expression levels of enteric neural crest cell markers across the eight major cell populations captured in the 48–50 hpf data set (color key denotes cells types represented in color bar on top of heatmap). Neural crest cell cluster highlighted in black rectangle. Relative expression levels within each major cell type cluster is summarized within the color key, where yellow to magenta color indicates high to low gene expression levels. (D) Dot plot of expanded list of neural crest (green line) and enteric neural crest (purple line) cell markers across each major cell type within 48–50 hpf data set. Dot size depicts the cell percentage for each marker within the data set and the color summarizes the average expression levels for each gene. (E,F) Whole mount HCR analysis of 48 hpf embryos reveals co-expression of the enteric neural crest cell markers phox2bb, ngfrb, gfra1a, and crestin in (E), or foxd3, ngfrb, gfra1a and crestin in (F), within the developing gut (dashed outline). Top panels depict merged images of color channels for each HCR probe. Lower panels represent gray-scale images of each separated channel corresponding to the magnified region of foregut (gray rectangle). Arrowheads depict regions where all markers are found to be co-expressed. Hb: Hindbrain, Sc: Spinal cord, pLLg: posterior Lateral Line ganglia, LL: Lateral Line. A: Anterior, P: Posterior, D: Dorsal, V: Ventral. Scale bar: 50 μM. (G) tSNE feature plots reveal expression levels of enteric neuron markers elavl3, phox2bb, gfra1a, nos1, vipb, and ret, within a common region of a neuronal cluster (red arrowhead). Relative expression levels are summarized within the color keys, where color intensity is proportional to expression level of each gene depicted. (H) Dot plot depicts expression levels of pan-neuronal and enteric neuron specific markers across individual clusters generated within the original 68–70 hpf tSNE. Pan-neuronal markers found throughout Clusters 5 and 12, with enteric neuron markers most prominently expressed within Cluster 12. Dot size depicts the cell percentage for each marker within the data set and the color summarizes the average expression levels for each gene. (I) Whole mount HCR analysis depicts differentiating enteric neurons within the foregut region at 69 hpf co-expressing nos1, phox2bb, vipb, and elavl3 (yellow arrowheads). Anterior: Left, Posterior: Right. Scale bar: 50 μM.
Figure 5 with 2 supplements
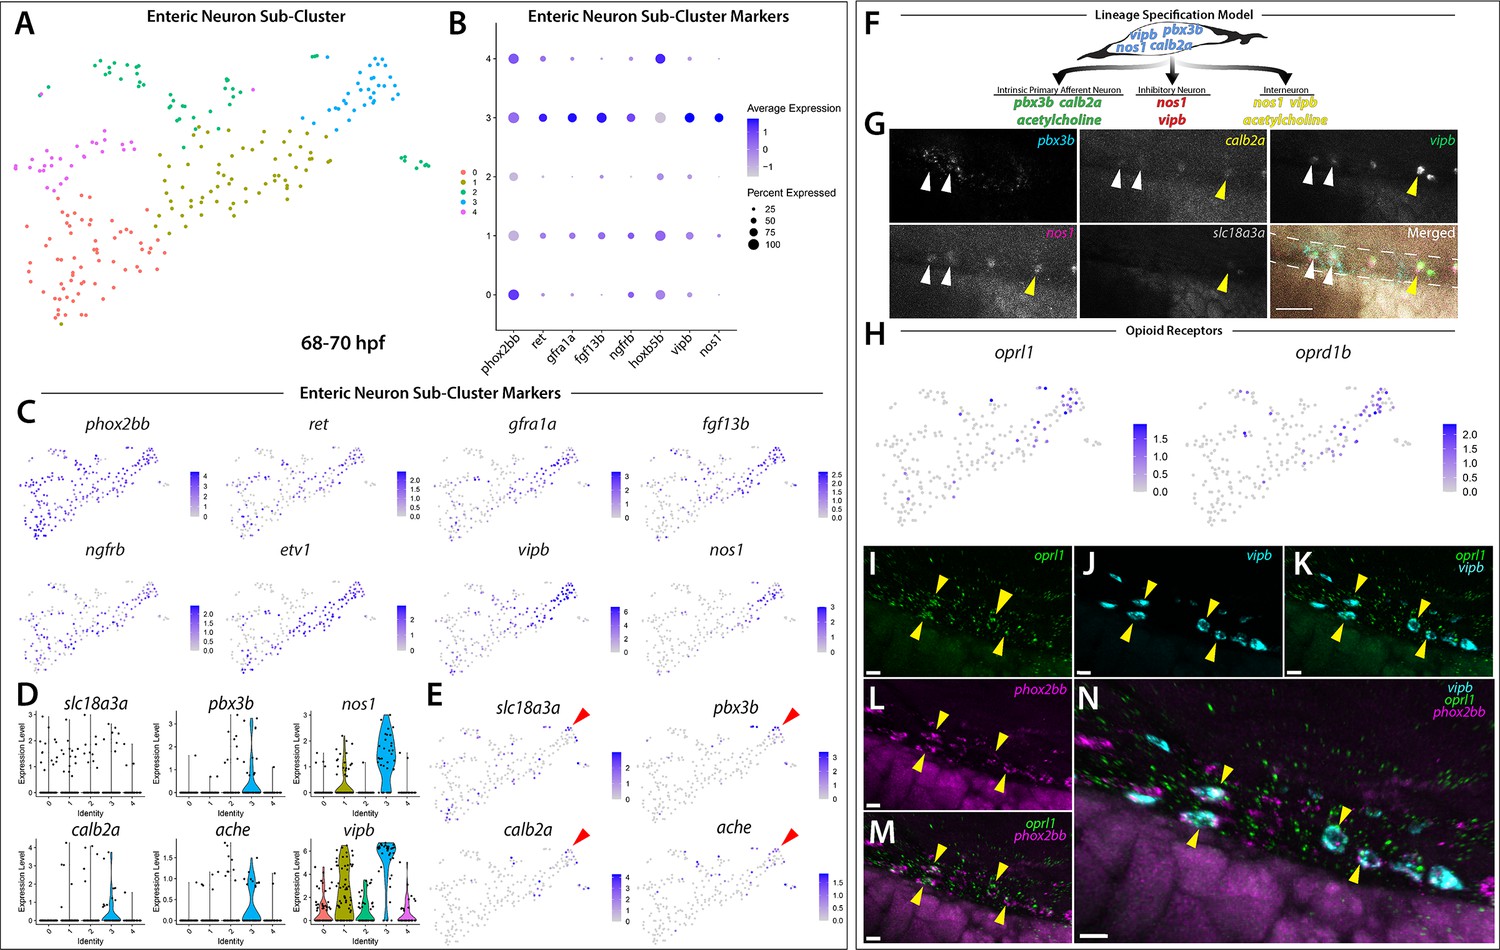
Differentiating enteric neurons captured during key transitional stage of subtype diversification within 68–70 hpf sox10:GFP+ larval cells.
(A) tSNE plot reveals five distinct sub-clusters following the subset analysis and re-clustering of Clusters 5 and 12 from the 68–70 hpf data set. (B) Dot plot depicts expression levels of enteric neuron markers across resulting Sub-clusters. Each marker was expressed at low levels in Sub-cluster 1 and were found to be expressed at higher levels within Sub-cluster 3. (C) tSNE feature plots further depict the expression of enteric neuron markers by illustrating the levels and localization of expression within the Sub-cluster architecture. Feature plots supplement dot plot and demonstrate the prominent expression of enteric neuron markers within Sub-cluster 3, which appears to emanate from Sub-cluster 1. (D,E) Violin and feature plots reveal expression levels of acetylcholine-associated and excitatory neuron markers reported to distinguish enteric IPANs. These markers were found in a discrete pocket of cells forming the distal-most region of Sub-cluster 3 (red arrowhead). Violin data points depicted in each Sub-cluster represent single cells expressing each gene shown. (F) Graphical model summarizes expression patterns observed in 68–70 hpf data set and HCR validation. Common enteric neuroblast capable of diverging into subsequent lineages, IPAN, inhibitory neuron, and interneuron through lineage restricted gene expression. pbx3b promotes assumption of IPAN role through loss of nos1 and vipb and begins expressing calb2a, ache, and slc18a3a. (G) Whole mount HCR analysis reveals co-expression of IPAN marker genes, pbx3b and calb2a, and inhibitory neurochemical marker genes, vipb and nos1 (white arrowheads), within the foregut (dashed white line) at 68 hpf. Vesicular acetylcholine transferase, slc18a3a, was not observed in tandem with pbx3b but was co-expressed with calb2a, vipb, and nos1 (yellow arrowheads). Scale bar: 50 μM. (H) Feature plots reveal expression of opioid receptor genes, oprl1 and oprd1b, within the differentiated enteric neuron Sub-cluster 3. (I–N) Whole mount HCR analysis validates expression of oprl1 in combination with vipb and phox2bb (yellow arrowheads) in enteric neurons localized to the foregut region of a 68 hpf embryo. Scale bar: 10 μM.
-
Figure 5—source data 1
List of marker genes per Sub-cluster, following subset and re-clustering of enteric Clusters 5 and 12 at 68–70 hpf.
Table reporting the Seurat output for genes for each Sub-cluster (0–4), including p-values (<0.01), average log-fold change (.25), adjusted p-values (1.0), pct.1 summarizing proportion of cells expressing the individual gene in the Sub-cluster, pct.2 showing the proportion of cells expressing the individual gene in all other Sub-clusters in the sub-data set.
- https://cdn.elifesciences.org/articles/60005/elife-60005-fig5-data1-v1.xlsx.zip
-
Figure 5—source data 2
List of enriched pathways within enteric neuron Sub-cluster 3 and genes present in specific opioid proenkephalin pathway identified following PANTHER Overrepresentation Test.
Source Data table contains two sheets. Enriched Gene Pathways sheet lists the enriched pathways identified following the use of the statistical test, Fisher’s exact test that compares the number of genes in a given pathway within the reference Danio rerio list to the number of genes in a given pathway within the enteric neuron Sub-cluster 3 list. This analysis produced 43 statistically overrepresented pathways. Column B: Number of genes within the given pathway present with Danio rerio reference list of 25888 genes. Column C: Number of genes within the given pathway present within Sub-cluster 3 gene list. Column D: Number of pathway genes expected to be present within the Sub-cluster 3 gene list based on the percentage of pathway genes present in the Danio rerio reference list. Column E: Denotes that more pathway genes were present in Sub-cluster 3 gene list than expected. Column F: Fold enrichment of Sub-cluster 3 pathway genes comparative to reference list. Column G: p-values calculated following Fisher’s exact test comparing expected number of pathway genes to number of genes pathway genes in Sub-cluster 3. Column H: p-value following Benjamini-Hochberg false discovery rate (FDR) correction. Opioid proenkephalin pathway sheet lists genes associated with this pathway that are present within the enteric neuron Sub-cluster 3 gene list, notably, opioid receptor oprd1b.
- https://cdn.elifesciences.org/articles/60005/elife-60005-fig5-data2-v1.xlsx.zip
Figure 5—figure supplement 1
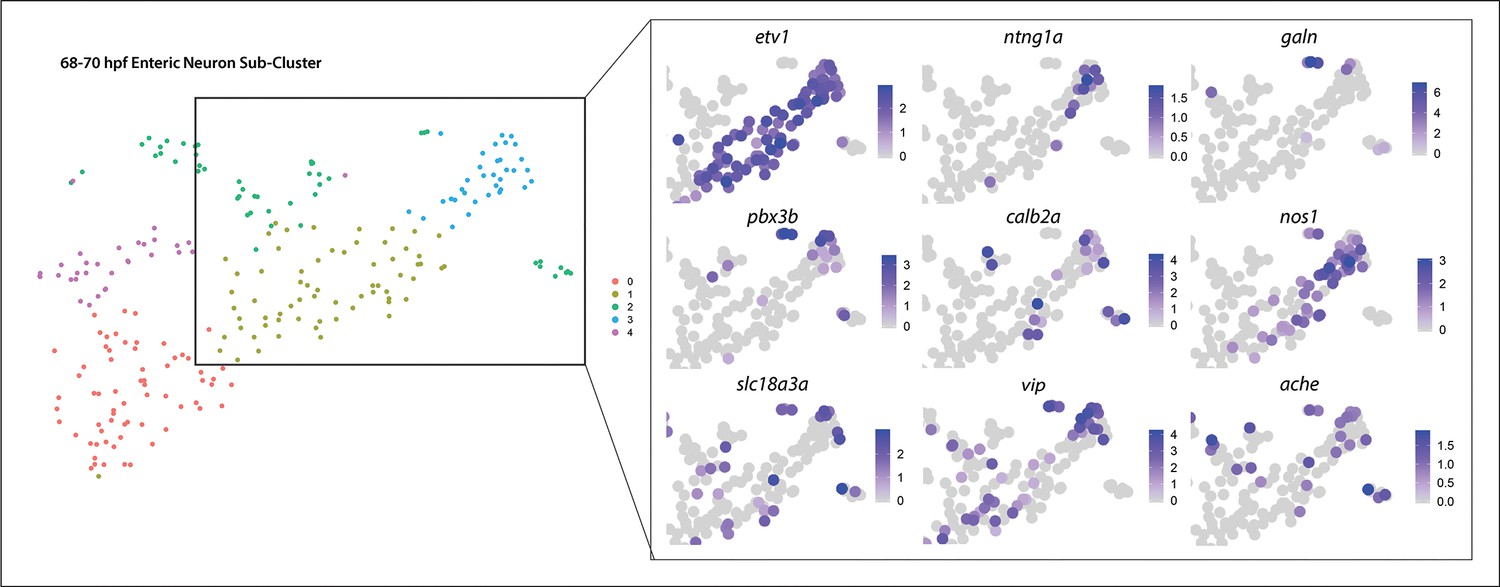
Enteric neuron subtype diversification gene expression patterns seen in enteric neuron Sub-clusters related to Figure 5D,E Panel of tSNE feature plots magnified and cropped to focus on progressively differentiating enteric neurons (highlighted by etv1 expression).
Subtype diversification and IPAN emergence depicted via combinatorial gene expression (etv1, ntng1a, pbx3b, slc18a3a, calb2a, and ache) localized to the distal tip of Sub-cluster 3. Inhibitory neuron markers, nos1, vip, and galanin (galn) were present within the pocket of diverging enteric subtypes.
Figure 5—figure supplement 2

Enteric and sympathetic neuron markers distinguished among common autonomic neuron precursors.
UMAP analysis of Sub-clusters depicts enteric and sympathetic neurons delineating from a common pool of autonomic neurons. (A) UMAP plot generated following re-clustering of Clusters 5 and 12 from the 68–70 hpf data set. (B) Dot plot depicts expression levels of general autonomic neuron makers (ascl1a, hand2, phox2a, phox2bb), sympathetic neuron markers (th, dbh, lmo1, insm1a) and enteric neuron markers (vipb, etv1, nos1, gfra1a) within Sub-clusters 0–4. (C) Dendrogram denotes similarity of Sub-clusters based on average gene expression of each cell within the Sub-clusters, which reveals transcriptomic distinction of enteric neuron Sub-cluster 3. (D–F). Feature plots highlight the expression of autonomic, sympathetic, and enteric neuron gene markers within UMAP Sub-clusters.
Figure 6 with 2 supplements
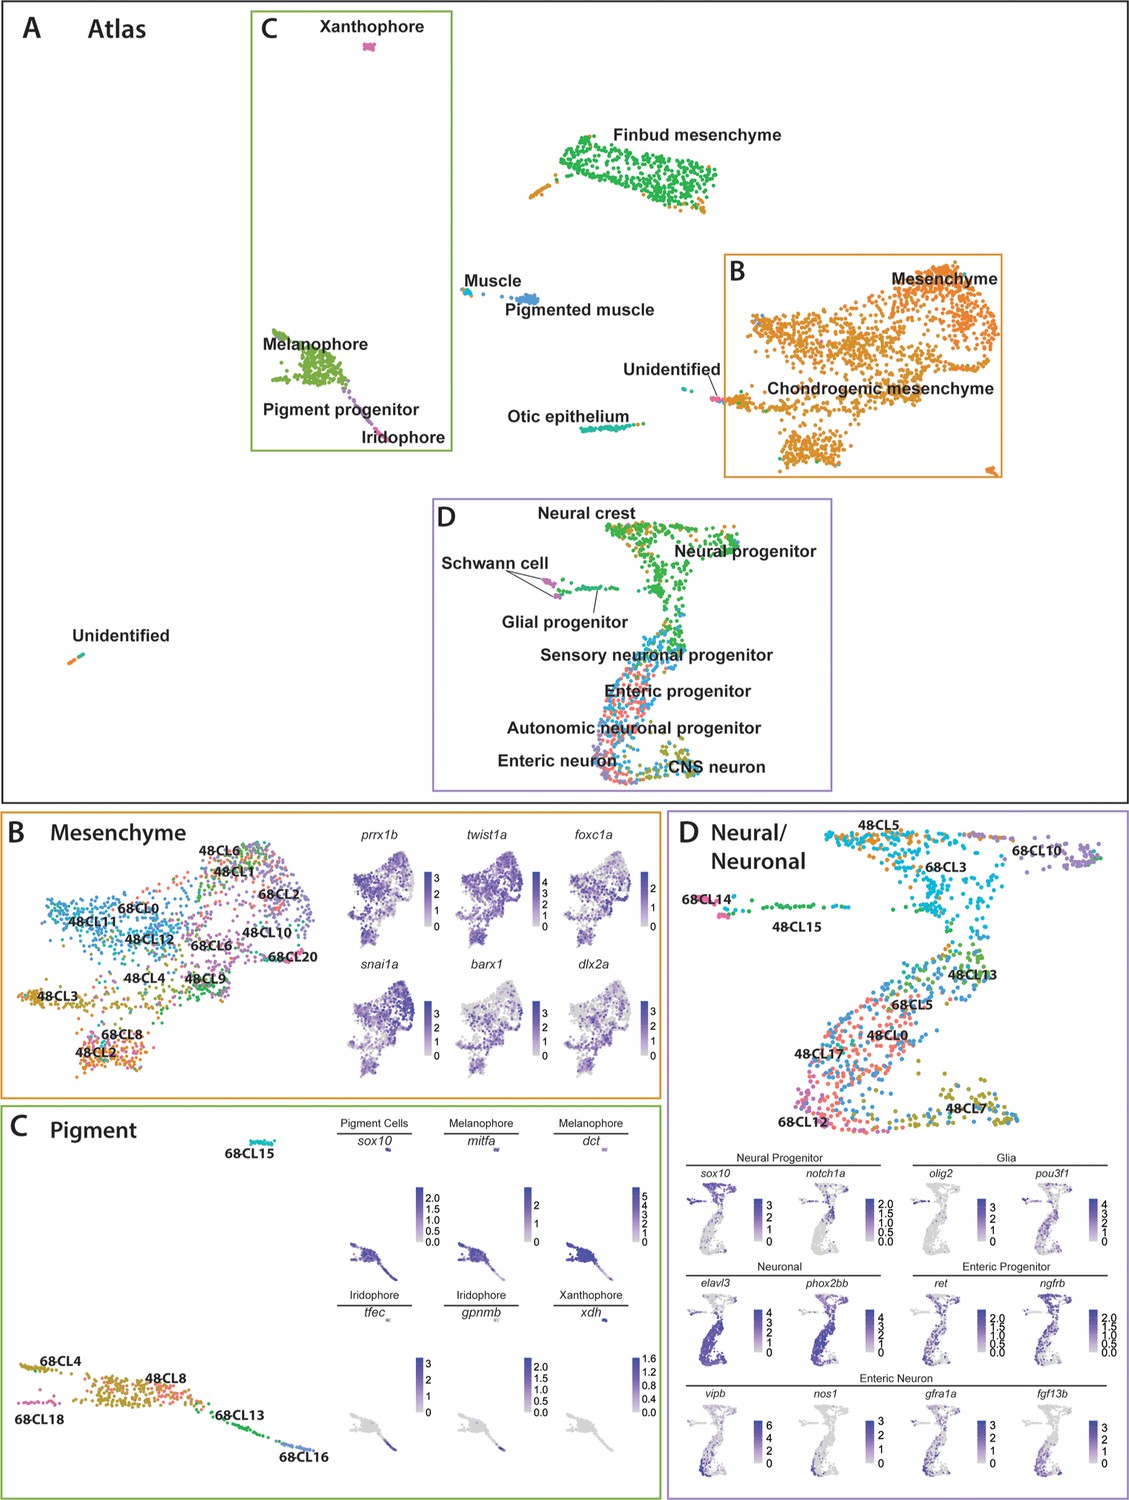
Integrated atlas of posterior sox10:GFP+ cell types spanning the embryonic to larval transition.
(A) Global UMAP embedding demonstrating the clustering of cell types across 48–50 hpf and 68–70 hpf. Cell labels were transferred from the original curation (Figure 1—source data 2) to the new atlas after its creation, allowing for assessment of cell type organization. (B) Previously identified mesenchyme clusters form a large discernible cluster marked by prrx1b, twist1a, foxc1a, and snai1a, which was separated into both chondrogenic and general mesenchyme, as denoted by its differential expression of barx1 and dlx2a. Importantly, nearly every 48–50 hpf cell type nests with a cluster at 68–70 hpf. (C) Pigment cells clusters reflect differentiation paths described in Figure 4A. Melanophores at 48–50 hpf group near to the 68–70 hpf melanophore cluster, bipotent pigment progenitors bridges both the iridophores and melanophores. Xanthophores cluster separately, reflecting their distinct lineage of origin at this developmental window. (D) Detailed analysis of the larger neural/neuronal cluster shows clear progression of cell fates from progenitor to differentiating glia or neuron. The expression of enteric neuronal markers is distinct from other subtypes at this dataset.
-
Figure 6—source data 1
List of marker genes per major cell type identity in the sox10:GFP+ merged atlas.
Tables reporting the Seurat output for genes for each major cell type identity including p-values (<0.01), average log-fold change (≥0.25), adjusted p-values (≤1.0), pct.1 summarizing proportion of cells expressing the individual gene in the cluster identity category, pct.2 showing the proportion of cells expressing the individual gene in all cluster identity categories in the atlas dataset.
- https://cdn.elifesciences.org/articles/60005/elife-60005-fig6-data1-v1.xlsx.zip
Figure 6—figure supplement 1
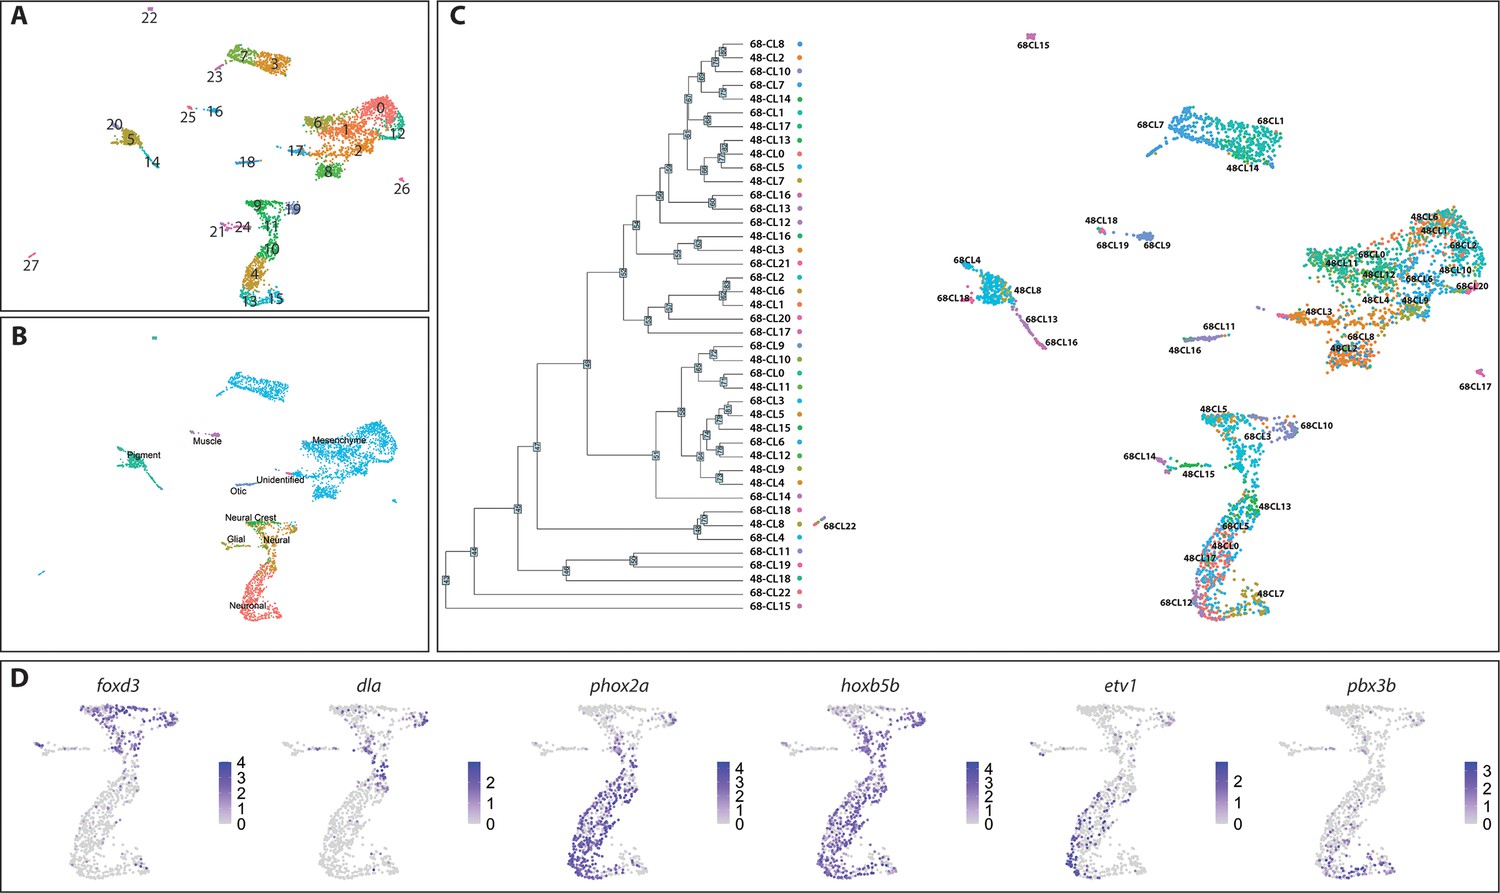
Annotated sox10:GFP+ atlas labeled by cell types.
(A) UMAP labeling the 27 new clusters formed after merging the 48–50 and 68–70 hpf sox10:GFP+ datasets. (B) Following label transfer integration, major cell type classifications (Figure 1) group together into distinct clusters across the UMAP. (C) High-resolution visualization of both clustering of original cluster labels, as well as their position within the UMAP. Cell categories segregate in the dendrogram largely as expected from the UMAP visualization. (D) Additional markers, including foxd3, dla, phox2a, hoxb5b, etv1, and pbx3b, are shown by UMAP for validation of the neural/neuronal clusters.
Figure 6—figure supplement 2
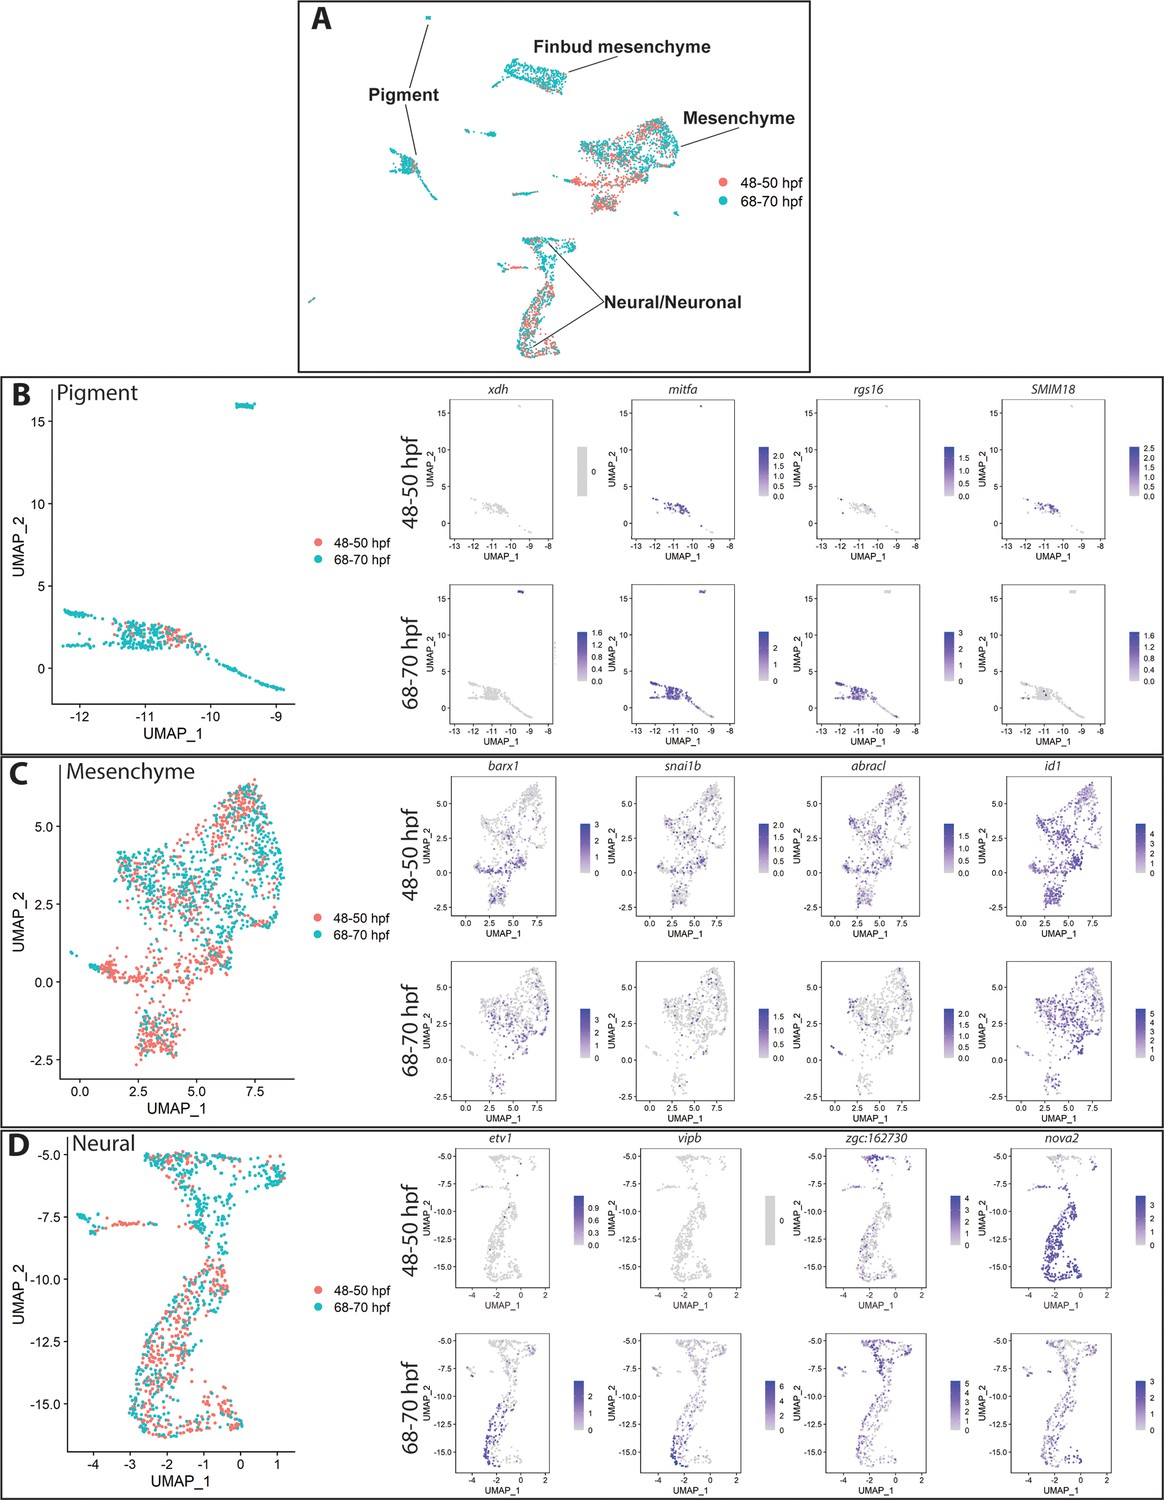
Differential expression among pigment, mesenchyme and neural/neuronal subsets of the sox10:GFP+ atlas (A) UMAP visualization of cells labeled by source identity (either 48–50 hpf or 68–70 hpf) following integration.
All 48–50 hpf cells (pink) approximately map to a major cluster found at 68–70 hpf (aqua). (B–D) Subset of the pigment clusters (B), the mesenchyme clusters (C), and the neural/neuronal clusters (D) highlighting several differentially expressed genes between the cells derived from each timepoint.
Figure 7 with 1 supplement
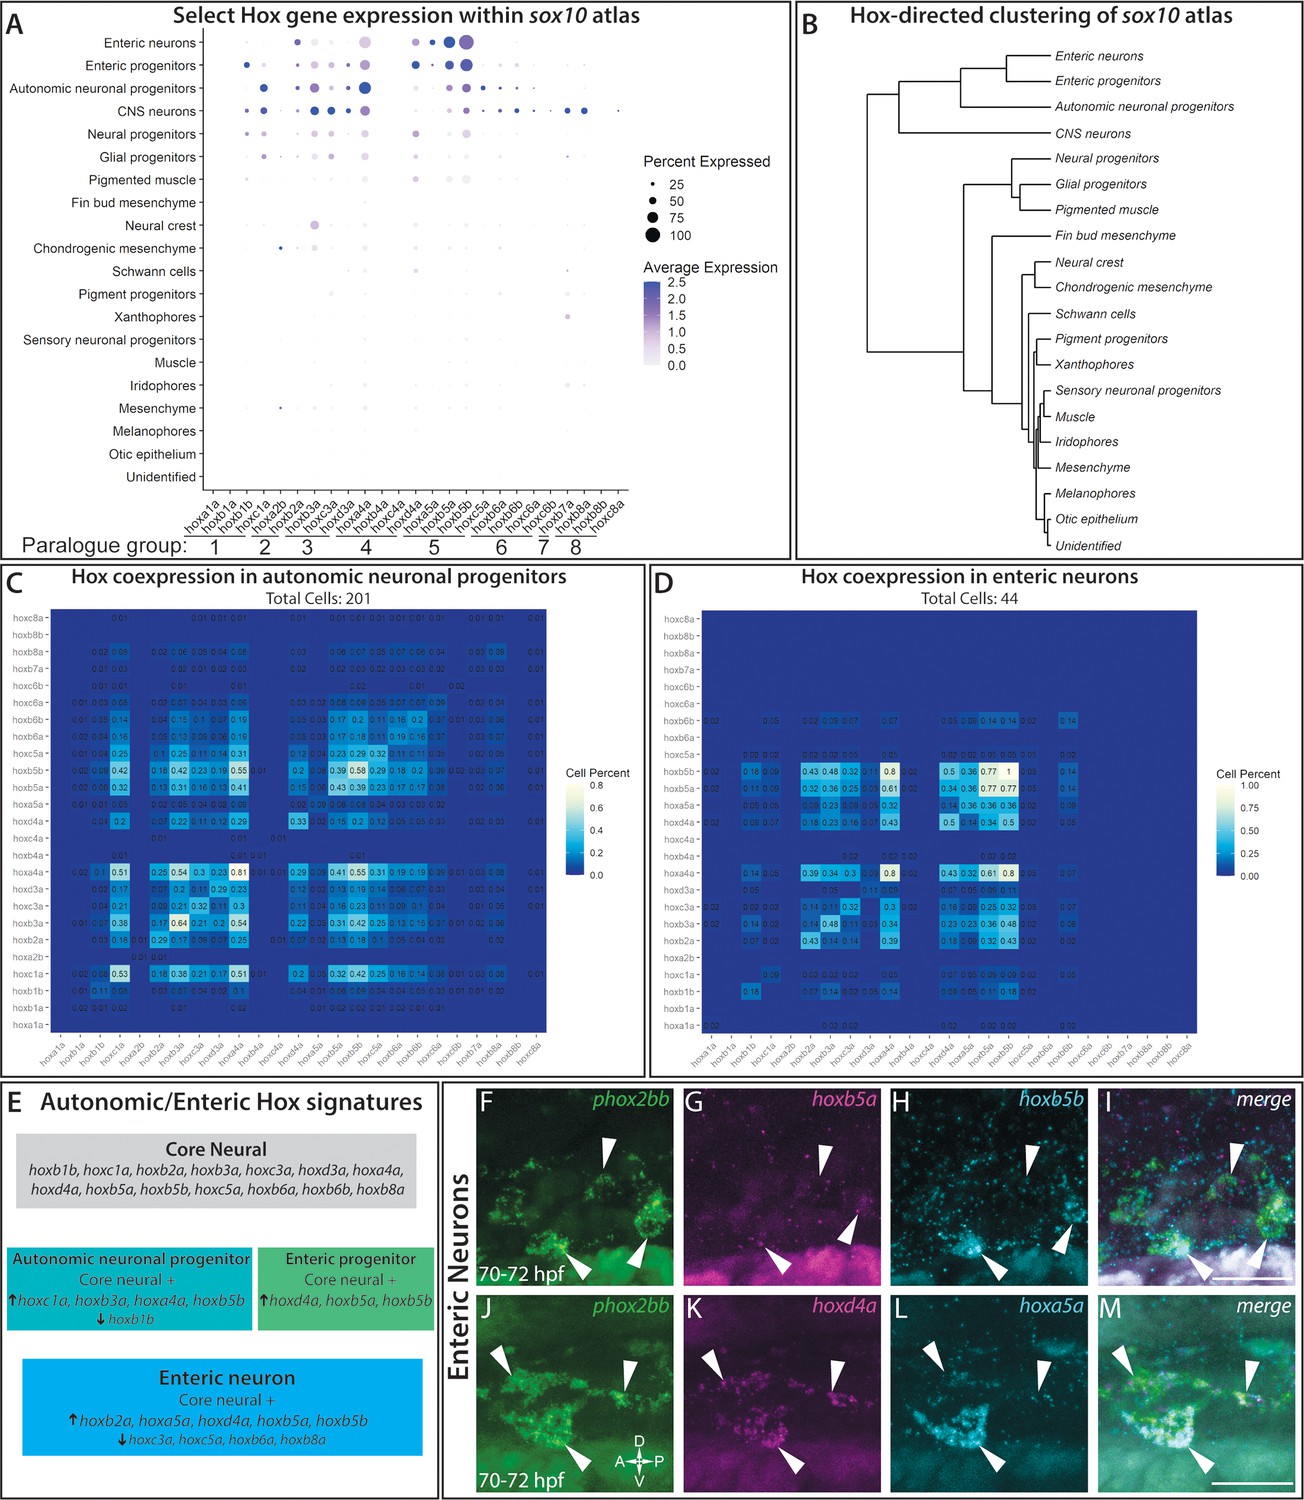
hox genes expressed across cell lineages within the sox10:GFP+ atlas.
(A) Dot plot shows both the mean expression (color) as well as percent of cells (size) per lineage for zebrafish hox genes in the first eight paralogy groups (PG). The full list of hox gene expression profiles per lineage can be found in Figure 7—figure supplement 1. Discrete hox profiles discern specific cell types, which is particularly evident in the enteric neuronal cluster. (B) Clustering of atlas lineages based hox expression profiles groups highlights robust core neural signature, which distinguishes the neural lineages from the remainder of the clades. Neural and glial progenitors formed an intermediate clade between the low-hox expressing lineages and the main neural branch. Additionally, the fin bud mesenchyme, which also has a highly distinctive hox profile, also forms a distinct clade. Subtle variations in hox expression by remaining lineages are further reflected in the remaining portion of the dendrogram; however, these are far less distinct. (C–D) Pairwise comparison of the fraction of cells in either the autonomic neural progenitor lineage (C) or the enteric neurons (D) for the first eight parology groups. Intersection of the gene pairs reflect the fraction of cells with expression for both genes with a log2 Fold change values > 0, with the identical gene intersections along the primary diagonal representing the total number of cells which express that gene in the lineage. Enteric neural hox signature was not only specific to this cell population, but also was abundantly co-expressed. (E) Summary panel describing the specific autonomic and enteric hox signatures detected. A common hox expression profile, referred to as the core signature, was found that is then modified across the specific lineages. (F–M) In situ validation of the chief enteric neural hox signature via HCR. phox2bb (F–J) labels enterically fated neurons at the level of the midgut in larval stage embryos fixed at 70–72hpf. White arrows highlight specific cells of interest. Key hox signature constituents hoxb5a (G) and hoxb5b (H) or hoxd4a (K) and hoxa5a (L) were found to be co-expressed within phox2bb expressing cells (White Arrows). Scale bars in (I,M): 50 μm.
Figure 7—figure supplement 1
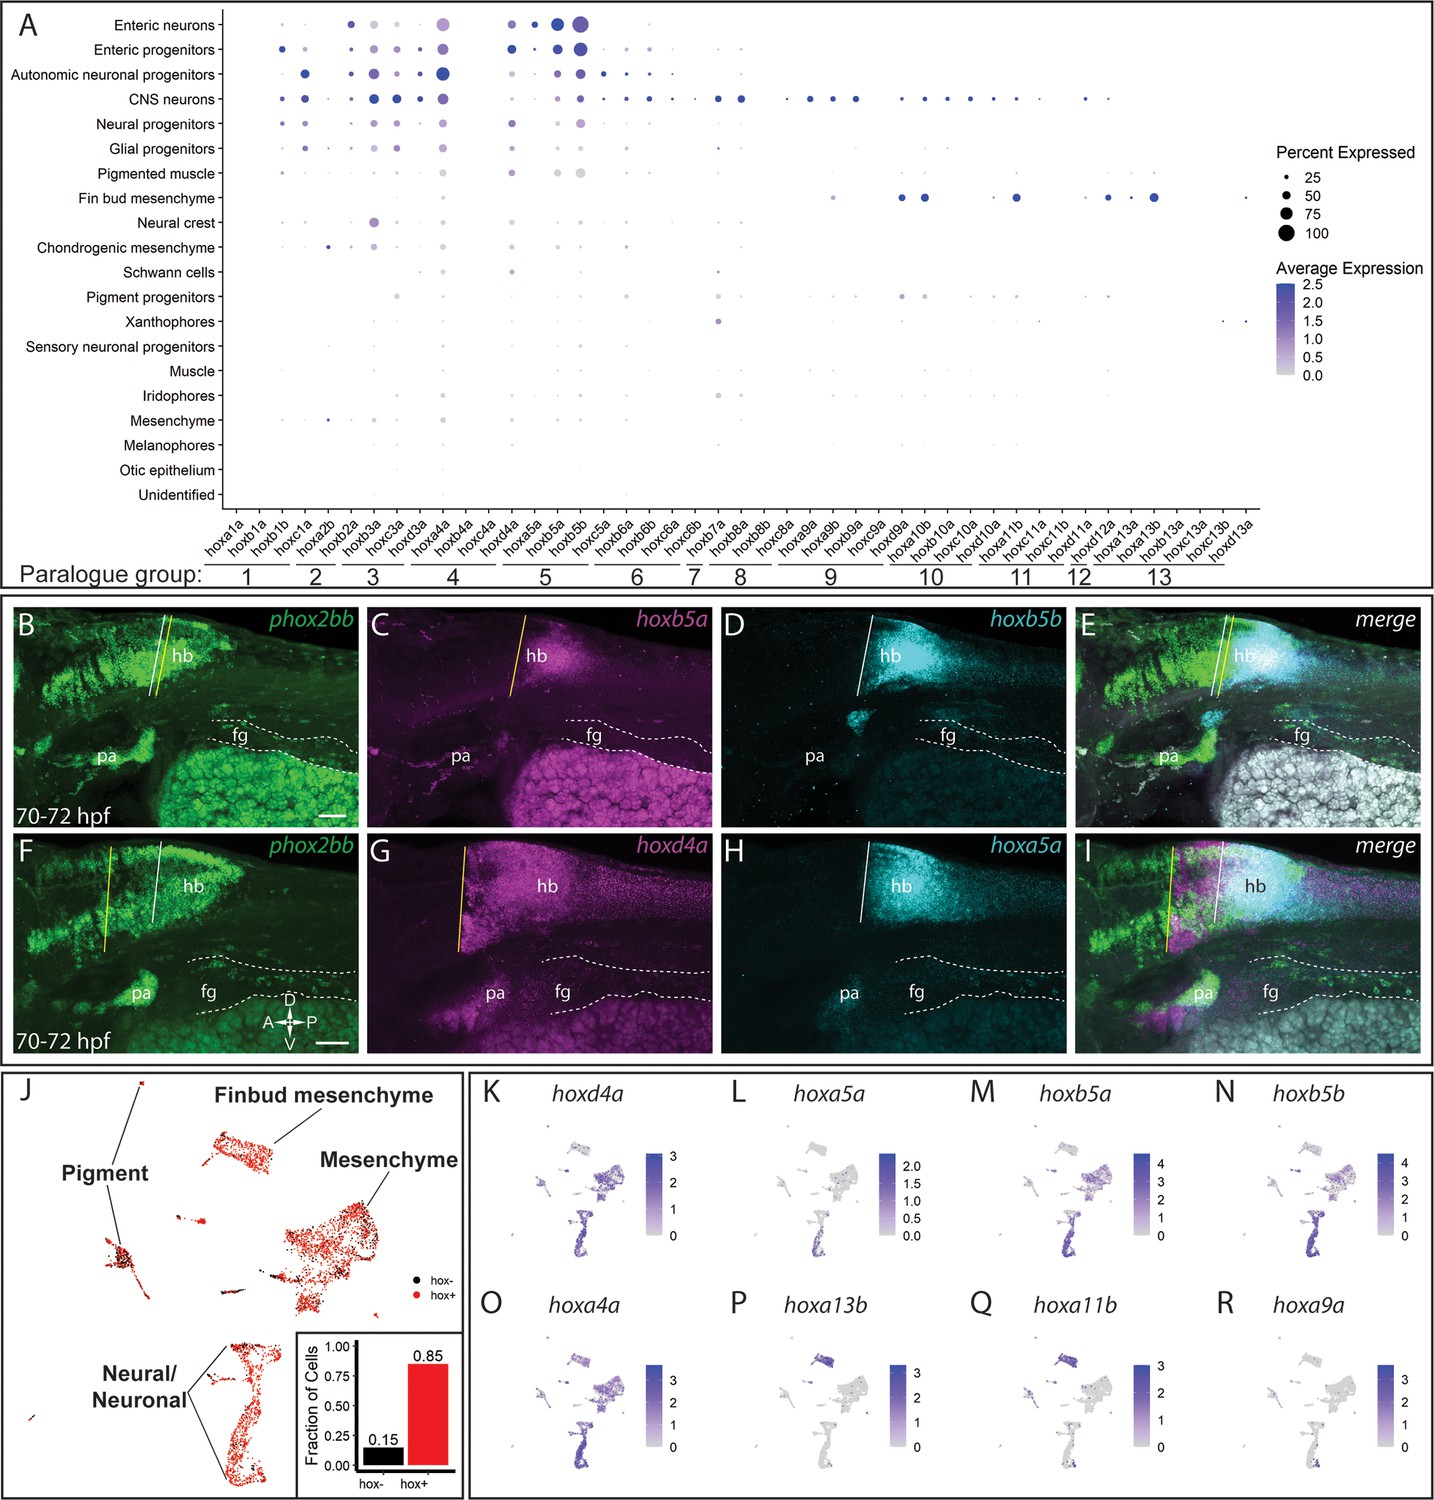
Comprehensive overview of hox expression profiles within the atlas.
(A) Similar to Figure 7A,a comprehensive dot plot shows both the mean expression (color) as well as percent of cells per lineage (size) for zebrafish all hox genes. Discrete hox profiles discern specific cell types, which is particularly evident in the enteric neuronal cluster, as well as the fin bud mesenchyme. (B–I) Hindbrain expression patterns for enteric hox profiles. Autonomic neural marker phox2bb clearly marks the midbrain and hindbrain (hb) domains, as well as the pharyngeal arches (pa). Enterically fated cells can also clearly be seen along the tract of the gut (dash region), starting the foregut (fg). Anterior domains for hoxb5a (C), hoxb5b (D), hoxd4a (G), and hoxa5a (H) are represented by a vertical line. Overlapping regions can be approximated by the merged images (E, I). Scale in (B, F): 50 μm; dorsoventral-rostrocaudal axis defined in (F). (J) UMAP of the atlas demonstrating pervasive hox expression throughout the dataset. Expression was defined as having a log2 fold change >0. Approximately 85% of cells contained expression for at least one hox gene. (K–R) Feature plots representing the expression of selected hox genes within the atlas UMAP. hoxd4a (K), hoxa5a (L), hoxb5a (M), hoxb5b (N) all localize in varying degrees to the enteric neural signature, though hoxd4a also marks the mesenchymal clusters, as seen (A). hoxa4a (O) highlights its pervasive expression among the clusters. hoxa13b (P) and hoxa11b (Q) are key markers denoting the fin bud mesenchyme. Alternative neural populations are further identified by their hoxa9a (R) expression profile, contrasting with the enteric populations.
Tables
Key resources table
| Reagent type (species) or resource | Designation | Source or reference | Identifiers | Additional information |
|---|---|---|---|---|
| Recombinant DNA reagent | phox2bb | Uribe and Bronner, 2015 | ||
| Recombinant DNA reagent | sox10 | Dutton et al., 2001 | ||
| Recombinant DNA reagent | mmp2 | Mammalian Gene Collection Program Team et al., 2002 | ||
| Sequence-based reagent | notch1a | Uribe Lab | Forward 5'-CAGTGGACTCAGCAGCATC-3' Reverse 5'-CCTTCCGACCAATCAGACAAG-3' | |
| Sequence-based reagent | dla | Uribe Lab | Forward 5'-CAGCCAAGTTGCTCAGAG-3' Reverse 5'-GTACAGAGAACCAGCTCATC-3' | |
| Sequence-based reagent | foxc1a | Uribe Lab | Forward 5'-ATACGGTGGACTCTGTGG-3' Reverse 5'-CAGCGTCTGTCAGTATCG-3' | |
| Genetic reagent (Danio rerio) | AB | ZIRC | Wild-type zebrafish | |
| Genetic reagent (Danio rerio) | Tg(−4.9sox10:egfp)ba2Tg | Carney et al., 2006 | GFP Labeled Neural Crest Cells | |
| Commercial assay, kit | mitfa | Molecular Instruments | NM_130923.2 | |
| Commercial assay, kit | tfec | Molecular Instruments | NM_001030105.2 | |
| Commercial assay, kit | xdh | Molecular Instruments | XM_683891.7 | |
| Commercial assay, kit | phox2bb | Molecular Instruments | NM_001014818.1 | |
| Commercial assay, kit | ngfrb | Molecular Instruments | NM_001198660.1 | |
| Commercial assay, kit | gfra1a | Molecular Instruments | NM_131730.1 | |
| Commercial assay, kit | crestin | Molecular Instruments | AF195881.1 | |
| Commercial assay, kit | foxd3 | Molecular Instruments | NM_131290.2 | |
| Commercial assay, kit | vipb | Molecular Instruments | NM_001114555.1 | |
| Commercial assay, kit | elavl3 | Molecular Instruments | NM_131449 | |
| Commercial assay, kit | oprl1 | Molecular Instruments | NM_205589.2 | |
| Commercial assay, kit | barx1 | Molecular Instruments | NM_001024949.1 | |
| Commercial assay, kit | pbx3b | Molecular Instruments | BC131865.1 | |
| Commercial assay, kit | prrx1b | Molecular Instruments | NM_200050.1 | |
| Commercial assay, kit | slc18a3a | Molecular Instruments | NM_0010775550.1 | |
| Commercial assay, kit | hoxb5a | Molecular Instruments | NM_131101.2 | |
| Commercial assay, kit | hoxb5b | Molecular Instruments | bc078285.1 | |
| Commercial assay, kit | hoxd4a | Molecular Instruments | NM_001126445 | |
| Commercial assay, kit | hoxa5a | Molecular Instruments | NM_131540.1 | |
| Commercial assay, kit | twist1a | Molecular Instruments | NM_130984.2 | |
| Commercial assay, kit | Single Cell 3' v2 Chemistry Kit for 10,000 cells | 10x Genomics | CG00052 | https://support.10xgenomics.com/single-cell-gene-expression/library-prep/doc/user-guide-chromium-single-cell-3-reagent-kits-user-guide-v2-chemistry |
| Commercial assay, kit | NextSeq 500/550 Mid Output Kit v2.5 (150 Cycles) | illumina | 20024904 | https://www.illumina.com/products/by-type/sequencing-kits/cluster-gen-sequencing-reagents/nextseq-series-kits-v2-5.html |
| Chemical compound, drug | 1-phenyl 2-thiourea (PTU)/E3 solution | Karlsson 741 et al., 2001 | Sigma-Aldrich | P7629 |
| Chemical compound, drug | Tricaine | A5040 | Sigma | |
| Chemical compound, drug | Accumax buffer | A7089 | Sigma-Aldrich | |
| Chemical compound, drug | Hank’s Buffer | 55021C | Sigma-Aldrich | |
| Chemical compound, drug | Phusion-HF | M0530S | New England Biolabs | |
| Chemical compound, drug | Zero Blunt TOPO PCR Cloning Kit | 451245 | Invitrogen | |
| Software, algorithm | R v3.6.3 | R-project | RRID:SCR_001905 | https://www.r-project.org/ |
| Software, algorithm | Seurat v3.1.1 | Satija Lab | RRID:SCR_007322 | https://github.com/satijalab/seurat |
| Software, algorithm | Fiji | PMID:22743772 | RRID:SCR_002285 | https://imagej.net/Fiji |
| Software, algorithm | IMARIS v9.2 | Bitplane | RRID:SCR_007370 | Bitplane.com |
| Software, algorithm | PANTHER | GENEONTOLOGY Unifying Biology | RRID:SCR_004869 | http://pantherdb.org |
| Software, algorithm | Cell Ranger v2.1.0 | 10x Genomics | RRID:SCR_017344 | Zheng et al., 2017, https://support.10xgenomics.com/single-cell-gene-expression/software/pipelines/latest/what-is-cell-ranger |
Additional files
Download links
A two-part list of links to download the article, or parts of the article, in various formats.
Downloads (link to download the article as PDF)
Open citations (links to open the citations from this article in various online reference manager services)
Cite this article (links to download the citations from this article in formats compatible with various reference manager tools)
An atlas of neural crest lineages along the posterior developing zebrafish at single-cell resolution
eLife 10:e60005.
https://doi.org/10.7554/eLife.60005


