Structure of MlaFB uncovers novel mechanisms of ABC transporter regulation
- Department of Cell Biology, New York University School of Medicine, United States
- Applied Bioinformatics Laboratory, New York University School of Medicine, United States
- Department of Microbiology, New York University School of Medicine, United States
Figures
Figure 1 with 2 supplements
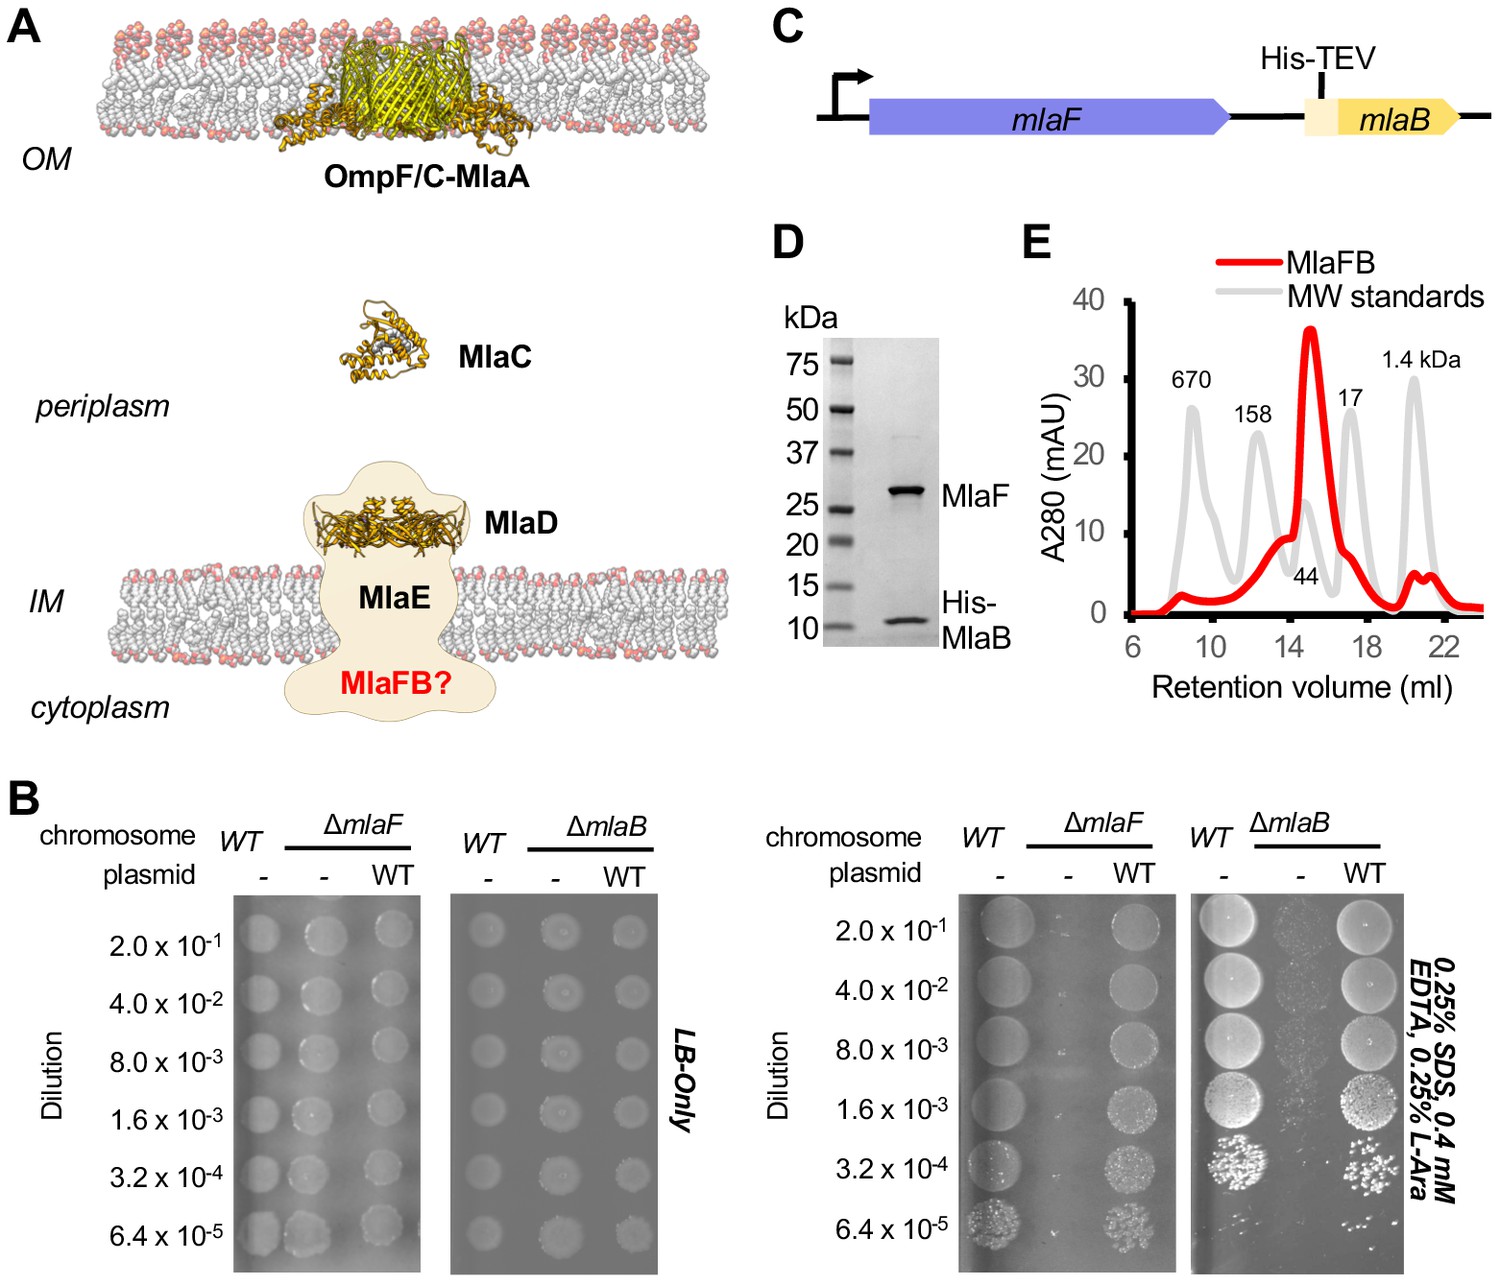
Characterization of MlaFB complex.
(A) Schematic of the Mla pathway including the soluble periplasmic protein MlaC (PDB 5UWA), outer membrane complex, OmpF/C-MlaA (PDB 5NUP) and integral inner membrane complex, MlaFEDB (PDB 5UW2, EMDB-8610). (B) Cellular assay for the function of MlaF and MlaB. 10-fold serial dilutions of the indicated cultures spotted on LB only (top) or LB plates containing SDS and EDTA at the concentrations indicated (bottom) and incubated overnight. The mlaF and mlaB single knockouts grow poorly in the presence of SDS+EDTA, but can be rescued by the expression of WT mlaF or mlaB constructs, respectively. Results depicted are representative of at least three biological replicates. (C) Schematic of the MlaFB operon. (D) SDS PAGE and (E) size exclusion chromatogram of purified MlaFB complex.
Figure 1—figure supplement 1
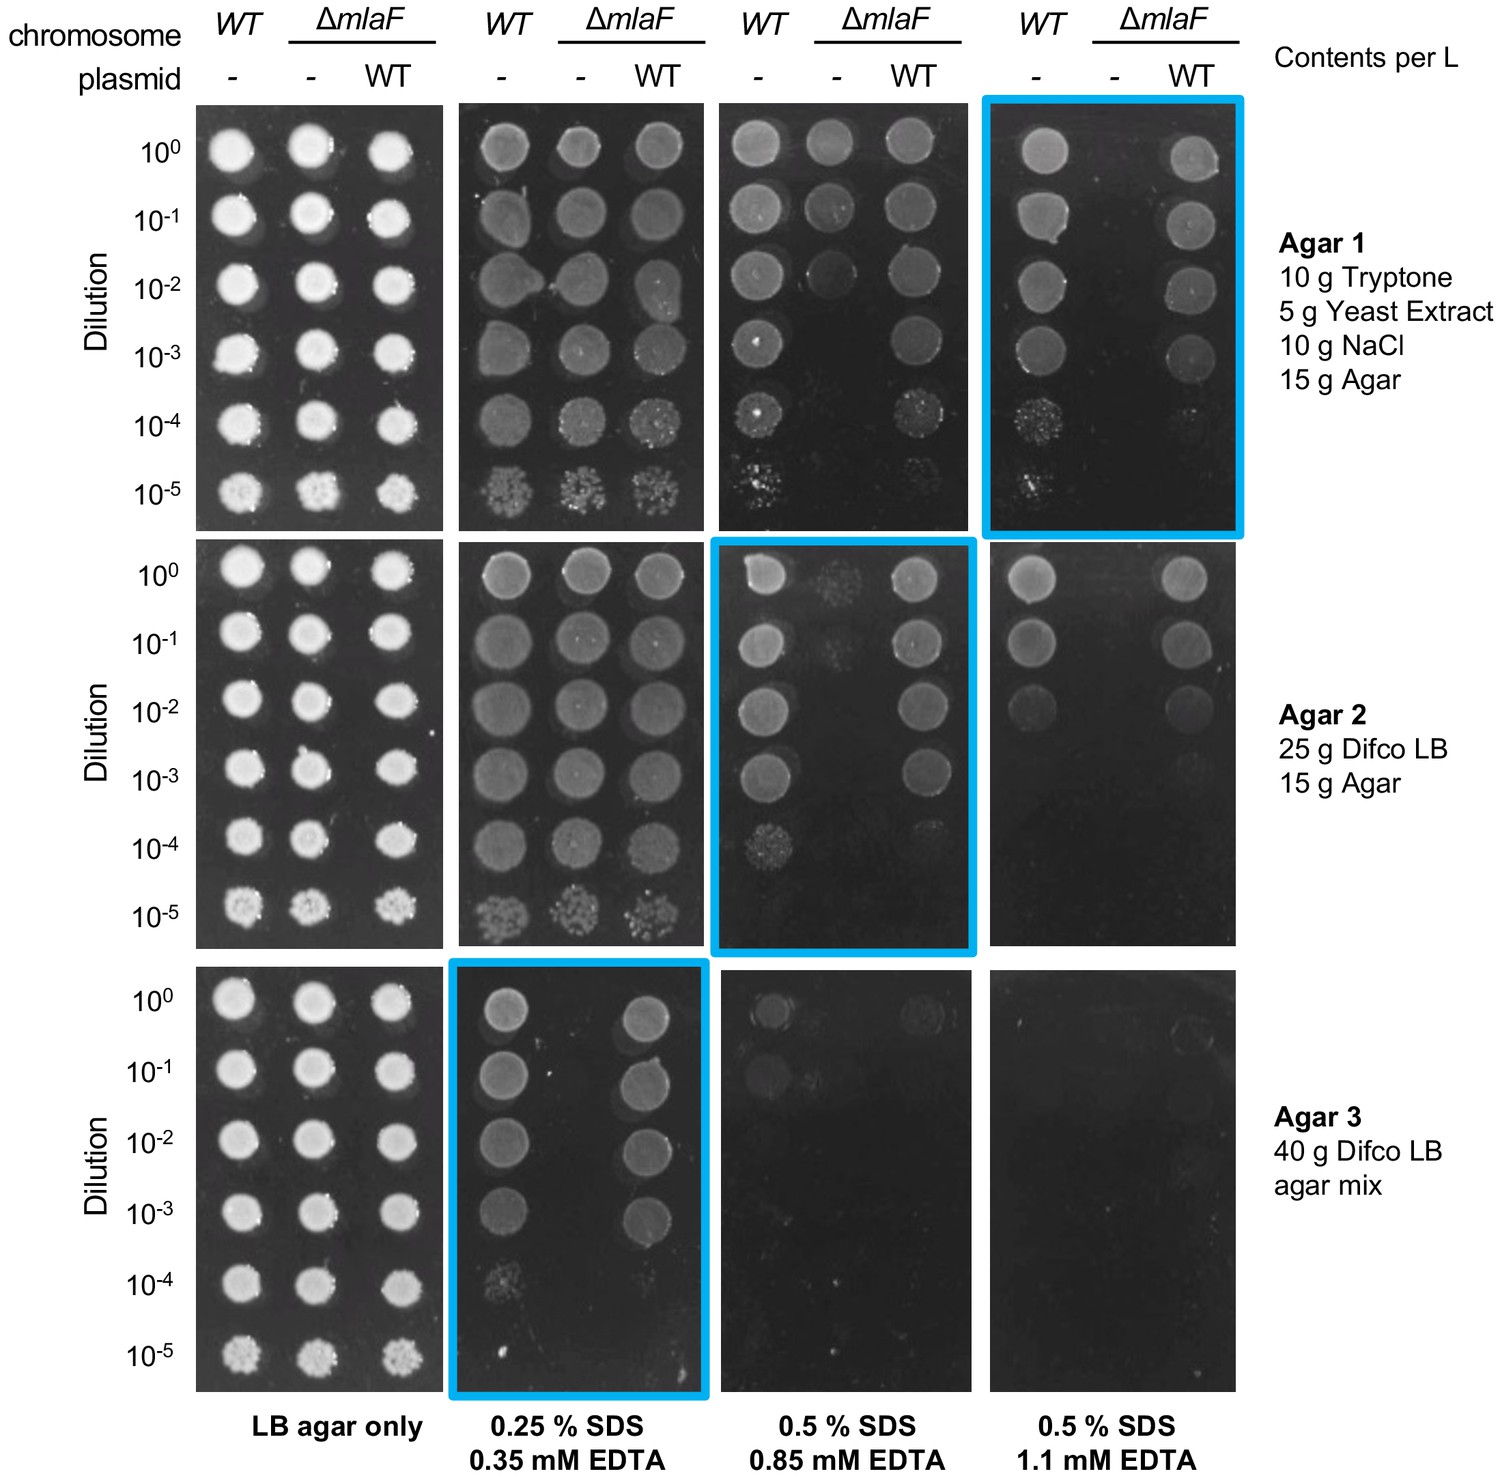
Optimization of conditions for growth analysis on different agar/media.
The concentrations of SDS and EDTA for different agar/media that resulted in optimal conditions for the assay are highlighted in blue.
Figure 1—figure supplement 2
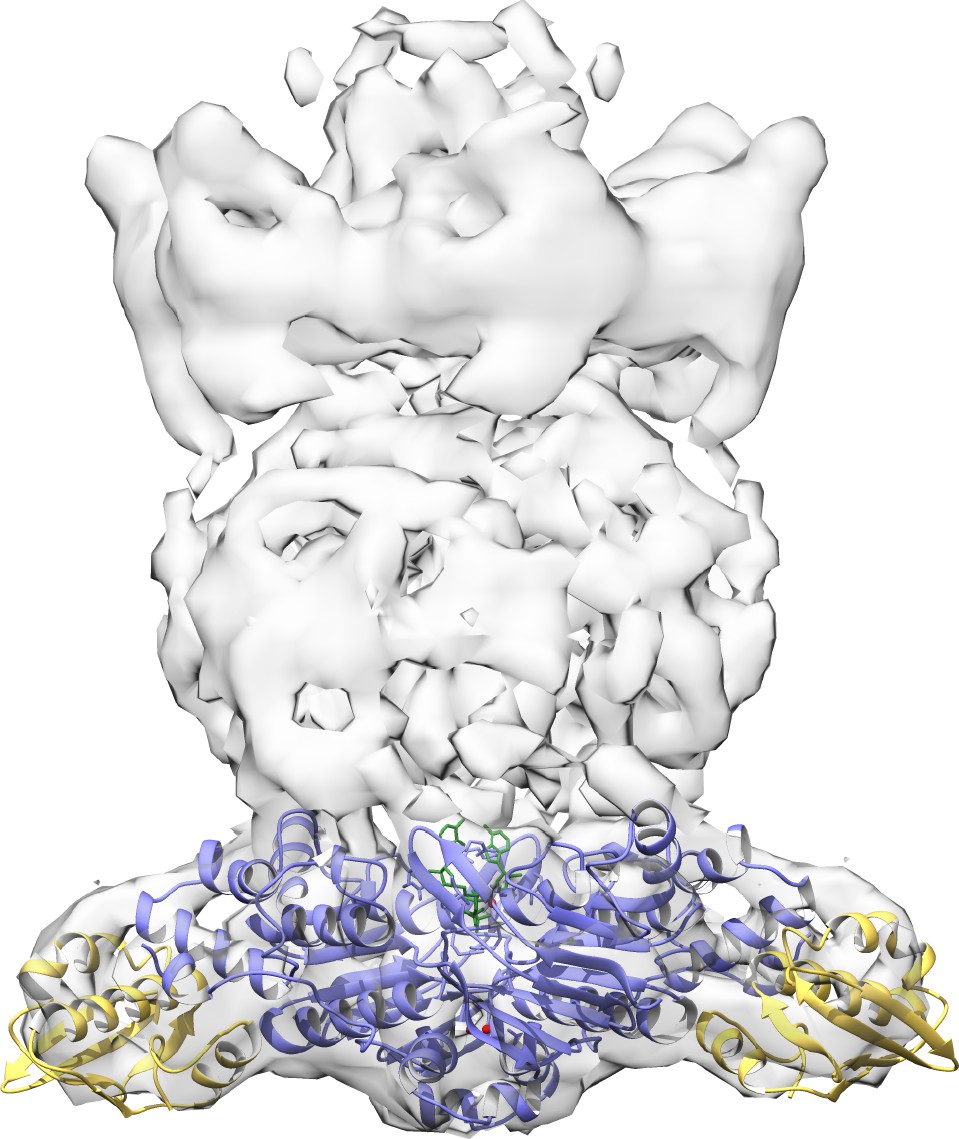
Docking of ADP-bound MlaF2B2 complex into previous low resolution EM density map of E. coli MlaFEDB (EMD-8610).
Figure 2 with 2 supplements
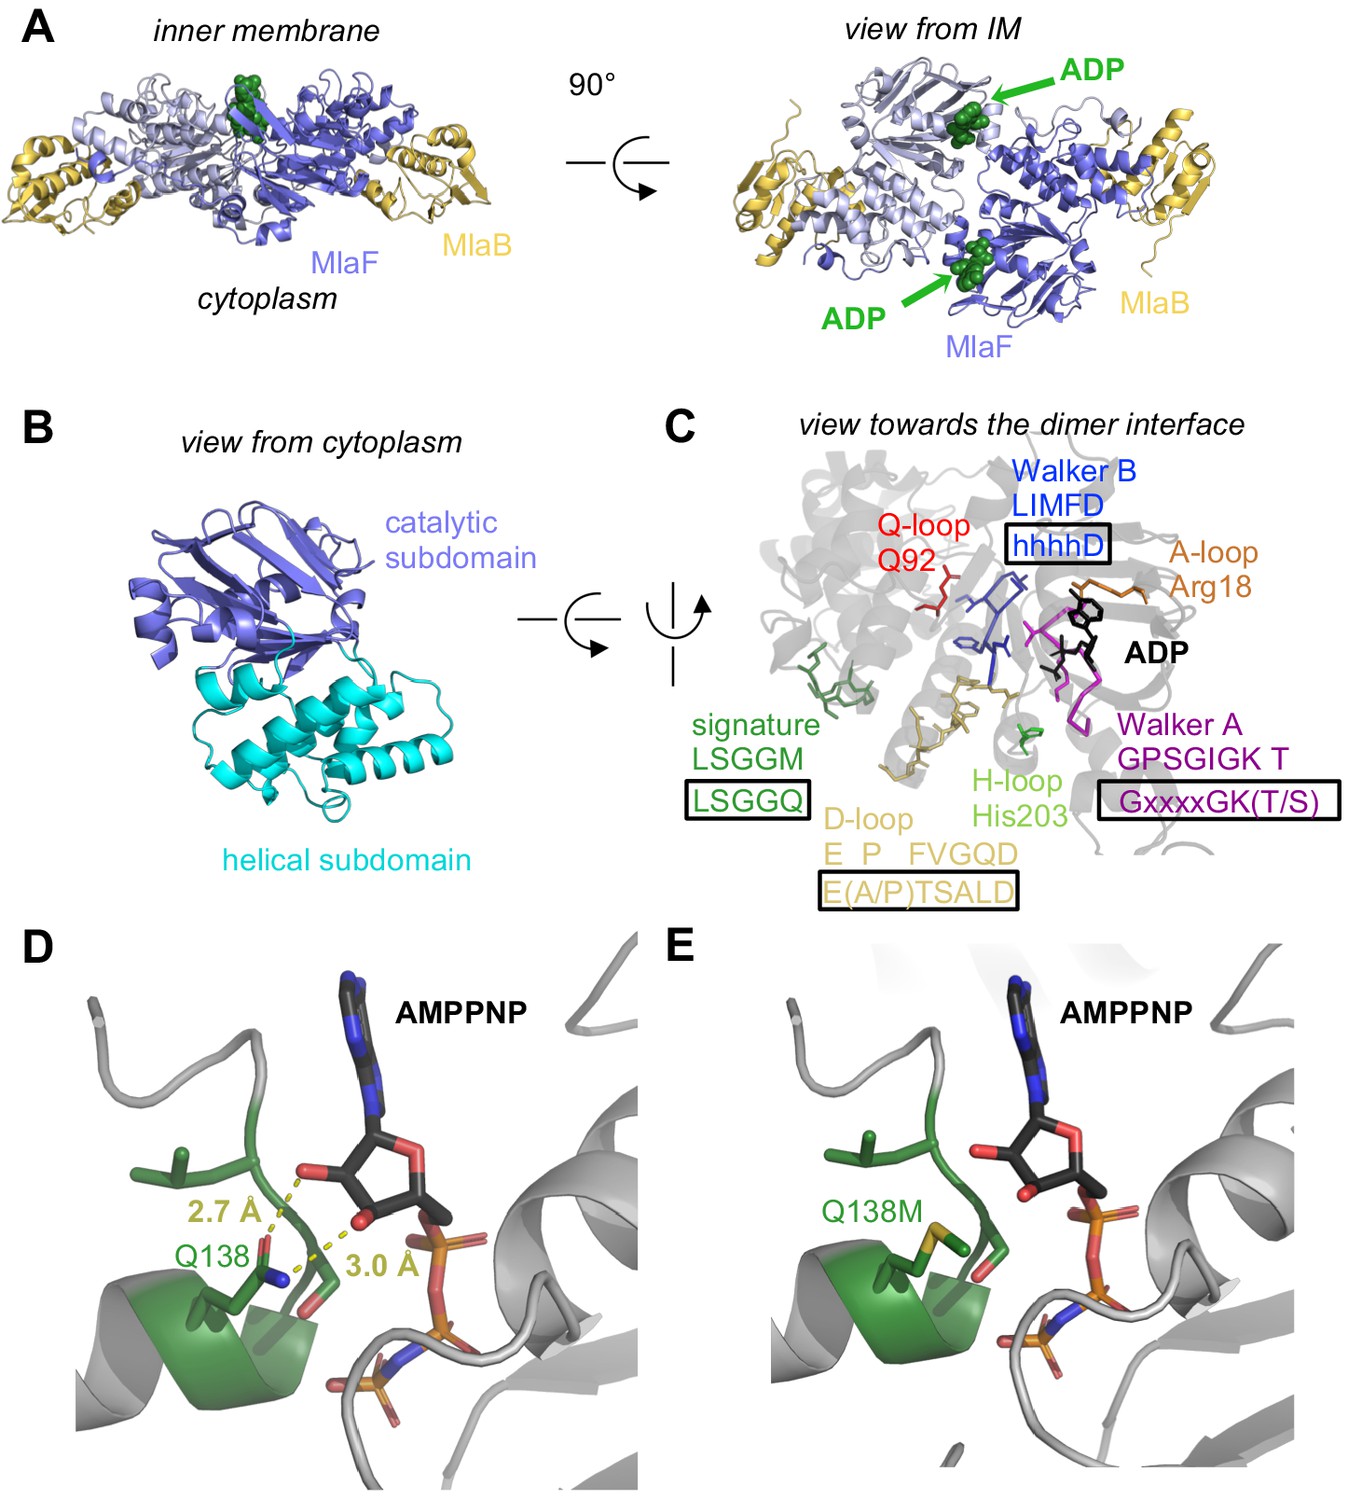
Crystal structure of ADP-bound heterodimeric MlaF2B2.
(A) Side and top view of the complex, formed by a dimer of MlaFB heterodimers; MlaF (purple) and MlaB (yellow) are shown in cartoon representation and ADP (green) is shown as spheres. (B) The two subdomains of MlaF. (C) Functionally important motifs in ABC domains highlighted for one protomer of MlaF with sequence shown directly below the motif name, and the consensus sequences displayed in rectangles. (D) Gln side chain of LSGGQ/signature motif, which is within hydrogen bonding distance of the 2’ and 3’ hydroxyls of ATP ribose moiety in many ABC transporter structures (depicted here, PDB: 3RLF [Oldham and Chen, 2011]). (E) Q138M mutation modeled in 3RLF, which shows that a Met at this position would be unable to make the same interactions with ATP.
Figure 2—figure supplement 1
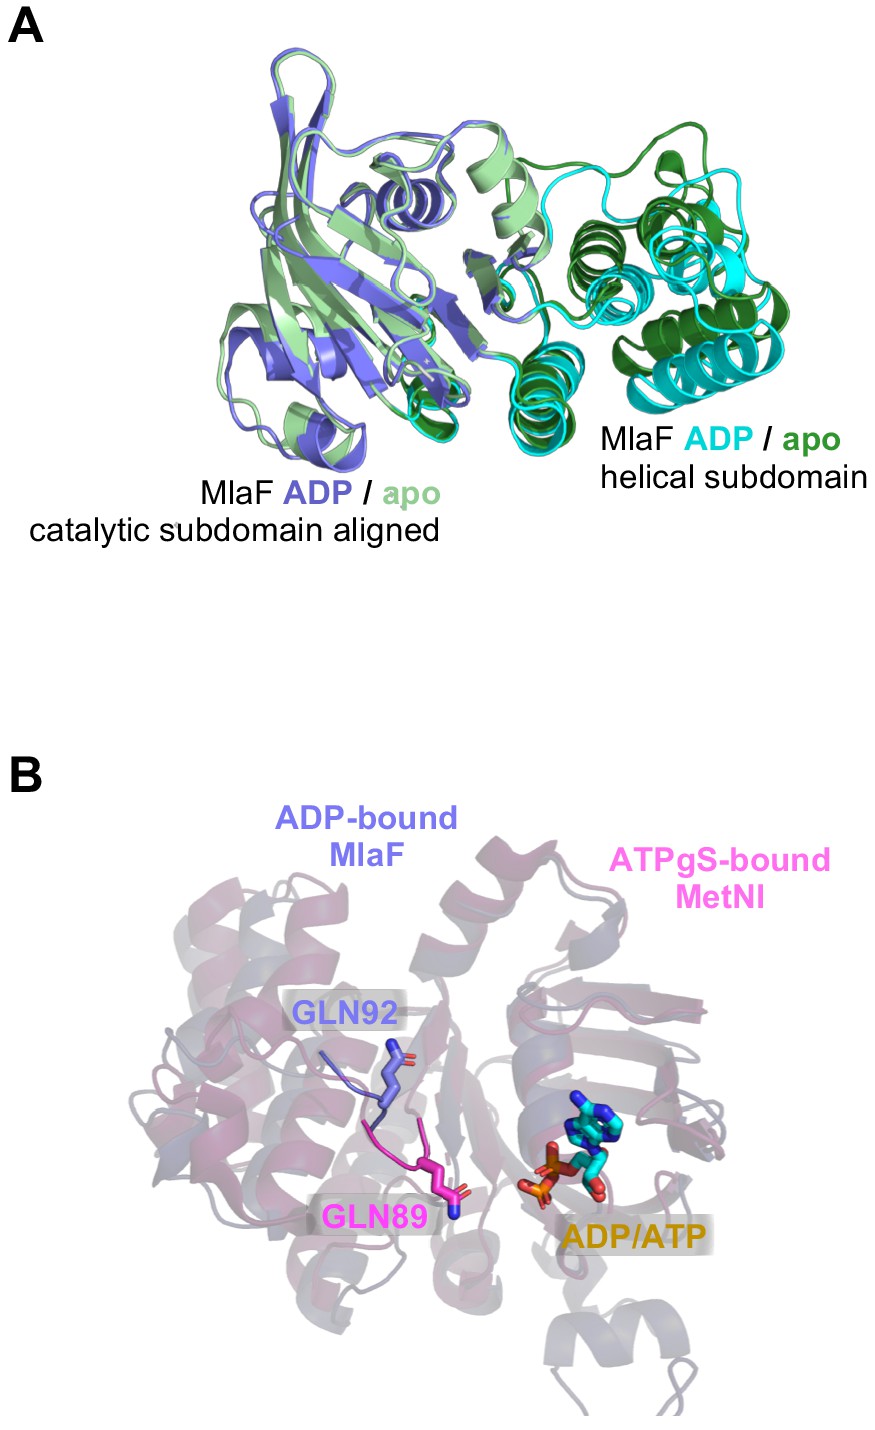
Position of Q-loop and subdomain conformations in different structures of MlaF.
(A) Comparison between our two crystal structures (MlaF1B1 and MlaF2B2), aligned on the catalytic subdomain. (B) Q-loop residues Gln92 (purple) from the ADP-bound MlaF structure and Gln89 from the ATPγS-bound MetNI structure (pink; PDB: 6CVL [Nguyen et al., 2018]), shown as sticks.
Figure 2—figure supplement 2
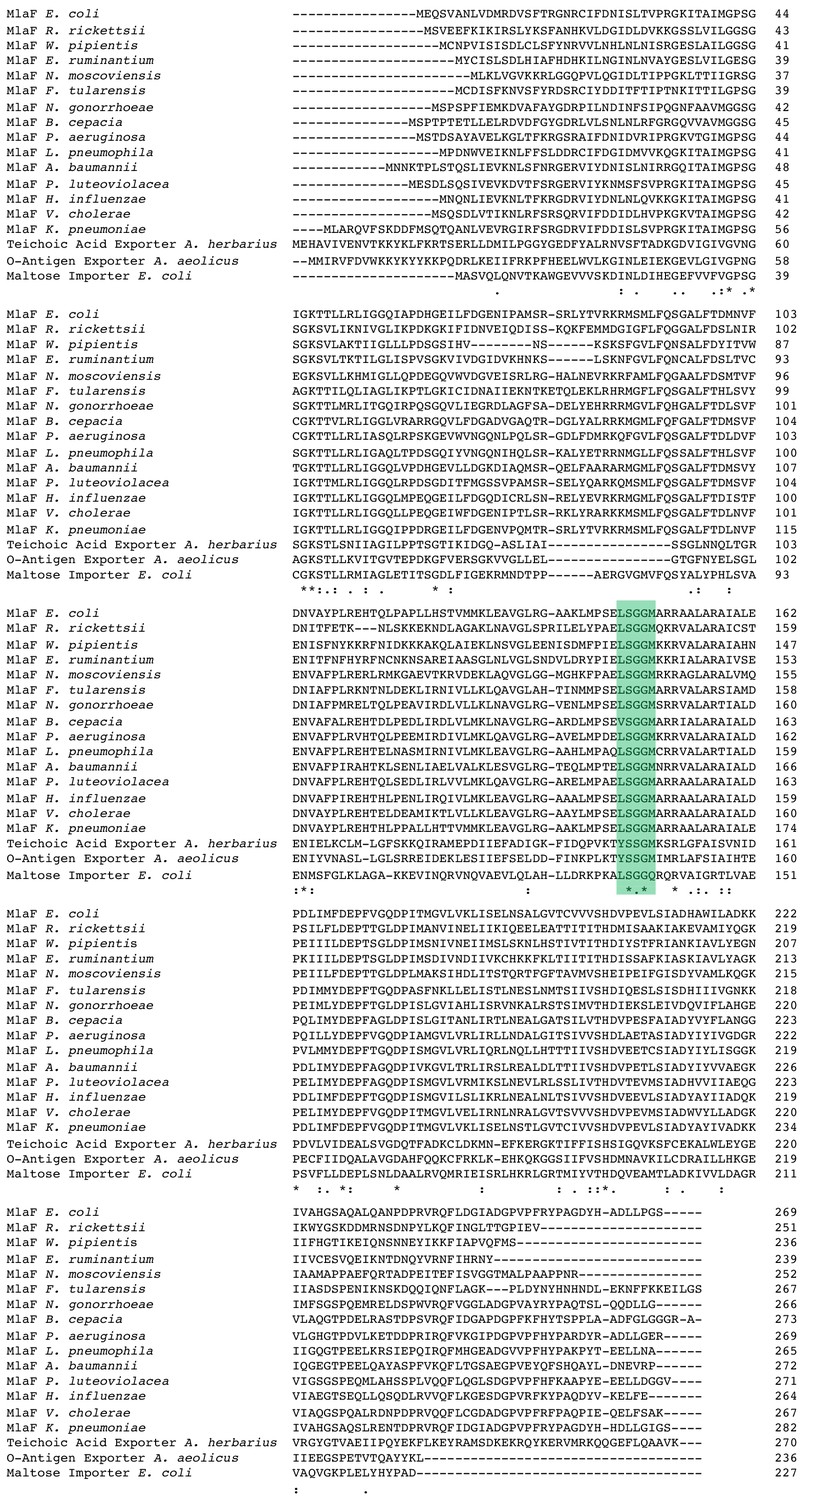
Sequence alignment of Mla, TGD-like MCE systems, o-antigen and teichoic acid transporter.
The conserved LSGGQ/M motif is highlighted in green.
Figure 3

C-Terminal Extension (CTE) of MlaF dimer adopts a unique conformation, forming a ‘handshake’ with the adjacent monomer.
(A) MlaF2B2 structure with one heterodimer shown in surface representation (MlaF, purple; MlaB, yellow) and the other represented as a cartoon (MlaF, red; MlaB, yellow). The CTE from one MlaF monomer (red) docks at the MlaFB interface of the other MlaF monomer. Inset shows three hydrophobic residues of the CTE that dock at the MlaF/MlaB interface. (B) Crystal structure of MlaF1B1 crystallographic (non-native) dimer in which CTE contacts are still maintained. Inset shows the three hydrophobic residues in the CTE, for which interactions to the MlaFB interface are maintained in the non-native arrangement. (C) Comparison of C-terminal regions from different ABC transporters, among which the MlaF CTE is unique (PDB IDs: 6MI8 [Li et al., 2019], 2QI9 [Hvorup et al., 2007], 1Q12 [Chen et al., 2003], 5XJY [Qian et al., 2017], 3DHW [Kadaba et al., 2008]).
Figure 4
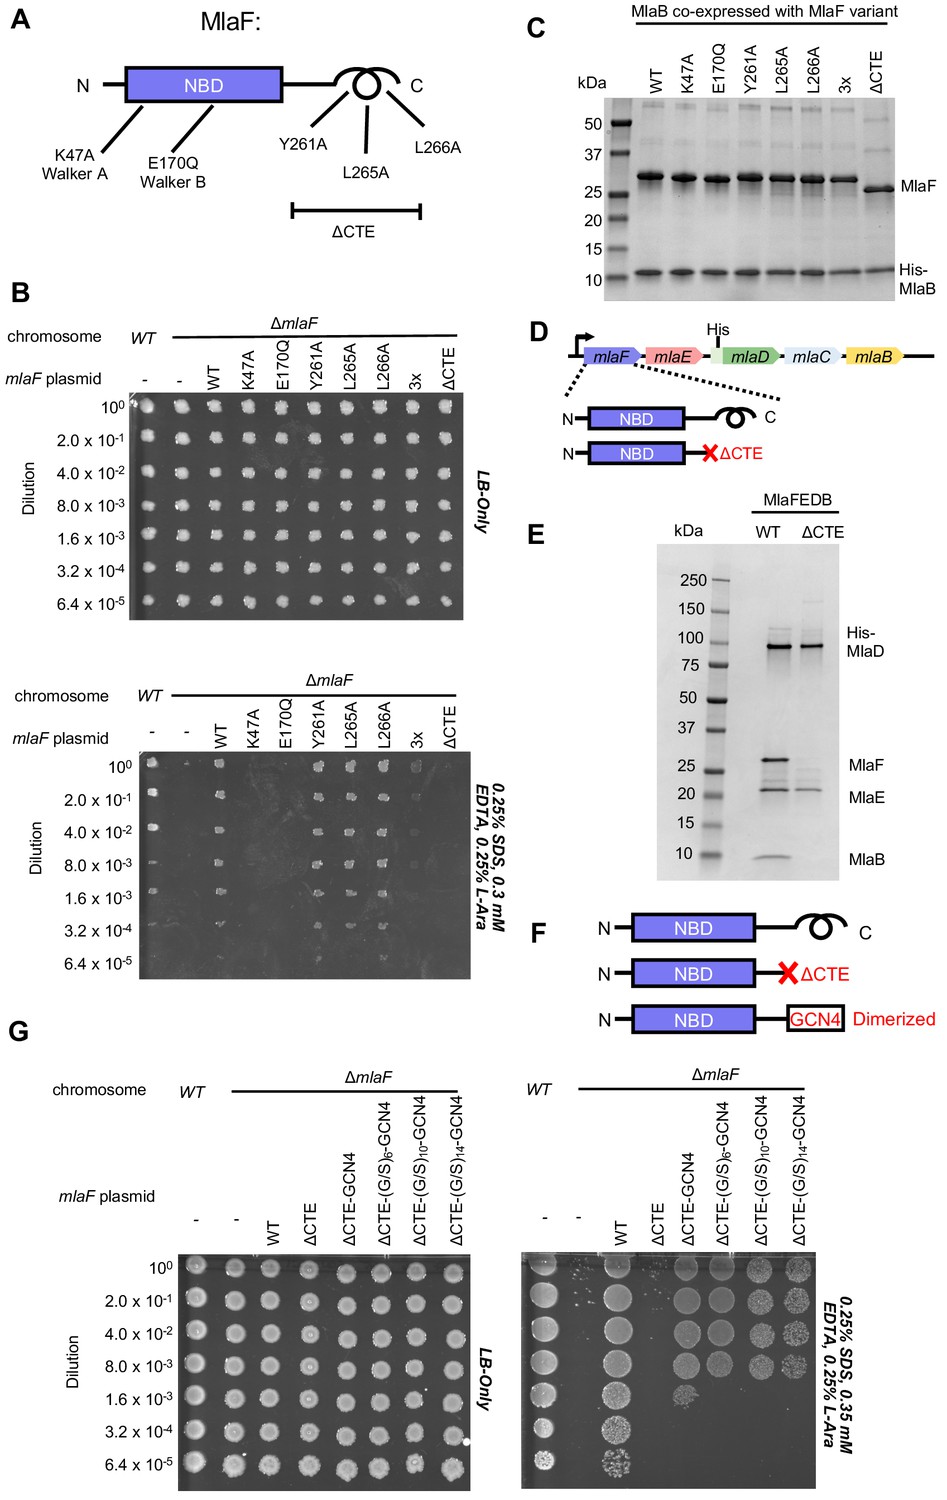
Cellular and biochemical assays probing the role of the MlaF CTE.
(A) Schematic of MlaF depicting wild-type and mutants generated. (B) Cellular assay for the function of MlaF. 10-fold serial dilutions of the indicated cultures spotted on LB only (top) or LB plates containing SDS and EDTA at the concentrations indicated (bottom), and incubated overnight. Expression of constructs containing the following mutations fail to rescue: K47A, E170Q, 3x (Y261A-L265A-L266A triple mutant), ΔCTE. Growth of all strains is unaffected on control plates containing LB only. Results depicted are representative of at least three biological replicates. (C) SDS-PAGE of pull-down experiments showing MlaB and MlaF. WT His-MlaB is the bait, co-expressed with WT or mutant MlaF constructs, as noted in the figure. Results depicted are representative of at least three biological replicates. (D) Schematic of MlaFEDCB operon, depicting WT MlaF and MlaF ΔCTE. (E) SDS-PAGE of protein purified from the constructs depicted in (D). Results depicted are representative of at least three biological replicates. (F) Schematic of MlaF constructs used in (G) GCN4 was used for artificial dimerization, and the GCN4 dimerization domain was connected to the rest of MlaF via a Ser/Gly linker of different lengths. (G) Cellular assay for the function of MlaF. 10-fold serial dilutions of the indicated cultures spotted on LB only (left) or LB plates containing SDS and EDTA at the concentrations indicated (right), and incubated overnight. MlaF ΔCTE mutant fails to grow on SDS-EDTA plates, and can be partially rescued by GCN4 dimerized MlaF constructs. Growth of all strains are unaffected on control plates containing LB only. Results depicted are representative of at least three biological replicates.
Figure 5 with 2 supplements
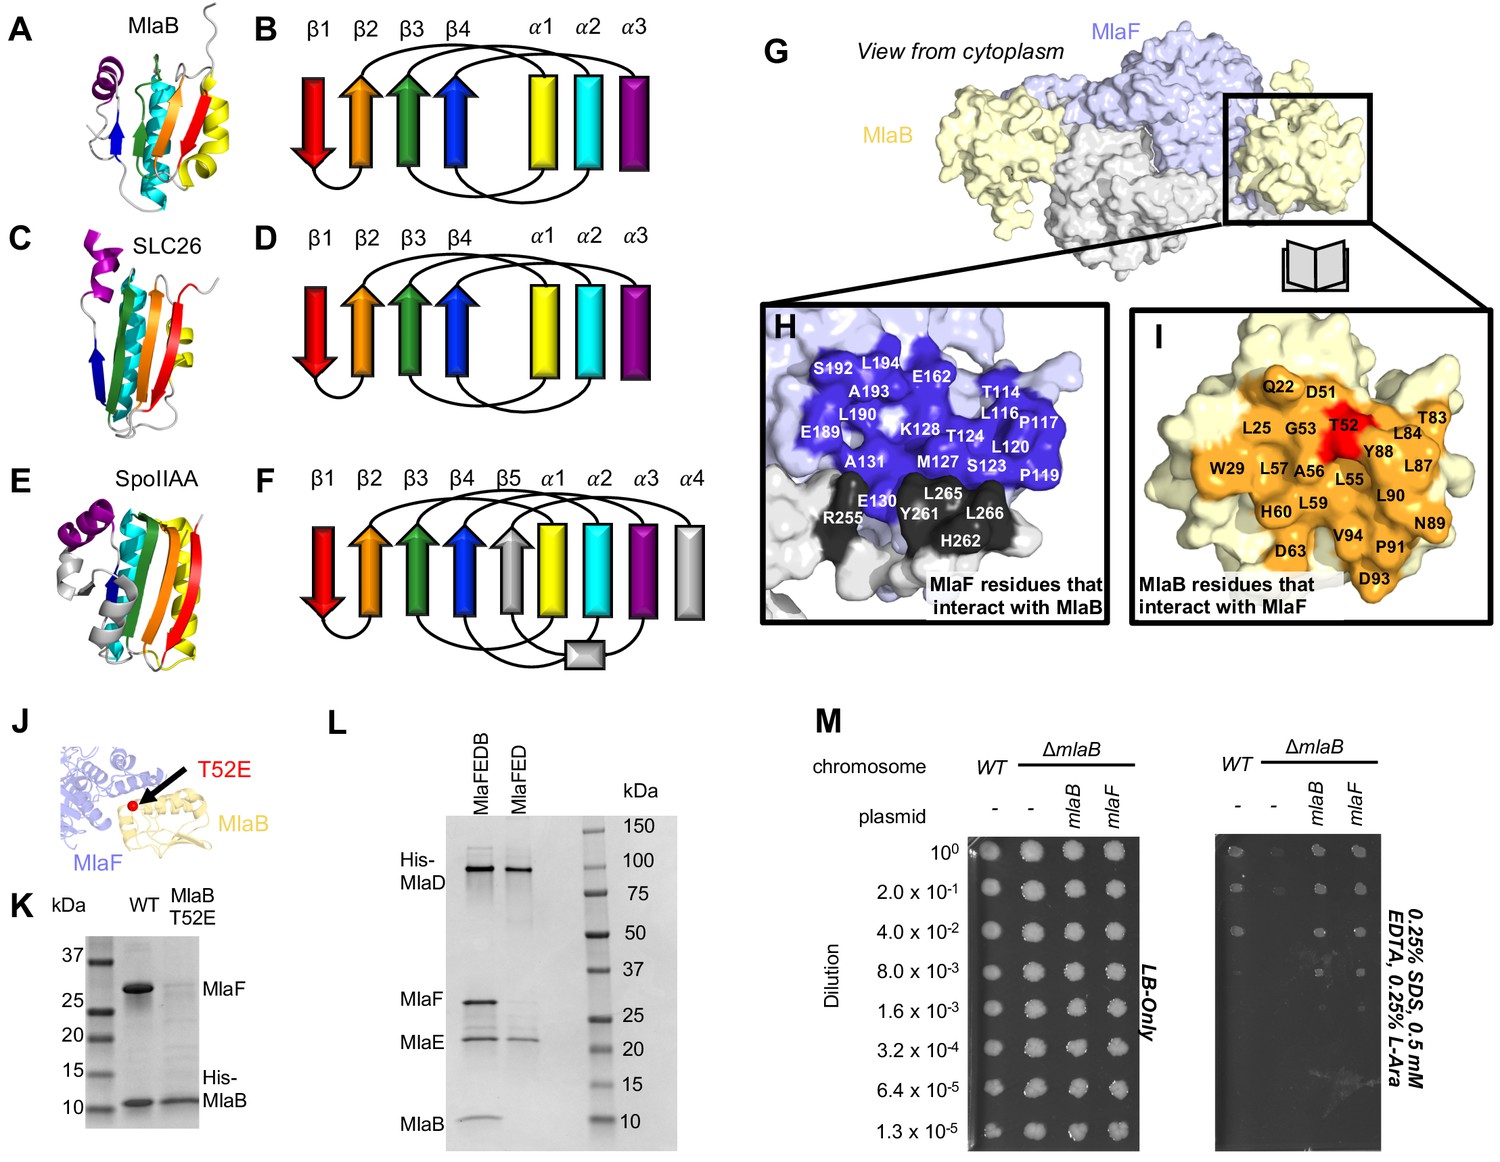
Role of MlaB in complex stability.
Cartoon representation of MlaB (A) and other STAS-domain proteins, SLC26 (C, PDB: 5DA0 [Geertsma et al., 2015]) and SpoIIAA (E, PDB: 1TH8 [Masuda et al., 2004]), and corresponding topology diagrams (B, D, F, respectively). (G) Surface representation of the MlaFB dimer. Insets: (H) MlaF surface; one monomer is shown in lilac and the other in light grey. Residues that interact with MlaB to form the interface are shown in dark purple and dark grey for each monomer, respectively (I) MlaB surface (pale yellow). Residues that interact with MlaF to form the interface are shown in orange. T52 is shown in red. (J) MlaFB is shown in cartoon representation. The position of the T52E mutant on MlaB is shown as a red sphere (K) SDS-PAGE of pull-down experiment showing MlaB and MlaF. WT or mutant T52E His-MlaB is the bait, co-expressed with a WT MlaF construct. Results depicted are representative of at least three biological replicates. (L) SDS-PAGE of purified protein resulting from MlaFEDCB or MlaFEDC expression constructs in which His-MlaD is used for purification. As expected, MlaC does not co-purify with either construct. MlaF and MlaB are both absent when MlaFEDC is used as the expression construct. Results depicted are representative of at least three biological replicates. (M) Cellular assay for the function of MlaB. 10-fold serial dilutions of the indicated cultures spotted on LB only (left) or LB plates containing SDS and EDTA at the concentrations indicated (right), and incubated overnight. MlaB knockout mutant fails to grow on SDS-EDTA plates, and can be rescued by overexpression of either WT MlaB or MlaF. Growth of all strains are unaffected on control plates containing LB only. Results depicted are representative of at least three biological replicates.
Figure 5—figure supplement 1
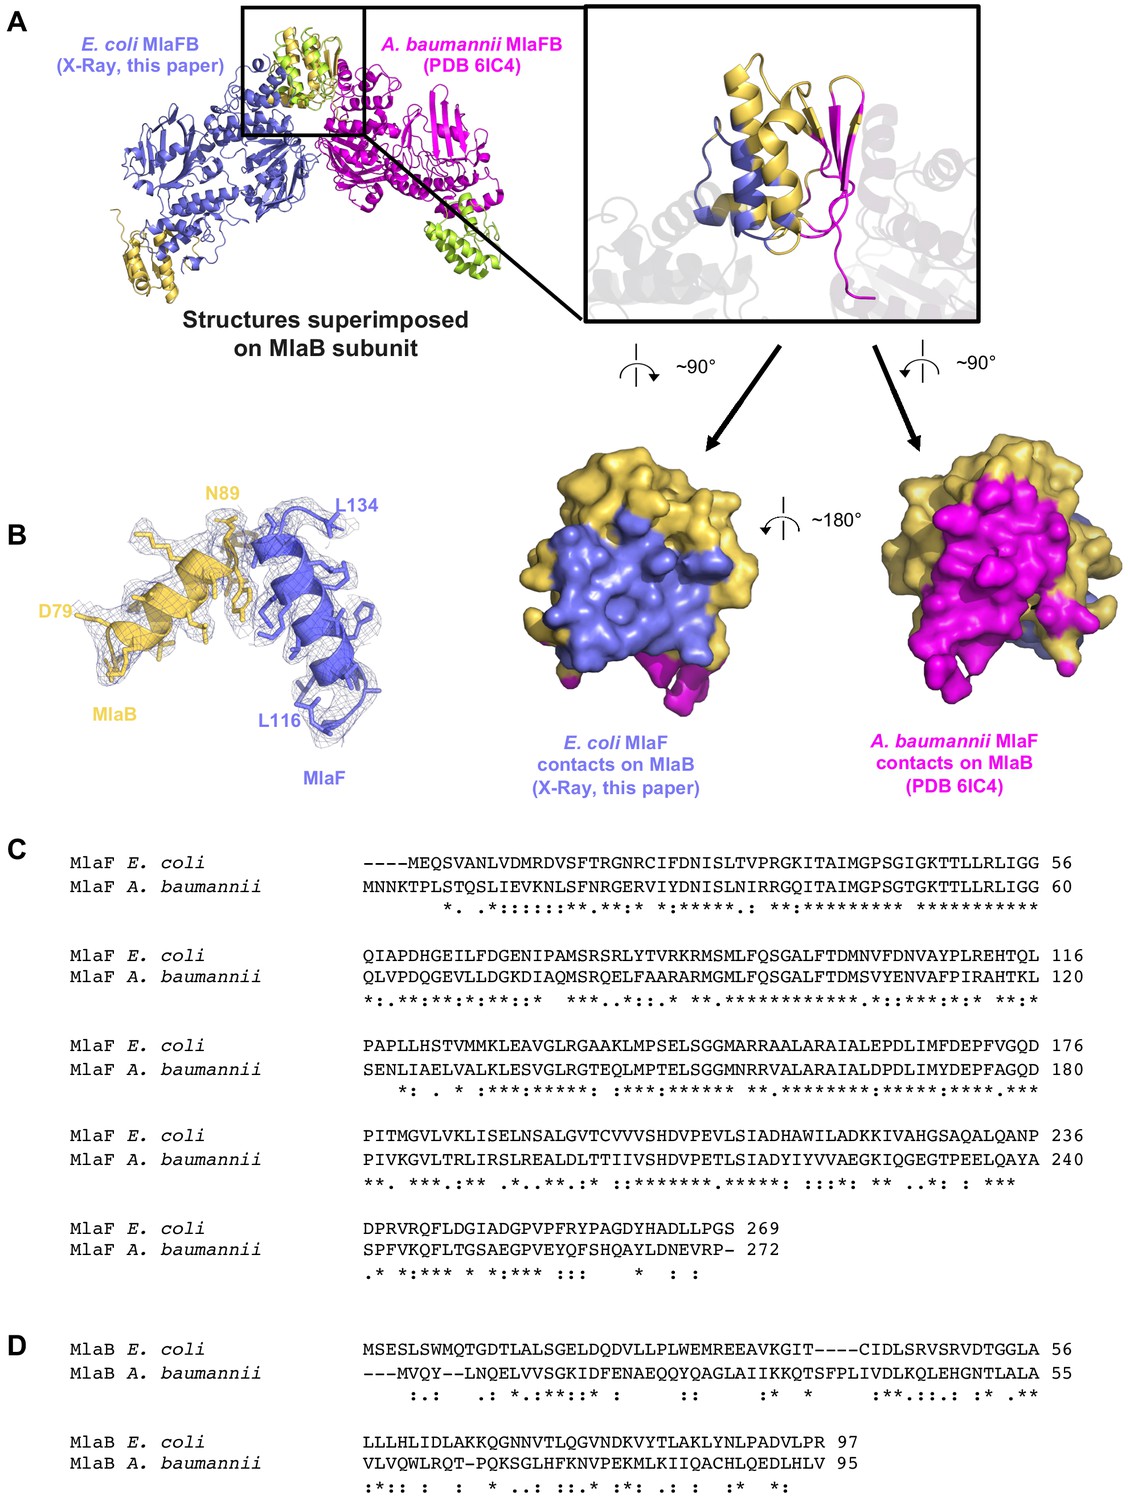
Comparison of our E. coli MlaFB crystal structure (2.60 Å resolution) and coordinates deposited for A. baumannii MlaFB from a cryo EM reconstruction (8.7 Å resolution).
(A) E. coli X-ray structure and A. baumannii (PDB 6IC4) EM model aligned on MlaB. Inset shows interfaces mapped on both structures. (B) Electron density from our crystal structure, corresponding to helices and side chains at the interface between MlaF and MlaB. Sequence alignment of MlaF (C) and MlaB (D) from the two species.
Figure 5—figure supplement 2
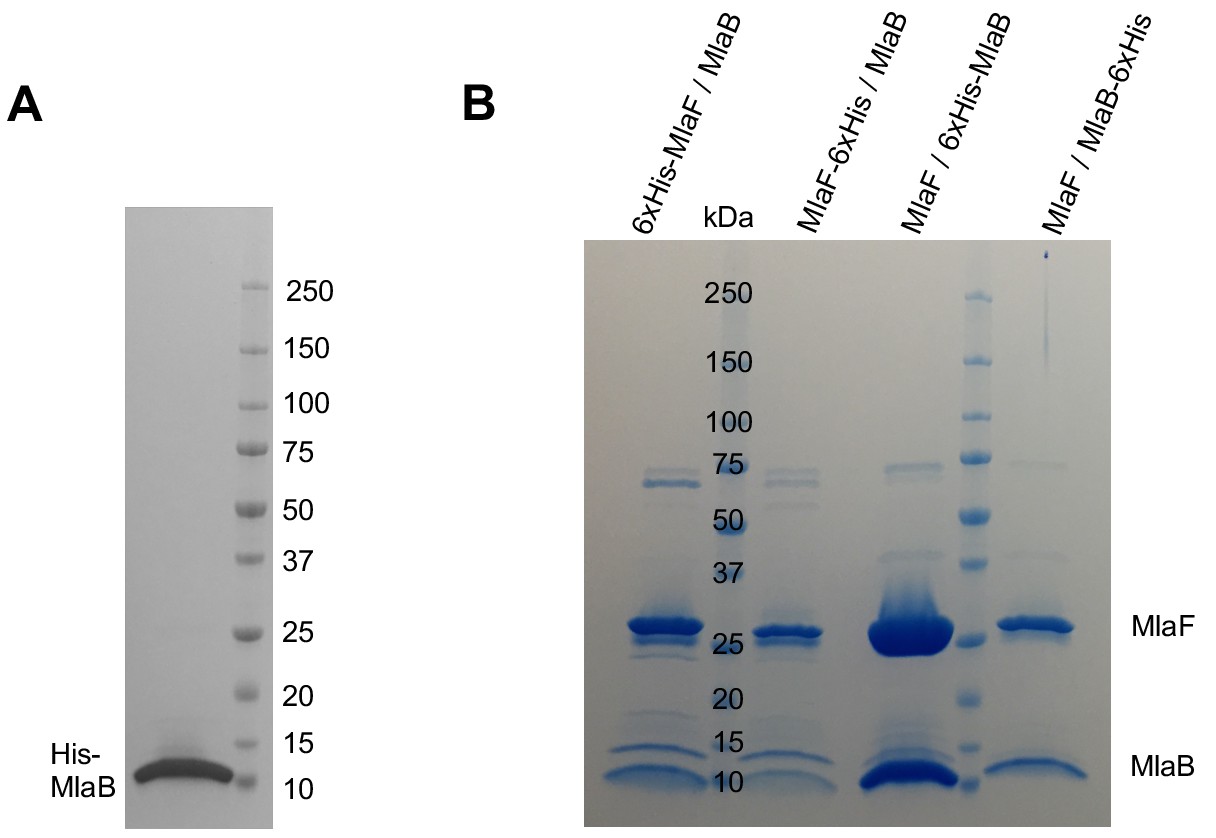
Co-expression of MlaB and MlaF tagged at different positions.
(A) SDS-PAGE of purified His-MlaB alone. (B) SDS-PAGE of purified MlaFB complex in which His-tags were placed at different positions as indicated in the figure.
Figure 6

Model for the role of MlaFB in the MlaFEDB complex.
(A) The handshake of the MlaF CTE C-Terminal Extension (CTE) of MlaF stabilizes the MlaF dimer and its association with the MlaFEDB complex. (B) The presence of MlaB, and the MlaFB interaction, is required for MlaF association with the MlaFEDB complex. In the absence of MlaB, MlaF does not associate stably with MlaE, and therefore the MlaFEDB complex would be inactive without its ATPase subunit bound.
Additional files
-
Supplementary file 1
Bacterial strains table.
- https://cdn.elifesciences.org/articles/60030/elife-60030-supp1-v2.docx
-
Supplementary file 2
Plasmids table.
- https://cdn.elifesciences.org/articles/60030/elife-60030-supp2-v2.docx
-
Supplementary file 3
Data collection and refinement statistics for crystal structures.
- https://cdn.elifesciences.org/articles/60030/elife-60030-supp3-v2.docx
-
Transparent reporting form
- https://cdn.elifesciences.org/articles/60030/elife-60030-transrepform-v2.docx
Download links
A two-part list of links to download the article, or parts of the article, in various formats.
Downloads (link to download the article as PDF)
Open citations (links to open the citations from this article in various online reference manager services)
Cite this article (links to download the citations from this article in formats compatible with various reference manager tools)
Structure of MlaFB uncovers novel mechanisms of ABC transporter regulation
eLife 9:e60030.
https://doi.org/10.7554/eLife.60030


