The SSVEP tracks attention, not consciousness, during perceptual filling-in
- School of Psychological Sciences, Faculty of Medicine, Nursing and Health Science, Monash University, Australia
- Department of Experimental Psychology, Faculty of Medicine, University of Oxford, United Kingdom
- Melbourne School of Psychological Sciences, University of Melbourne, Australia
- Discipline of Psychology, Faculty of Health, University of Canberra, Australia
- Turner Institute for Brain and Mental Health, Faculty of Medicine, Nursing and Health Science, Monash University, Australia
- Center for Information and Neural Networks (CiNet), National Institute of Information and Communications Technology (NICT), Japan
- Advanced Telecommunications Research Computational Neuroscience Laboratories, 2-2-2 Hikaridai, Seika-cho, Soraku-gun, Japan
Figures
Figure 1 with 2 supplements
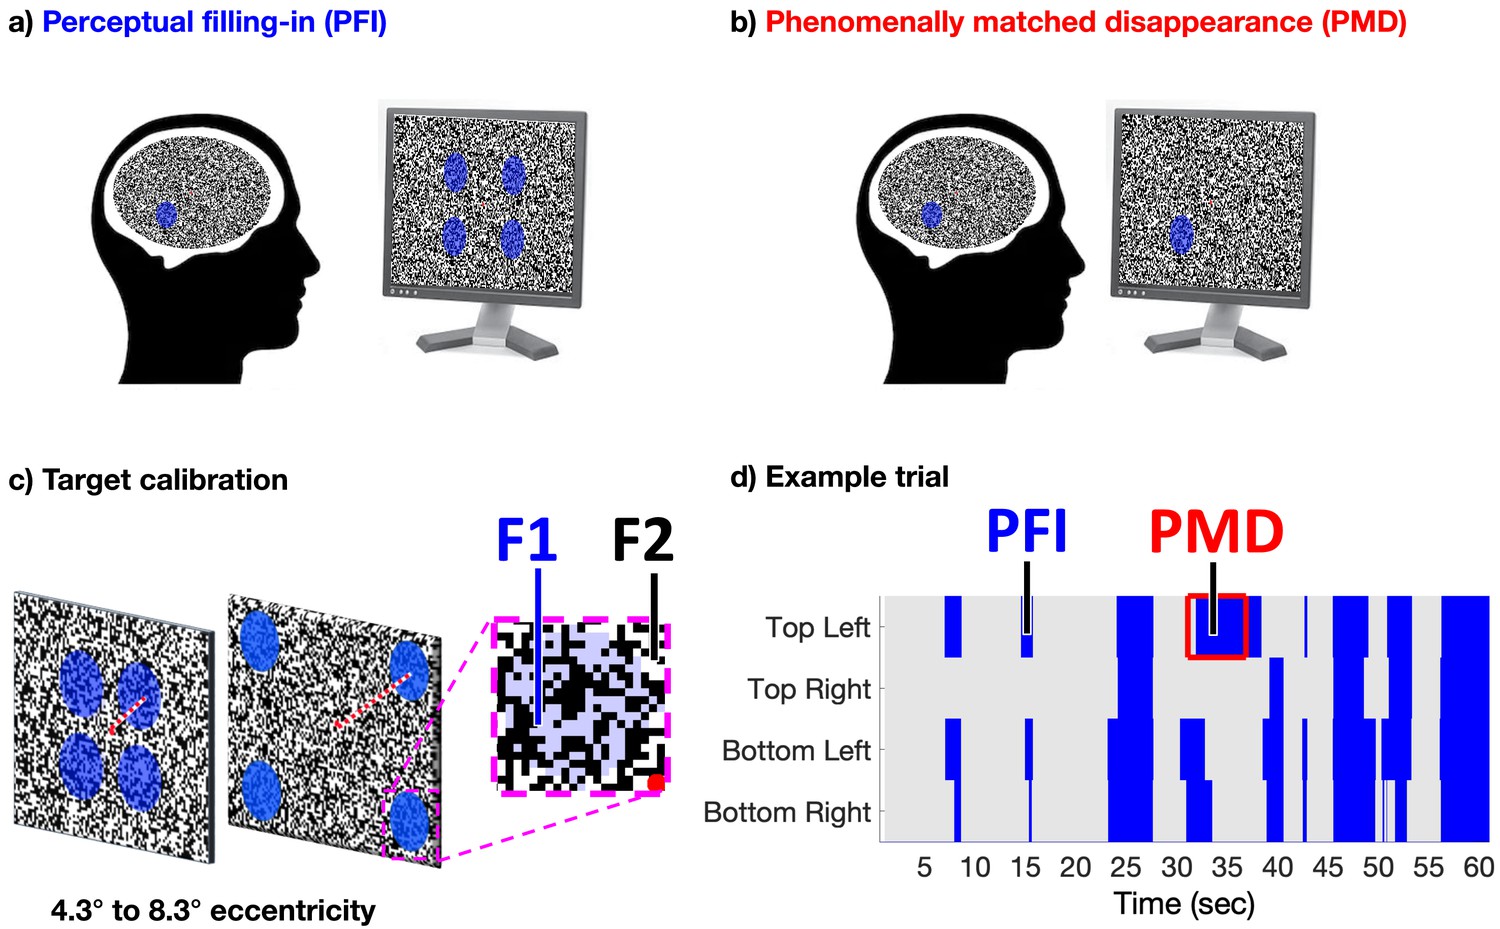
Task design.
(a) Four peripheral targets, defined by their blue-color, circular shape, and temporal flicker, were superimposed over a dynamic texture to induce perceptual filling-in (PFI). (b) Phenomenally matched disappearances (PMD) were embedded within each trial to mimic the subjective quality of PFI, during which one to four targets were physically removed from the screen. (c) The eccentricity of targets was calibrated per participant, using a custom brain-computer-interface, real-time SSVEP display (see Materials and methods). This procedure aimed to find optimal conditions to induce PFI, and large target (f1) and surround (f2) frequency-tagged responses. (d) Each of 48 trials lasted 60 s, during which participants reported on the visibility of all four peripheral targets continuously, using four unique buttons. Blue shading represents button presses in an example trial, during reported target invisibility.
-
Figure 1—source data 1
Example trial.
- https://cdn.elifesciences.org/articles/60031/elife-60031-fig1-data1-v4.mat
Figure 1—figure supplement 1
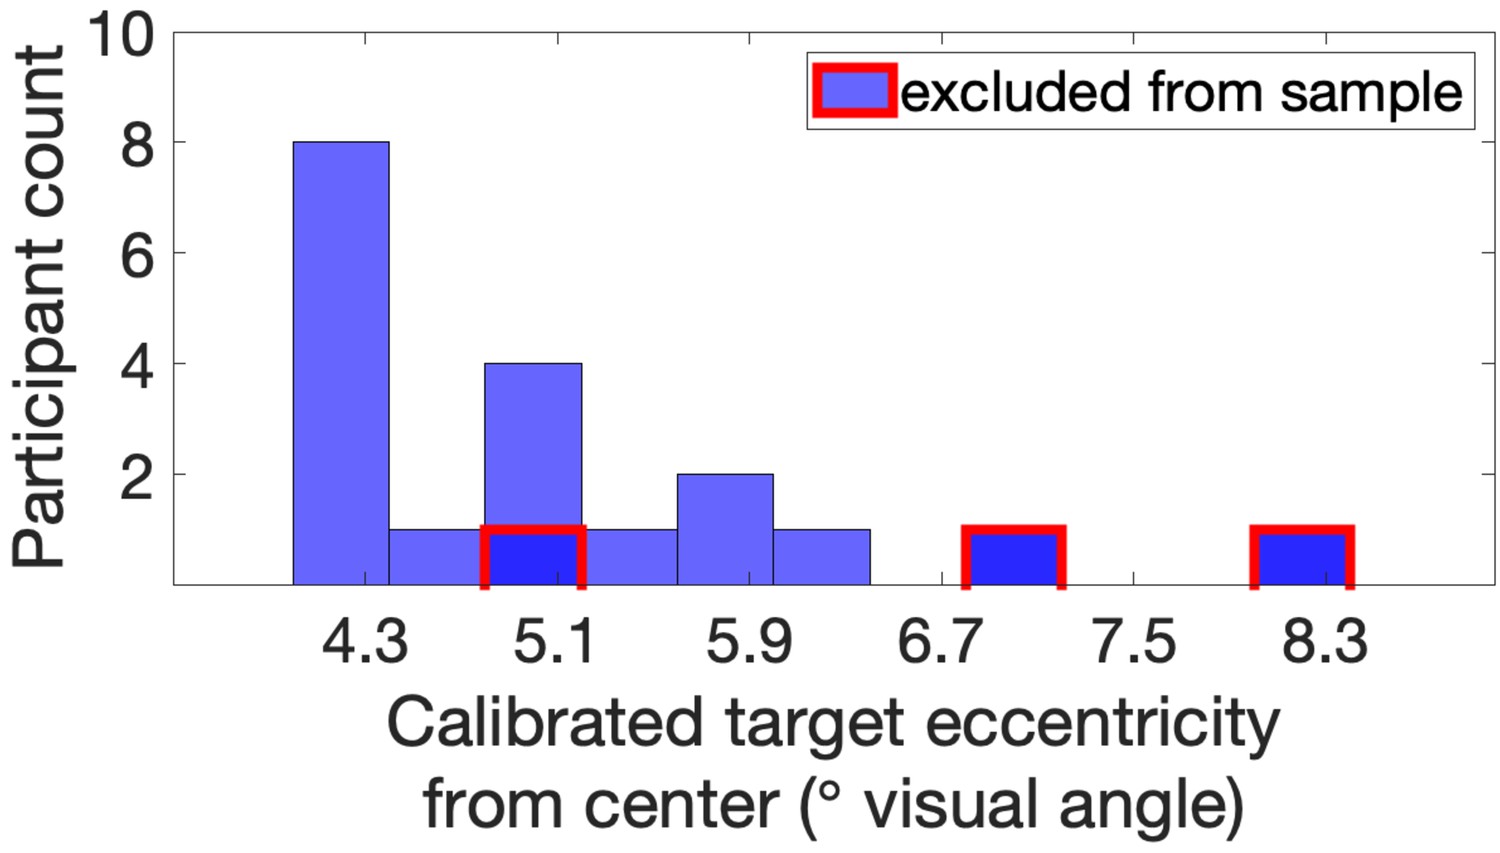
Calibrated target eccentricity and excluded subjects.
Across all participants (N = 19), the final target eccentricity used throughout each experiment is shown. Identified in red outline are the three participants excluded for failing to identify PMD periods (detailed in Materials and methods).
-
Figure 1—figure supplement 1—source data 1
Target eccentricity per participant.
- https://cdn.elifesciences.org/articles/60031/elife-60031-fig1-figsupp1-data1-v4.mat
Figure 1—figure supplement 2
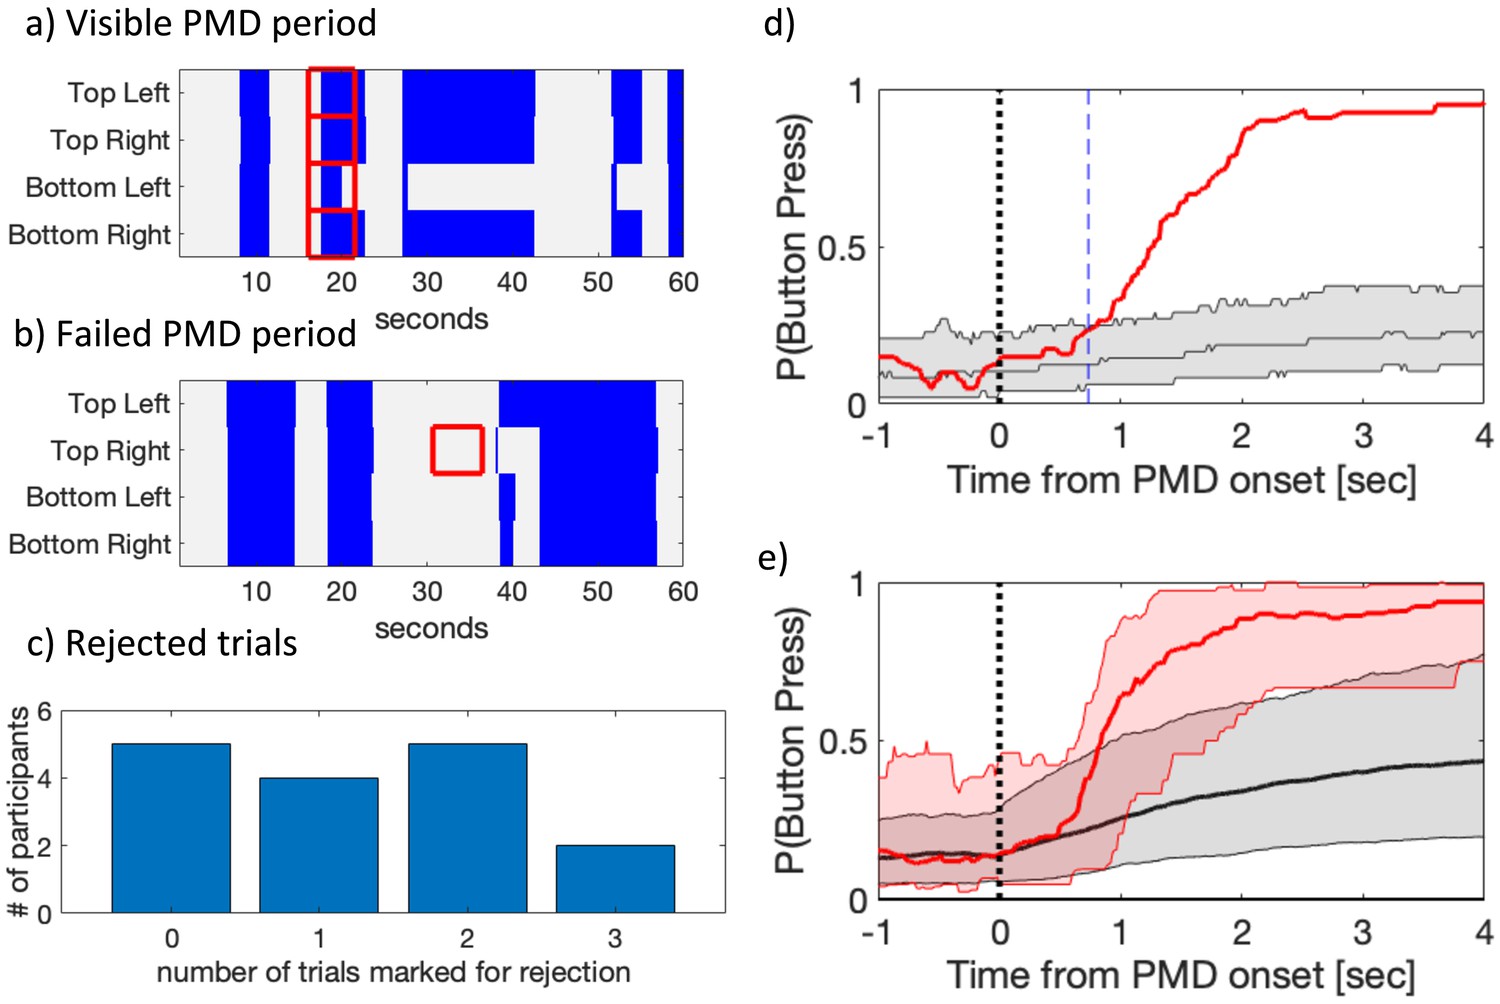
Behavioral responses during phenomenally matched disappearance (PMD).
(a-b) Example button-press responses during a 1 min trial, blue area indicates button press periods (target disappearance) at each target location. PMD periods (indicated by red squares) were correctly detected in (a) but not in (b). (c) A histogram count for the number of trials rejected across participants, when PMD onsets were not correctly detected. (d) The time course of the button press likelihood around PMD-onset, and its associated null distribution for a single participant. The red line is the median time course for all PMD-onset across 48 trials. The black line and shading indicates the median and the 95% CI for the distribution across 1000 bootstraps, respectively (see Materials and methods). We define the first time point that the observed button press time course (red) exceeded the bootstrapped CI (gray) as the reaction time to report PMD (0.73 s for this participant, marked with a vertical blue dashed line). (e) The population time course of the button press around PMD-onset and its associated null distribution. The red line is the median, across the median time courses from each of our N = 16 retained participants. The thick black line and shading is also the median of the median, and the 5% and 95% CI estimate obtained after bootstrap within each participant (computed with logit transform and presented after reverse transform).
-
Figure 1—figure supplement 2—source data 1
PMD data per participant.
- https://cdn.elifesciences.org/articles/60031/elife-60031-fig1-figsupp2-data1-v4.mat
Figure 2 with 3 supplements
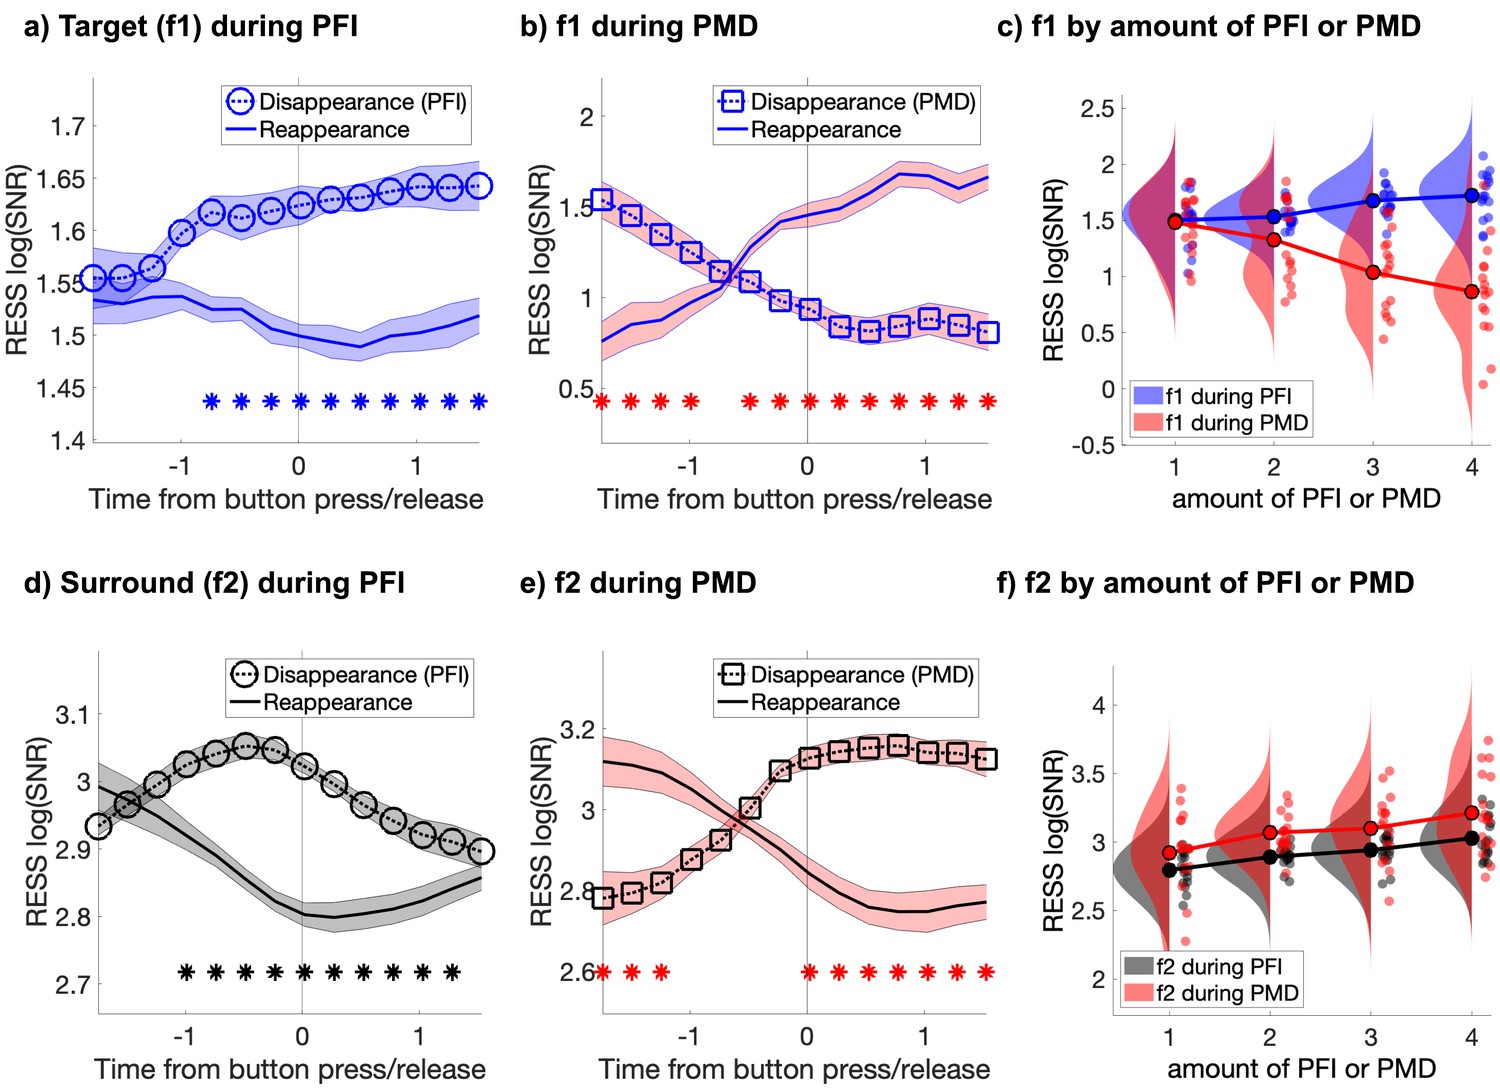
Target and surround-specific neural responses during PFI and PMD.
(a) During PFI target-SNR negatively correlates with target visibility (i.e. increases at disappearance and decreases at reappearance). (b) During phenomenally matched disappearance (PMD), when targets were physically removed, target-SNR positively correlates with target visibility. (c) Target-SNR during PFI and PMD are in opposition, showing positive and negative correlations with trial-by-trial fluctuations in the amount of invisible targets (defined as the duration-weighted number of visible targets; see Materials and methods). (d and e) Surround-SNR increases during PFI (d), and PMD (e), matching phenomenology as targets become interpolated by their surroundings. (f) Trial-by-trial fluctuations in the amount of PFI and PMD positively correlate with surround-SNR. Shading in a, b, d, e corresponds to 1 SEM corrected for within-subject comparisons (Cousineau, 2005). Asterisks mark significant differences between the disappearance and reappearance SNR time-courses (pcluster <0.001).
-
Figure 2—source data 1
SNR during PFI and PMD.
- https://cdn.elifesciences.org/articles/60031/elife-60031-fig2-data1-v4.mat
Figure 2—figure supplement 1
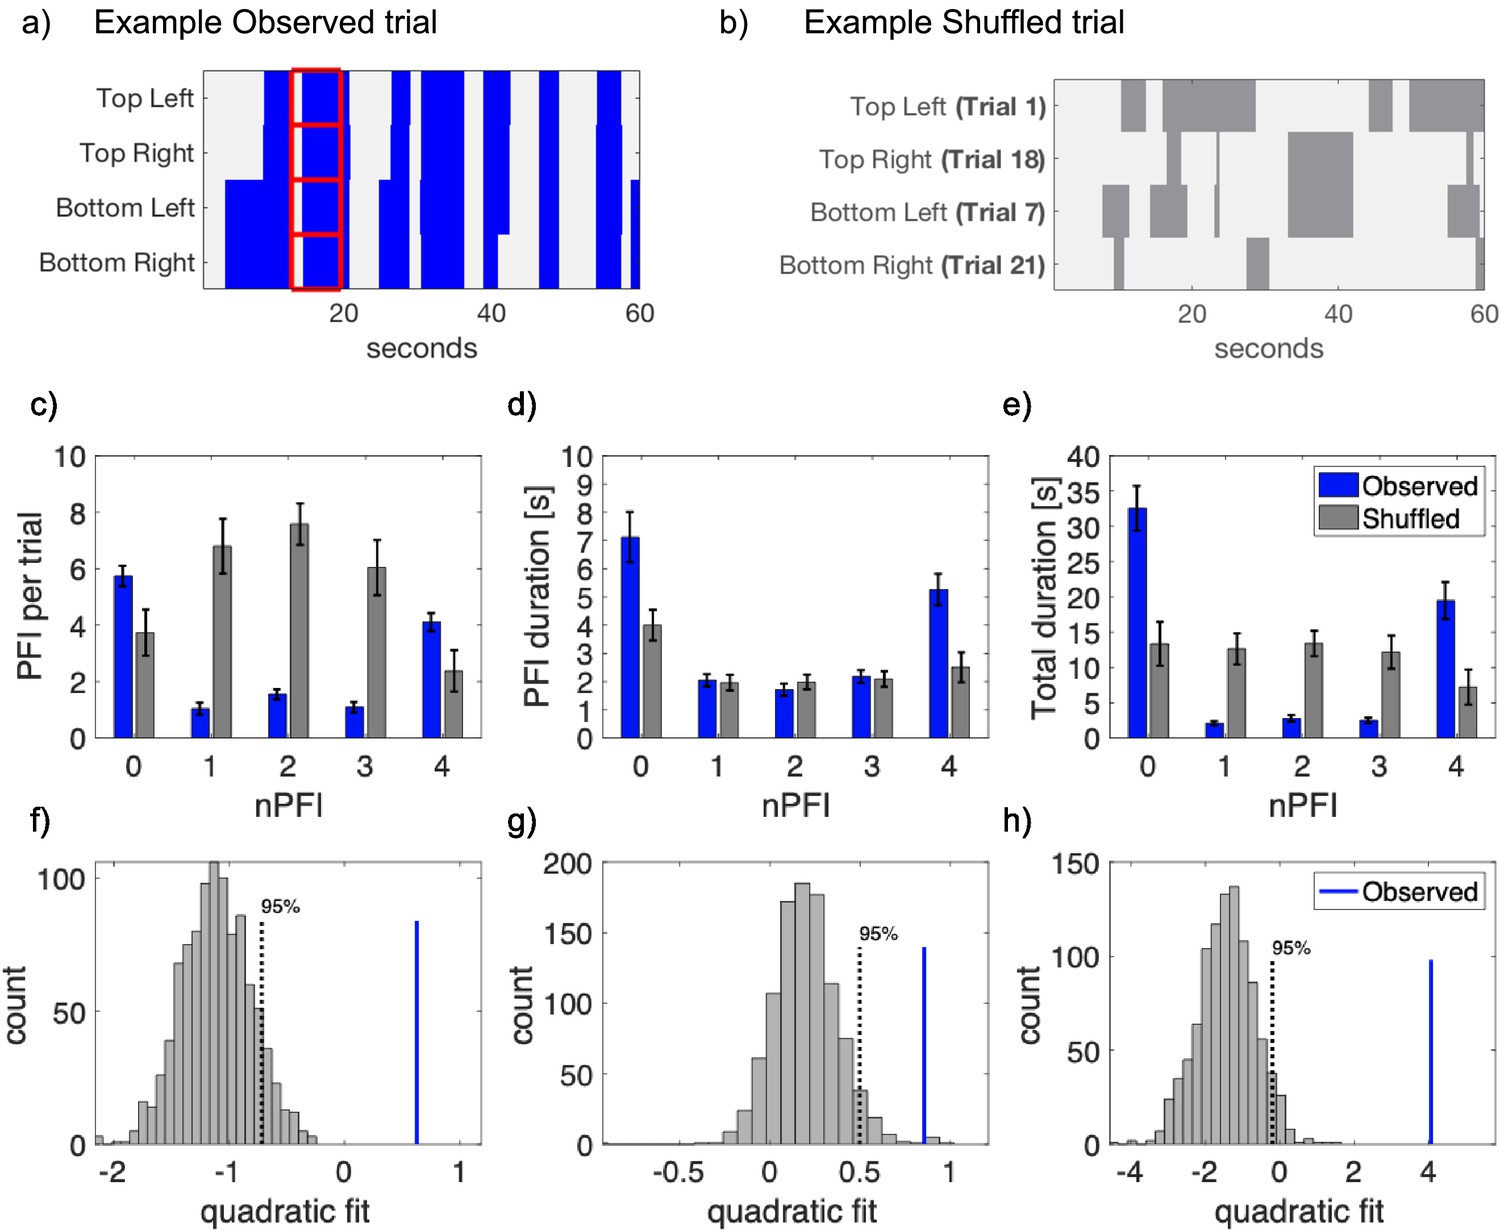
Behavioral data comparing PFI characteristics based on the number of targets perceptually filled-in (nPFI).
(a) Example PFI data from one participant, displaying synergistic PFI across multiple locations. (b) Example of shuffled data to test whether synergistic PFI occurs by chance. (c) Instances of PFI per trial, (d) mean duration per PFI, and (e) total duration of PFI as a function of nPFI. All panels display both observed (blue) and shuffled (gray) data. For the observed data, error bars represent 1 SEM, corrected for within-participant comparisons (Cousineau, 2005). For the shuffled data, we first computed the SEM for each of the 1000 shuffled data sets. Then, as the error bar, we display the mean of these 1000 SEMs. (f-h) 2nd order polynomial coefficients, for a quadratic fit for each of the PFI variables in c-e as a function of nPFI for observed (blue line) versus shuffled data (1000 sets, gray histogram).
-
Figure 2—figure supplement 1—source data 1
Observed and shuffled data per participant.
- https://cdn.elifesciences.org/articles/60031/elife-60031-fig2-figsupp1-data1-v4.mat
Figure 2—figure supplement 2

Whole trial SSVEP results.
(a) The topographic distribution of SNR across participants is shown at target (f1: 15 Hz), surround (f2: 20 Hz), intermodulation (f2-f1: 5 Hz), and higher harmonic (2f1: 30 Hz, 2f2: 40 Hz) frequencies. (b) Average SSVEP responses and (c) log(SNR) for all experimental periods in our paradigm (60 s whole-trials at channel POz). Target flicker and harmonics are shown in blue, surround flicker and harmonics are shown in black, with intermodulation components shown in magenta (2f2-f1: 25 Hz and f1+f2:35 Hz are not significant, thus not shown in panel a). In (b and c), asterisks mark log(SNR) significantly different from 0 in spectrum at POz, FDR-adjusted across all frequencies to p<0.05.
-
Figure 2—figure supplement 2—source data 1
Whole trial power and SNR per participant.
- https://cdn.elifesciences.org/articles/60031/elife-60031-fig2-figsupp2-data1-v4.mat
Figure 2—figure supplement 3

Preprocessing for event-by-event based image analyses.
PFI events were first sorted according to the duration-weighted number of buttons pressed over 3 s, occurring after button press or before button release. Each image along the y-axis was then resampled to normalize the number of trials from 1 to 100 samples. The same process was also applied to RESS log(SNR) after sorting by the duration-weighted button press per trial based on button press (or release). This image-based analysis enables us to compare PFI dynamics despite differences in the frequency and duration of PFI events per participant.
-
Figure 2—figure supplement 3—source data 1
Example PFI events.
- https://cdn.elifesciences.org/articles/60031/elife-60031-fig2-figsupp3-data1-v4.mat
Figure 3
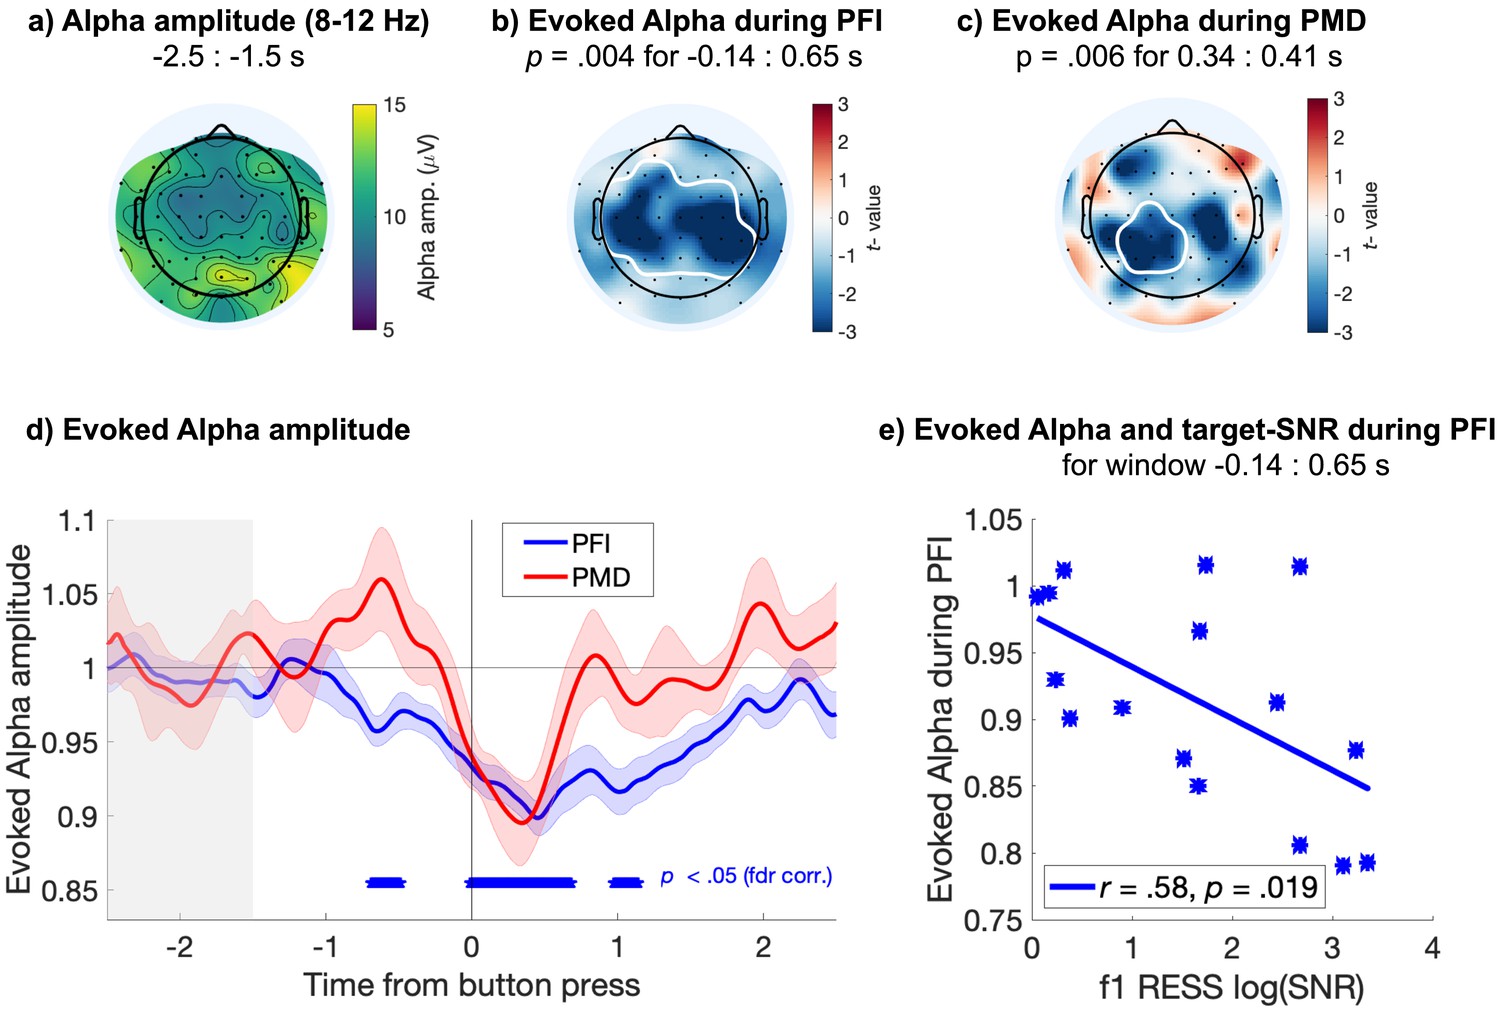
Evoked responses in the alpha band.
Centro-parietal alpha amplitude decreases during PFI. (a) Spatial topography of alpha band (8–12 Hz) amplitude during baseline (−2.5 to −1.5 s before button press). (b) PFI- and (c) PMD- evoked reductions in alpha amplitude, with significant clusters outlined in white (electrode-time cluster corrected). (d) Time course of evoked alpha during PFI (blue) and PMD (red), averaged over the significant electrodes marked in b and c, respectively. Shading shows 1 SEM, corrected for within-participant comparisons (Cousineau, 2005). Blue asterisks mark the significant time-windows for the evoked alpha during PFI, averaged over significant electrodes in b (p threshold = 0.011 at FDR q = 0.05). The effect during PMD did not survive FDR corrections for multiple comparisons. (e) Each participant’s alpha amplitude averaged over the significant time-window shown in b (−0.14 to 0.65 s), plotted against the target SNR at f1 during the same time-window.
-
Figure 3—source data 1
Alpha during PFI and PMD.
- https://cdn.elifesciences.org/articles/60031/elife-60031-fig3-data1-v4.mat
Figure 4 with 1 supplement
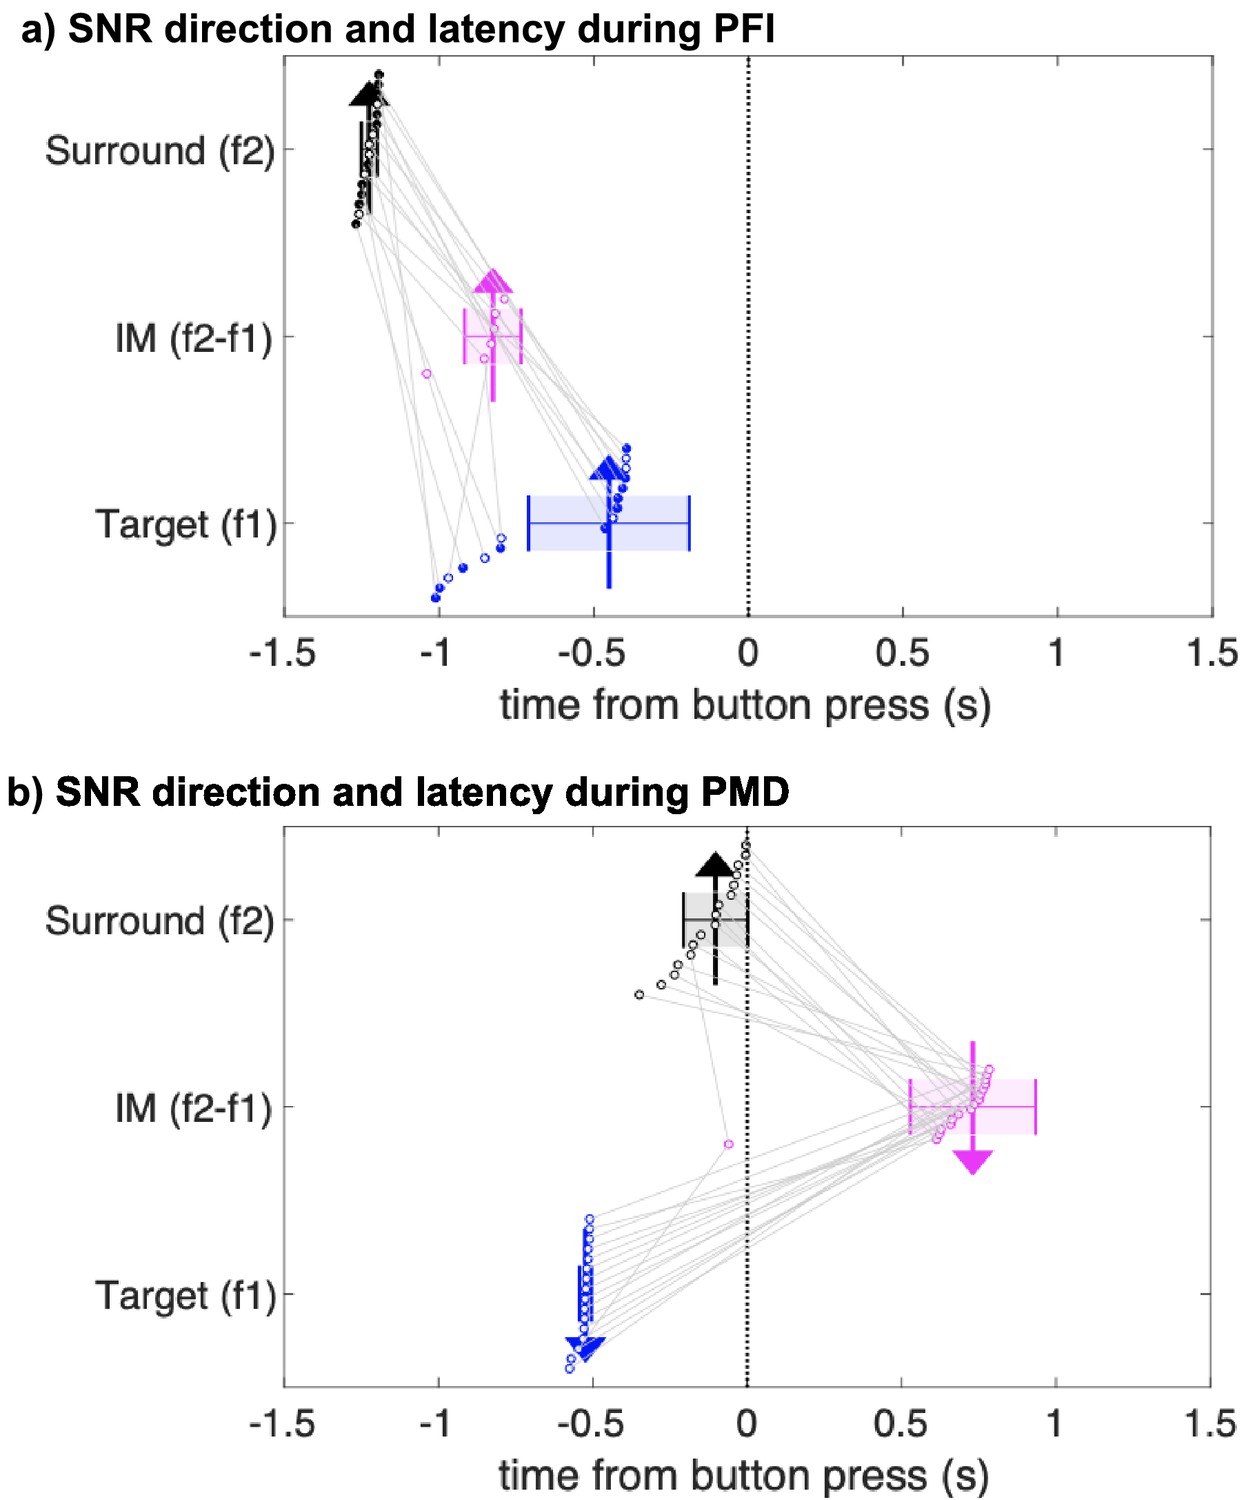
Jackknifed latency estimates of SNR timing differences during PFI and PMD.
First significant time-points (see Materials and methods) in surround-specific SNR (f2; black), target-specific SNR (f1; blue), and the intermodulation component (IM; pink). Each dot and gray lines link the first significant time-points of each instance of 16 jackknife analyses. The x-position of the arrows indicates the median of these time-points. The direction of the arrows indicates the direction of SNR changes when comparing disappearance to reappearance events. Upward arrows indicate SNR increased during target disappearance; downward arrows indicate SNR was greater during reappearance. Colored shading and whiskers indicate the standard deviation of jackknifed estimates. Note that the IM time-course did not reach significance and is not defined for some subsamples during PFI as indicated by filled black and blue dots for the surround and target.
-
Figure 4—source data 1
PFI and PMD change latencies.
- https://cdn.elifesciences.org/articles/60031/elife-60031-fig4-data1-v4.mat
Figure 4—figure supplement 1

Time course of SNR of the IM (f2-f1: 5-Hz)during PFI and PMD.
During PFI, IM-SNR transiently increased prior to disappearance. During PMD periods, IM-SNR increased after target reappearance.
-
Figure 4—figure supplement 1—source data 1
IM SNR during PFI and PMD.
- https://cdn.elifesciences.org/articles/60031/elife-60031-fig4-figsupp1-data1-v4.mat
Additional files
Download links
A two-part list of links to download the article, or parts of the article, in various formats.
Downloads (link to download the article as PDF)
Open citations (links to open the citations from this article in various online reference manager services)
Cite this article (links to download the citations from this article in formats compatible with various reference manager tools)
The SSVEP tracks attention, not consciousness, during perceptual filling-in
eLife 9:e60031.
https://doi.org/10.7554/eLife.60031


