Lef1 expression in fibroblasts maintains developmental potential in adult skin to regenerate wounds
- School of Molecular Biosciences, Washington State University, United States
- Center for Reproductive Biology, Washington State University, United States
Figures
Figure 1 with 2 supplements
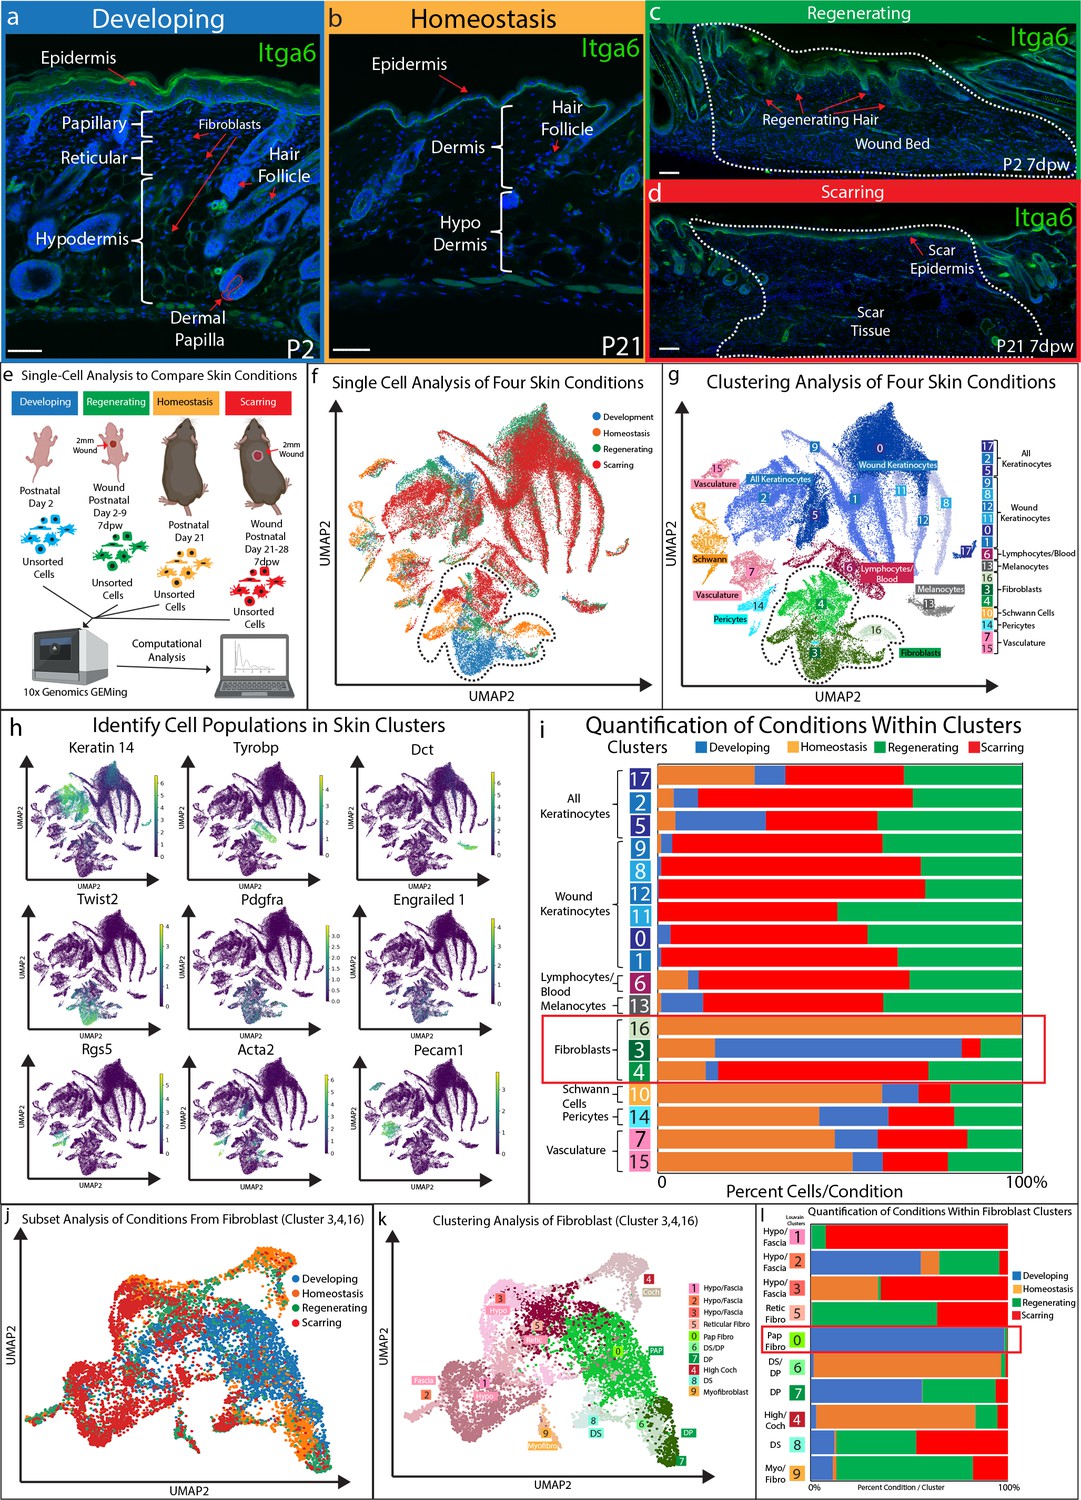
Fibroblasts in developing skin are distinct from regenerating, scarring, and homeostatic conditions.
(a–d) Immunostaining analysis and histological map of the dermis in developing Post-natal day 2 (P2) skin (a), homeostatic skin at P21 (b), skin undergoing regeneration P2 7 days post wound (7dwp) (c), and skin repairing a wound via scarring P21 7dpw (d). (e) Schematic representation of single-cell isolation, library preparation, and sequencing analysis for unsorted cells from developing (P2), regenerating (P2 7dpw), homeostatic (P21), and scarring (P21 7dpw) conditions. (f) UMAP visualization of all cell populations for all conditions. Each cell is color coded based according to condition as labeled. (g) Clustering analysis of the UMAP plot, color coded based on cell types. (h) Overlaying gene expression on UMAP clusters to identify cell types. (i) Quantification of the percentage of all cells represented within a cluster. (j) Subset and re-clustering of Clusters 3, 4, and 16 by computational integration. (k) Cluster analysis of integrated fibroblast clusters 3, 4, and 16. (l) Quantitation of fibroblasts within each cluster represented by condition. n = 3 biological replicates for each condition. Each biological replicate was used to generate a single library. Scale bars are 100 μm.
Figure 1—figure supplement 1

Classifying fibroblast clusters and conditions in development, regeneration, scarring, and homeostasis.
(a) Over-laying gene expression for cell markers on UMAP plots. (b) Dotplot of genes based on expression in cluster.
Figure 1—figure supplement 2
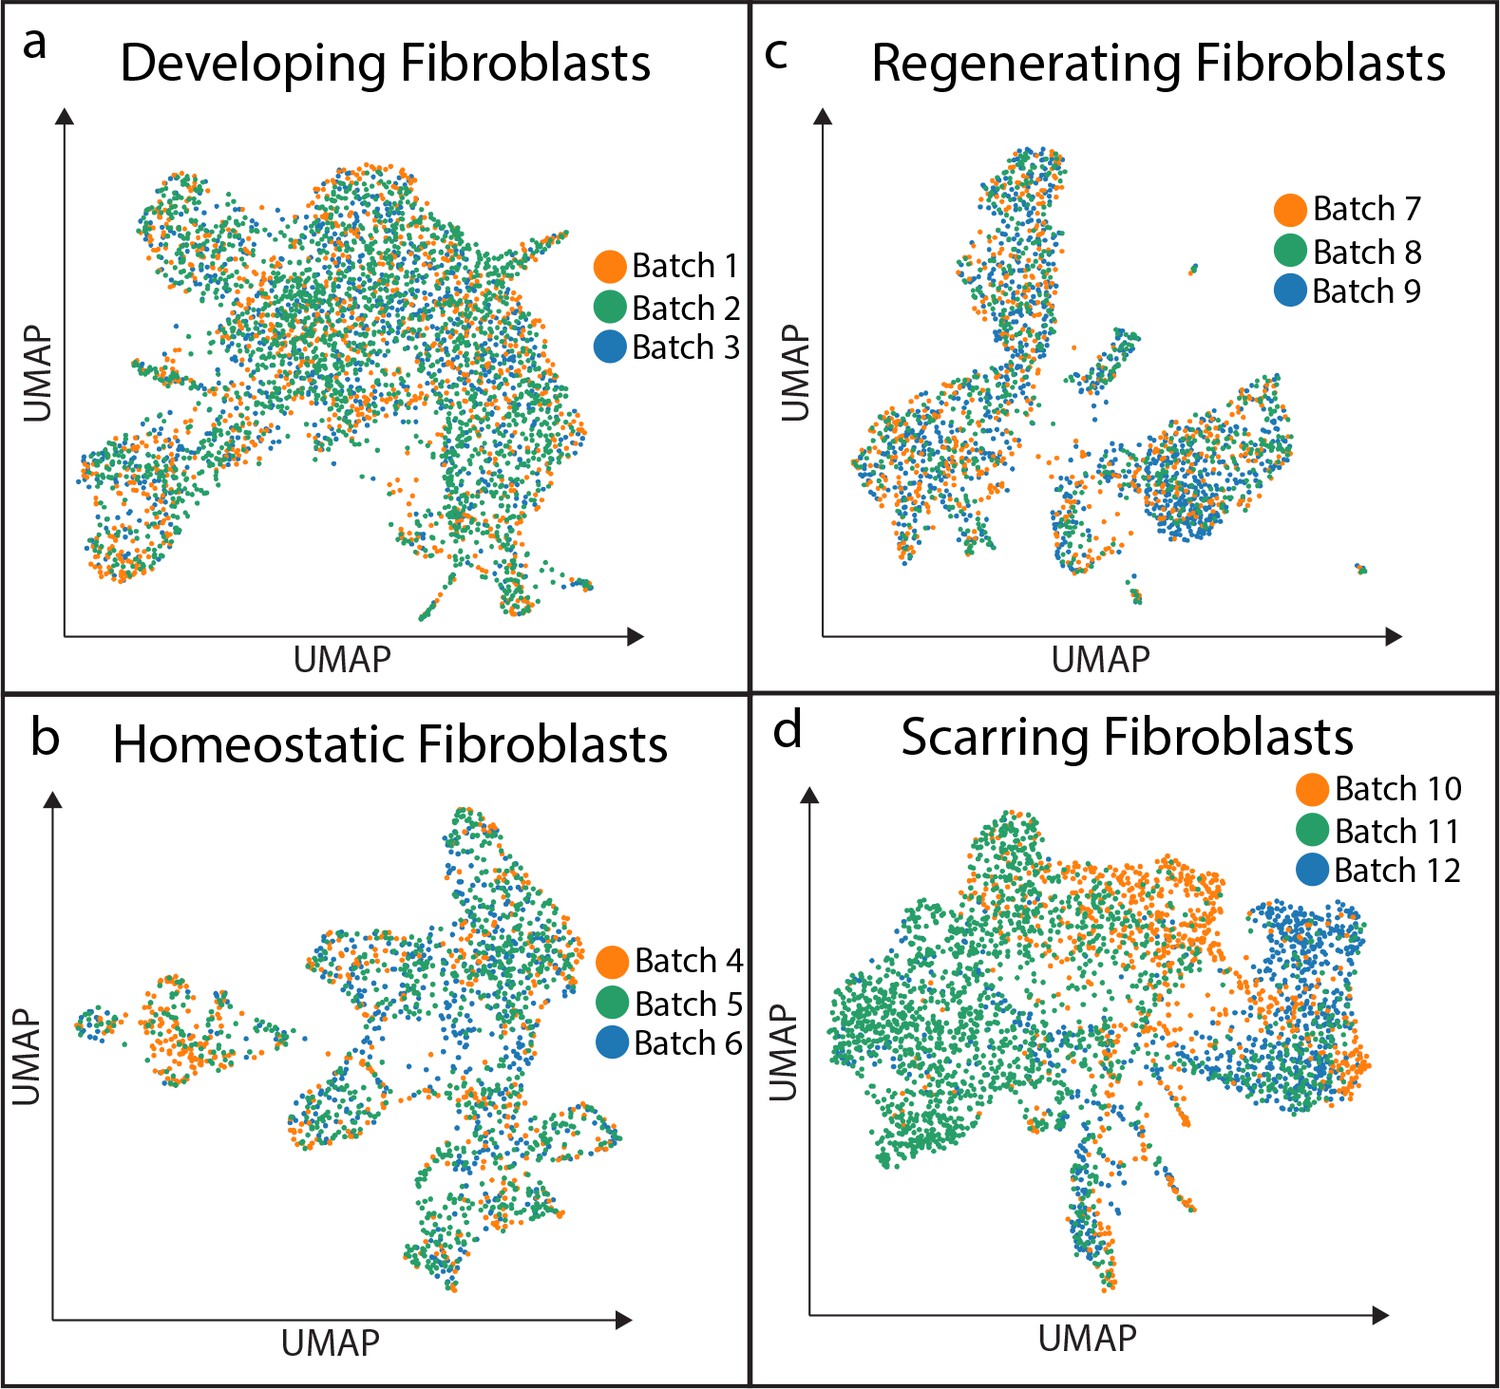
Batch analysis of biological replicates for developing, homeostatic, regenerating, and scarring conditions.
(a–d) Batch analysis of all conditions revealed minimal batch effect.
Figure 2 with 2 supplements
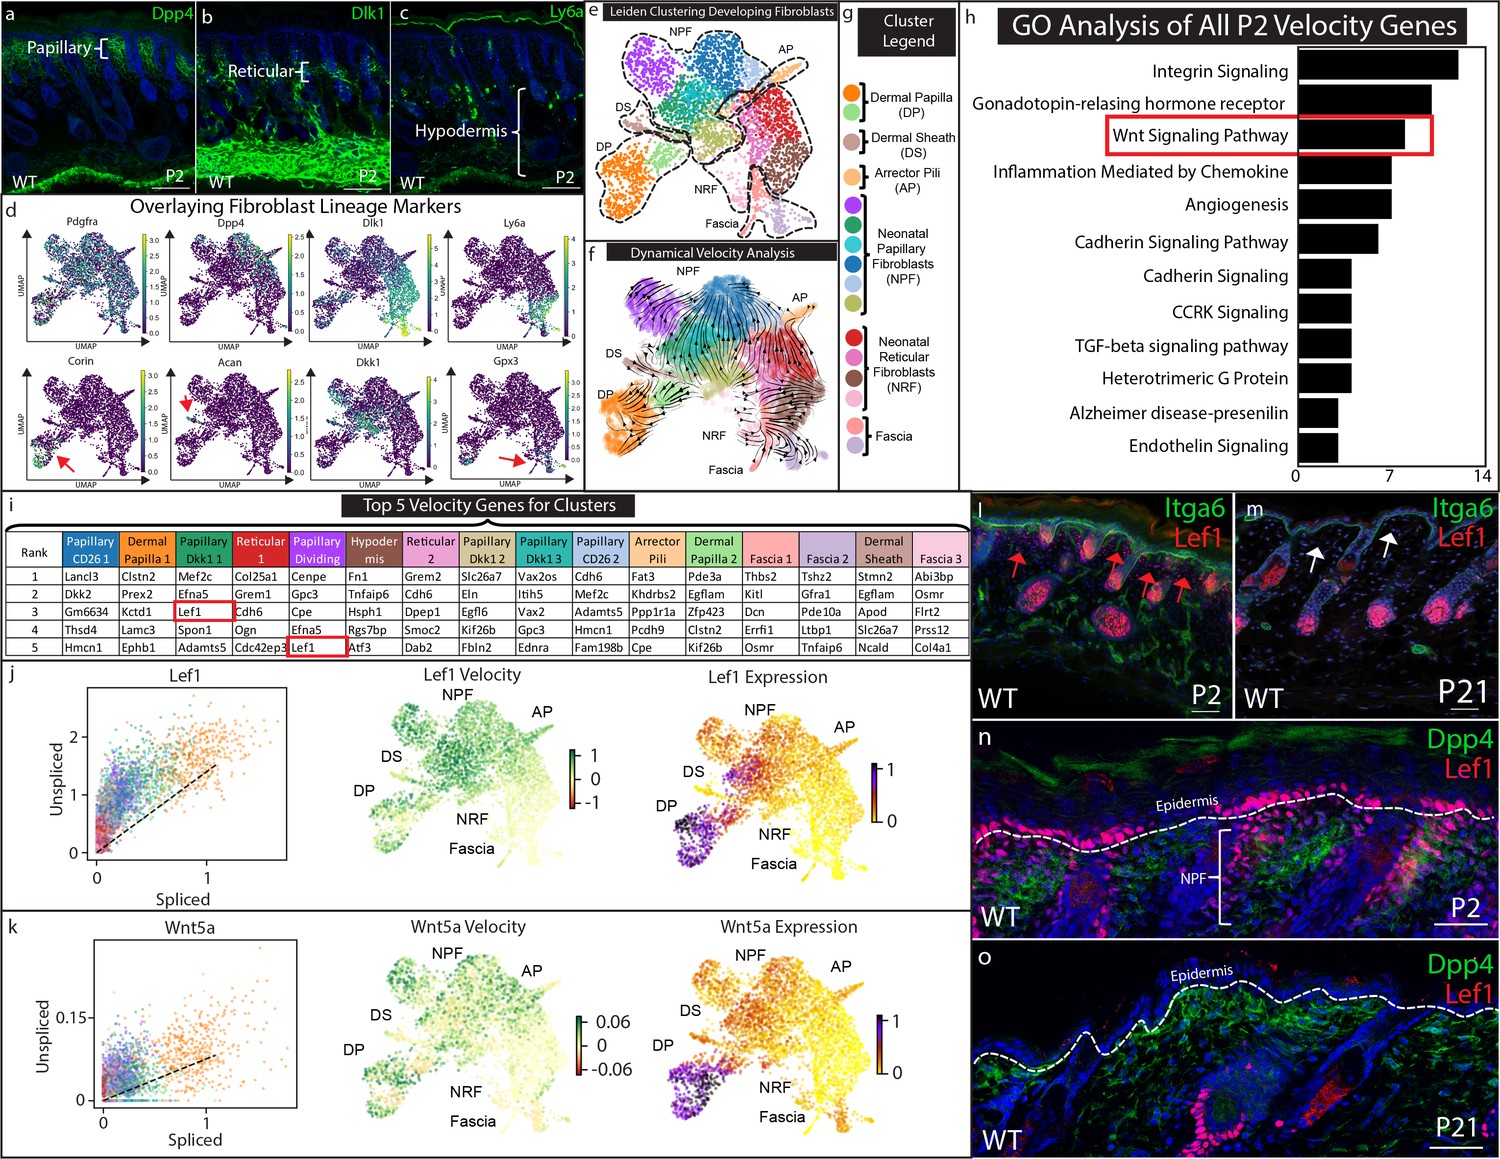
Papillary fibroblast lineage trajectory is defined by Lef1 in RNA Velocity analysis.
(a–c) Immunostaining development (P2) skin for Papillary (a) (Dpp4), Reticular/Hypodermal (b) (Dlk1/Pref1), and Hypodermal makers (c) (Ly6a). (d) Overlaying fibroblast lineage markers on UMAP projections of developing fibroblasts. (e) UMAP analysis of developing fibroblasts (f–g) RNA Velocity analysis overlaid on UMAP projection of developing fibroblasts. Clusters are colored coded and labeled. (h) GO Analysis of 195 driver genes of RNA Velocity for developing fibroblasts. (i) Top 5 Velocity driver genes of developing fibroblast clusters. (j) Phase contrast analysis of Lef1 and Wnt5a. (i–m) Immunostaining developing (P2) and homeostatic (P21) time points for Lef1 expression and counterstained with Itga6. Red arrows indicate areas of papillary dermis expressing Lef1. White arrows indicate papillary dermal region. (n–o) Immunostaining developing (P2) and homeostatic (P21) skin for Lef1 and Dpp4. Scale bars are 100 μm.
Figure 2—figure supplement 1
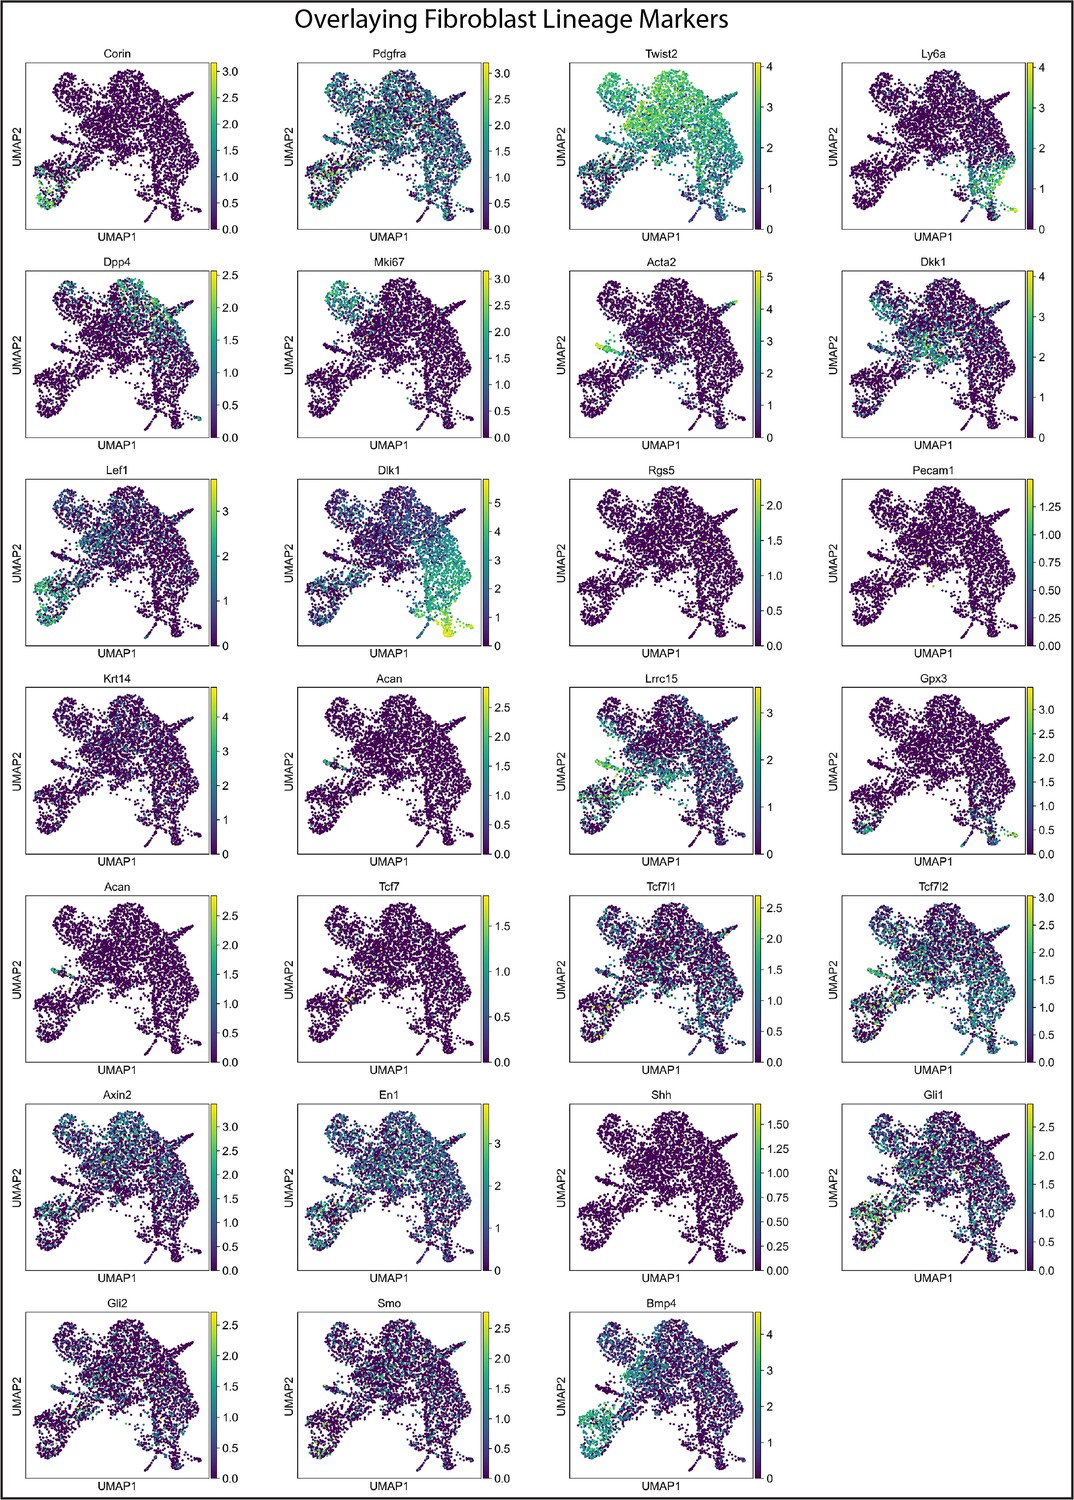
Classifying fibroblast clusters in developing fibroblasts.
Over-laying gene expression for fibroblast lineage markers.
Figure 2—figure supplement 2
Clustering and Velocity analysis of regenerating, scarring, and developing fibroblasts.
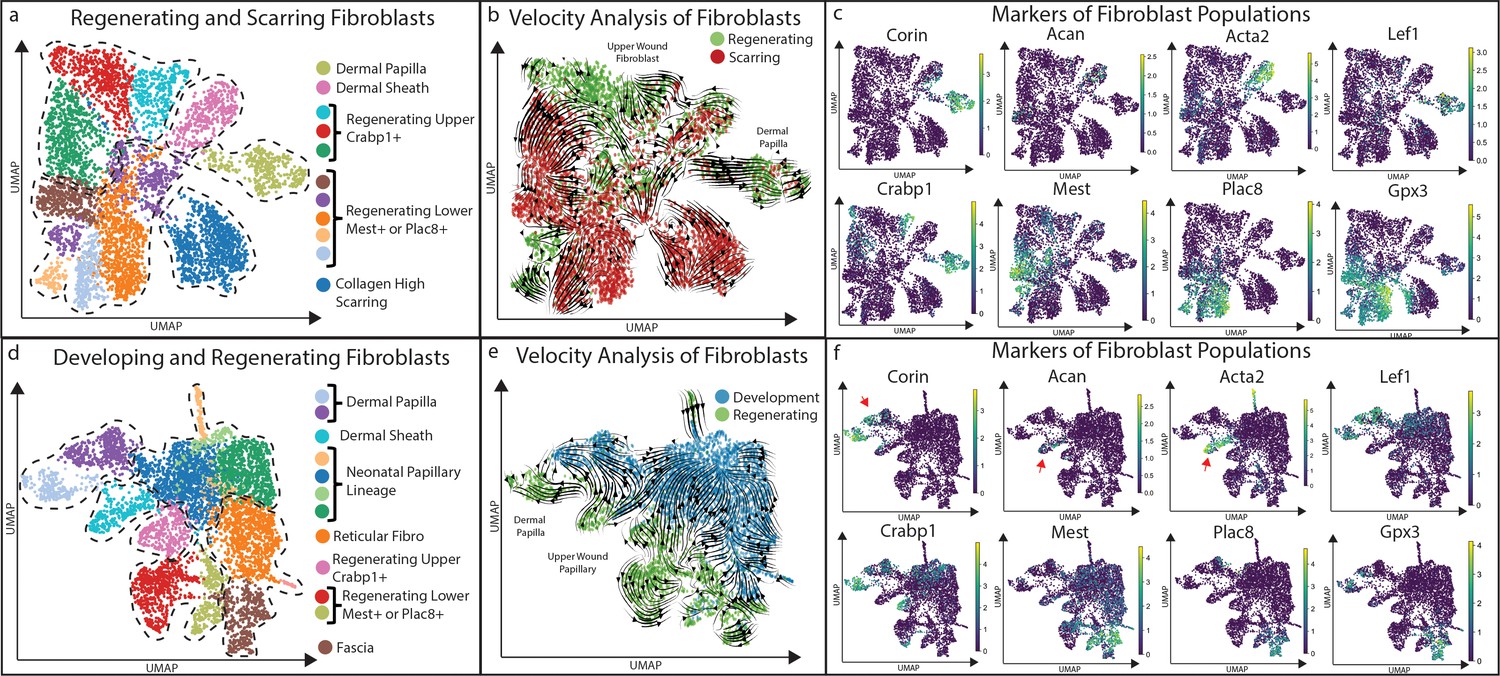
(a) Comparative clustering analysis of regenerating and scarring fibroblasts projected as a UMAP. (b) Velocity analysis of regenerating and scarring fibroblasts. (c) Expression analysis of fibroblast markers in regenerating and scarring fibroblasts. (d) Comparative clustering analysis of developing and regenerating fibroblasts projected as a UMAP. (e) Velocity analysis of developing and regenerating fibroblasts. (f) Expression analysis of fibroblast markers in developing and regenerating fibroblasts.
Figure 3
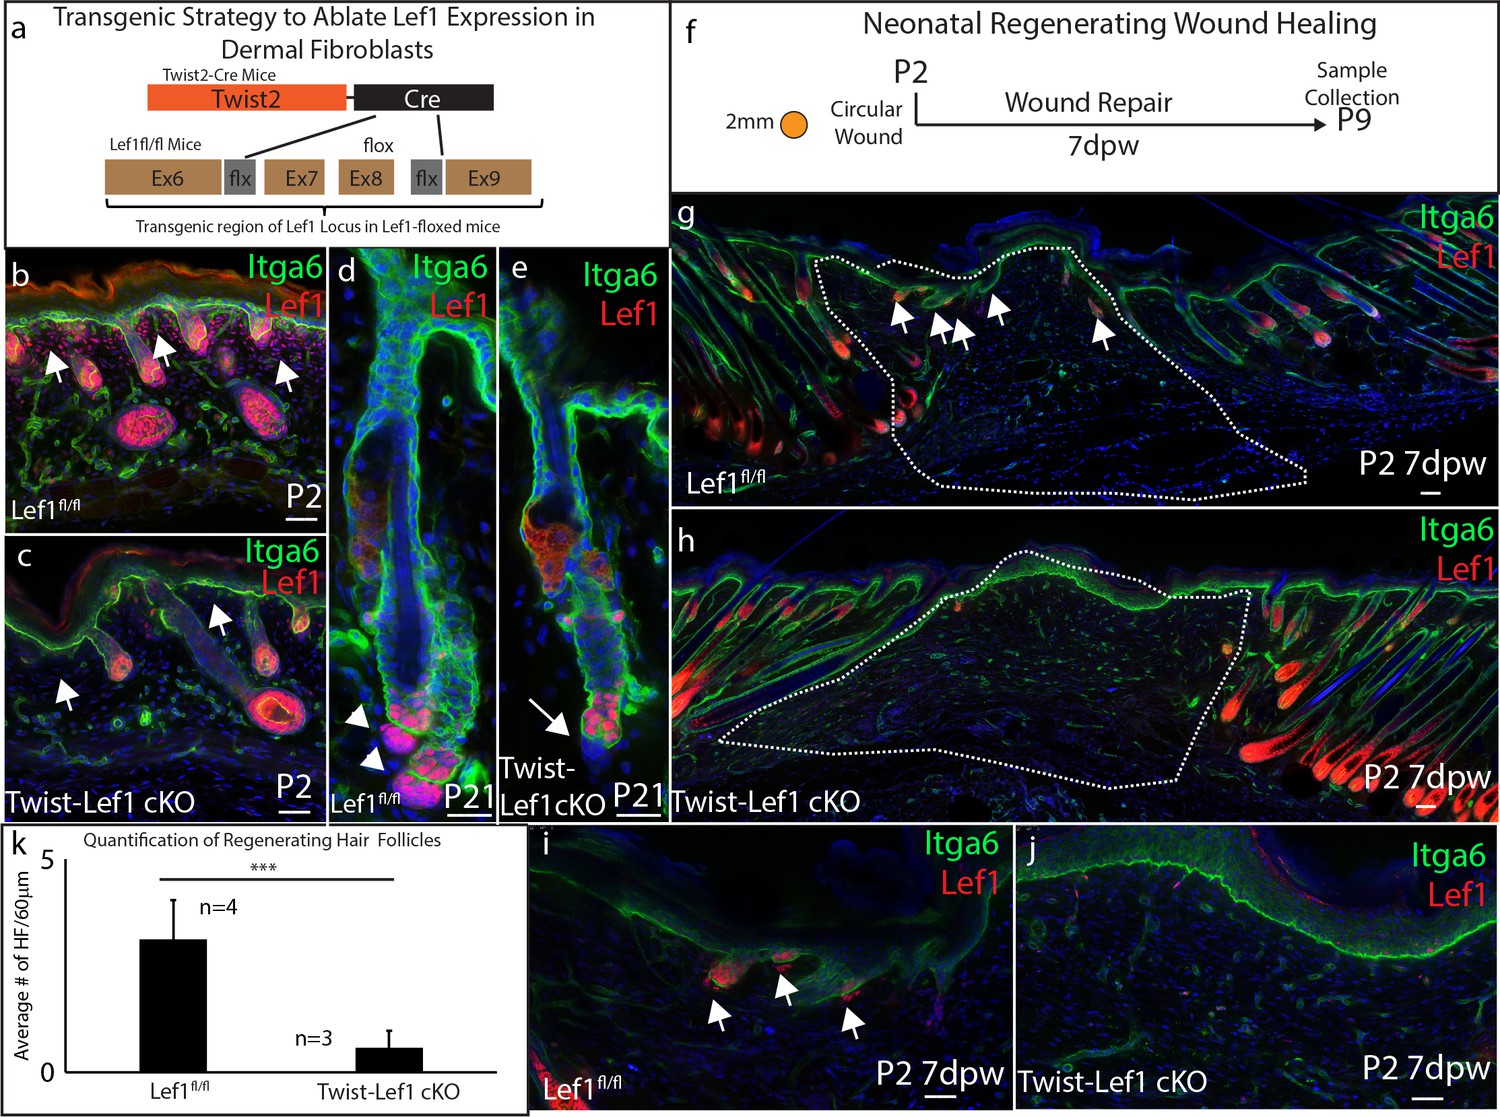
Dermal Lef1 is required to support hair follicle regeneration in neonatal wounds.
(a) Schematic representation of transgenic strategy to ablate Lef1 expression in dermal fibroblasts. Scale bars are 50 μm (b–e) Verifying dermal Lef1 ablation by immunostaining. White arrows indicate papillary regions (b–c) or dermal papilla (d–e). Scale bars are 50 μm (f) Schematic describing 2 mm circular wounds and harvest times to test if dermal Lef1 is required for regeneration. (g–i) Immunostaining of P2 7 days post wound (7dpw) skin for Itga6 and Lef1. (g-h Scale bars are 100 μm) Wound beds are highlighted by white outline. White arrows indicate regenerating hair follicles. (i-j Scale bars are 50 μm) (k) Quantification of regenerating hair follicles in wounds beds of n = 4 Lef1fl/fl (WT) and n = 3 Twist-Lef1cKO mice. p<0.003.
Figure 4 with 1 supplement
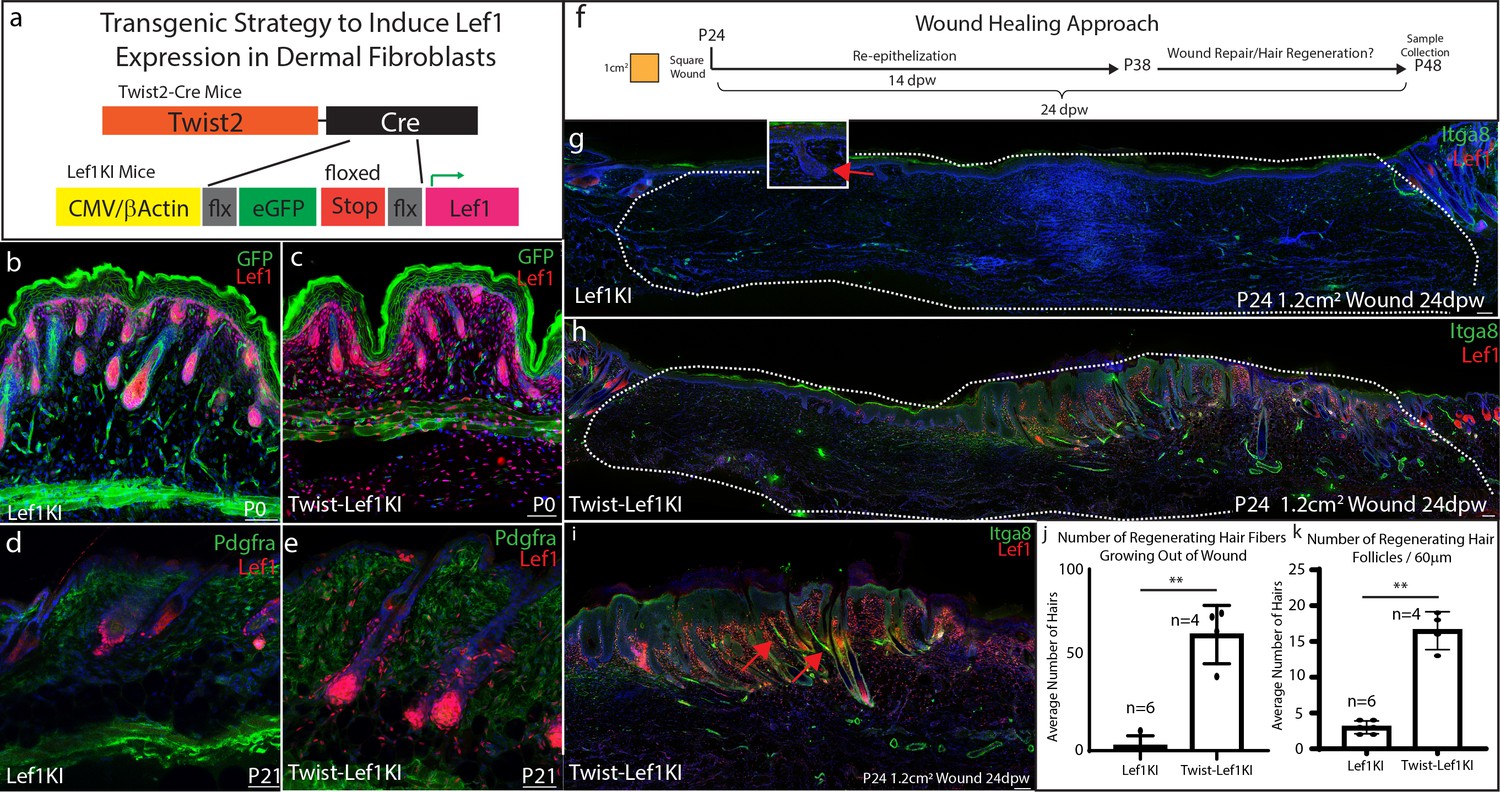
Lef1 expression in the dermis enhances skin regeneration in large wounds.
(a) Schematic representation of transgenic strategy to ectopically express Lef1 in fibroblasts during development, homeostasis, and wound healing. (b–c) Immunostaining for Lef1 and GFP in P0 Lef1KI and Twist-Lef1KI (Twist-Cre+/Lef1KI+) mice. (d–e) Immunostaining for Lef1 and PDGFRa in P21 Lef1KI and Twist-Lef1KI mice. (f) Schematic representation of wound healing approach. (g–k) Immunostaining tissue for Lef1 and Itga8 (arrector pili) from the wounds of Lef1KI and Twist-Lef1KI mice. Regenerating hair follicles in Lef1KI mice can be found by red arrows. Wound beds are marked by white dotted outlines. High resolution area of regenerating hair follicles in Twist-Lef1KI mice (i). (j) Quantification of regenerating hair follicles growing out of the wound beds of Lef1KI n = 6 and Twist-Lef1KI n = 4 mice p<0.004. (k) Quantification of regenerating hair follicles detected in 60 μm sections of wound beds. p<0.001. Scale bars at b-d are 100 μm. Scale bars at g-i are 200 μm.
Figure 4—figure supplement 1
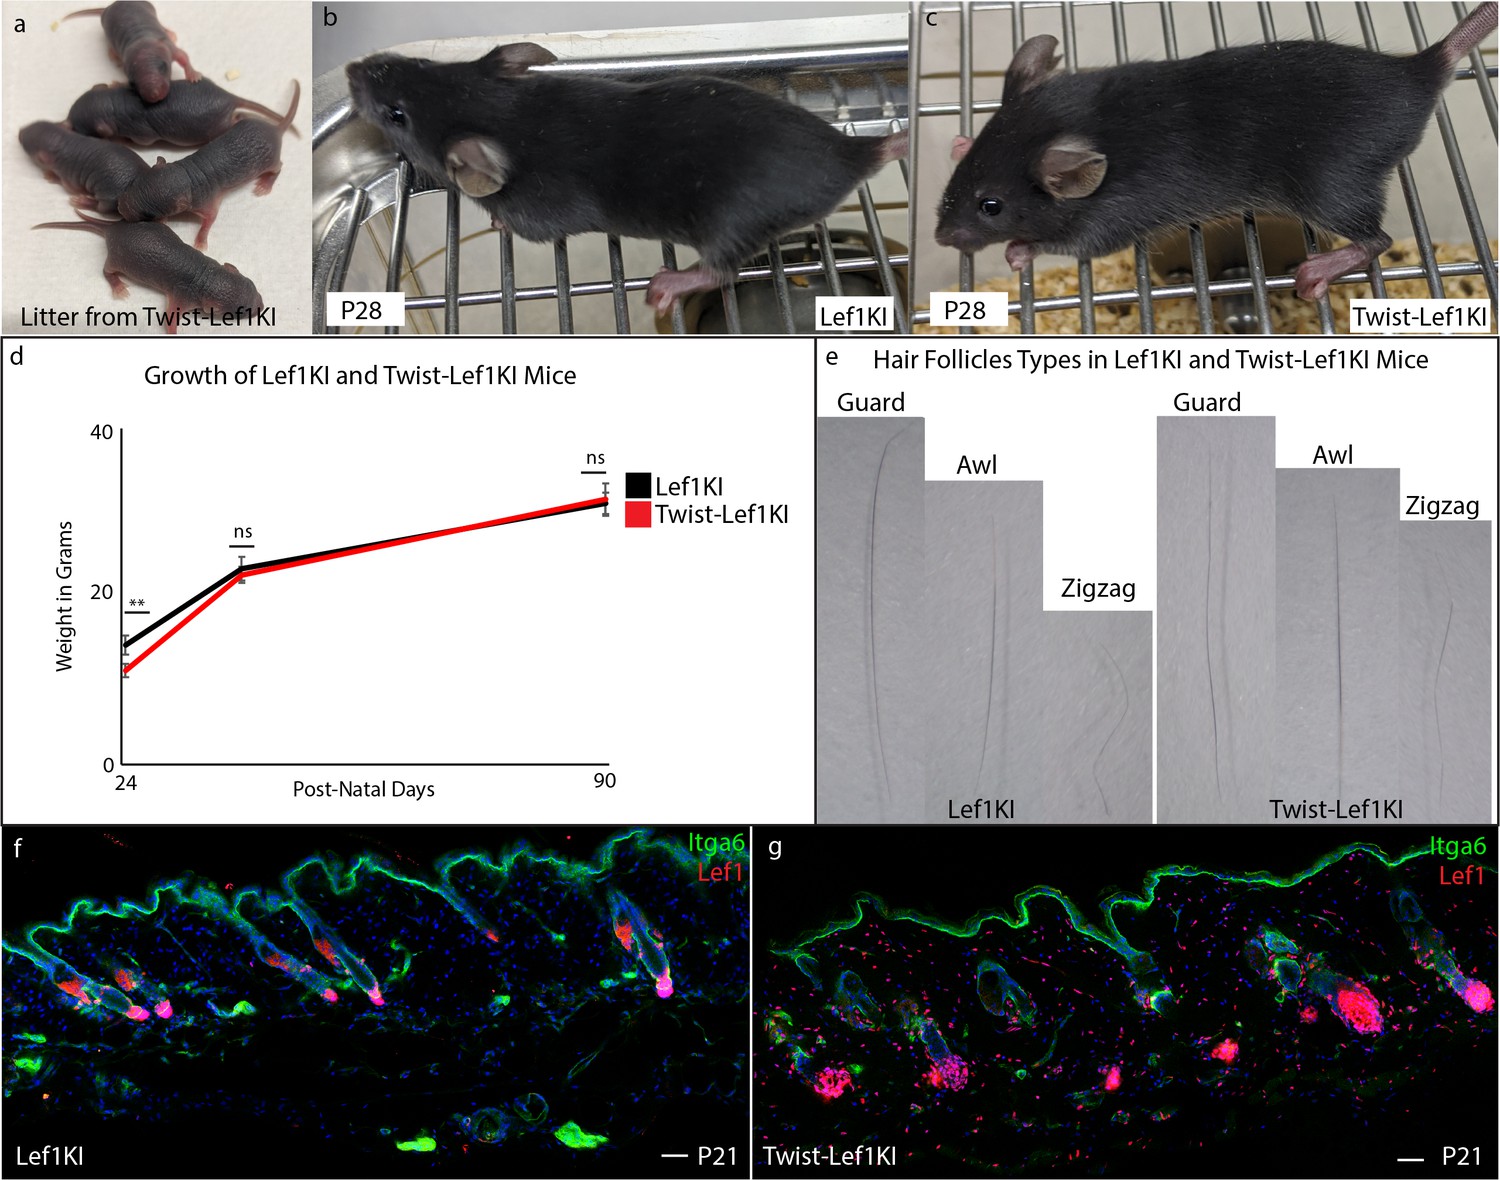
Twist-Lef1KI mice does not show overt phenotypic variations.
(a) Images of P4 litter from Twist-Lef1KI mice revealing viability of line. (b–c) P28 of wild type (b) and Twist-Lef1KI (c) mice. (d) The growth curve of male WT (Lef1KI) mice (24 male mice total) compared to Twist-Lef1KI (15 male mice total) mice at P24, P40, and P90. P24 p<0.005. (e) Macroscopic images of different hair follicle types from WT (Lef1KI) and Twist-Lef1KI hair follicles. (f–g) Immunostaining analysis of sections from P21 skin from WT (Lef1KI) and Twist-Lef1KI mice stained for Itga6 and Lef1. Scale bars are 100 μm.
Figure 5 with 2 supplements
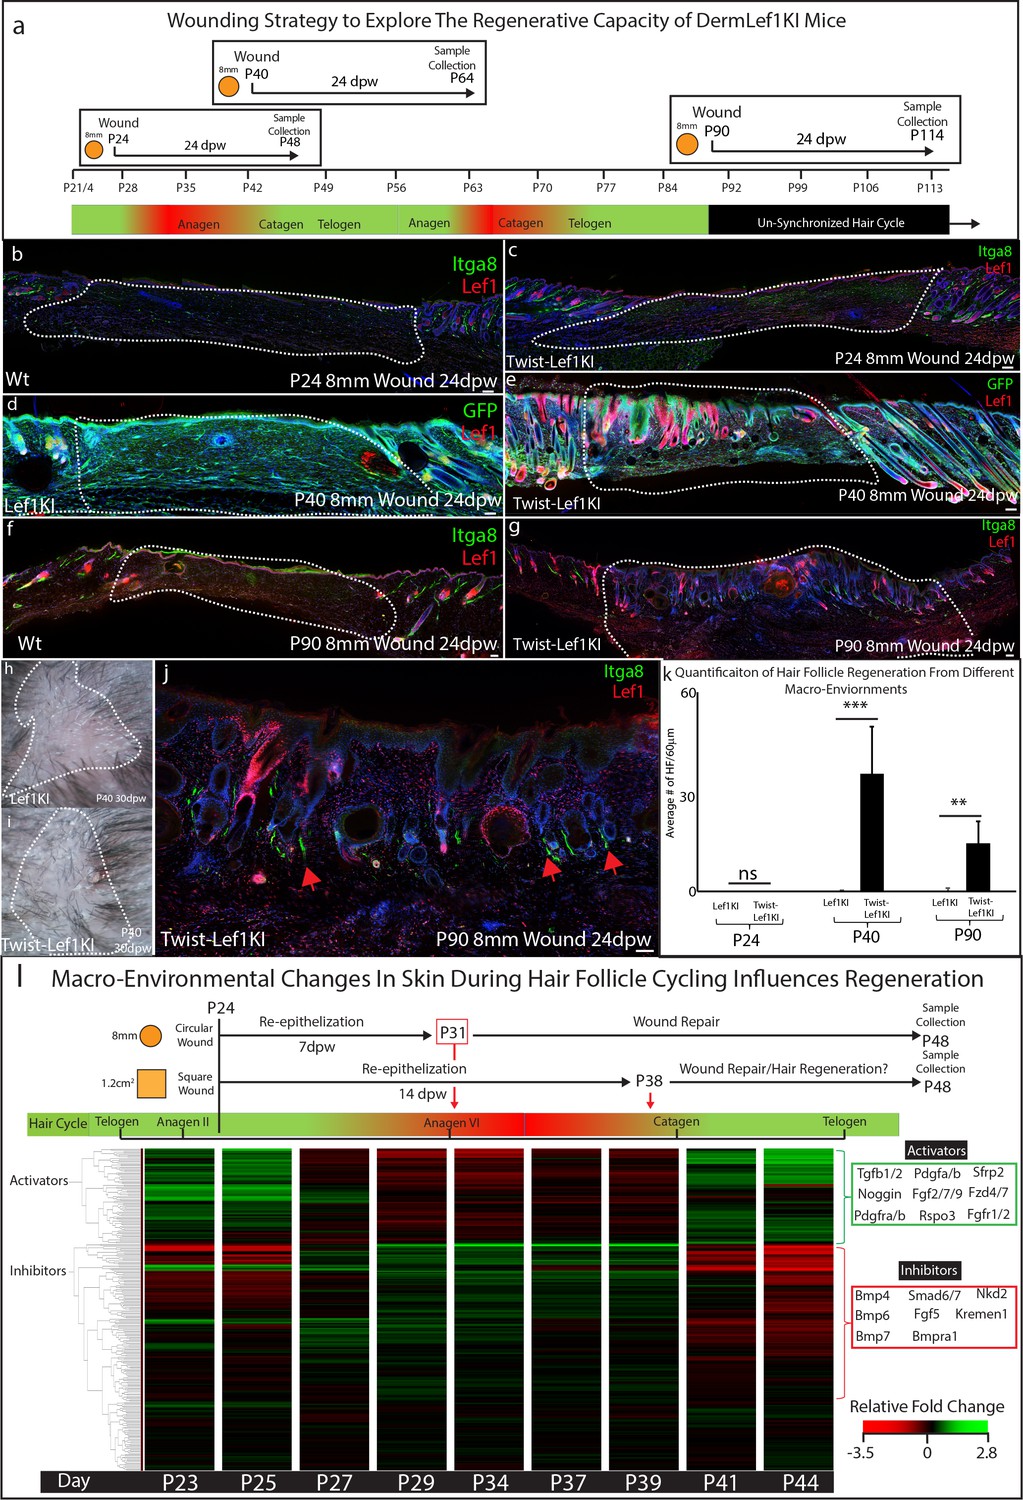
Lef1 expression in the dermis enhances skin regeneration in permissive macro environments.
(a) Schematic of the differential wound healing analysis from different time points of the hair follicle cycle in murine skin. (b–g,j) Immunostaining analysis of wounds 24dpw from P24 (b–d), P40 (d–e), and P90 (f–g,j). Sections were stained for either Itga8 and Lef1 (b–c,f–g,j) or GFP and Lef1 (d–e). Itga8 labels arrector pili. (h–i) Macroscopic analysis of wound beds from WT (Lef1KI) and Twist-Lef1KI mice. Hair follicles could be seen growing out of the wound bed of Twist-Lef1KI mice. (k) Quantification of the average number of regenerating hair follicles detected in wounds beds of 60 μm sections from P24 24dpw (ns, WT-n = 4, Twist-Lef1KI -n = 4), P40 24dpw (p<0.0009 WT-n = 4, Twist-Lef1KI -n = 4), and P90 24dpw (p<0.007 WT-n = 3, Twist-Lef1KI -n = 4). (l) Schematic representation of different wound healing approaches above a heatmap of microarray data (Lin et al., 2009) from key time points during hair follicle cycling. Heatmap is generated from a list of Activator and Inhibitor genes reported to regulate the progression of the hair follicle cycle (Wang et al., 2017). Scale bars are 100 μm.
Figure 5—figure supplement 1
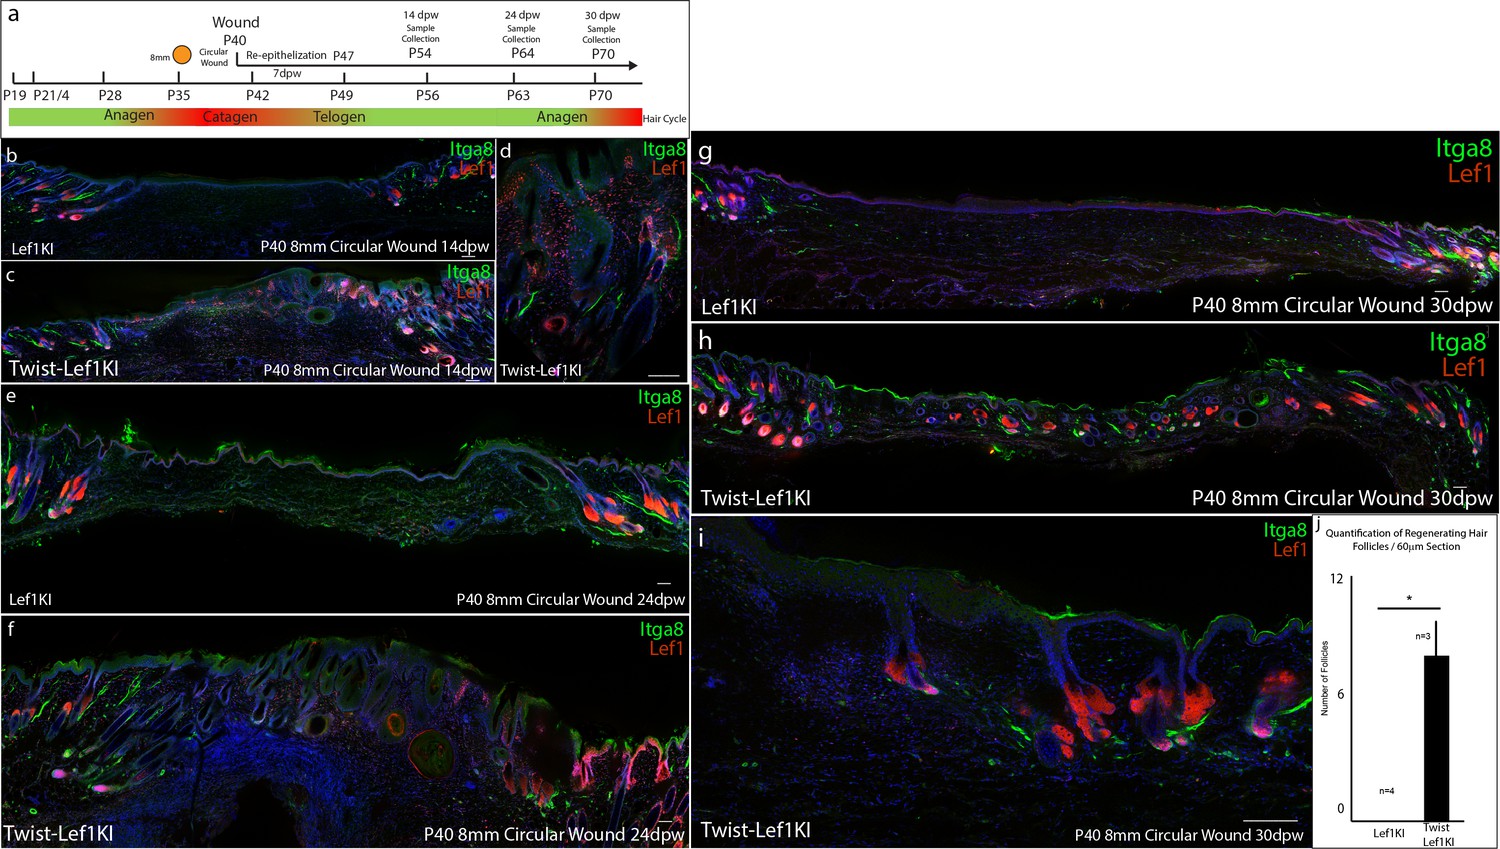
Analysis of the regenerative potential of Twist-Lef1KI wounds at P40.
(a) Schematic describing the wounding and tissue collection strategy. (b–j) Immunostaining analysis of wild type (Lef1KI) and Twist-Lef1KI mice wounded at P40 and collected at 14 dpw (b–d), 24 dpw (e–f), and 30 dpw (g–i). All sections were immunostained for Itga8 and Lef1. (j) Quantification of hair follicles in 60 μm sections of WT (Lef1KI) (n = 3) and Twist-Lef1KI (n = 3) skin 30 dpw. p<0.04. Scale bars are 200 μm.
Figure 5—figure supplement 2
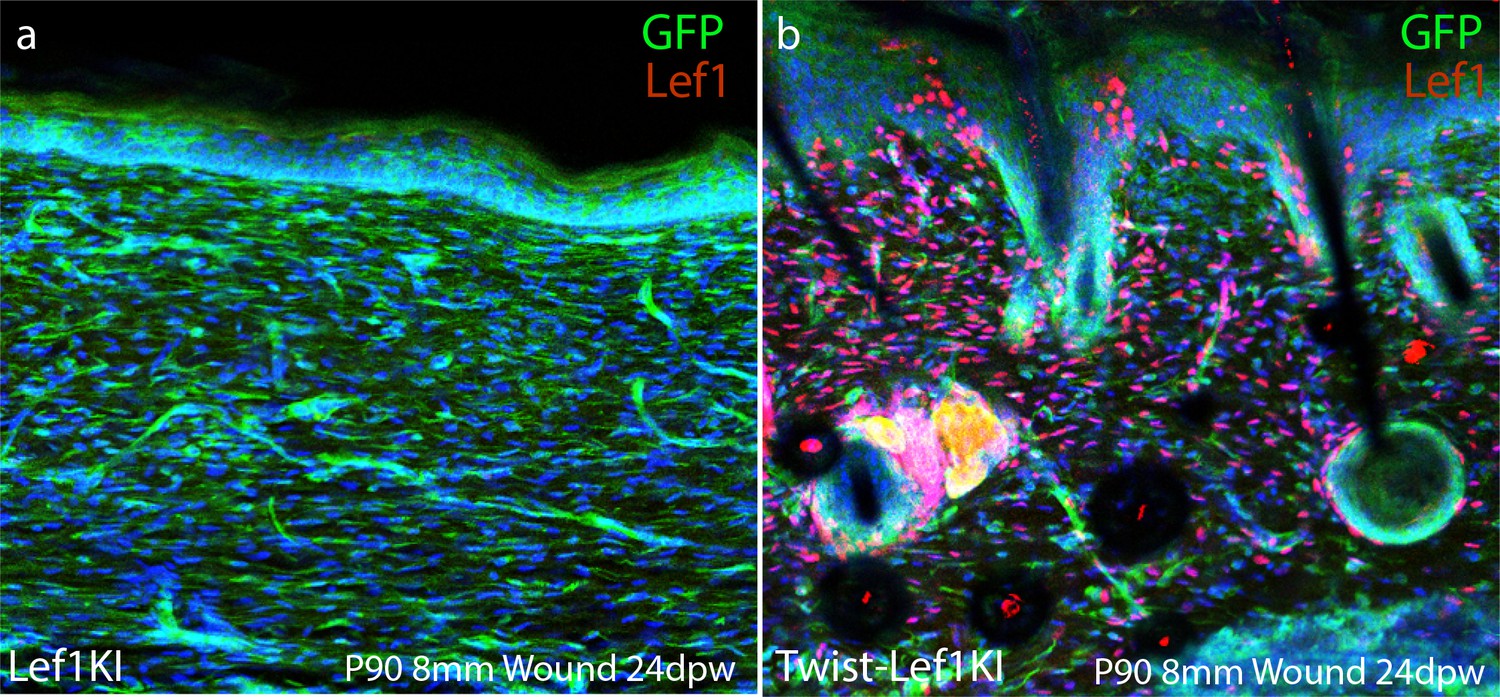
Immunostaining analysis of GFP expression in scarring and regenerating wounds of Lef1KI and Twist-Lef1KI mice.
(a–b) Immunostain of histological sections of 8 mm wounds from P40 harvested at 24 dpw. Immunostains were for GFP and Lef1.
Tables
Key resources table
| Reagent type (species) or resource | Designation | Source or reference | Identifiers | Additional information |
|---|---|---|---|---|
| Strain, strain background (M. musculus) | Dermo1-Cre or Twist2-Cre, C57Bl6/BalbC | Jackson Laboratory | RRID:MGI:3840442 | |
| Strain, strain background (M. musculus) | Lef1KI, C57Bl6/BalbC | Engelhardt lab - University of Iowa | Other | A gift from the Engelhardt lab |
| Strain, strain background (M. musculus) | Lef1KO, C57Bl6/BalbC | Xue lab - University of Iowa | RRID:MGI:5447957 | A gift from the Xue lab |
| Sequencing kit | Single Cell 3’ Library and Gel Bead Kit v2 | 10X Genomics | Cat#: PN-120267 | |
| Antibody | Anti-Integrin alpha 8 (Itga8) (goat polyclonal) | R and D Systems | Cat#: AF4076 | IF(1:200) |
| Antibody | Anti-Pref1/Dlk1 (rabbit monoclonal) | R and D Systems | Cat#: AF8277 | IF(1:200) |
| Antibody | Anti-Dpp4/CD26 (goat polyclonal) | R and D Systems | Cat#: AF954 | IF(1:200) |
| Antibody | Anti-Pdgfra (goat polyclonal) | R and D Systems | Cat#: AF1062 | IF(1:200) |
| Antibody | Anti-Lef1 (rabbit monoclonal) | Cell Signaling | Cat#: 2230S | IF(1:200) |
| Antibody | Anti-Alpha smooth muscle actin (Acta2) (rabbit polyclonal) | abcam | Cat#: ab5694 | IF(1:200) |
| Antibody | Anti GFP (chicken polyclonal) | abcam | Cat#: ab13970 | IF(1:200) |
| Antibody | Anti-Ly6a/Sca1 (rat monoclonal) | Biolegend | Cat#: 108108 | IF(1:200) |
| Antibody | Anti-CD49f/Integrin alpha 6 (Itga6) (rat monoclonal) | BD Biosciences | Cat#: 555735 | IF(1:200) |
| Antibody | Anti-goat Alexa Fluor 488 (Donkey polyclonal) | Invitrogen | Cat#: A-11055 | IF(1:500) |
| Antibody | Anti-goat Alexa Fluor 555 (Donkey polyclonal) | Invitrogen | Cat#: A-21432 | IF(1:500) |
| Antibody | Anti-goat Alexa fluor 647 (Donkey polyclonal) | Invitrogen | Cat#: A-21447 | IF(1:500) |
| Antibody | Anti-rabbit Alexa fluor Plus 555 (Donkey polyclonal) | Invitrogen | Cat#: A32794 | IF(1:500) |
| Antibody | Anti-rabbit Alexa fluor 647 (Donkey polyclonal) | Invitrogen | Cat#: A-31573 | IF(1:500) |
| Antibody | Anti-chicken Alexa fluor 488 (Goat polyclonal) | Invitrogen | Cat#: A-11039 | IF(1:500) |
| Peptide, recombinant protein | Dispase | Corning | Cat#: 3254235 | |
| Peptide, recombinant protein | Collagenase Type I | ThermoFisher | Cat#: 17100017 | |
| Software, algorithm | Cellranger v3.0.2 | 10X Genomics | RRID:SCR_017344 | |
| Software, algorithm | scanpy | scanpy | RRID:SCR_018139 | |
| Software, algorithm | scvelo | scVelo | RRID:SCR_018168 |
Additional files
-
Supplementary file 1
Markers used to identify cell populations in scRNA-seq analysis.
Genes utilized to identify clusters in scRNA analysis.
- https://cdn.elifesciences.org/articles/60066/elife-60066-supp1-v1.xlsx
-
Supplementary file 2
Velocity genes for all developing fibroblast populations.
The genes driving Velocity Trajectory in developing fibroblasts for all clusters.
- https://cdn.elifesciences.org/articles/60066/elife-60066-supp2-v1.xlsx
-
Supplementary file 3
Inhibitory genes during hair follicle cycling.
List of previously identified genes hypothesized to be inhibitory during hair follicle cycle (Wang et al., 2017). The list also includes the relative expression values of microarray analysis (Lin et al., 2009).
- https://cdn.elifesciences.org/articles/60066/elife-60066-supp3-v1.xlsx
-
Supplementary file 4
Differential expression of all regenerating fibroblasts compared to scarring fibroblasts.
This is a list of genes upregulated in regenerating or scarring fibroblasts when compared to each other in our SCANPY analysis.
- https://cdn.elifesciences.org/articles/60066/elife-60066-supp4-v1.csv
-
Supplementary file 5
Panther pathway analysis of velocity genes from developing fibroblasts.
List of pathways generated from velocity genes of developing fibroblasts.
- https://cdn.elifesciences.org/articles/60066/elife-60066-supp5-v1.xlsx
-
Transparent reporting form
- https://cdn.elifesciences.org/articles/60066/elife-60066-transrepform-v1.docx
Download links
A two-part list of links to download the article, or parts of the article, in various formats.
Downloads (link to download the article as PDF)
Open citations (links to open the citations from this article in various online reference manager services)
Cite this article (links to download the citations from this article in formats compatible with various reference manager tools)
Lef1 expression in fibroblasts maintains developmental potential in adult skin to regenerate wounds
eLife 9:e60066.
https://doi.org/10.7554/eLife.60066


