Three rules govern thalamocortical connectivity of fast-spike inhibitory interneurons in the visual cortex
- Department of Psychological Sciences, University of Connecticut, United States
- Department of Biological and Vision Sciences, State University of New York College of Optometry, United States
Figures
Figure 1 with 1 supplement

Experimental approach.
(A) Schematic of the experimental preparation. Extracellular spikes were recorded simultaneously from one or more LGN cells and from one or more L4 SINs. Cortical recordings were obtained from either a 16-channel laminar probe (aligned perpendicular to the cortical surface) or from a single movable microelectrode. Electrical stimulation of the LGN was used to identify V1 SINs. (B) Mapping with the sparse noise stimulation allowed to obtain spatiotemporal RFs and ON or OFF subfields of LGN neurons and V1 SINs. (C) An example of the spatiotemporal RF maps of an LGN concentric cell and SIN of L4 shown as a color maps in a series of time delays after stimulus onset. (D) Spatial RF maps for the same LGN-SIN pair shown in C. The spatial maps were obtained by reverse-correlating neuronal responses with the white or black stimuli in a time window (±15 ms) around the response peak. Colors correspond to the response sign (red, ON; blue, OFF). (E) Temporal profiles of the spatial RF for the same ON-center LGN neuron (upper trace) and ON-OFF balanced SIN (lower traces) shown in C-D. Spatial response is normalized to maximum within each cell. Red and blue points are the average response at each time step and lines are a fitted polynomial function of ON and OFF responses respectively. The vertical dashed lines mark the latencies of RFs. Peak latency of the response is taken as the latency to the peak of the interpolating function (vertical lines), duration of the response is taken as the full width at half maximum value (horizontal lines). (F) Cross-correlograms for the same LGN-SIN pair indicating synaptic connectivity between LGN neuron and retinotopically-aligned SINs in L4. ‘0’ on the x-axis represents the time of the LGN spikes. The correlograms are based on spontaneous activity.
Figure 1—figure supplement 1
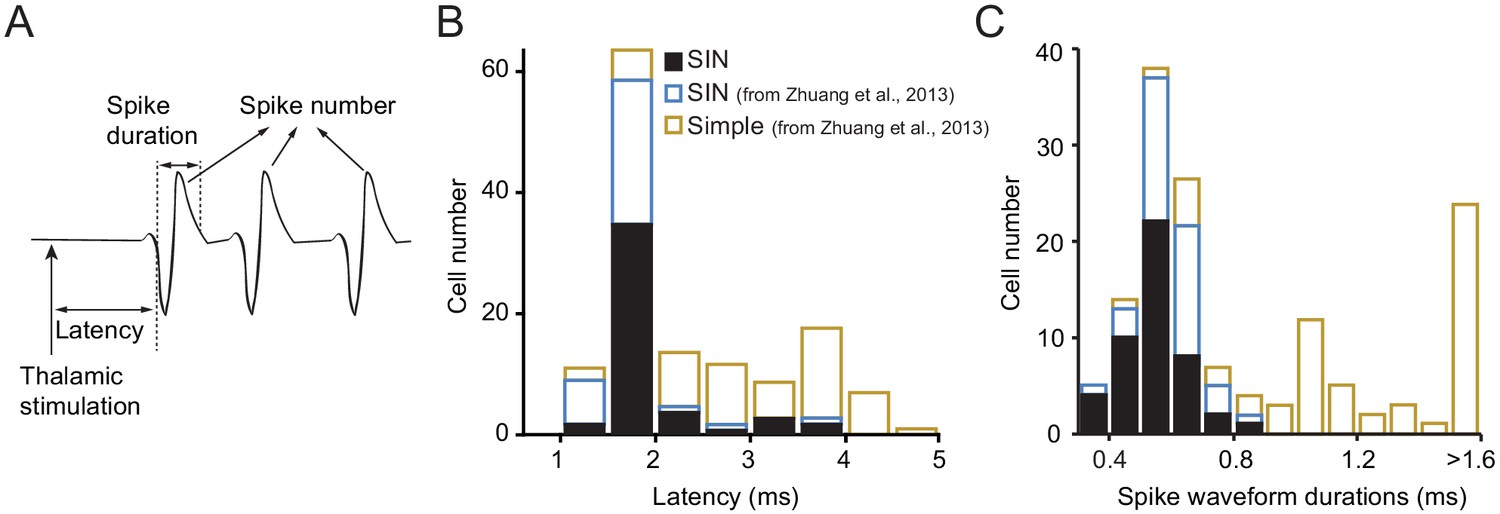
Some characteristics of L4 SINs.
(A) Schematic illustration of how we measured spike duration and latency to thalamic stimulation. (B) Distributions of latencies to LGN electrical stimulation for the L4 SINs studied here, compared to L4 SINs and simple cells studied by Zhuang et al., 2013. (C) Distribution of spike waveform duration measures for the L4 SINs studied here, compared to L4 SINs and simple cells studied by Zhuang et al., 2013.
Figure 2

Rule 1: Retinotopic alignment.
(A) Relationship between retinotopic alignment of LGN and L4 SIN RF centers (x-axis) and (1) the efficacy of the connection between concentric LGN neurons and SINs (filled circles, y-axis, left side) and (2) the percent connected cell pairs (solid line, y-axis right side). The proportion of connected pairs is high (~73%) when alignment is good (i.e. when the distance between thalamic and cortical RF centers is less than 1/2 the diameter of the LGN RF), and drops off precipitously as misalignment increases. Non-connected cell pairs were ascribed an efficacy of ‘0’ and are shown by open circles. Insets show cross-correlograms for four LGN-SIN pairs with different degrees of RF alignment. Red arrow denotes the data point for cell pair shown in B-E. (B-E) Importantly, LGN-SIN synaptic connectivity does not depend on similarity of RF properties other than alignment. An example of connected cell pair with dissimilar RF sign (LGN cell was OFF-center, SIN was ON-dominated) and dissimilar sustained/transient cell class. (B) Spatial RF maps from a LGN neuron and a retinotopically-aligned L4 SIN. (C) LGN and SIN RFs are dissimilar in their RF sign. The LGN neuron yields only an OFF response at short latencies, and SIN yields earlier and stronger ON response. (D) These LGN and SIN RFs are also dissimilar in their sustained/transient responses. PSTHs of the responses of the LGN cell (upper) and the SIN (lower) to an optimal stationary stimulus placed over the RF center, presented for two seconds (arrows mark stimulus onset). The LGN cell responded in a purely transient manner, but the SIN’s response had both transient and sustained components and was therefore classified as a ‘sustained’ cell (Bezdudnaya et al., 2006; Stoelzel et al., 2008; Zhuang et al., 2013). (E) Cross-correlation of the spike trains (spontaneous spikes only) of the LGN cell and the SIN, indicating synaptic connectivity.
Figure 3
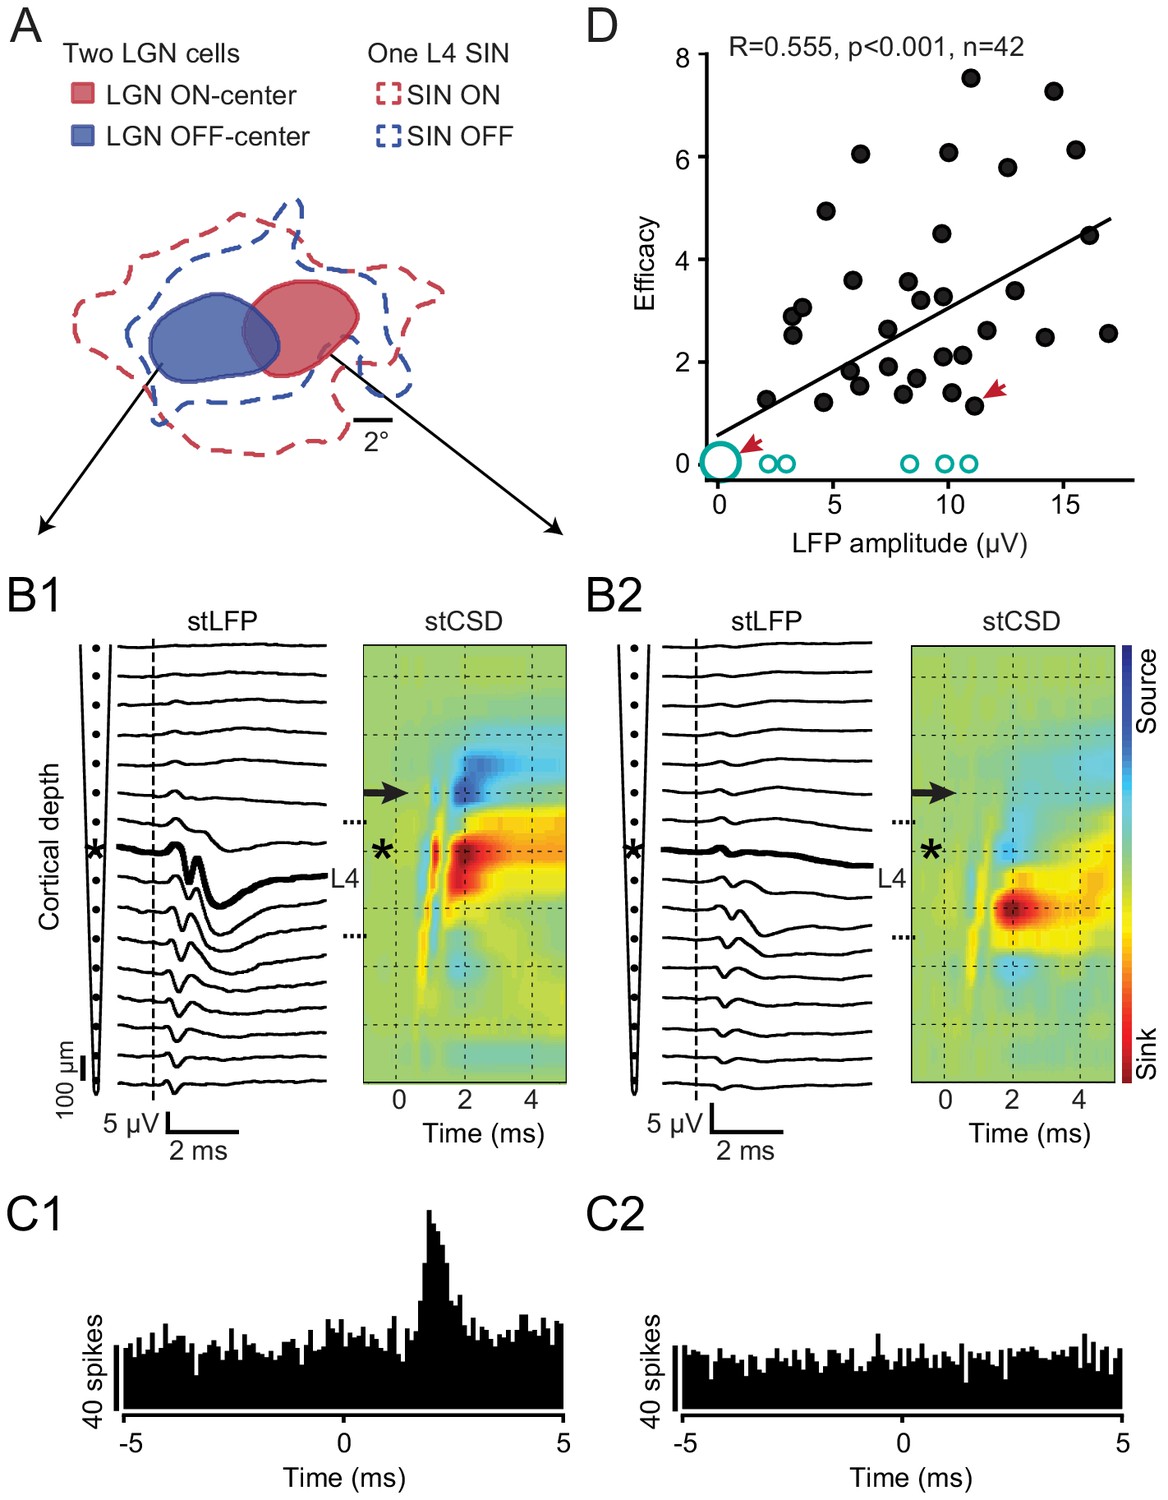
Rule 2: The ‘strength’ with which the LGN neuron provides a synaptic drive to the local network within which the aligned SIN is imbedded.
(A-C) An example of the RF maps of two simultaneously recorded LGN neurons and a retinotopically-aligned SIN recorded on a linear probe. (A) The RFs of two LGN neurons (red - ON-center, blue - OFF-center) along with the RF of the SIN located within superficial L4 of V1. (B1, B2) Spike-triggered LFPs and the colorized CSD profiles generated in V1 by the spikes of these two LGN cells. The SIN was recorded on the 8th channel from the top of the probe (asterisk). The spike-triggered LFP/CSD generated by the OFF-center LGN cell had a maximum response more superficially in L4, at the same depth as the SIN, and this LGN neuron was synaptically connected to the SIN (C1). The ON-center LGN neuron generated a postsynaptic response that was deeper in L4 (B2), with almost no response in superficial L4 (where the SIN was located, and this LGN neuron was not connected to the SIN (C2)), despite the good retinotopic alignment of their RFs. (D) For all 42 well-aligned LGN-SIN cell pairs, the relationship between the amplitude of the spike-triggered postsynaptic response generated by the LGN neuron recorded near the SIN and the efficacy of the synaptic connection with the retinotopically-aligned SIN (non-connected cell pairs were ascribed an efficacy of ‘0’ and are shown by open circles). The largest open circle illustrates LGN cells with no spike-triggered postsynaptic LFP and no connection with a SIN revealed by cross-correlation analysis. Red arrows denote data points derived from the LGN-SIN pairs shown in B1, C1 (right arrow) and B2, C2 (left arrow).
Figure 4
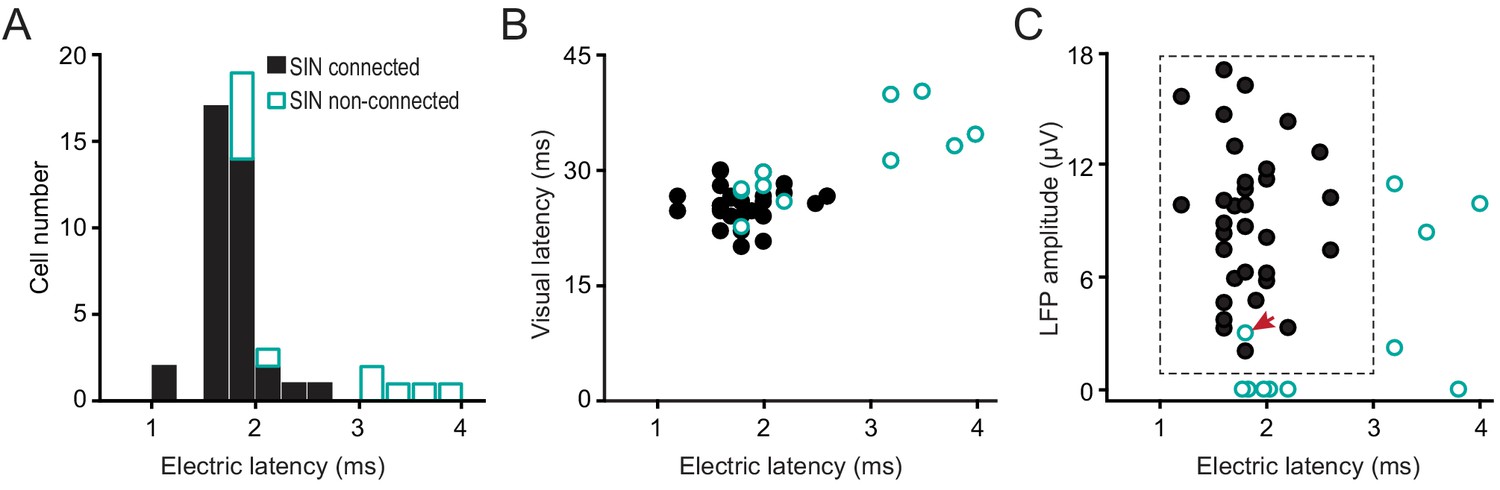
Rule 3: A third factor explains why some retinotopically-aligned LGN/SIN cell pairs were not synaptically connected despite strong retinotopic alignment and a strong postsynaptic LFP response generated by the LGN neuron in the vicinity of the SIN.
This factor concerns the global synaptic connectivity of the specific L4 SIN with the LGN. Some L4 SINs appear to receive no (or very weak) direct synaptic input from the LGN, as indicated by a failure to respond at a short latency to either strong electrical stimulation of the LGN or visual stimulation. This accounts for the lack of connectivity of some well-aligned LGN-SIN pairs. (A) The distribution of synaptic latencies to electrical stimulation of the LGN, for SINs that were, or were not connected to their aligned LGN neuron. Note that none of the SINs responding at synaptic latencies of >3 ms were synaptically connected to its paired, well-aligned LGN neurons. (B) The relationship between synaptic latency to electrical stimulation of the LGN and the synaptic latency to visual stimulation. (C) For well-aligned connected and unconnected LGN-SIN pairs, the relationship between the amplitude of the postsynaptic LFP response generated by the LGN cell in the network surrounding SIN and the latency of the SIN to electrical stimulation of the LGN. These two variables account for all-but-one (indicated by the red arrow) of the cases in which the LGN/SIN pairs were not synaptically connected, despite precise retinotopic alignment.
Figure 5
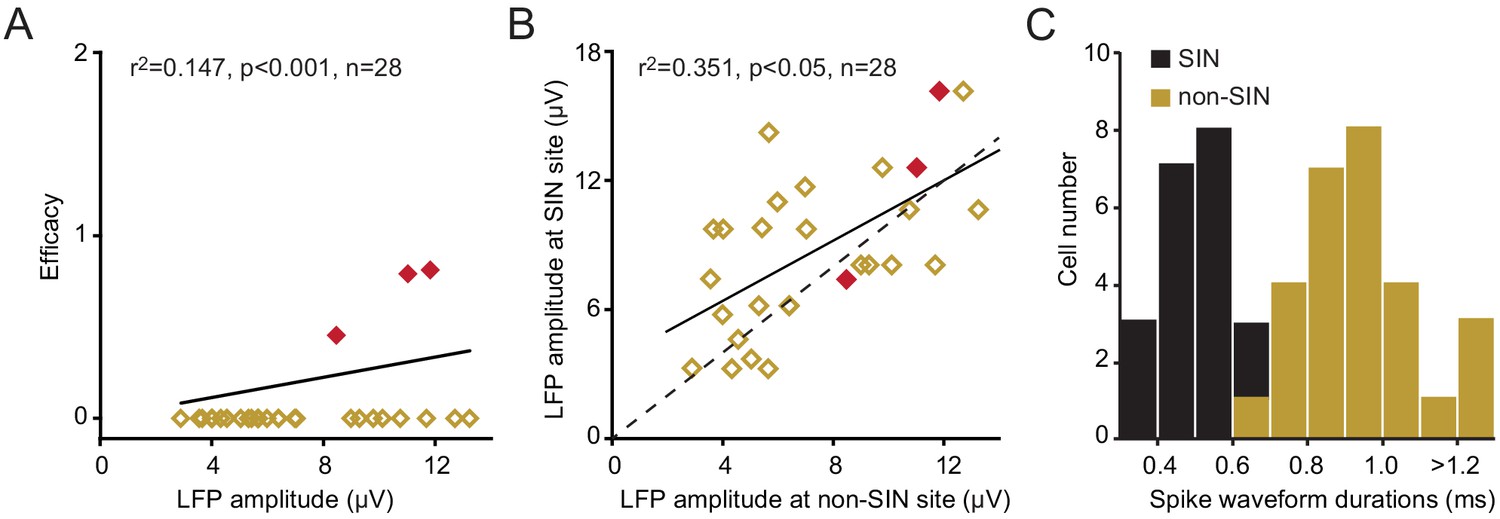
Functional connectivity between LGN neurons and L4 non-SINs.
(A)The relationship between the amplitude of the spike-triggered postsynaptic response generated by the LGN neuron, recorded at the site of the non-SIN, and the efficacy of any synaptic connection with the non-SIN. Only three of these non-SINs (red) showed synaptic connectivity. Each of these non-SINs was located within 150 μm (either above or below) of a SIN that did receive a synaptic input from the same LGN neuron. (B) The relationship between the peak amplitude of the spike-triggered postsynaptic responses generated by a single LGN neuron, at the site of a synaptically connected SIN (y-axis) and at the site of a non-SIN (x-axis, located at a vertical distance of <150 μm from the connected SIN). For all data points, the SIN is connected to the LGN neuron, for red points, both the SIN and the non-sin are connected. (C) The frequency distribution of spike waveform durations for the L4 non-SINs shown in A and for the neighboring connected SINs. The L4 non-SINs had considerably longer-duration spikes than did the neighboring connected SINs.
Additional files
Download links
A two-part list of links to download the article, or parts of the article, in various formats.
Downloads (link to download the article as PDF)
Open citations (links to open the citations from this article in various online reference manager services)
Cite this article (links to download the citations from this article in formats compatible with various reference manager tools)
Three rules govern thalamocortical connectivity of fast-spike inhibitory interneurons in the visual cortex
eLife 9:e60102.
https://doi.org/10.7554/eLife.60102


