Metabolic profiling during malaria reveals the role of the aryl hydrocarbon receptor in regulating kidney injury
- Department of Microbiology and Immunology, Stanford University, United States
- Department of Comparative Medicine, Stanford University, United States
- Division of Health, Mathematics and Science, Columbia College, United States
Figures
Figure 1 with 2 supplements
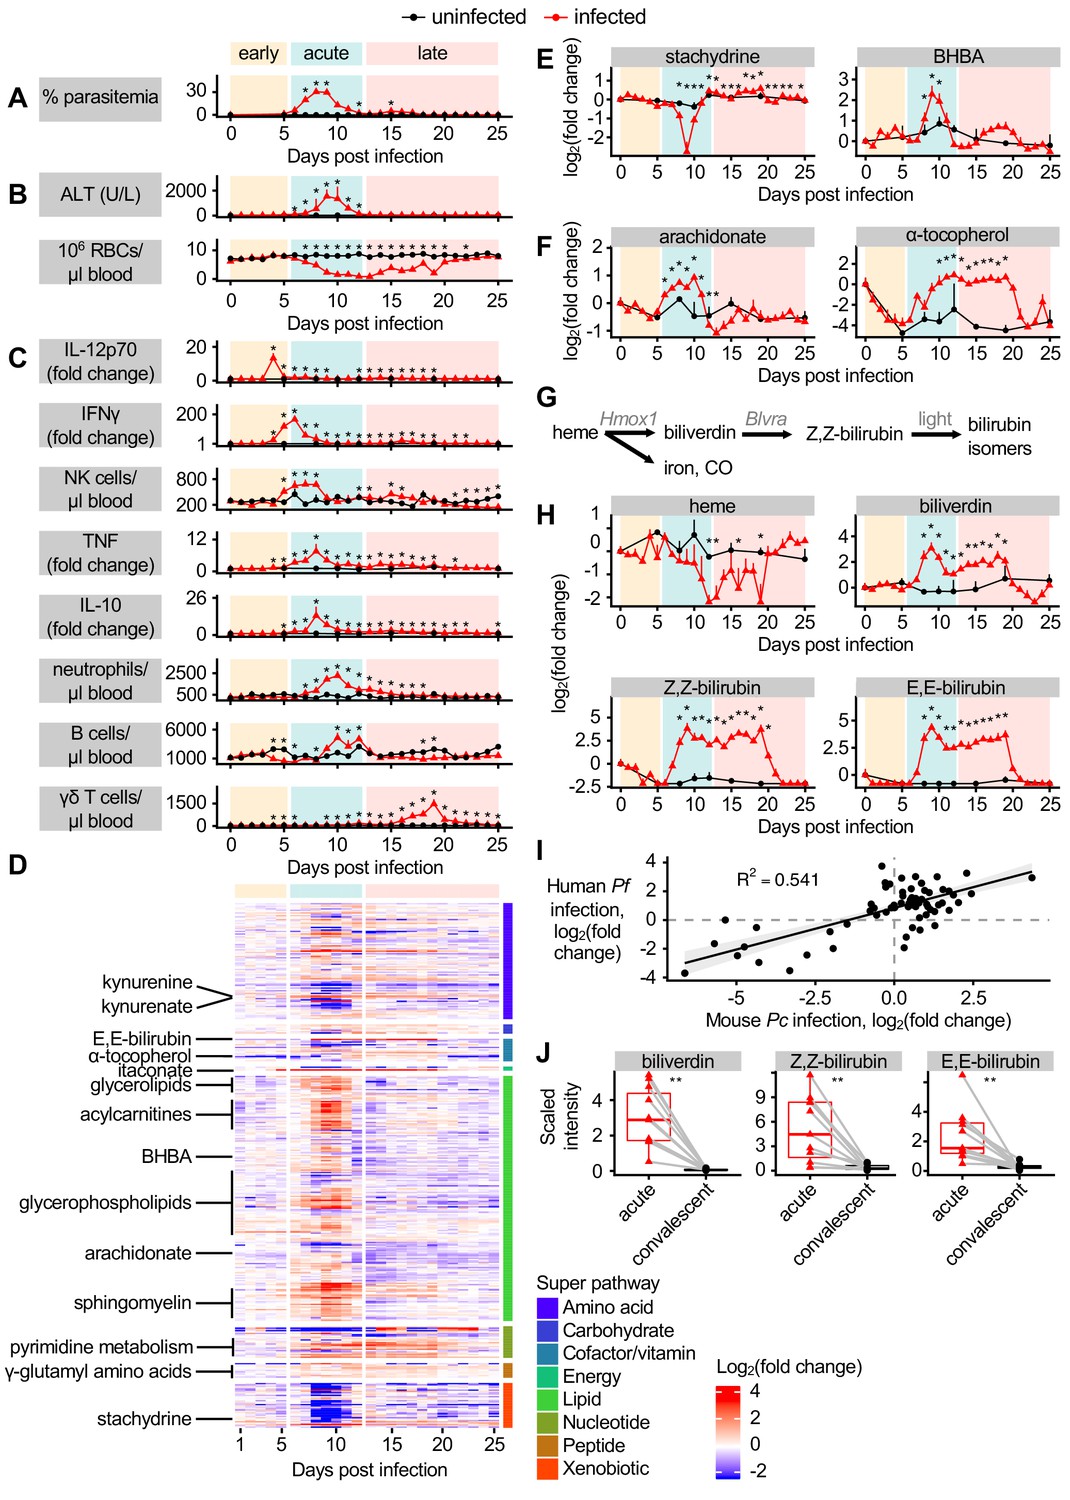
Dynamic multi-omic profiling of Pc-infected mice reveals broad immune and metabolic changes.
(A) Parasitemia, (B) liver damage and anemia, and (C) selected peripheral blood immune cells and cytokines during 25 days of malaria. (D) 370 metabolites with altered scaled intensity in plasma during malaria, arranged by super pathway. Fold change of scaled intensity of (E) stachydrine, BHBA, (F) arachidonate, and α-tocopherol in plasma during malaria, relative to day 0. (G) Schematic of metabolites and genes of heme metabolism. (H) Fold change of scaled intensity of heme-related metabolites in plasma during malaria, relative to day 0. (I) Fold change of metabolites (n = 77) that were significantly altered in the plasma of both Pc-infected mice and pediatric cerebral malaria patients, plotted by fold change relative to day 0 samples for mice and relative to convalescent values for patients. Data are fitted with a linear model. (J) Scaled intensity of heme-related metabolites during human malaria (n = 11 patients per condition). In A-C, E, F, and H, data are presented as mean + SEM and p-values were determined by comparing each infected time point to all uninfected values using two-way ANOVA with FDR correction (n = 5 mice on 0 DPI, five infected mice each day, and two uninfected mice each day). *p<0.05. In J, p-values were determined using a Wilcox test. **p<0.01. These experiments were performed once.
-
Figure 1—source data 1
Source data for Figure 1.
- https://cdn.elifesciences.org/articles/60165/elife-60165-fig1-data1-v1.xlsx
Figure 1—figure supplement 1
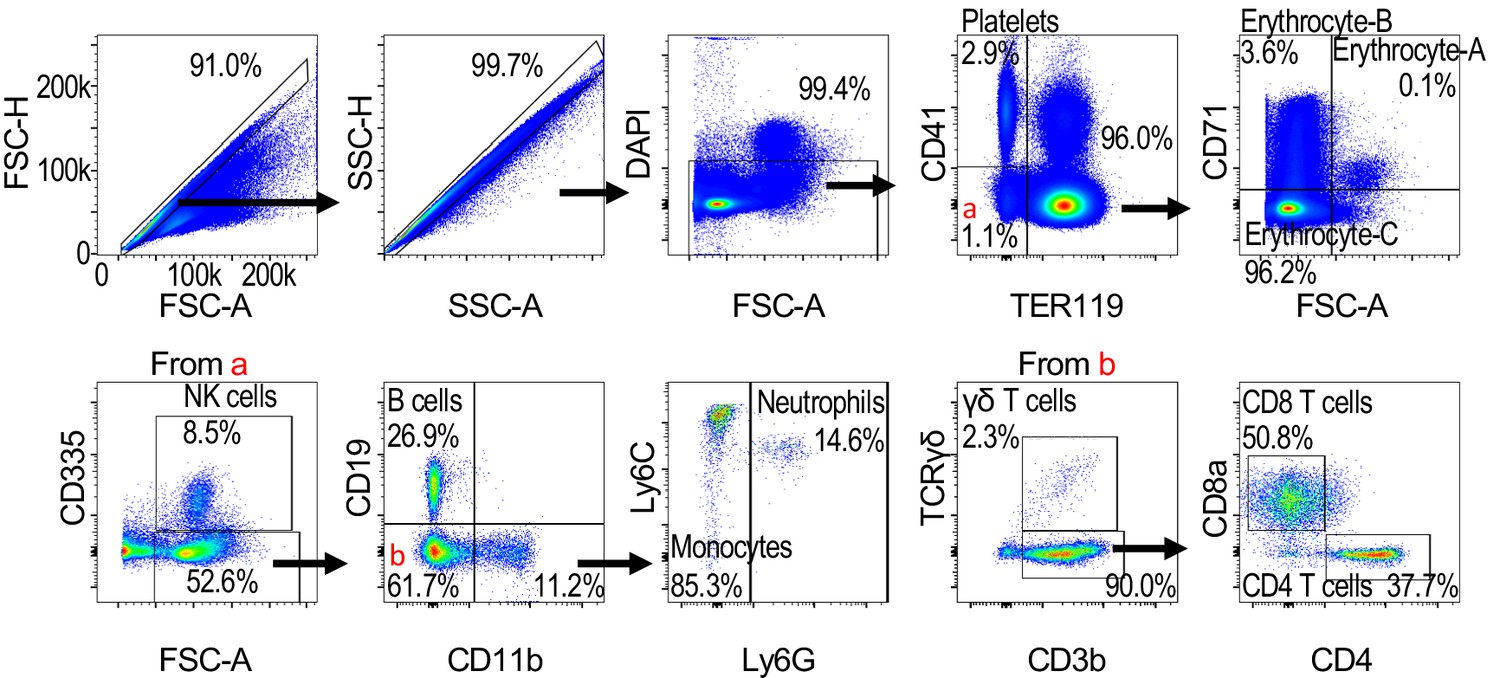
Gating strategy used to define blood cell populations.
Figure 1—figure supplement 2
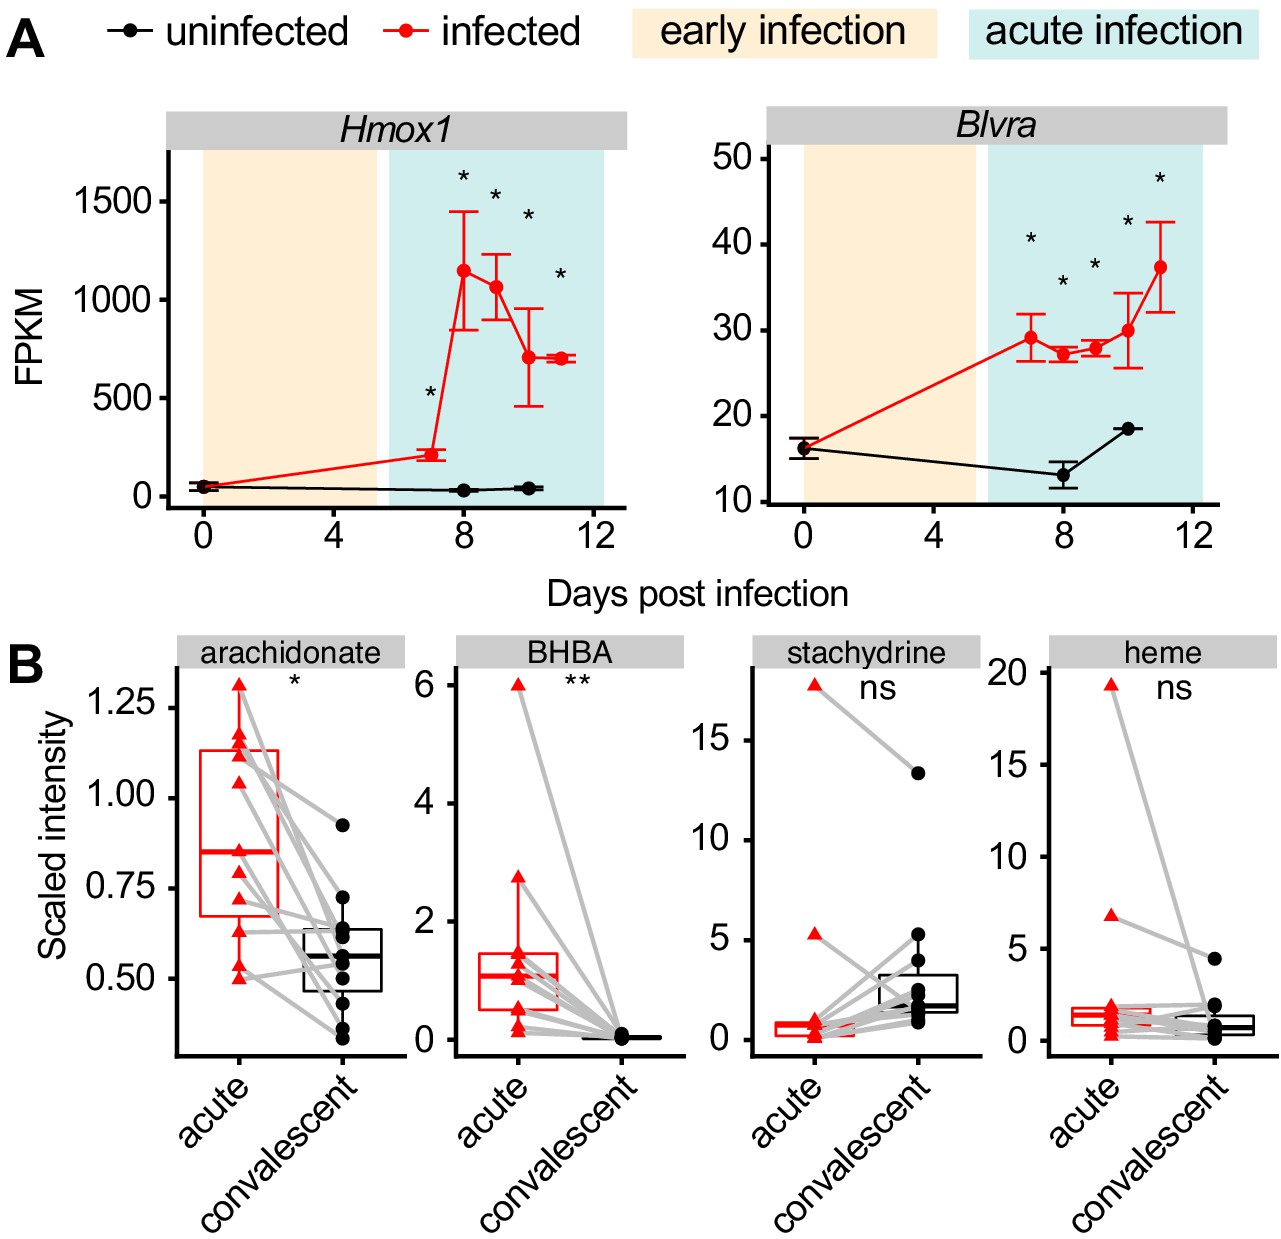
Production of heme metabolites during malaria.
(A) Expression of heme metabolism genes in livers of Pc-infected mice. p-Values were determined by comparing each infected time point to all uninfected values using two-way ANOVA with FDR correction (n = 5 mice on 0 DPI, five infected mice each day, and two uninfected mice each day). *p<0.05. (B) Scaled intensity of arachidonate, BHBA, stachydrine, and heme in pediatric cerebral malaria patients (n = 11 per condition). p-Values were determined using a Wilcox test. *p<0.05, **p<0.01, ***p<0.001, ****p<0.0001. These experiments were performed once.
-
Figure 1—figure supplement 2—source data 1
Source data for Figure 1—figure supplement 2.
- https://cdn.elifesciences.org/articles/60165/elife-60165-fig1-figsupp2-data1-v1.xlsx
Figure 2 with 1 supplement
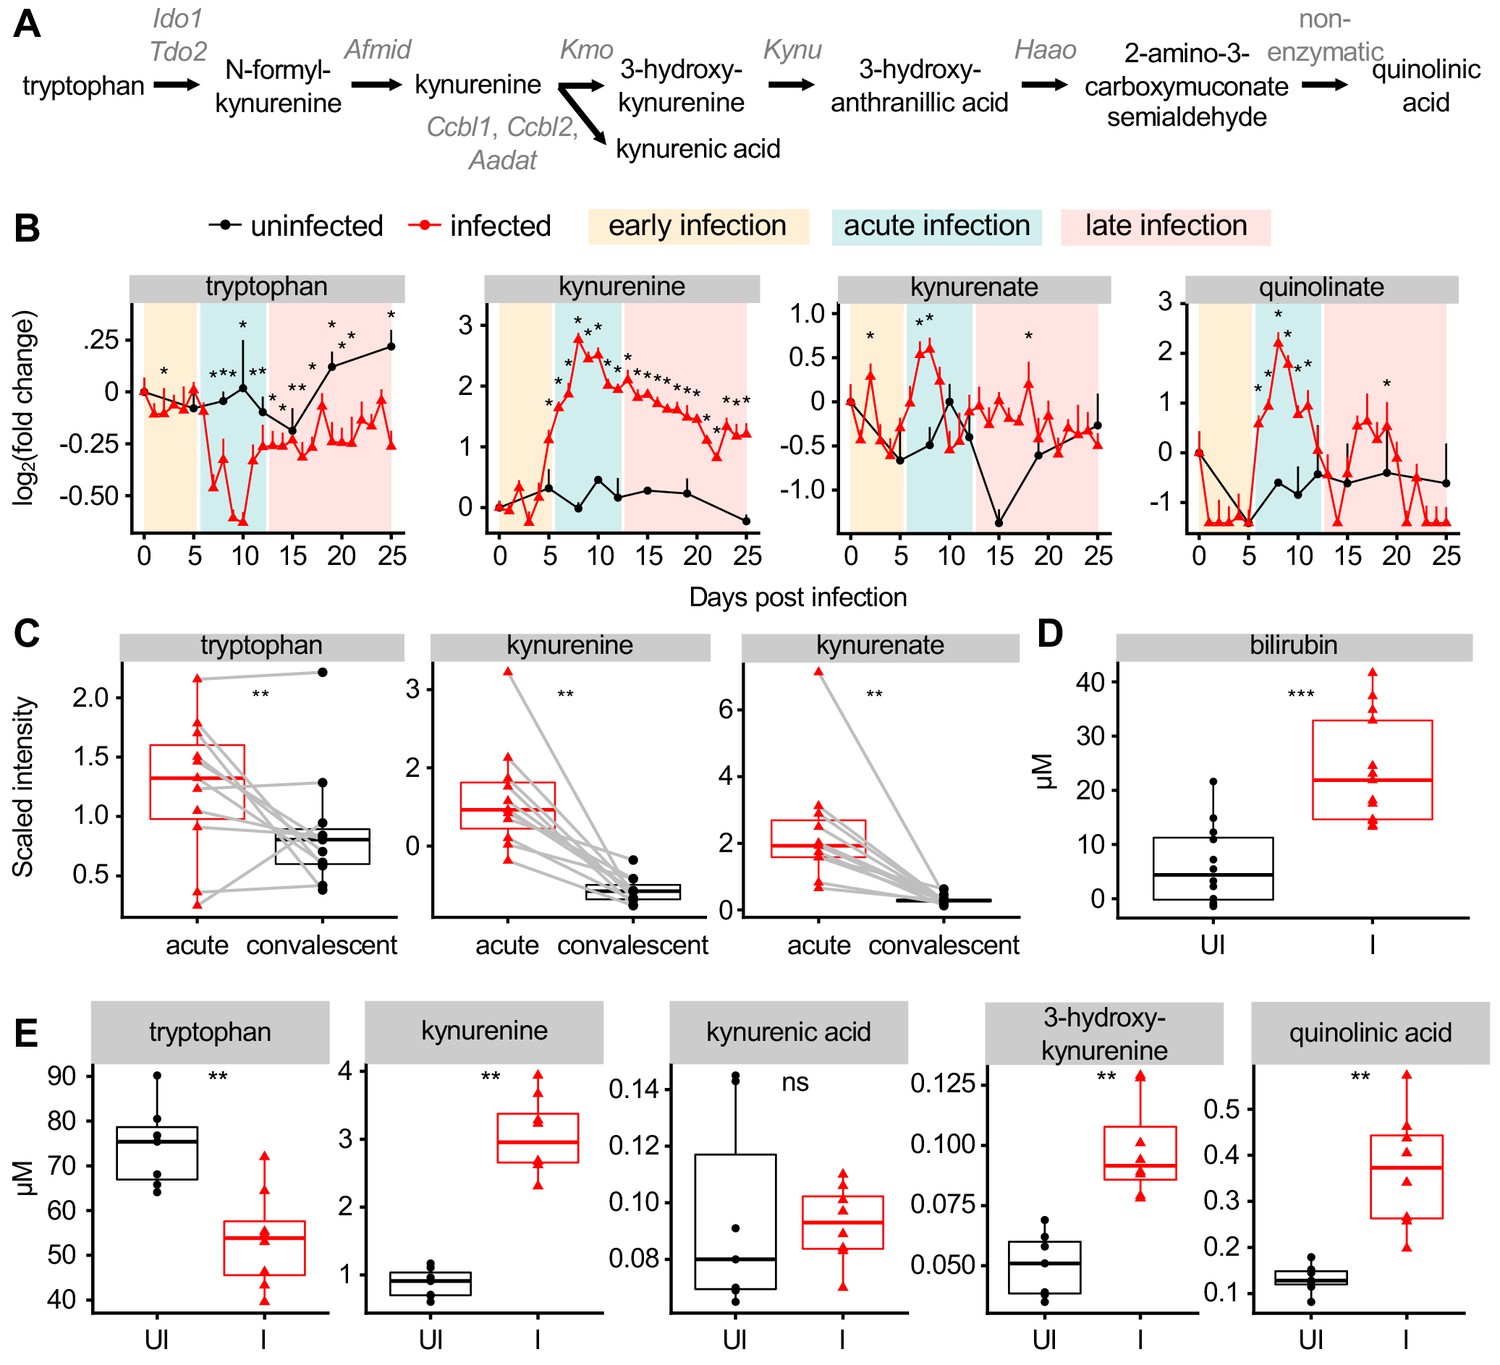
Malaria modulates AHR ligands in the plasma of mice and patients.
(A) Schematic of metabolites and genes of the kynurenine pathway. (B) Fold change of scaled intensity of kynurenine pathway compounds during Pc infection, relative to day 0 (mean + SEM). p-Values were determined by comparing each infected time point to all uninfected values using two-way ANOVA with FDR correction (n = 5 mice on 0 DPI, five infected mice each day, and two uninfected mice each day). *p<0.05. (C) Scaled intensity of kynurenine pathway compounds in pediatric cerebral malaria patients (n = 11 patients per condition). (D) Quantification of bilirubin (n = 12–13 mice per condition) and (E) kynurenine pathway metabolites (n = 5–6 mice per condition) at 9 days post Pc infection. p-Values were determined in C-E using a Wilcox test. *p<0.05, **p<0.01, ***p<0.001, ****p<0.0001. These experiments were performed once.
-
Figure 2—source data 1
Source data for Figure 2.
- https://cdn.elifesciences.org/articles/60165/elife-60165-fig2-data1-v1.xlsx
Figure 2—figure supplement 1
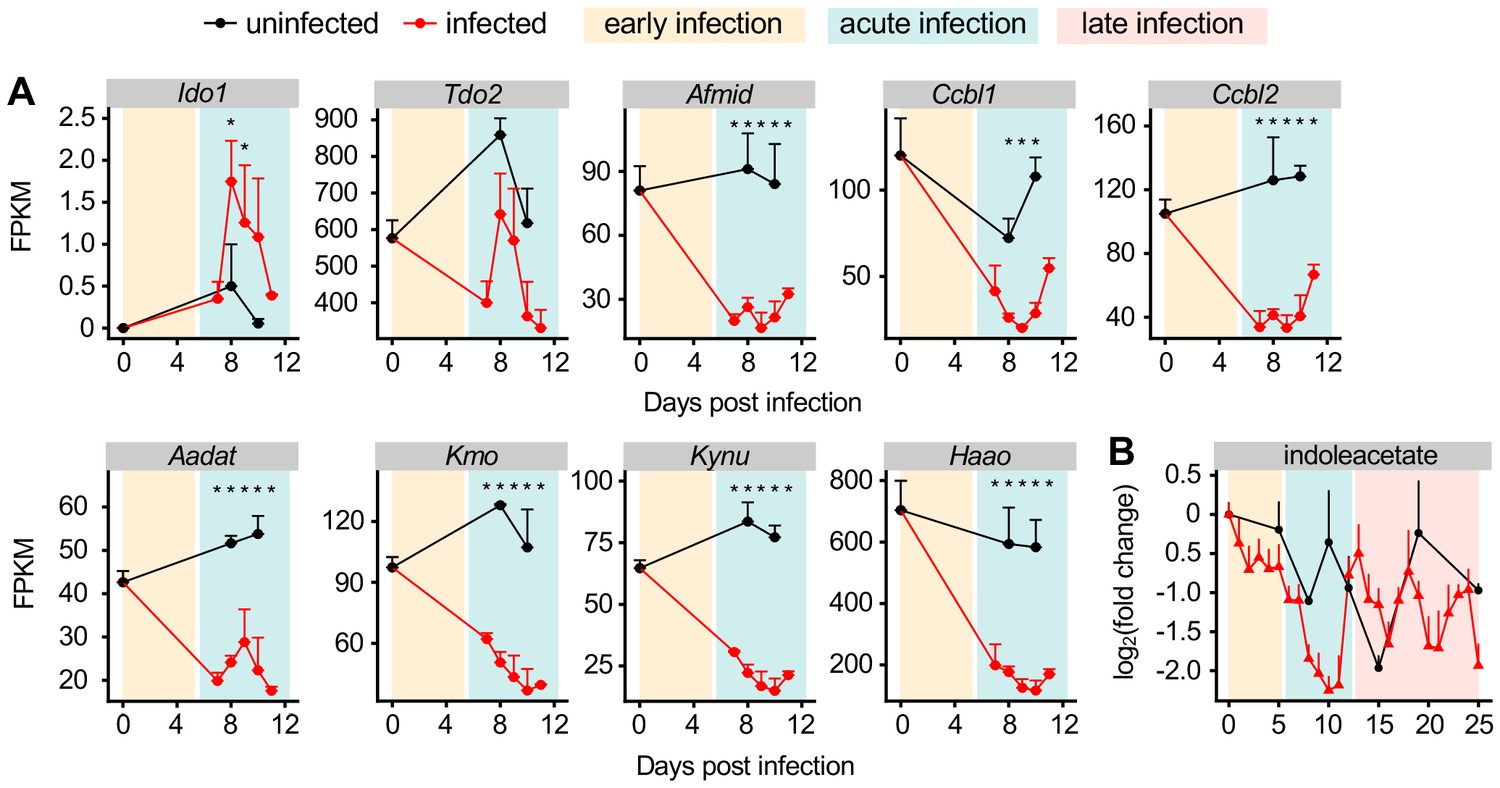
Production of AHR ligands during malaria.
(A) Expression of kynurenine pathway genes in livers of Pc-infected mice (n = 2–5 mice per condition). (B) Scaled intensity of indoleacetate during Pc infection. p-Values were determined by comparing each infected time point to all uninfected values using two-way ANOVA with FDR correction n = 5 mice on 0 DPI, five infected mice each day, and (two uninfected mice each day). *p<0.05. Values are presented as mean + SEM. These experiments were performed once.
-
Figure 2—figure supplement 1—source data 1
Source data for Figure 2—figure supplement 1.
- https://cdn.elifesciences.org/articles/60165/elife-60165-fig2-figsupp1-data1-v1.xlsx
Figure 3 with 2 supplements
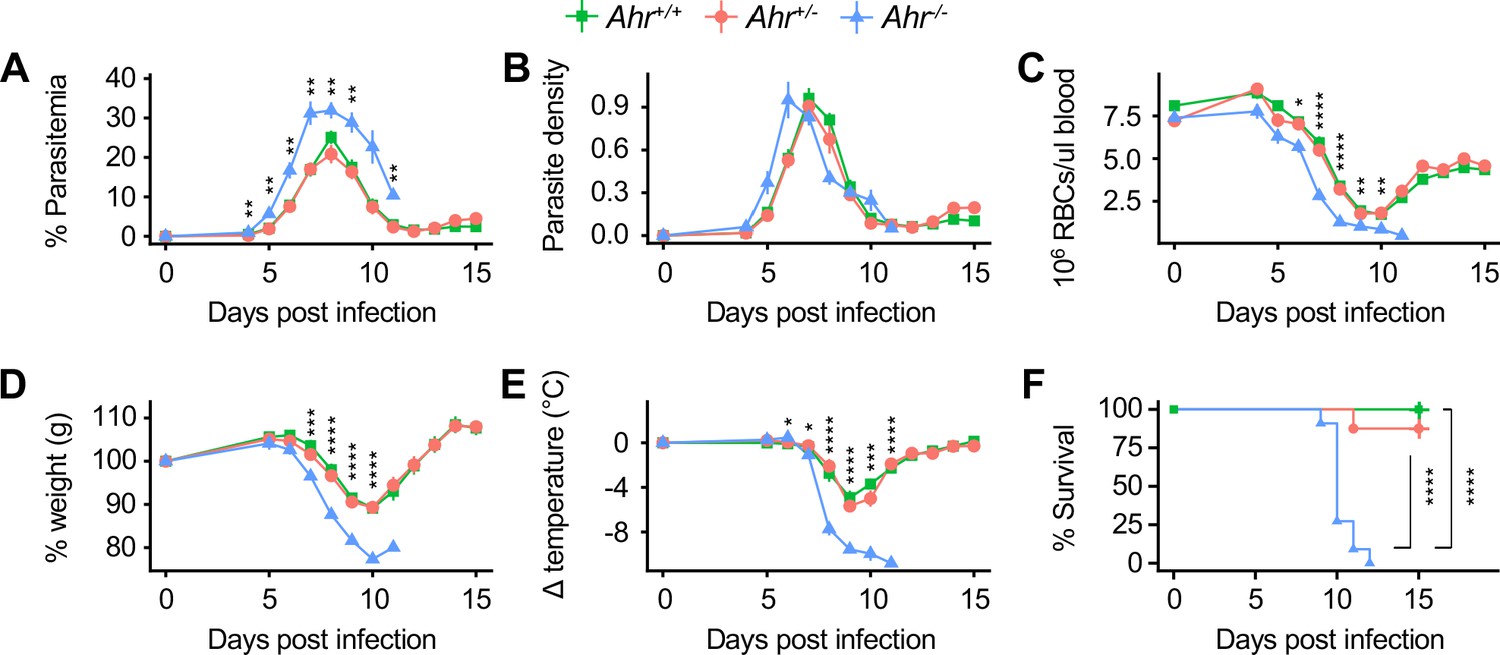
Ahr-/- mice are susceptible to malaria.
(A) Parasitemia, (B) parasite density, (C) RBCs/μl blood, change in (D) body weight and (E) temperature relative to day 0, and (F) survival of Pc-infected Ahr+/+, Ahr+/- and Ahr-/- mice (n = 10, 8, and 11, respectively). p-Values in A-E were determined using two-way ANOVA with FDR correction comparing Ahr+/- and Ahr-/- mice; values are mean ± SEM. p-Values in F were determined using a log-rank test. *p<0.05, **p<0.01, ***p<0.001, ****p<0.0001. Data were combined from three independent experiments.
-
Figure 3—source data 1
Source data for Figure 3.
- https://cdn.elifesciences.org/articles/60165/elife-60165-fig3-data1-v1.xlsx
Figure 3—figure supplement 1

MaleAhr-/-mice are susceptible to malaria.
(A) Parasitemia, (B) parasite density, and (C) survival of male Pc-infected Ahr+/+, Ahr+/-, and Ahr-/- mice (n = 7, 23, and 9, respectively). p-Values in A, and B were determined using two-way ANOVA with FDR correction; values are mean ± SEM. p-Values in C were determined using a log-rank test. *p<0.05, **p<0.01, ***p<0.001, ****p<0.0001. Data were combined from three independent experiments.
-
Figure 3—figure supplement 1—source data 1
Source data for Figure 3—figure supplement 1.
- https://cdn.elifesciences.org/articles/60165/elife-60165-fig3-figsupp1-data1-v1.xlsx
Figure 3—figure supplement 2
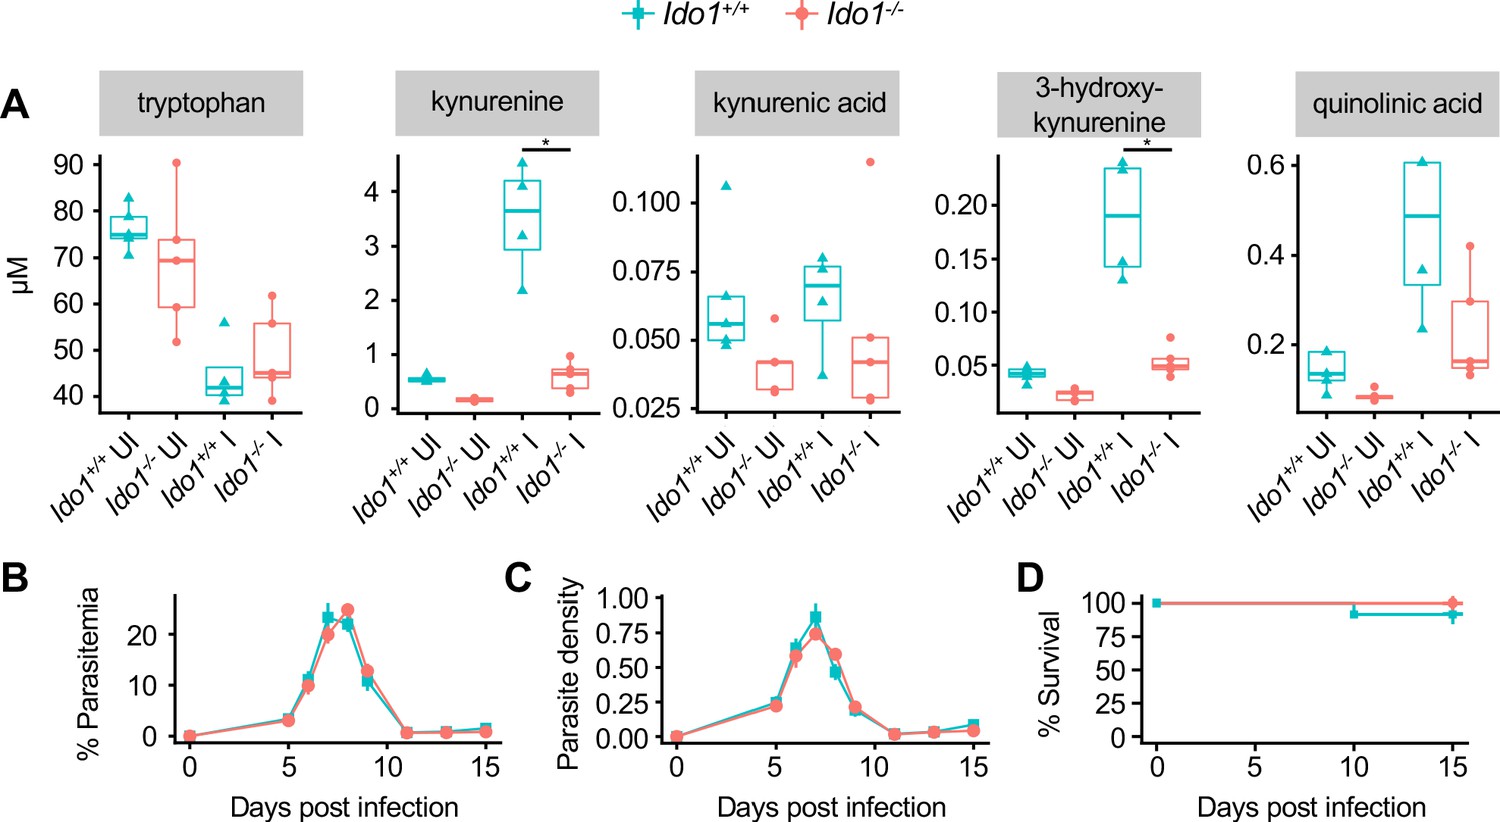
Ido1-/-mice are not susceptible to malaria.
(A) Quantification of kynurenine pathway metabolites in Pc- or mock-infected Ido1+/+ and Ido1-/- mice on 9 DPI (n = 5 per condition). (B) Parasitemia, (C) parasite density, and (D) survival of Pc-infected Ido1+/+ and Ido1-/- mice (n = 12–13 per condition). p-Values in A, B, and C were determined using two-way ANOVA with FDR correction; values are mean ± SEM. p-Values in D were determined using a log-rank test. *p<0.05. Data are representative of two independent experiments.
-
Figure 3—figure supplement 2—source data 1
Source data for Figure 3—figure supplement 2.
- https://cdn.elifesciences.org/articles/60165/elife-60165-fig3-figsupp2-data1-v1.xlsx
Figure 4 with 3 supplements
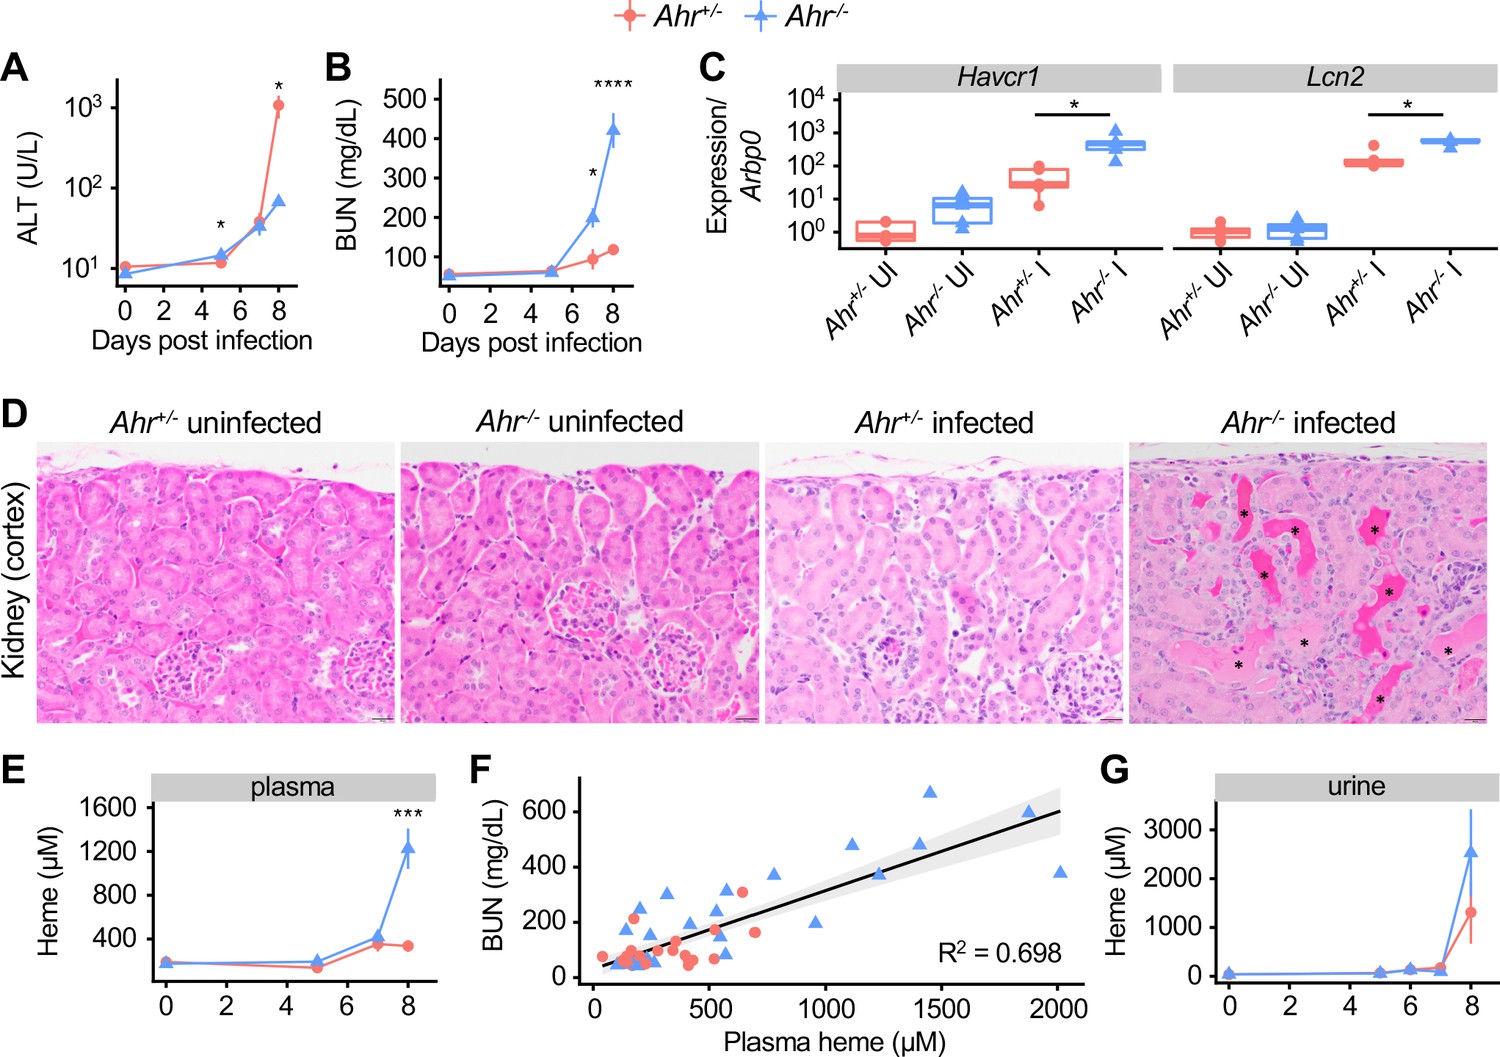
Acute kidney injury and inappropriate heme regulation in Ahr-/- mice during malaria.
(A) ALT and (B) BUN in plasma of Ahr+/- and Ahr-/- mice during infection (n = 3–9 per group). (C) Gene expression in kidneys from Ahr+/- and Ahr-/- mice on 8 DPI (normalized to Arbp0 using the ddCT method, n = 5 per condition). (D) Representative images of H and E-stained kidney tissue from Ahr+/- and Ahr-/- mice (magnification: 40x, scale bar: 20 μm). Black asterisks indicate dilated renal tubules with eosinophilic proteinaceous fluid. (E) Total heme in plasma of Pc-infected Ahr+/- and Ahr-/- mice (n = 3–9 per group). (F) Correlation of heme and BUN from individual mice (also plotted in B and E) and fit with a linear model. (G) Total heme in urine of Pc-infected Ahr+/- and Ahr-/- mice (n = 3–8 per group). p-Values in A, B, E, and G were determined using two-way ANOVA with FDR correction; values are mean ± SEM. p-Values in C were determined using a Wilcox test. *p<0.05, **p<0.01, ***p<0.001, ****p<0.0001. Each timepoint was collected in one to two independent experiments.
-
Figure 4—source data 1
Source data for Figure 4.
- https://cdn.elifesciences.org/articles/60165/elife-60165-fig4-data1-v1.xlsx
Figure 4—figure supplement 1

Representative images of H and E-stained tissue showing (A) liver, (B) spleen, and (C) lung, and (D) kidney arcuate vein from Ahr+/- and Ahr-/- mice (magnification: 40x).
Black chevrons in A indicate margination of leukocytes along the endothelial lining. The black dotted line in A delineates an area of parenchymal necrosis. Data are representative of two independent experiments.
Figure 4—figure supplement 2

Heme metabolism appears largely normal inAhr-/-mice during malaria.
(A) Msp1 expression in perfused kidneys from Ahr+/- and Ahr-/- mice on 8 DPI (normalized to Hmbs using the ddCT method, n = 6 per group). (B) Representative images of Perls Prussian blue-stained kidney cortex from Pc-infected Ahr+/- and Ahr-/- mice on 8 DPI. The blue signal (arrows) indicates accumulation of iron. (C) Western blot showing levels of heme metabolism genes in liver and kidney tissue from Pc-infected Ahr+/- and Ahr-/- mice on 8 DPI. (D) qRT-PCR analysis of heme metabolism genes in liver tissue from Pc-infected Ahr+/- and Ahr-/- mice on 8 DPI (n = 3–5 per condition). p-Values in A and D were determined using a Wilcox test. *p<0.05. These experiments were performed once.
-
Figure 4—figure supplement 2—source data 1
Source data for Figure 4—figure supplement 2.
- https://cdn.elifesciences.org/articles/60165/elife-60165-fig4-figsupp2-data1-v1.xlsx
Figure 4—figure supplement 3
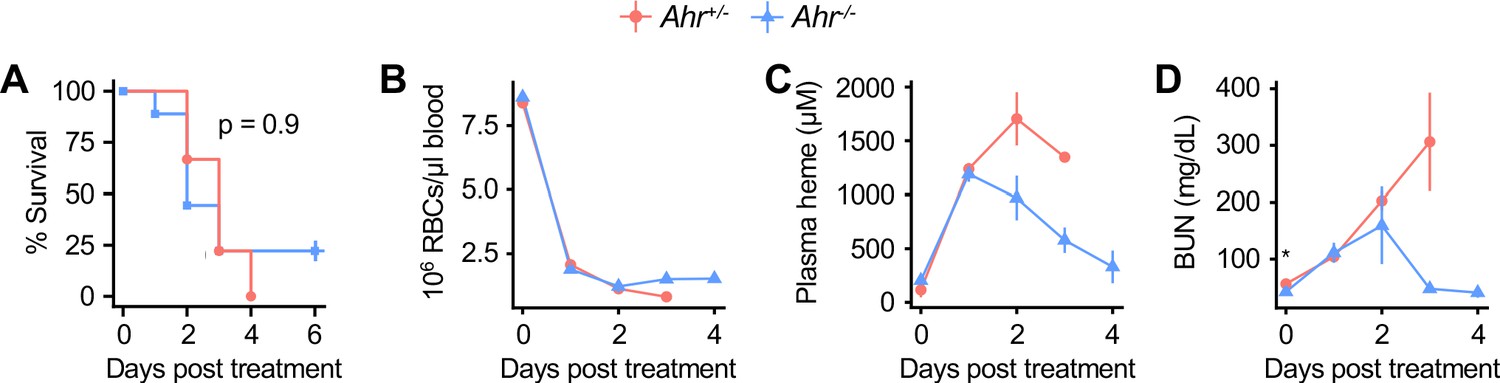
Control andAhr-/-mice are equally susceptible to phenylhydrazine-induced heme overload.
(A) Survival, (B) RBCs/μl blood, (C) plasma heme, and (D) BUN in phenylhydrazine-treated Ahr+/- and Ahr-/- mice (n = 9 per genotype). p-Value in A was calculated using a log-rank test. p-Values in B-D were determined using two-way ANOVA with FDR correction; values are mean ± SEM. *p<0.05. Data are representative of two independent experiments.
-
Figure 4—figure supplement 3—source data 1
Source data for Figure 4—figure supplement 3.
- https://cdn.elifesciences.org/articles/60165/elife-60165-fig4-figsupp3-data1-v1.xlsx
Figure 5 with 3 supplements
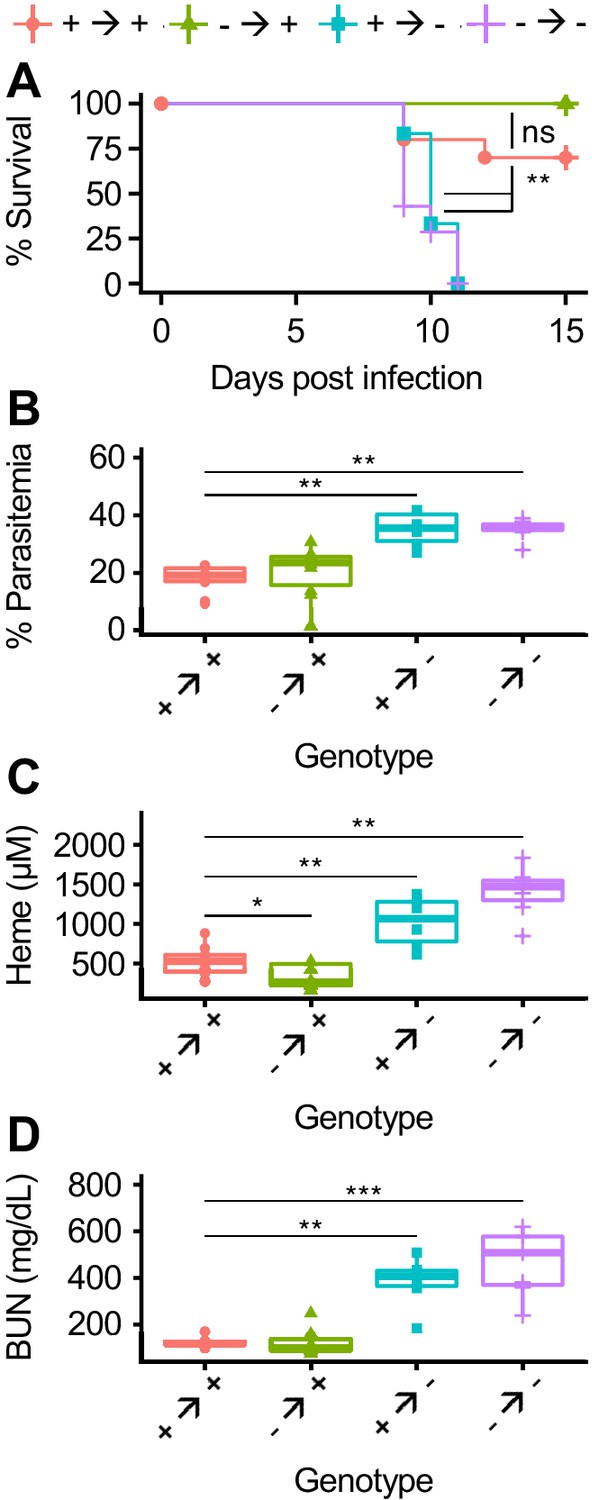
AHR is required during Pc infection in radioresistant cells.
(A) Survival, (B) parasitemia, and (C) total heme (8 DPI), and (D) BUN (8 DPI) in Pc-infected bone marrow chimeric mice (n = 6–12 per condition). p-Values in A were determined using a log-rank test. p-Values in B-D were determined using a Wilcox test. *p<0.05, **p<0.01, ***p<0.001, ****p<0.0001. Data are representative of two independent experiments.
-
Figure 5—source data 1
Source data for Figure 5.
- https://cdn.elifesciences.org/articles/60165/elife-60165-fig5-data1-v1.xlsx
Figure 5—figure supplement 1
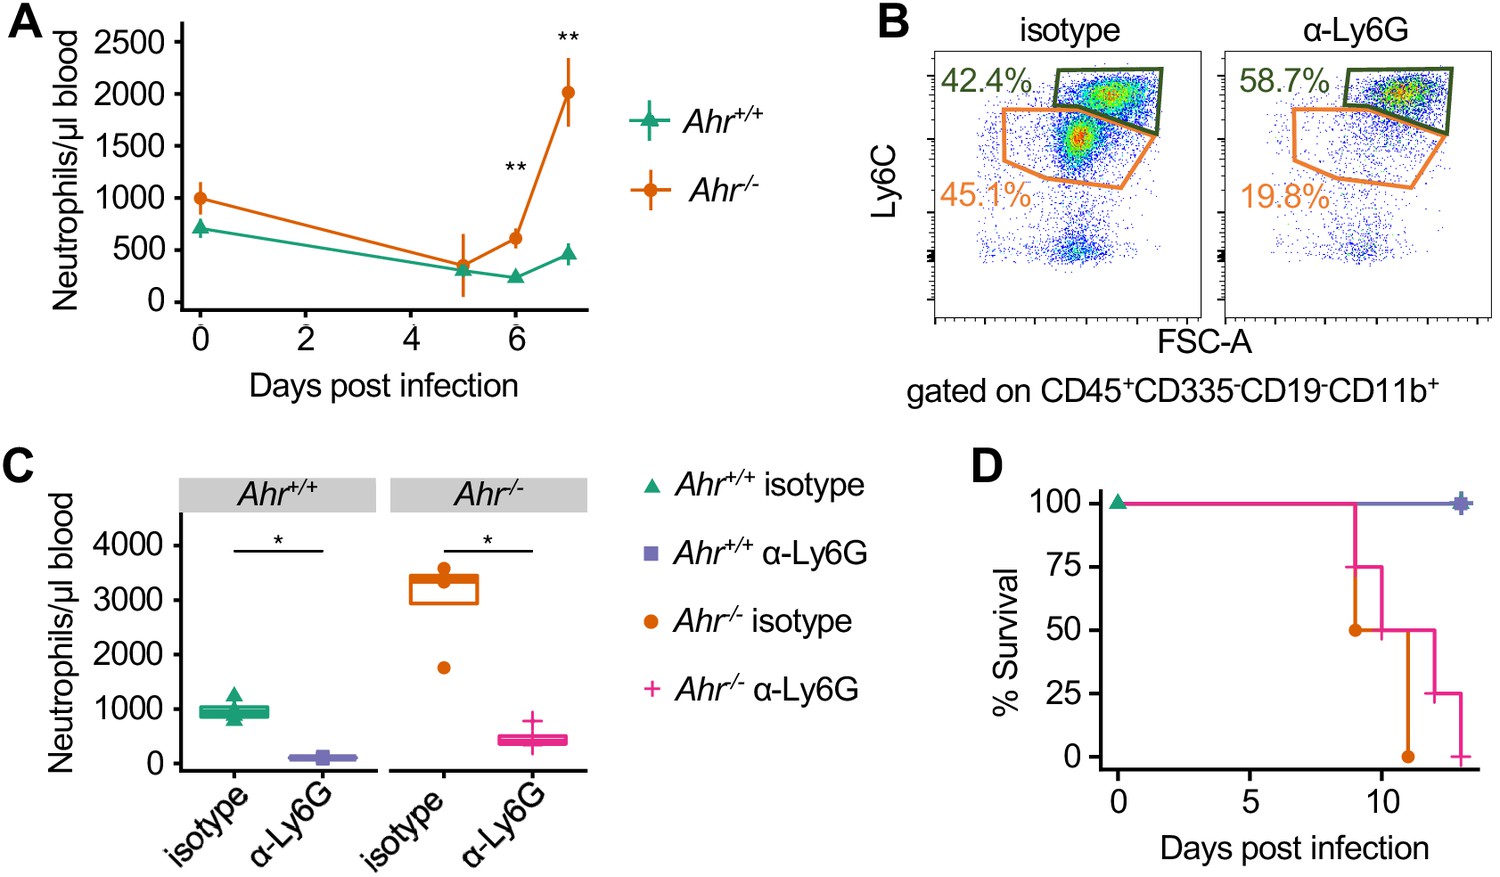
Neutrophilia inAhr-/-mice during malaria does not cause increased susceptibility.
(A) CD11bhiLy6CintLy6G+ neutrophils/μl blood in Pc- infected Ahr+/+ and Ahr-/- mice (n = 6 per genotype). (B) Representative FACS plots of mice at 7 DPI with indicated treatment. (C) Neutrophils/μl blood on 7 DPI in Ahr+/+ and Ahr-/- mice after treatment with either Ly6G depleting antibody or isotype control (n = 4–5 per genotype). (D) Survival of Pc-infected Ahr+/+ and Ahr-/- mice after treatment with either anti-Ly6G depleting antibody or isotype control (n = 4–5 per genotype). These experiments were performed once.
-
Figure 5—figure supplement 1—source data 1
Source data for Figure 5—figure supplement 1.
- https://cdn.elifesciences.org/articles/60165/elife-60165-fig5-figsupp1-data1-v1.xlsx
Figure 5—figure supplement 2
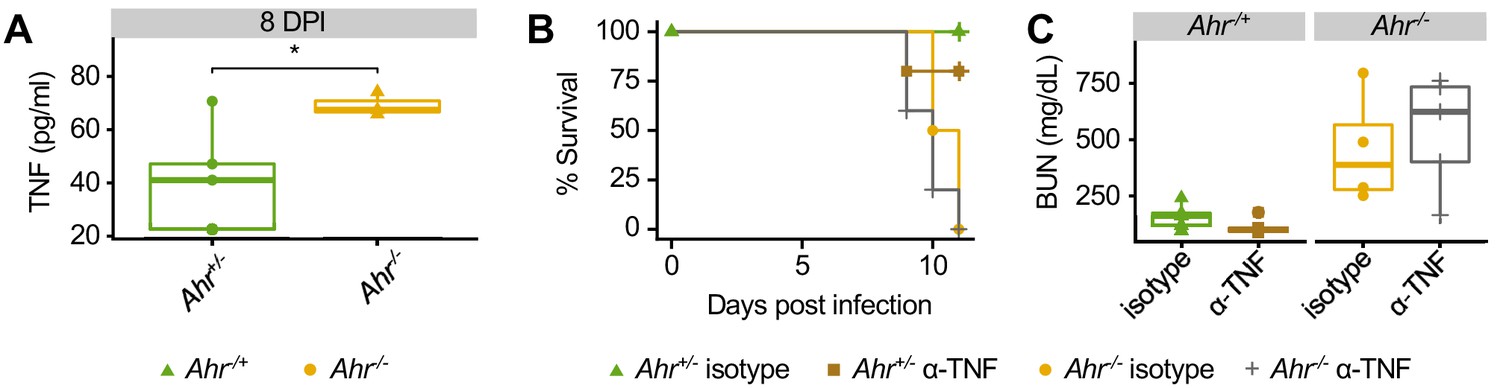
Increased TNF production inAhr-/-mice during malaria does not cause increased susceptibility.
(A) TNF concentration in plasma of Pc-infected Ahr+/+ (n = 5) and Ahr-/- (n = 3) mice at 8 DPI. (B) Survival and (C) BUN levels in Pc-infected Ahr+/+ and Ahr-/- mice (n = 4–5 per condition) after treatment with either anti-TNF neutralizing antibody or isotype control. These experiments were performed once.
-
Figure 5—figure supplement 2—source data 1
Source data for Figure 5—figure supplement 2.
- https://cdn.elifesciences.org/articles/60165/elife-60165-fig5-figsupp2-data1-v1.xlsx
Figure 5—figure supplement 3

Efficiency of bone marrow transplantation measured by flow cytometry on peripheral blood 2 months after transplantation (n = 6–12 per condition).
Data are representative of two independent experiments.
-
Figure 5—figure supplement 3—source data 1
Source data for Figure 5—figure supplement 3.
- https://cdn.elifesciences.org/articles/60165/elife-60165-fig5-figsupp3-data1-v1.xlsx
Figure 6
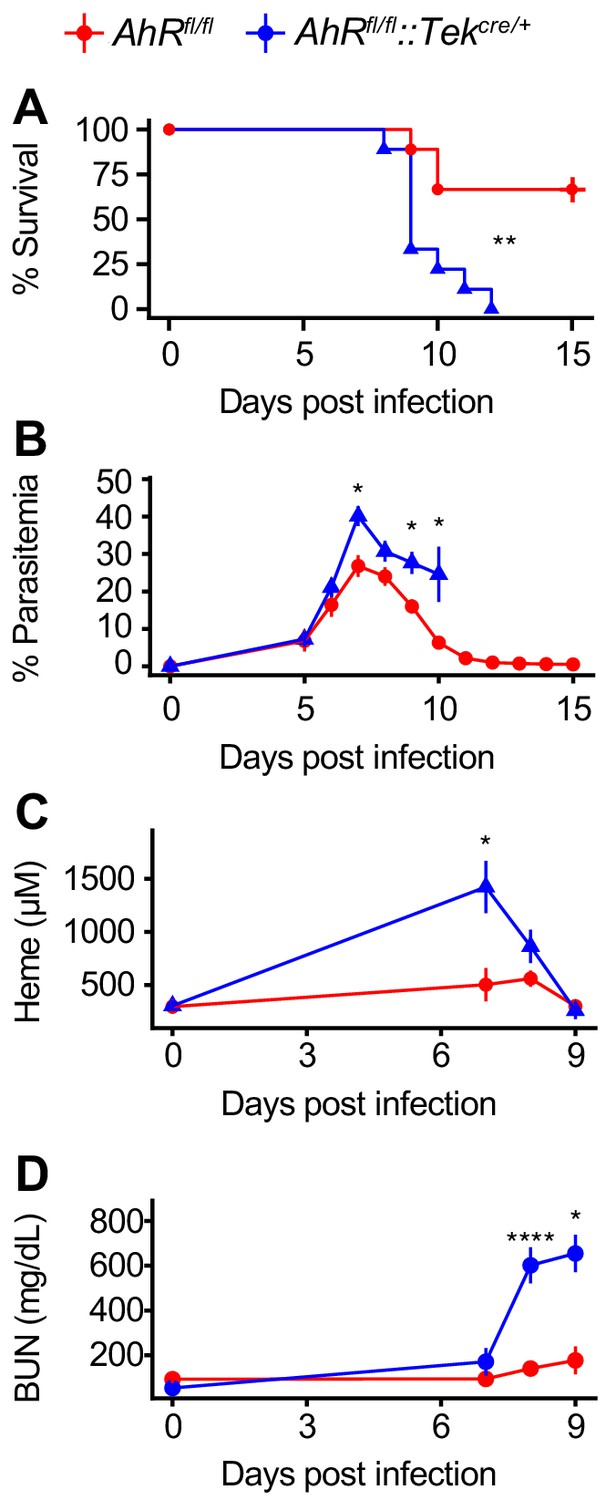
AHR is required during Pc infection in Tek-expressing cells.
(A) Survival, (B) parasitemia, (C) plasma heme, and (D) BUN in Pc-infected Ahrfl/fl and Ahrfl/fl::Tekcre/+ mice (n = 9 per genotype). p-Values in A were determined using a log-rank test. p-Values in B-D were determined using a two-way ANOVA with FDR correction. *p<0.05, **p<0.01, ***p<0.001, ****p<0.0001. Data are representative of two independent experiments.
-
Figure 6—source data 1
Source data for Figure 6.
- https://cdn.elifesciences.org/articles/60165/elife-60165-fig6-data1-v1.xlsx
Tables
Key resources table
| Reagent type (species) or resource | Designation | Source or reference | Identifiers | Additional information |
|---|---|---|---|---|
| Antibody | TruStain FcX Antibody | Biolegend | BioLegend Cat# 101319, RRID:AB_1574973 | |
| Antibody | Mouse monoclonal CD71 PerCP/Cy5.5 (clone RI7217) | Biolegend | BioLegend Cat# 113815, RRID:AB_2565481 | |
| Antibody | Mouse monoclonal TER-119 PE/Cy7 (clone TER-119) | Biolegend | BioLegend Cat# 116221, RRID:AB_2137789 | |
| Antibody | Mouse monoclonal TCR γ/δ PE (clone UC7-13D5) | Biolegend | BioLegend Cat# 107507, RRID:AB_345265 | |
| Antibody | Mouse monoclonal CD19 BV 785 (clone 6D5) | Biolegend | BioLegend Cat# 115543, RRID:AB_11218994 | |
| Antibody | Mouse monoclonal CD3 BV 650 (clone 17A2) | Biolegend | BioLegend Cat# 100229, RRID:AB_11204249 | |
| Antibody | Mouse monoclonal CD8a BV510 (clone 53–6.7) | Biolegend | BioLegend Cat# 100751, RRID:AB_2561389 | |
| Antibody | Mouse monoclonal Ly-6G BV 421 (clone 1A8) | Biolegend | BioLegend Cat# 127628, RRID:AB_2562567 | |
| Antibody | Mouse monoclonal CD4 Alexa Fluor 700 (clone RM4-5) | Biolegend | BioLegend Cat# 100536, RRID:AB_493701 | |
| Antibody | Mouse monoclonal Ly-6C Alexa Fluor 647 (clone HK1.4) | Biolegend | BioLegend Cat# 128010, RRID:AB_1236550 | |
| Antibody | Mouse monoclonal CD335 FITC (clone 29A1.4) | Biolegend | BioLegend Cat# 137606, RRID:AB_2298210 | |
| Antibody | Mouse monoclonal CD11b APC-eFluor 780 (clone M1/70) | Thermo Fisher Scientific | Thermo Fisher Scientific Cat# 47-0112-82, RRID:AB_1603193 | |
| Antibody | Mouse monoclonal CD41 BUV395 (clone MWReg30) | BD Biosciences | BD Biosciences Cat# 565980, RRID:AB_2739432 | |
| Antibody | Human monoclonal Heme Oxygenase 1 (clone EP1391Y) | Abcam | Abcam Cat# ab52947, RRID:AB_880536 | (1:2000 dilution) |
| Antibody | Mouse monoclonal Ferritin Heavy Chain (clone EPR18878) | Abcam | Abcam Cat# ab183781 | (1:2000 dilution) |
| Antibody | Mouse monoclonal DMT1 antibody | Abcam | Abcam Cat# ab55735, RRID:AB_2239227 | (1:400 dilution) |
| Antibody | Mouse polyclonal HCP1/PCFT antibody | Abcam | Abcam Cat# ab25134, RRID:AB_2270597 | (1:1000 dilution) |
| Antibody | Mouse monoclonal β-Actin (clone AC-15) | Sigma Aldrich | Sigma-Aldrich Cat# A1978, RRID:AB_476692 | (1:2000 dilution) |
| Antibody | Rabbit polyclonal IgG HRP | GE Healthcare | GE Healthcare Cat# GENA934, RRID:AB_2722659 | (1:10,000 dilution) |
| Antibody | Mouse polyclonal IgG HRP | Bio-Rad | Bio-Rad Cat# 170–6516, RRID:AB_11125547 | (1:3000 dilution) |
| Antibody | Mouse polyclonal CD45.2 PerCP-Cy5.5 (clone 104) | Thermo Fisher Scientific | Thermo Fisher Scientific Cat# 45-0454-82, RRID:AB_953590 | |
| Antibody | Mouse monoclonal NK-1.1 FITC (clone PK136) | Biolegend | BioLegend Cat# 108705, RRID:AB_313392 | |
| Antibody | Mouse monoclonal CD11c PE-Cy7 (clone N418) | Thermo Fisher Scientific | Thermo Fisher Scientific Cat# 25-0114-82, RRID:AB_469590 | |
| Antibody | Mouse monoclonal CD45.1 PE (clone A20) | Biolegend | BioLegend Cat# 110707, RRID:AB_313496 | |
| Antibody | Mouse monoclonal Ly6G (clone 1A8) | Bio X Cell | Bio X Cell Cat# BE0075-1, RRID:AB_1107721 | |
| Antibody | Rat monoclonal IgG2a, (clone 2A3) | Bio X Cell | Bio X Cell Cat# BE0089, RRID:AB_1107769 | |
| Antibody | Mouse monoclonal TNFα (clone XT3.11) | Bio X Cell | Bio X Cell Cat# BE0058, RRID:AB_1107764 | |
| Antibody | Rat monoclonal IgG1 (clone HRPN) | Bio X Cell | Bio X Cell Cat# BE0088, RRID:AB_1107775 | |
| Chemical compound, drug | Formic acid, reagent grade,≥95% | Sigma Aldrich | Cat. F0507-100ML | |
| Chemical compound, drug | Hemin | Sigma Aldrich | Cat. H9039 | |
| Chemical compound, drug | Phenylhydrazine, 97% | Sigma Aldrich | Cat. P26252-100G | |
| Chemical compound, drug | L-Tryptophan | Sigma Aldrich | Cat. T0254 | |
| Chemical compound, drug | Tryptophan-d5 | Medical Isotopes | Cat. D34384 | |
| Chemical compound, drug | L-Kynurenine | Sigma Aldrich | Cat. K8625 | |
| Chemical compound, drug | L-Kynurenine-d4 | Medical Isotopes | Cat. D37563 | |
| Chemical compound, drug | 3-Hydroxy-DL-kynurenine | Sigma Aldrich | Cat. H1771 | |
| Chemical compound, drug | 3-Hydroxy-DL-kynurenine-d3 | Medical Isotopes | Cat. D34384 | |
| Chemical compound, drug | Kynurenic acid | Sigma Aldrich | Cat. 67667 | |
| Chemical compound, drug | Kynurenic acid-3,5,6,7,8-d5 | Sigma Aldrich | Cat. 793477 | |
| Chemical compound, drug | 2,3-Pyridinedicarboxylic acid | Sigma Aldrich | Cat. P63204 | |
| Chemical compound, drug | Quinolinic Acid-d3 | Medical Isotopes | Cat. D18880 | |
| Commercial assay or kit | Bilirubin Assay Kit | Sigma Aldrich | Cat. MAK126-1KT | |
| Commercial assay or kit | ALT Activity Assay | Sigma Aldrich | Cat. MAK052-1KT | |
| Commercial assay or kit | Bioassay Systems Urea Assay Kit | Fisher Scientific | Cat. 50-107-8333 | |
| Commercial assay or kit | TruSeq RNA Library Prep Kit v2 | Illumina | Cat. RS-122–2001 | |
| Commercial assay or kit | TNF alpha Mouse ELISA Kit | Thermo Fisher Scientific | Thermo Fisher Scientific Cat# BMS607/3, RRID:AB_2575663 | |
| Genetic reagent (Mus musculus) | Ahr-/- mice | Taconic | Cat. 9166, RRID:IMSR_TAC:9166 | |
| Genetic reagent (M. musculus) | Ahr+/+ mice | Taconic | Cat. B6, RRID:IMSR_TAC:b6 | |
| Genetic reagent (M. musculus) | Ido1-/- mice | Jax | Cat. 005867, RRID:IMSR_JAX:005867 | |
| Genetic reagent (M. musculus) | C57BL/6J mice | Jax | Cat. 000664, RRID:IMSR_JAX:000664 | |
| Genetic reagent (M. musculus) | AhRfl/fl mice | Jax | Cat. 006203, RRID:IMSR_JAX:006203 | |
| Genetic reagent (M. musculus) | Tekcre/+ mice | Jax | Cat. 004128, RRID:IMSR_JAX:004128 | |
| Genetic reagent (M. musculus) | CD45.1 mice | Taconic | Cat. 4007, RRID:IMSR_TAC:4007 | |
| Genetic reagent (M. musculus) | C57BL/6NCrl mice | Charles River | Cat. 027, RRID:IMSR_CRL:027 | |
| Genetic reagent (Plasmodium chabaudi) | Plasmodium chabaudi AJ | Malaria Research and Reference Reagent Resource Center | Cat. MRA-756 | |
| Commercial assay or kit | Bilirubin Assay Kit | Sigma Aldrich | Cat. MAK126-1KT | |
| Commercial assay or kit | RNeasy Mini kit | Qiagen | Cat. 74104 | |
| Commercial assay or kit | Rnase-Free Dnase | Qiagen | Cat. 79256 | |
| Commercial assay or kit | SuperScript III First-Strand synthesis system | Fisher Scientific | Cat. 18-080-051 | |
| Commercial assay or kit | FastStart Universal SYBR Green Master (Rox) | Sigma Aldrich | Cat. 04913850001 | |
| Software, algorithm | FlowJo 10.0.8r1 | Tree Star | https://www.flowjo.com/solutions/flowjo | |
| Software, algorithm | R v3.4.0 | R | https://www.r-project.org/ | |
| Software, algorithm | ggplot2 v3.1.0 | ggplot2 | https://github.com/tidyverse/ggplot2 |
Table 1
qRT-PCR primers used in this study.
| Gene | Forward primer | Reverse primer | Source |
|---|---|---|---|
| Hp | GCTATGTGGAGCACTTGGTTC | CACCCATTGCTTCTCGTCGTT | PrimerBank 8850219a1 |
| Hpx | AGCAGTGGCGCTAAATATCCT | CCATTTTCAACTTCGGCAACTC | PrimerBank 23956086a1 |
| Hrg1 | GACGGTGGTCTACCGACAAC | TCCTCCAGTAATCCTGCATGTA | PrimerBank 13385856a1 |
| Hmbs | AAAGTTCCCCAACCTGGAAT | CCAGGACAATGGCACTGAAT | |
| Hmox1 | AAGGAGGTACACATCCAAGCCGAG | GATATGGTACAAGGAAGCCATCACCAG | Ramos et al., 2019 |
| Fth | CCATCAACCGCCAGATCAAC | GCCACATCATCTCGGTCAAA | Ramos et al., 2019 |
| Mfsd7b | TCTTCAGCCTTTACTCGCTGG | GAAGTCCTCGAACACGTTGCT | PrimerBank 124486924 c1 |
| Mfsd7c | GGAGAAAGCGATTAGAGAAGGC | CTGATGGCTGCATTTCACAGT | PrimerBank 26340226a1 |
| Slc40a1 | TGCCTTAGTTGTCCTTTGGG | GTGGAGAGAGAGTGGCCAAG | Ramos et al., 2019 |
| Tfrc | GTTTCTGCCAGCCCCTTATTAT | GCAAGGAAAGGATATGCAGCA | PrimerBank 11596855a1 |
| Msp1 | ACTGAAGCAACAACACCAGC | GTTGTTGATGCACTTGCGGGTTC | Cheesman et al., 2006 |
| Havcr1 | TGGTTGCCTTCCGTGTCTCT | TCAGCTCGGGAATGCACAA | Kulkarni et al., 2014 |
| Lcn2 | TGGCCCTGAGTGTCATGTG | CTCTTGTAGCTCATAGATGGTGC | PrimerBank 1019908a1 |
| Arbp0 | CTTTGGGCATCACCACGAA | GCTGGCTCCCACCTTGTCT | Ramos et al., 2019 |
Additional files
-
Source data 1
Raw metabolomics data from Figure 1.
- https://cdn.elifesciences.org/articles/60165/elife-60165-data1-v1.xlsx
-
Transparent reporting form
- https://cdn.elifesciences.org/articles/60165/elife-60165-transrepform-v1.pdf
Download links
A two-part list of links to download the article, or parts of the article, in various formats.
Downloads (link to download the article as PDF)
Open citations (links to open the citations from this article in various online reference manager services)
Cite this article (links to download the citations from this article in formats compatible with various reference manager tools)
Metabolic profiling during malaria reveals the role of the aryl hydrocarbon receptor in regulating kidney injury
eLife 9:e60165.
https://doi.org/10.7554/eLife.60165


