The severity of microstrokes depends on local vascular topology and baseline perfusion
- Institute of Pharmacology and Toxicology, University of Zurich, Switzerland
- Institute of Fluid Dynamics, ETH Zurich, Switzerland
- Neuroscience Center Zurich, University and ETH Zurich, Switzerland
Figures
Figure 1 with 2 supplements
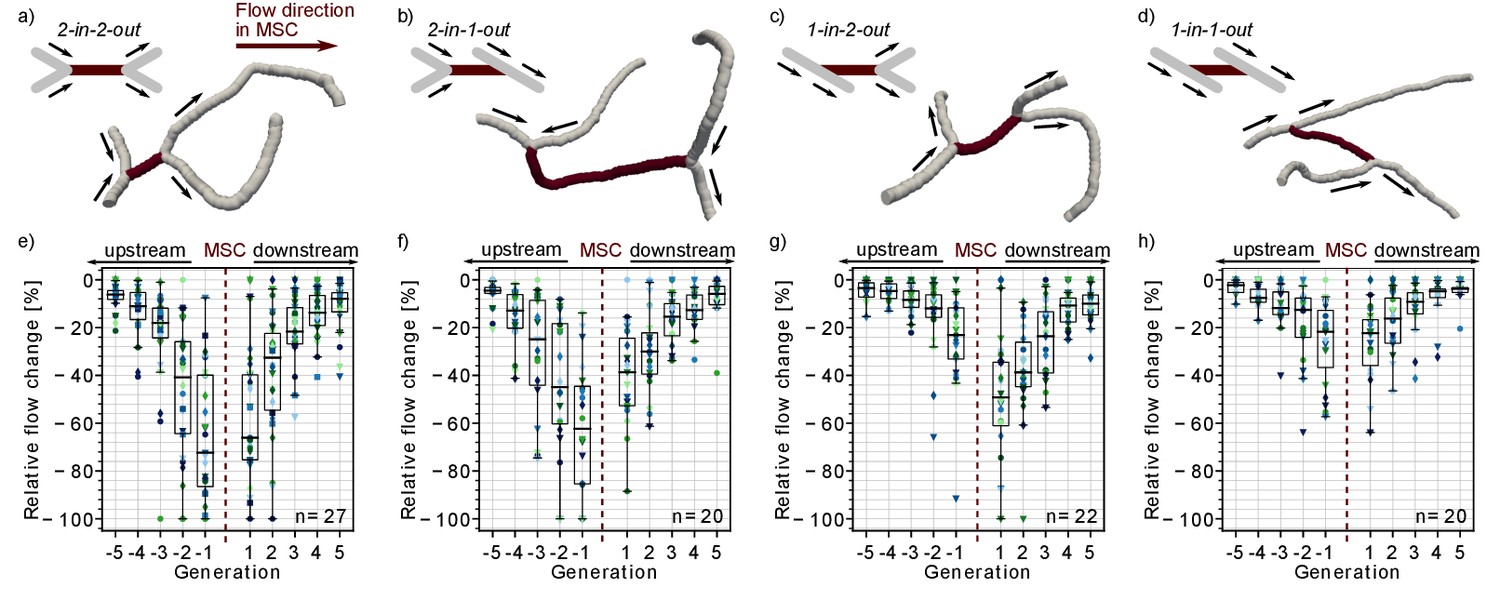
Impact of the local vascular topology on the severity of a microstroke.
(a-d) Illustration of the four possible topological configurations at a microstroke capillary (MSC). For each topological configuration, a schematic (upper left) and a realistic example (lower right) are provided. The MSC (dark) and its adjacent vessels (gray, generation −1 and 1) are depicted. The arrows show the flow direction. (e-h) Average relative change in flow rate for capillaries upstream and downstream of the MSC, which experienced a flow decrease. For each topological configuration, the flow field for ≥20 microstrokes has been computed (n: number of microstroke simulations). The average relative decrease per generation for each simulation is depicted by the color- and marker-coded symbols. The boxplots are based on the data for each generation. Statistically significant two-way interaction between MSC type and generation: upstream: F(7.8,220.42) = 7.73, p<0.001, downstream: F(7.2,203.96) = 2.24, p=0.03 (two-way mixed ANOVA). For further statistical details, see Materials and methods and Supplementary file 1c. The relative change for flow decreases and increases and the frequency of flow decreases per generation is shown in Figure 1—figure supplement 1.
Figure 1—figure supplement 1
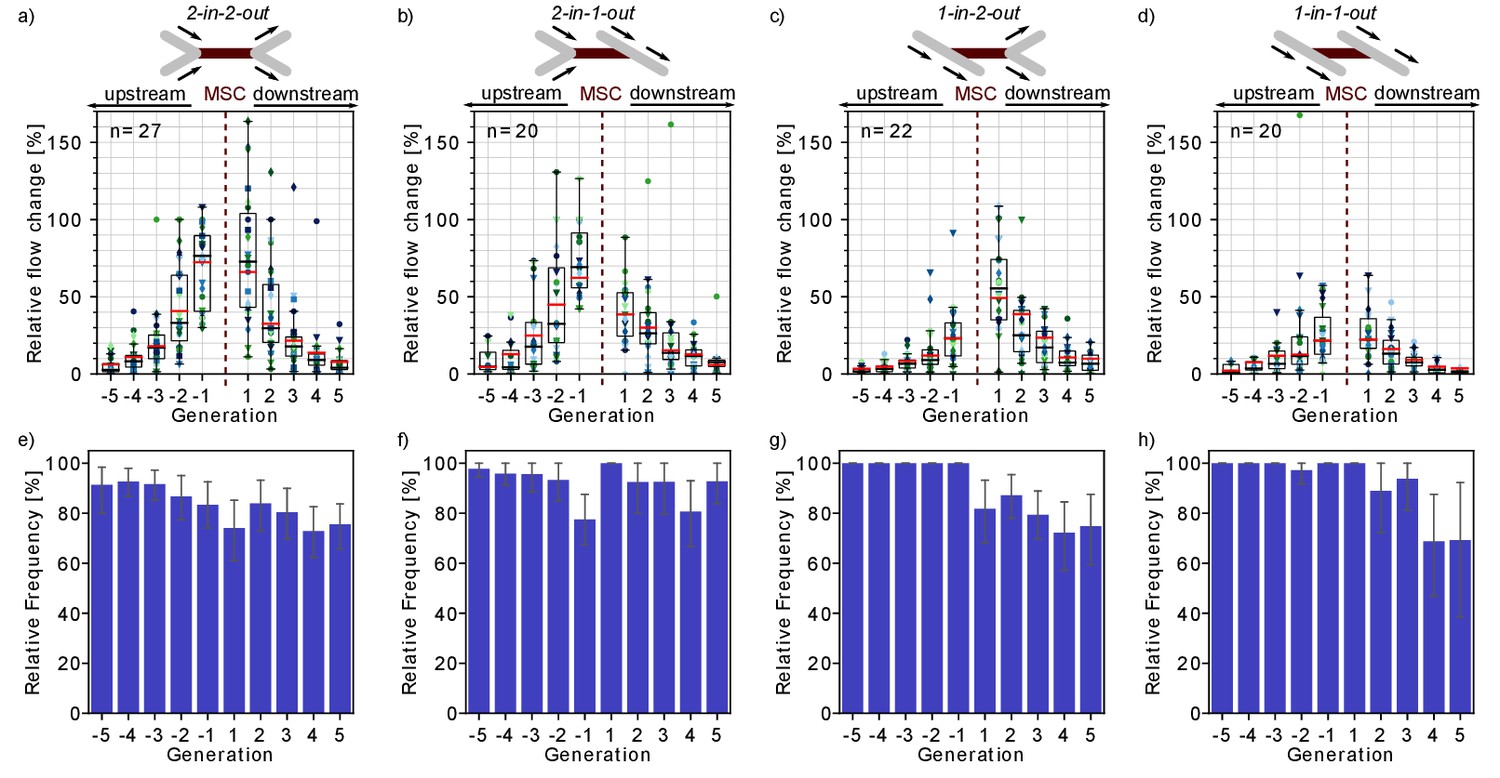
Absolute flow changes in response to occlusions of different MSC types and frequency of flow decreases.
(a–d) Average relative absolute change in flow rate for capillaries up- and downstream of the MSC. For each topological configuration the flow field for ≥20 microstrokes has been computed (n: number of microstroke simulations). The average relative change per generation for each simulation is depicted by the color- and marker-coded symbols. Note that the number of up- and downstream vessels per generation varies between MSCs. The boxplots are based on the data for each generation. The red line indicates the median relative change if only capillaries with flow decrease are considered (equivalent to Figure 1). (e–h) Frequency of vessels with a flow decrease for the different MSC types and different generations. The relative frequency is computed by dividing the number of capillaries with a flow decrease by the total number of capillaries per generation. The bars and error bars depict mean ± std for ≥20 microstroke simulations.
Figure 1—figure supplement 2
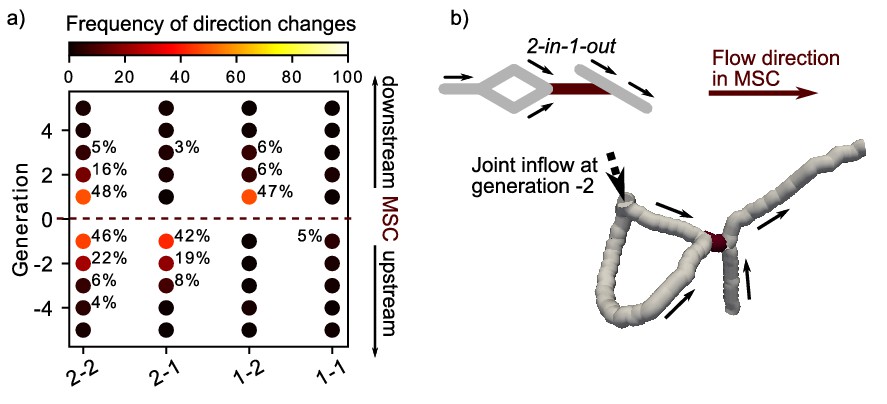
Flow direction changes for the four MSC types.
(a) Percentage of flow direction changes for the four possible topological configurations at a MSC (Figure 1a–d). Only percentage values > 2% are annotated. For each topological configuration, ≥20 microstroke simulations have been performed. The percentage is computed by identifying all vessels with a flow direction change for each generation across microstroke simulations and setting it into relation to the total number of vessel per generation. Abbreviations of the four MSC types: 2–2: 2-in-2-out, 2–1: 2-in-1-out, 1–2: 1-in-2-out, 1–1: 1-in-1-out. (b) Illustration of the specific vascular configuration for the 2-in-1-out MSC that leads to a cessation of flow in the generation −1 vessels. A schematic (upper left) and a realistic example (lower right) are provided. The MSC (dark) and its adjacent vessels (gray, generation −1 and 1) are depicted. The schematic also shows the joint inflow at generation −2.
Figure 2 with 5 supplements

Flow reduction in analysis boxes around the microstroke capillary (MSC).
(a) Schematic introducing how the volume factor is defined (Materials and methods). The MSC is highlighted in dark red. Inflow and outflow vessels of the analysis box are annotated with arrows. Vinit: initial analysis box volume. Δincr: distance by which the analysis box has been increased. (b–e) Relative inflow difference for an increasing box volume around the MSC for the four MSC types. (b) 2-in-2-out, (c) 2-in-1-out, (d) 1-in-2-out and (e) 1-in1-out. The initial box volume, that is volume factor = 1, is 0.2 nl. The relative inflow difference is computed by adding up the inflows across the borders of the box for the baseline and the stroke simulation (Materials and methods). There is a statistically significant two-way interaction between MSC type and volume factor: F(5.3,150.24) = 5.23, p<0.001 (two-way mixed ANOVA). For further statistical details, see Materials and methods and Supplementary file 1d. (f) Upper: Schematic to introduce the concept of vessels parallel to the MSC (Materials and methods). Lower: Realistic example of the edges in a box volume of 1 nl, that is volume factor = 5. US: upstream. DS: downstream. (g–i) Relative total flow difference for an increasing box volume around a 2-in-2-out MSC for upstream and downstream vessels (g), parallel vessels (h), and distant vessels (i). The relative total flow difference is calculated by comparing the length-weighted flow for the baseline and the stroke simulation (Materials and methods). The ≥20 microstrokes per topological configuration are depicted by the color- and marker-coded symbols. The boxplots are based on the data for each volume factor.
Figure 2—figure supplement 1
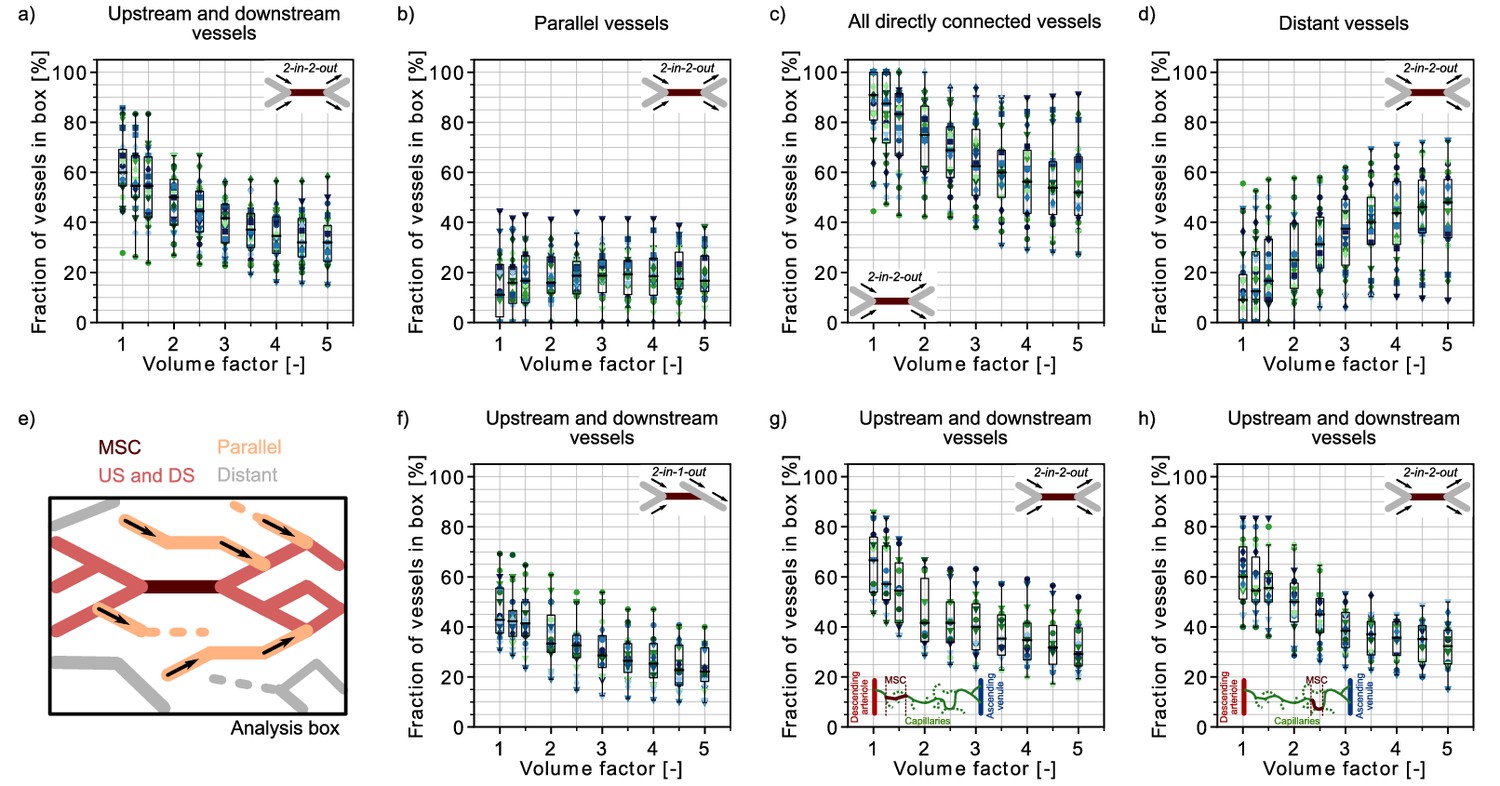
Occurrences of different vessels categories within the analysis box around the MSC.
(a–d) Percentage of vessels within the analysis box, which are positioned differently with respect to the 2-in-2-out MSC. (a) Percentage of vessels upstream and downstream of the MSC for an increasing analysis box volume. (b) Percentage of parallel vessels (Materials and methods). (c) Percentage of vessels directly connected to the MSC, that is upstream, downstream, and parallel vessels. (d) Percentage of distant vessels, that is vessels that are neither upstream, downstream, nor parallel. (e) Schematic to illustrate the concept of vessels upstream, downstream, parallel, and distant to the MSC (Materials and methods). (f–h) Percentage of upstream and downstream vessels of the MSC for an increasing analysis box volume for different cases. (f) 2-in-1-out, (g) 2-in-2-out close to a descending arteriole (DA), and (h) 2-in-2-out far away from a DA. Further details on the selection criteria are provided in Supplementary file 1a. The initial box volume, that is volume factor = 1, is 0.2 nl. The ≥20 microstrokes per case are depicted by the color-and marker-coded symbols. The boxplots are based on the available data for each volume factor.
Figure 2—figure supplement 2

Differences between the relative change in flow rate and in red blood cell (RBC) flux at a 2-in-2-out MSC.
(a–b) Average relative decrease in flow rate (a) and in RBC flux (b) for capillaries upstream and downstream of the MSC (only capillaries with a flow decrease are displayed). Only at generation ±1 and 2, there are significant differences between the relative change in flow and RBC flux (p<0.032 for generations ±1 and 2, paired Wilcoxon test). (c, d) Relative inflow difference for an increasing box volume around the MSC for the flow rate (c) and the RBC flux (d). The initial box volume, that is volume factor = 1, is 0.2 nl. For all volume factors, there is significant difference between the relative inflow rate change and the relative RBC flux change (p<0.0138 for all volume factors, paired Wilcoxon test). (a) and (c) are also depicted in Figures 1a and Figure 2b and are only provided to facilitate comparison between the changes observed for the flow rate and the RBC flux. The ≥20 microstrokes per case are depicted by the color- and marker-coded symbols. The boxplots are based on the available data for each generation/volume factor.
Figure 2—figure supplement 3

Impact of the baseline flow rate on the severity of a microstroke in a 2-in-2-out microstroke capillary (MSC).
(a–b) Average relative change in flow rate for capillaries upstream and downstream of the MSC. The red line indicates the median relative change if only capillaries with flow decrease are considered. The two-way interaction between case and generation is not significant (upstream: F(1.37,61.75) = 0.995, p=0.35, downstream: F(1.37,61.76) = 3.2, p=0.065) and there is no main effect of case (upstream: F(1,45) = 1.65, p=0.21, downstream: F(1,45)=0.25, p=0.6, two-way mixed ANOVA). (c–d) Relative inflow difference for an increasing box volume around the MSC. The initial box volume, that is volume factor = 1, is 0.2 nl. The relative inflow difference is computed by summing up the inflows across the borders of the box for the baseline and the stroke simulation (Materials and methods). While the two-way interaction between case and volume factor is not significant (F(1.59,71.45) = 0.582, p=0.52), there is a statistical significant main effect of case and volume factor on the relative change (case: F(1,45) = 13.97, p<0.001, volume factor: F(1.59,71.45) = 28.4, p<0.001, two-way mixed ANOVA). (a) and (c) show the results for a high baseline flow rate (6.6–25.0 µm3 ms−1) and (b) and (d) for a lower baseline flow rate (0.1–4.0 µm3 ms−1). Further details on the selection criteria are provided in Supplementary file 1a. (b) and (d) are also depicted in Figure 1—figure supplement 1a and Figure 2b and are only provided to facilitate comparison between the two cases. The ≥20 microstrokes per case are depicted by the color- and marker-coded symbols. The boxplots are based on the available data for each generation/volume factor.
Figure 2—figure supplement 4
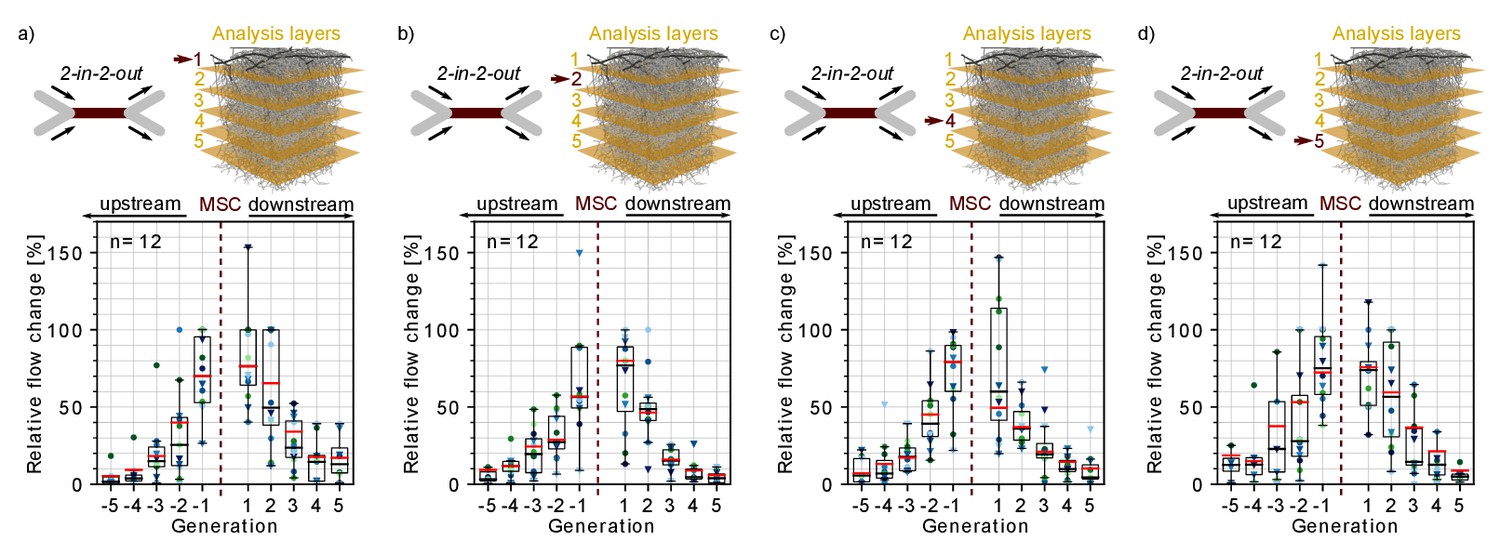
Impact of the cortical depth on the severity of a microstroke in a 2-in-2-out microstroke capillary (MSC).
(a–d) Upper: Schematic of a 2-in-2-out and the realistic microvascular network, which has been divided into five analysis layers (AL) each 200 µm thick. The arrow indicates the AL for which the results are depicted below. Lower: Average relative change in flow rate for capillaries upstream and downstream of the MSC. For each cortical depth, the flow field for twelve MSCs has been computed. The average relative change per generation for each of the twelve simulations is depicted by the color- and marker-coded symbols. The boxplots are based on all available data for each generation. The red line indicates the median relative change if only capillaries with flow decrease are considered. Further details on the selection criteria are provided in Supplementary file 1a. The two-way interaction between cortical depth and generation is not significant (upstream: F(5.39,82.18) = 0.391, p=0.87, downstream: F(6.28,95.84) = 0.54, p=0.8), and there is no main effect of cortical depth (upstream: F(4,61) = 0.47, p=0.76, downstream: F(4,61) = 0.68, p=0.61, two-way mixed ANOVA).
Figure 2—figure supplement 5
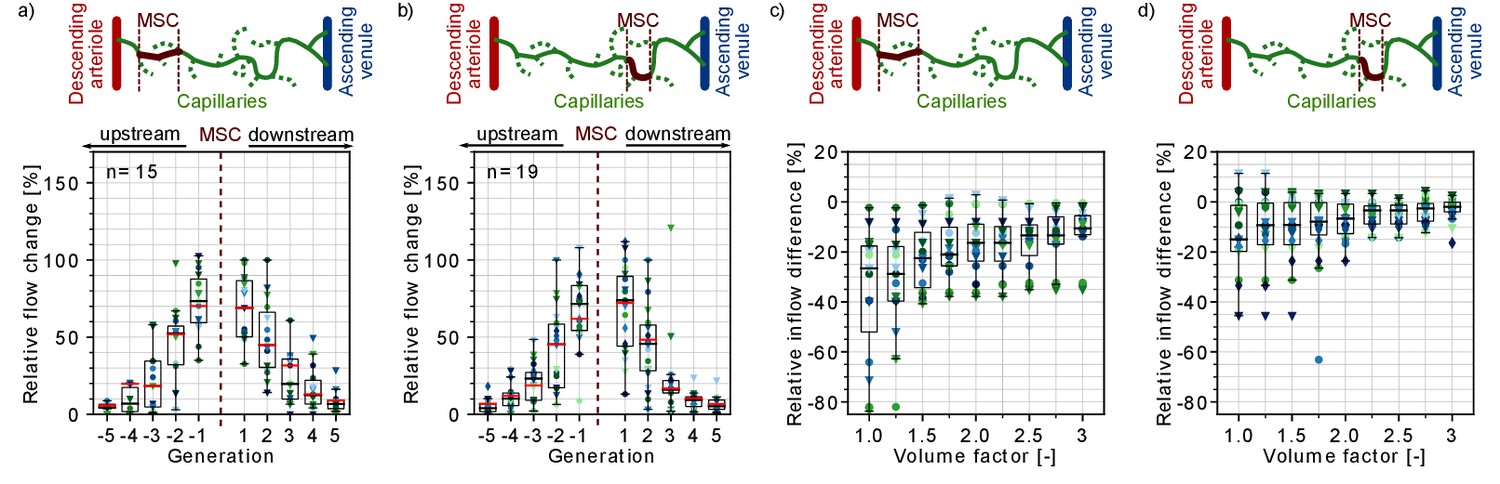
Impact of the distance of the microstroke capillary (MSC) to the penetrating vessels on the severity of a microstroke in a 2-in-2-out.
(a, b) Average relative change in flow rate for capillaries upstream and downstream of the MSC. The red line indicates the median relative change if only capillaries with flow decrease are considered. The two-way interaction between distance to descending arteriole (DA) and generation is not significant (upstream: F(2.18,69.82) = 0.28, p=0.70, downstream: F(2.8,89.52) = 0.3, p=0.8) and there is no main effect of distance to DA (upstream: F(1,32) = 0.21, p=0.65, downstream: F(1,32)=0.66, p=0.42, two-way mixed ANOVA). (c, d) Relative inflow difference for an increasing box volume around the MSC. While the two-way interaction between distance to DA and volume factor is not significant (F(1.55,49.6) = 1.22, p=0.295), there is a statistical significant main effect of distance to DA on the relative inflow change (case: F(1,32) = 8.27, p=0.007, two-way mixed ANOVA). The upper panel shows a schematic of the location of the MSC capillary along an exemplary capillary path between descending DA and ascending venule (AV). The initial box volume, that is volume factor = 1, is 0.2 nl. The relative inflow difference is computed by summing up the inflows across the borders of the analysis box for the baseline and the stroke simulation (Materials and methods). Further details on the selection criteria are provided in Supplementary file 1a. The ≥15 microstrokes per case are depicted by the color- and marker-coded symbols. The boxplots are based on the available data for each generation/volume factor. (a) and (c) show the results for MSC close to the DA and (b) and (d) for MSCs distant to the DAs.
Figure 3
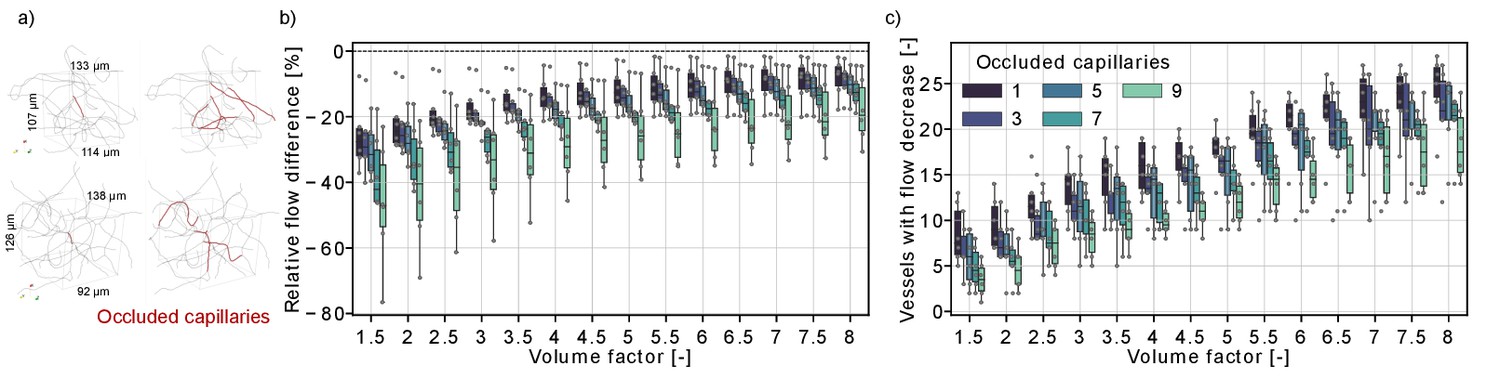
Flow reduction in analysis boxes around the microstroke capillary (MSC) for multi-capillary occlusions.
(a) Capillaries in an analysis box of 1.6 nl (volume factor = 8). The occluded capillaries are highlighted in dark red (left: one occluded capillary, right: nine occluded capillaries). Two distinct examples are shown in the upper and lower row. (b) Relative total flow difference for an increasing box volume around a 2-in-2-out MSC for an increasing number of occluded capillaries. The initial box volume, that is volume factor = 1, is 0.2 nl. The relative total flow difference is calculated by adding up the length-weighted flow for the baseline and the stroke simulation (Materials and methods). While the two-way interaction between number of occluded capillaries and volume factor is not significant (F(4.92,30.7) = 1.06, p=0.4), there is a statistical significant main effect of the number of occluded capillaries and the volume factor on the relative flow difference (number of occluded capillaries: F(4,25) = 3.52, p=0.021, volume factor: F(1.23,30.7) = 100.3, p<0.001, two-way mixed ANOVA). (c) Number of vessels with a flow decrease in the analysis box around the MSC. Occluded capillaries are not counted. The six microstrokes per number of occlusions are depicted by the gray scatterplot. The boxplots are based on the data for each volume factor.
Figure 4 with 1 supplement
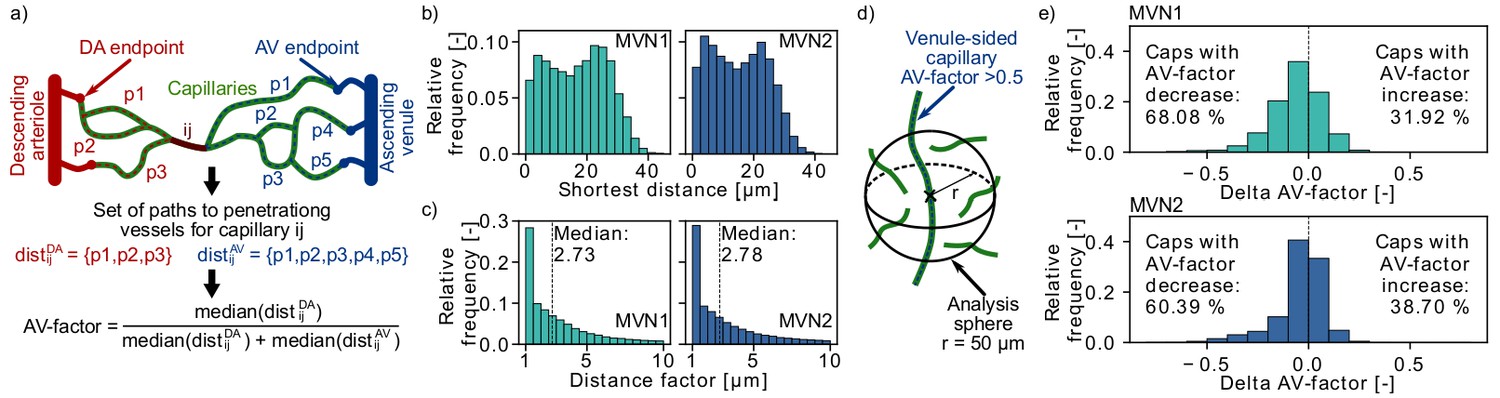
Distribution of arterial- and venule-sided capillaries within the microvascular networks (MVNs).
(a) Schematic to introduce the concept of the AV-factor (Materials and methods). The unique flow paths from capillary ij to the descending arteriole (DA)/ascending venule (AV) main branch are annotated by pk. (b) Shortest distance to the closest vessel for venule-sided capillaries (i.e. AV-factor > 0.5). Each venule-sided capillary is discretized by multiple points with an average distance of 1.3 µm between the points. This results in 144,655 and 321,973 discretization points for 2753 and 7170 venule-sided capillaries in MVN1 and MVN2, respectively. The shortest distance is computed for each analysis point. (c) Ratio of the shortest distance from an analysis point along a venule-sided capillary to an arterial-sided capillary to the shortest distance to any vessel (=distance factor). Values with a distance factor > 10 are not displayed (15%). (d) Schematic to illustrate the computation of the average AV-factor in an analysis sphere of 50 µm around venule-sided capillaries. (e) Difference between the AV-factor of the venule-sided capillary and the mean AV-factor of the analysis spheres around the discretization points.
Figure 4—figure supplement 1
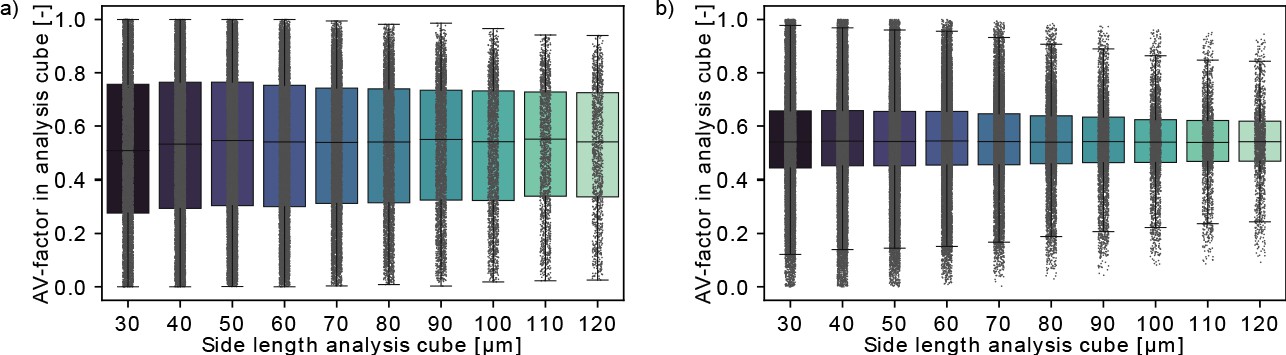
Average AV-factor in analysis cubes of varying size for microvascular network 1 (MVN1, a) and MVN2 (b).
To compute the average AV-factor the MVNs are discretized by analysis cube of varying size (Materials and methods). Neighboring analysis cubes overlap by half their side length. This results in 7336 (MVN1) and 17,915 (MVN2) analysis cubes with a side length of 30 µm and 1316 (MVN1) and 1700 (MVN2) analysis cubes for a side length of 120 µm.
Figure 5 with 2 supplements
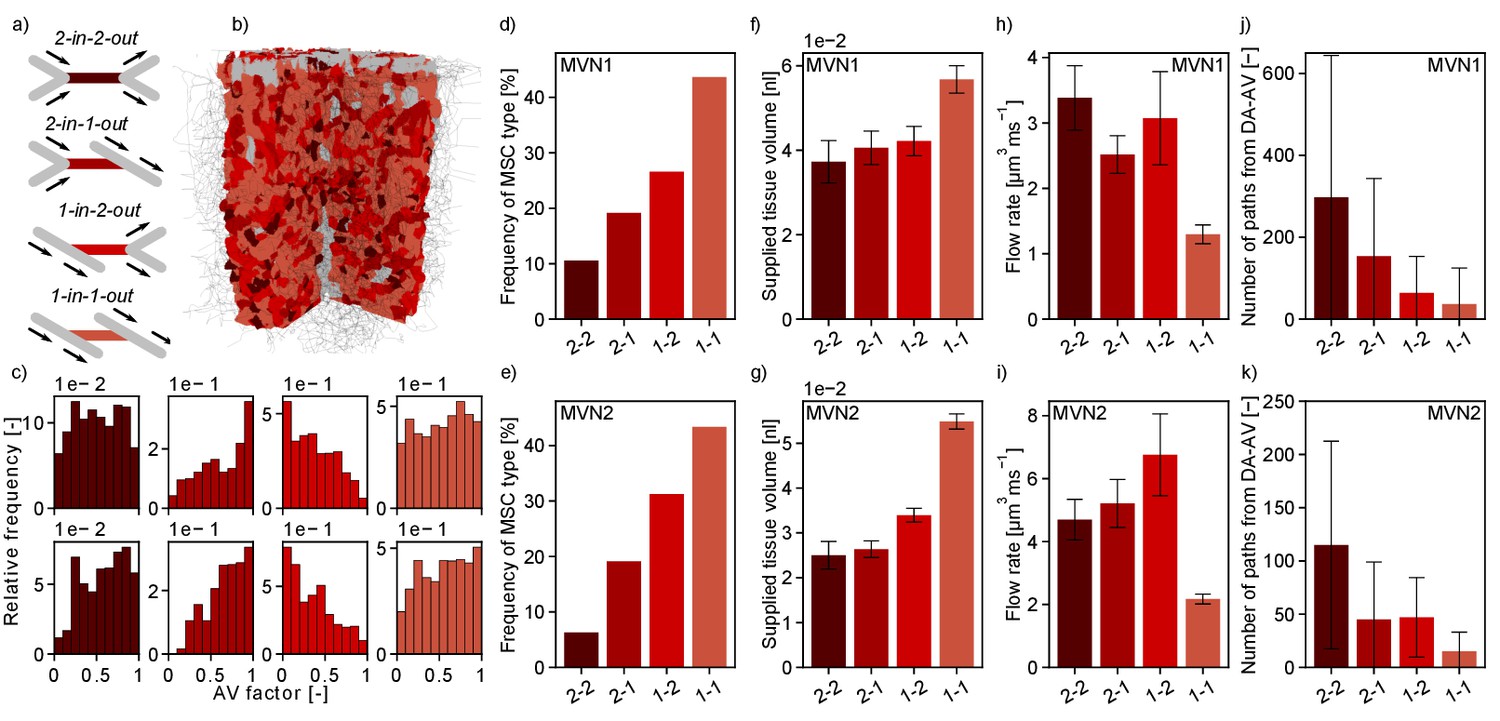
Characteristics of the four topological configurations at a microstroke capillary (MSC) for both microvascular networks (MVNs).
(a) Schematic of the four topological configurations at a MSC. The MSC is color coded in accordance with subfigures (b–k). (b) Grid representation of the tissue in which realistic MVN1 is embedded. The tissue points are color coded based on the closest MSC type. (c) Relative frequency of occurrence of the different MSC types along the capillary path (AV-factor, Materials and methods). The number of occurrence per MSC type is normalized by the total number of capillaries per AV-factor bin. Upper row: MVN1 (n = 2968). Lower row: MVN2 (n = 6571). (d, e) Frequency of occurrence of the four MSC types (d: MVN1, e: MVN2). (f, g) Median-supplied tissue volume for the four MSC types (Materials and methods, f: MVN1, g: MVN2). (h, i) Median flow rate for the four MSC types (h: MVN1, i: MVN2). (j, k) Median number of paths leading through a MSC from the descending arteriole (DA) to the ascending venule (AV, j: MVN1, k: MVN2). (f–i) The error bars show the 95%-confidence interval. (j, k) The 75% confidence interval is shown. Abbreviations of the four MSC types: 2–2: 2-in-2-out, 2–1: 2-in-1-out, 1–2: 1-in-2-out, 1–1: 1-in-1-out. The statistics are based on all capillaries that fulfill the general selection criteria described in the Materials and methods. The fifth selection criterion is less strict for the current analysis, that is the capillary only has to be two segments apart from the DA/AV, and the sixth criterion is not applied. This results in 4794 and 8517 capillaries for analysis for MVN1 and MVN2, respectively. The analysis on the number of paths is based on 2968 and 6571 capillaries for MVN1 and MVN2, respectively. The Kruskal–Wallis test confirms that the differences between the MSC types are significant for the supplied tissue volume, the flow rate, and the number of paths (p<0.001 for all quantities in each MVN). p-values for pairwise comparison with the Mann–Whitney U test are listed in Supplementary file 1e.
Figure 5—figure supplement 1
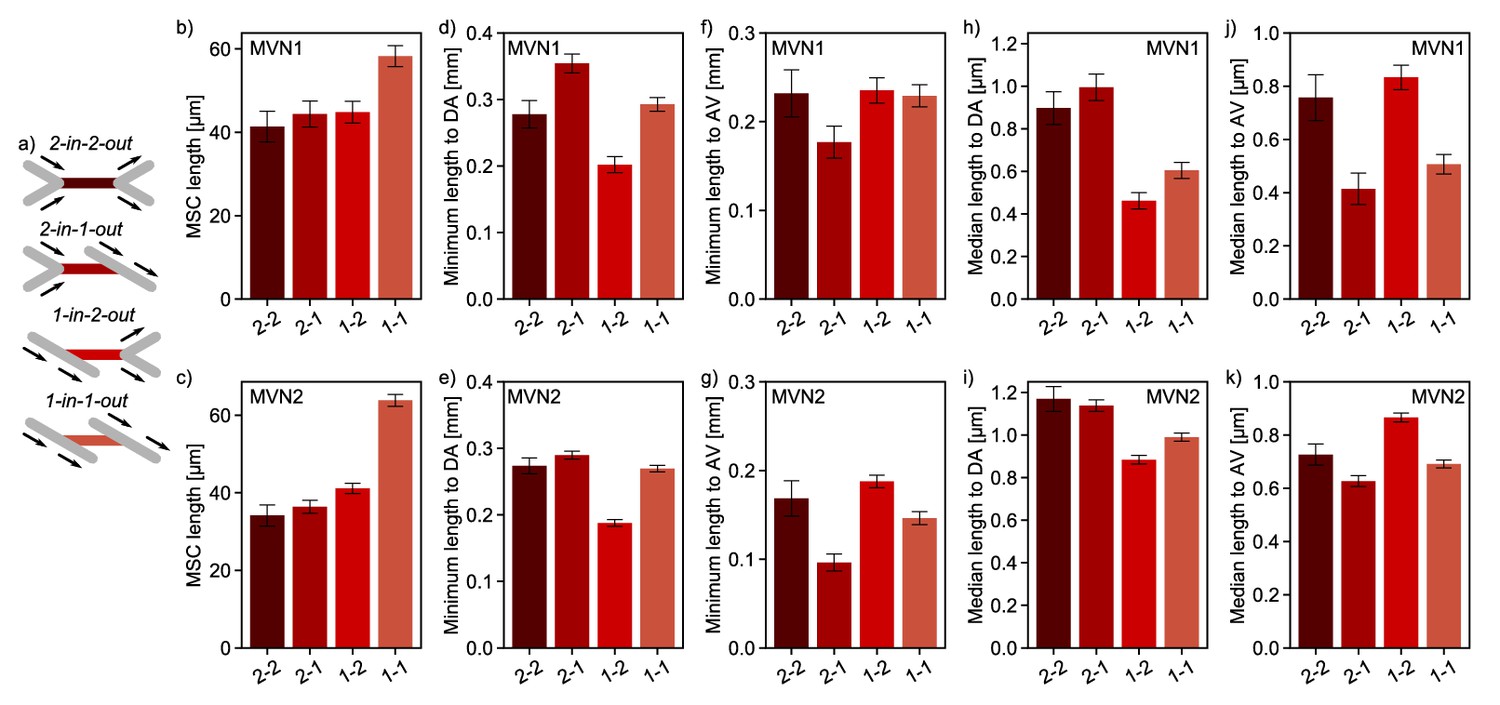
Length and distance to penetrating vessels of microstroke capillaries (MSC) of different types.
(a) Schematic of the four topological configurations at the MSC. The MSC is color coded in accordance with subfigures (b–k). (b, c) Median vessel length of the four MSC types (b: MVN1, c: MVN2). (d–g) Median length of the minimum distance of all paths leading from a MSC to descending arteriole (DA, d: MVN1, e: MVN2) and ascending venule (AV, f: MVN1, g: MVN2) main branches. (h–k) Median length of the median distance of all paths leading from a MSC to DA (h: MVN1, i: MVN2) and AV (j: MVN1, k: MVN2) main branches. The error bars show the 95% confidence interval. Abbreviations of the four MSC types: 2–2: 2-in-2-out, 2–1: 2-in-1-out, 1–2: 1-in-2-out, 1–1: 1-in-1-out. The statistics are based on all capillaries that fulfill the general selection criteria described in the Materials and methods. The fifth selection criterion is less strict for the current analysis, that is the capillary only has to be two segments apart from the DA/AV, and the sixth criterion is not applied. This results in 4794 and 8517 capillaries for analysis for MVN1 and MVN2, respectively. The analysis on the path lengths is based on 2968 and 6571 capillaries for MVN1 and MVN2, respectively.
Figure 5—figure supplement 2
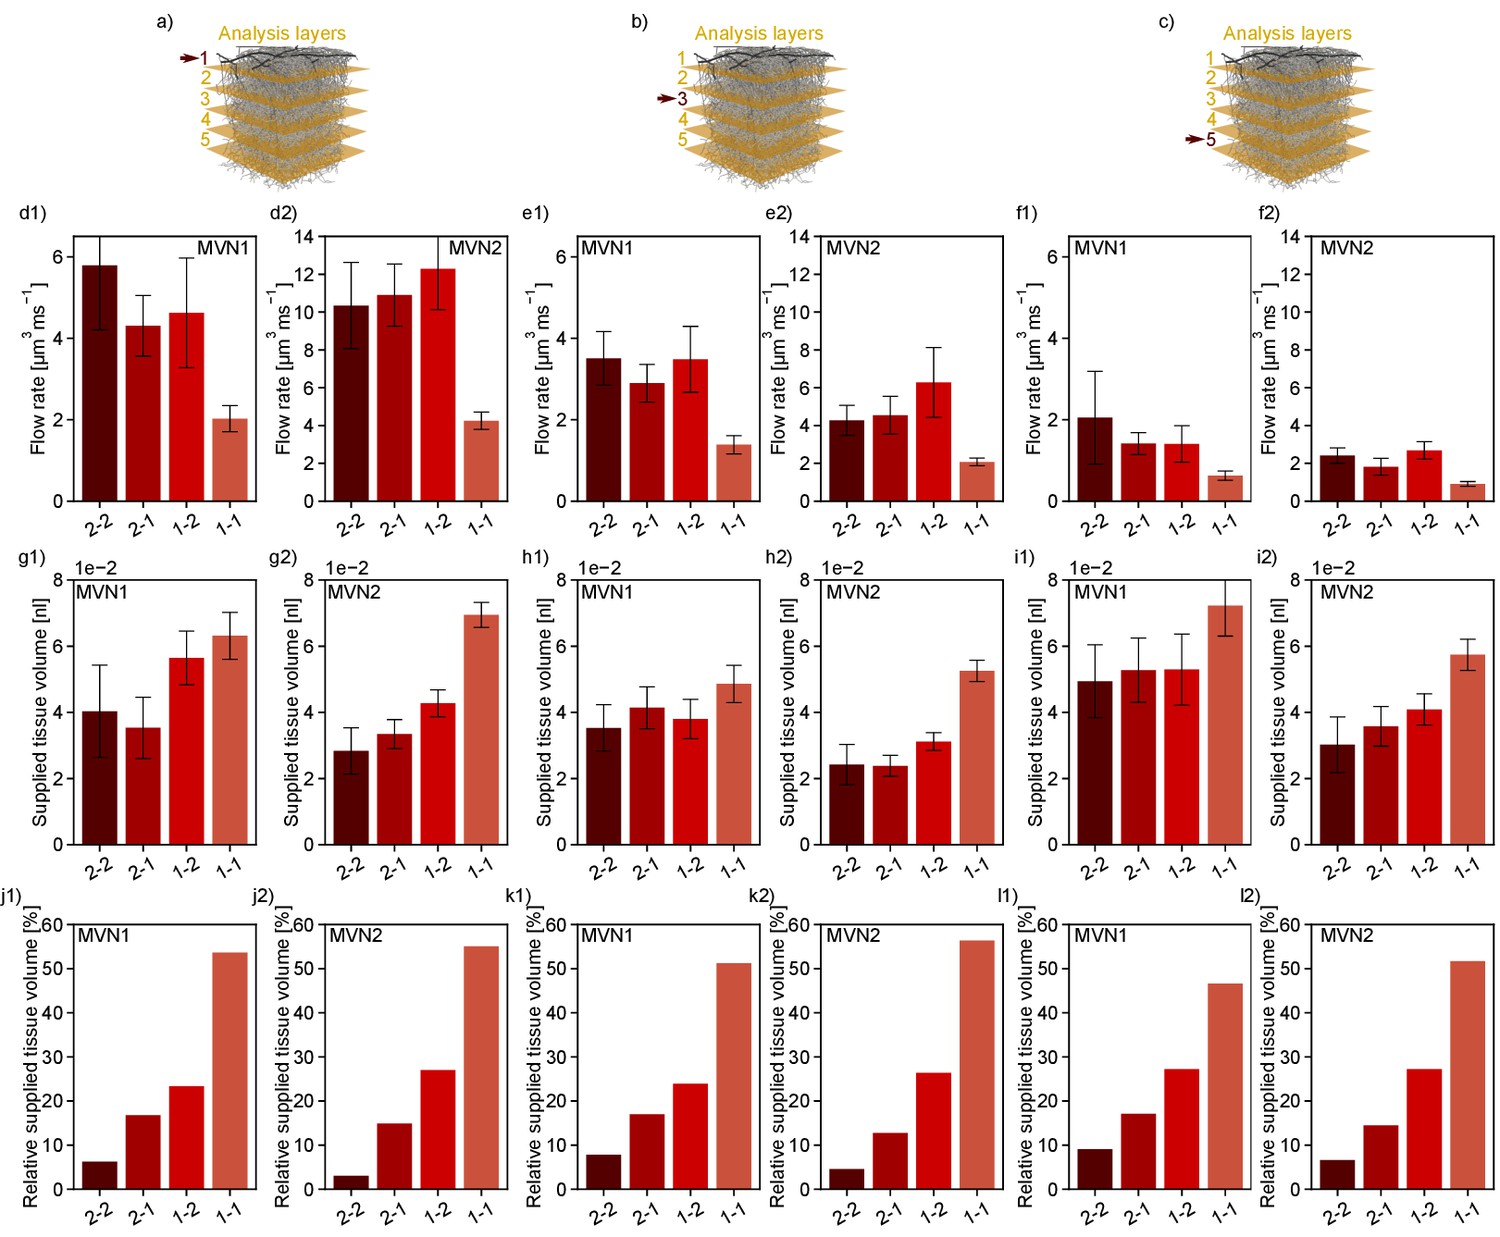
Median flow rate, median, and total relative supplied tissue volume for the four microstroke capillary (MSC) types over cortical depth.
(a–c) Schematic of a realistic microvascular network, which has been divided into five analysis layers (AL) each 200 µm thick. The arrow indicates for which AL the results are depicted in the subplots below. (d–f) Median flow rate for the different MSC types over cortical depth. (g–i) Median-supplied tissue volume for the different MSC types over cortical depth (Materials and methods). (j–l) Total relative supplied tissue volume for the different MSC types over cortical depth. The relative supplied tissue volume is calculated by summing up the supplied tissue volume for each MSC type and dividing it by the total tissue volume per AL. The results for AL 1, 3, and 5 are displayed. The results are shown separately for microvascular network 1 (MVN1) and MVN2. Abbreviations of the four MSC types: 2–2: 2-in-2-out, 2–1: 2-in-1-out, 1–2: 1-in-2-out, 1–1: 1-in-1-out. The statistics are based on all capillaries that fulfill the general selection criteria described in the Materials and methods. The fifth selection criterion is less strict for the current analysis, that is the capillary only has to be two segments apart from the DA/AV, and the sixth criterion is not applied.
Figure 6 with 1 supplement
Changes in flow paths in response to single and multiple microstrokes in MVN1.
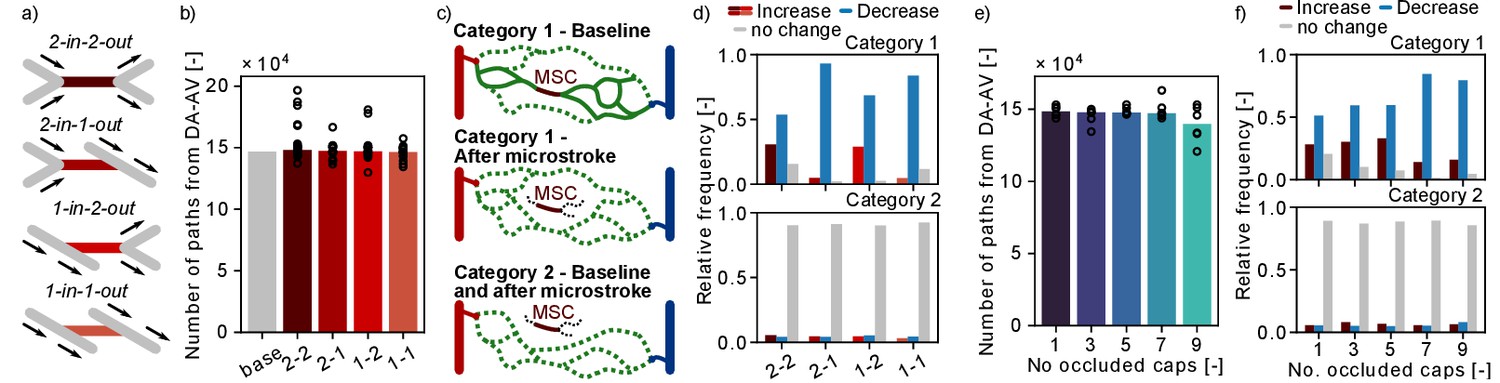
(a) Schematic of the four topological configurations at the microstroke capillary (MSC). The MSC is color coded in accordance with subfigures (b) and (d). (b) Total number of flow paths connecting a descending arteriole (DA) to an ascending venule (AV) in MVN1. The bar plot depicts the results for the baseline simulation (base) and the median for the each microstroke case. The spheres show the total number of flow paths for each microstroke simulations (p=0.4, Kruskal–Wallis test). (c) Schematic to introduce the two categories of DA-AV-endpoint-pairs (Materials and methods). Each subplot shows all flow paths between one DA-AV-endpoint-pair. Flow paths that do not go through the MSC are labeled by the dotted line. (d) Relative frequency of DA-AV-endpoint-pairs with an increase, a decrease or no change in the number of unique flow paths for the four MSC types. The microstroke simulations per MSC type are combined before the relative frequency is computed. Upper plot: DA-AV-endpoint-pairs belonging to category 1. Lower plot: DA-AV-endpoint-pairs belonging to category 2 (see c). (e) Total number of flow paths connecting DA and an AV in MVN1 for an increasing number of occluded capillaries. The bar plot depicts the median of six simulations per number of occluded capillaries (No. occluded caps). The spheres show the total number of flow paths for each simulation (p=0.6, Kruskal–Wallis test). (f) Relative frequency of DA-AV-endpoint-pairs with an increase, a decrease or no change in the number of unique flow paths for different numbers of occluded capillaries. The microstroke simulations per number of occluded capillaries are combined before the relative frequency is computed. Upper plot: DA-AV-endpoint-pairs belonging to category 1. Lower plot: DA-AV-endpoint-pairs belonging to category 2. Abbreviations of the four MSC types: 2–2: 2-in-2-out, 2–1: 2-in-1-out, 1–2: 1-in-2-out, 1–1: 1-in-1-out.
Figure 6—figure supplement 1
Changes in the number of flow paths and the number of DA-AV-endpoint-pairs in response to a microstroke.
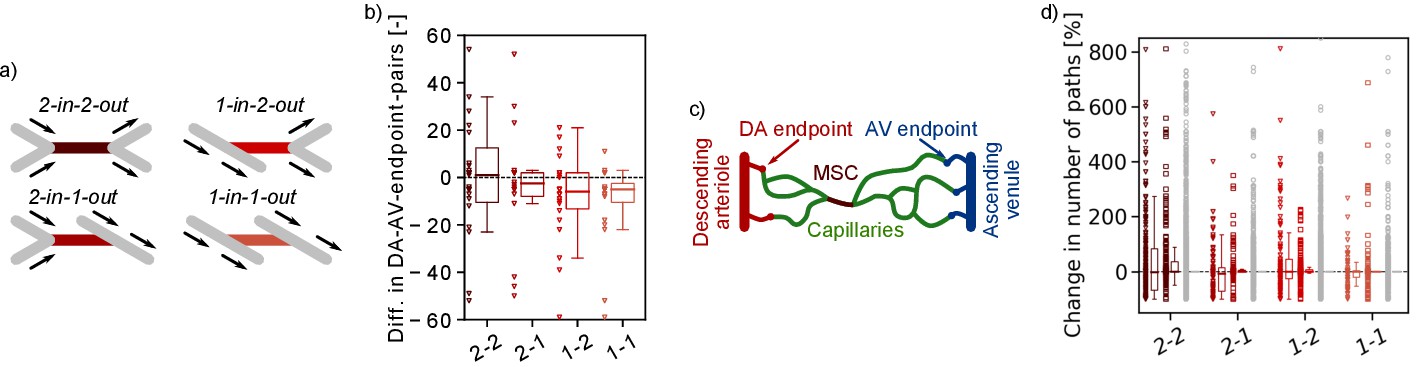
(a) Schematic of the four topological configurations at the microstroke capillary (MSC). The MSC is color coded in accordance with subfigures (b–d). (b) Difference (Diff.) in the total number of unique DA-AV-endpoint pairs (Materials and methods, Diff. < 0: Decrease in the number of unique DA-AV-endpoint pairs with respect to baseline). The data of all microstroke simulations per MSC type is shown in the scatter points and summarized in the boxplot right of it. Six data points are not displayed because the absolute difference is >60. (c) Schematic to introduce DA-AV-endpoint-pairs and the concept of flow paths through a MSC. The illustrated example has 15 flow paths going through the MSC and 6 DA-AV-endpoint-pairs. Only paths through the MSC are depicted. (d) Relative change in the number of flow paths through upstream and downstream, parallel, and distant of capillaries (Materials and methods). The relative change is computed from the total number of paths during baseline and during stroke (Materials and methods). Only capillaries that are at least along one flow path between DA and AV during baseline are considered. The data of all microstroke simulations per MSC type is shown in the scatter points and summarized in the boxplot right of it. Triangles: Capillaries upstream and downstream of the MSC (three generations). Squares: Capillaries parallel to the MSC. Circles: Capillaries distant to the MSC. 0.1% of the data is not displayed (change > 800%). Abbreviations of the four MSC types: 2–2: 2-in-2-out, 2–1: 2-in-1-out, 1–2: 1-in-2-out, 1–1: 1-in-1-out.
Tables
Author response table 1
Validation of the simulation results with literature data.
Table from: [15].
| DA: qRBCin[nl s-1] | DA+A: vRBC [mm s-1] | C: vRBC[mm s-1] | C: qRBC [RBCs s-1] | |
|---|---|---|---|---|
| Literature | 0.1 - 10.0[50] | 2.0 – 30.0[50] | mean: 0.4 – 2.0 [4, 10, 11, 13, 14, 51, 52] | mean: 38.6 – 62.0 [13, 14, 53] |
| MVN 1 | 0.88 ± 1.87 | 2.44 ± 4.56 | 0.82 ± 1.31 | 59.1 ± 237.6 |
| MVN 2 | 5.15 ± 8.57 | 5.28 ± 7.61 | 1.38 ± 1.96 | 88.4 ± 574.0 |
| MVN 3 | 0.96 ± 1.00 | 2.73 ± 4.97 | 0.59 ± 0.93 | 29.8 ± 219.0 |
-
qRBCin: RBC flow rate in the first segments of the DA, vRBC: RBC velocity in the DA+A, qRBC: RBC flux. The values of the simulation results are given as mean ± standard deviation. For the RBC flux qRBC the median ± standard deviation are given. DA: descending arteriole, A: arteriole, C: capillary, MVN: microvascular network.
Additional files
-
Supplementary file 1
Selection criteria, MSC types over depth and statistics.
(a) Overview of the eight selection criteria used to analyze the impact of structural and functional characteristics on the severity of a microstroke. The different microstroke capillary (MSC) types are depicted in Figure 1a–d. For cases 1–7, the cortical depth selection criterion requires that only the source of the MSC be within the given range. For cases 8–12, at least one of the vertices should be within the given range, while the second one may be ±50 µm outside the given range. The mean and standard deviation (std) are calculated from the results of the baseline simulation for the eight chosen MSC per case. For the mean and std of the cortical depth the values of the source and the target vertex are both considered. The definition of the main branch is provided in the methods. DA: descending arteriole. AV: ascending venule. n: simulated number of MSCs per case. (b) Distribution of microstroke capillary (MSC) types over cortical depth for microvascular network (MVN) 1 and 2. AL: analysis layer. Abbreviations of the four MSC types: 2–2: 2-in-2-out, 2–1: 2-in-1-out, 1–2: 1-in-2-out, 1–1: 1-in-1-out. (c) Statistical results for the effect of the MSC type on the changes observed at different generations (Figure 1). The effect of the MSC type has been analyzed separately for the generations upstream (−5 to −1) and downstream (1 to 5) of the MSC. The statistical test has been performed in R with the function anova_test() as a two-way mixed ANOVA with Bonferroni correction. Upper: There is a significant simple main effect of the factor MSC type at all generations except generation 4 and 5. Lower table: Pairwise t-test to determine for which MSC types there is a significant difference in the changes observed per generation. Only pairs with a significant difference are listed. Case 1: 2-in-2-out, Case 2: 2-in-1-out, Case 3: 1-in-2-out, Case 4: 1-in-1-out. p-adj.: adjusted p-value, sign: significance. (d) Statistical results for the effect of the MSC type on the changes in inflow rate for analysis boxes of different volumes (Figure 2b–e). The statistical test has been performed in R with the function anova_test() as a two-way mixed ANOVA with Bonferroni correction. Upper: There is a significant simple main effect of the factor MSC type for all volume factors < 2.75. Lower: Pairwise t-test to determine for which MSC types there is a significant difference in the changes observed per volume factor. Only pairs with a significant difference are listed. Case 1: 2-in-2-out, Case 2: 2-in-1-out, Case 3: 1-in-2-out, Case4: 1-in-1-out. p-adj.: adjusted p-value, sign: significance. (e) Statistical results for the characteristics of different MSC types (Figure 5f–k). The statistical test has been performed in with the Python library scipy.stats. The Kruskal–Wallis test showed a significant difference between supplied tissue volume, flow rate, and number of paths in both microvascular networks (MVNs, all p-values<0.001). Below the p-values of the pairwise comparison with the Mann-Whitney U test are listed. Upper: p-values for MVN1. Lower: p-values for MVN2. Abbreviations for the MSC types: 2–2: 2-in-2-out, 2–1: 2-in-1-out, 1–2: 1-in-2-out, 1–1: 1-in-1-out. ns: not significant. (f) Absolute differences between averaged flow rates in all capillaries at two time points t1 and t2. The time difference between the two time points is 20 s. Left: The absolute differences for an averaging interval of 10 turnover times (ToT) are displayed. Middle and left: The differences for averaging intervals of 5 ToTs and 3 ToTs are shown. The absolute differences between the averaged results increase for smaller averaging intervals. For an averaging interval of 10 ToT for 94% of all vessels, the absolute difference is smaller than 0.1 µm3 ms−1. This value decreases to 91% and 87% for an averaging interval of 5 ToT and 3 ToT, respectively.
- https://cdn.elifesciences.org/articles/60208/elife-60208-supp1-v2.docx
-
Transparent reporting form
- https://cdn.elifesciences.org/articles/60208/elife-60208-transrepform-v2.pdf
Download links
A two-part list of links to download the article, or parts of the article, in various formats.
Downloads (link to download the article as PDF)
Open citations (links to open the citations from this article in various online reference manager services)
Cite this article (links to download the citations from this article in formats compatible with various reference manager tools)
The severity of microstrokes depends on local vascular topology and baseline perfusion
eLife 10:e60208.
https://doi.org/10.7554/eLife.60208


