Membrane-partitioned cell wall synthesis in mycobacteria
- Molecular and Cellular Biology Graduate Program, University of Massachusetts, United States
- Department of Microbiology, University of Massachusetts, United States
- Division of Genetics, Wadsworth Center, New York State Department of Health, United States
- Department of Biomedical Sciences, University at Albany, United States
Figures
Figure 1 with 6 supplements
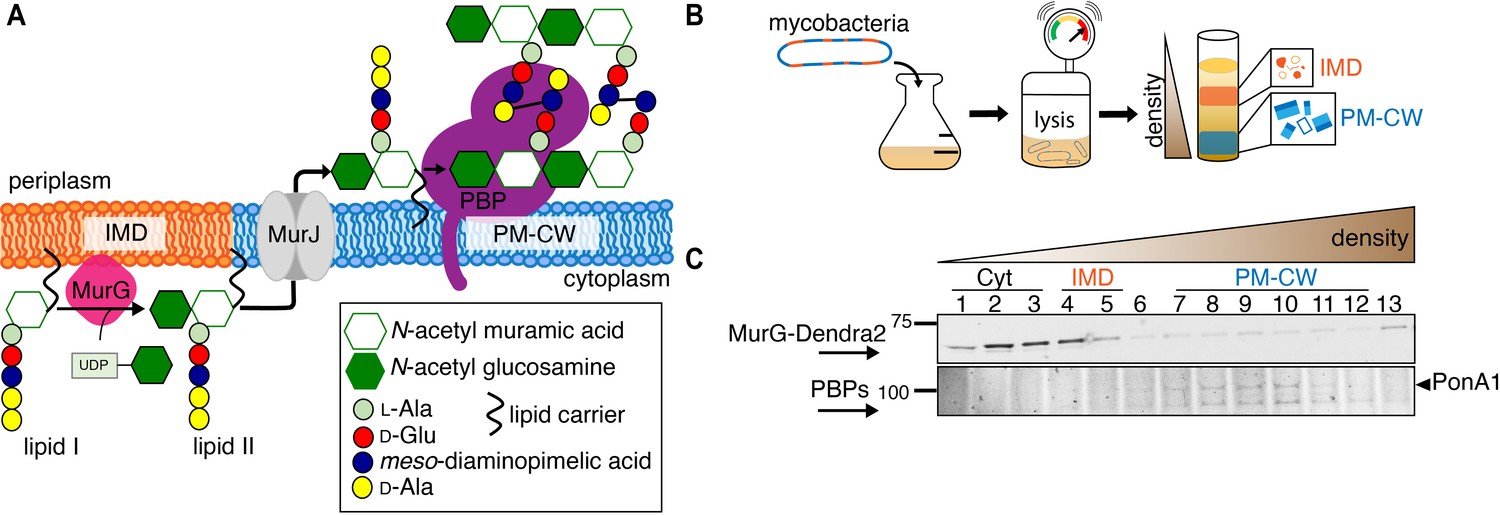
MurG is enriched in the IMD, and PBPs associate with PM-CW.
(A) Membrane-bound steps of peptidoglycan synthesis with hypothesized partitioning into IMD and PM-CW. (B) Bacteria are lysed by nitrogen cavitation, and cell lysate is sedimented on a sucrose density gradient. (C) Lysates from wild-type or MurG-Dendra2-expressing M. smegmatis were fractionated as in (B) and separated by SDS-PAGE. Top, in-gel fluorescence shows MurG-Dendra2 association with the IMD. Treatment with benzyl alcohol (BA) redistributed the protein across the fractions. Bottom, wild-type M. smegmatis membrane fractions were incubated with Bocillin-FL prior to SDS–PAGE. Labeled PBPs are enriched in PM-CW. Band intensities are quantitated in Figure 1—figure supplement 4.
Figure 1—figure supplement 1
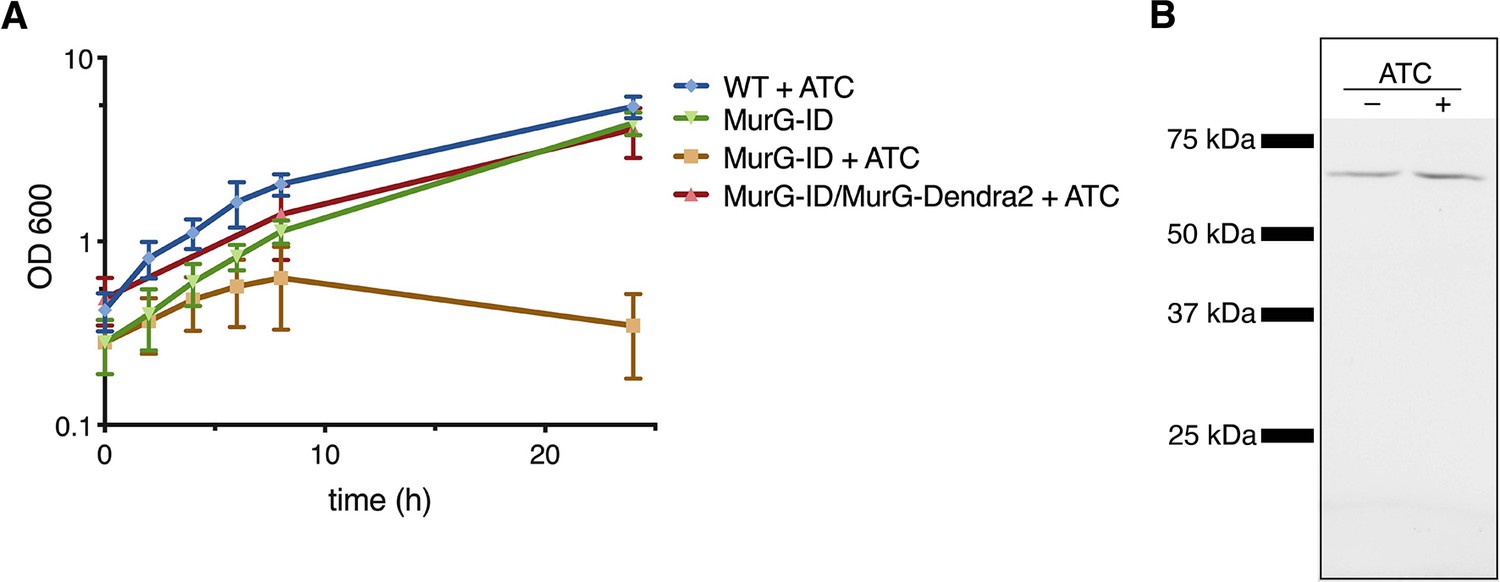
MurG-Dendra2 is functional.
(A) MurG-Dendra2 expression rescues depletion of endogenous protein. The MurG-ID depletion strain (Meniche et al., 2014) was transformed with a plasmid containing murG-dendra2 and grown +/- 50 ng/mL anhydrotetracycline (ATC) to induce MurG-ID degradation. (B) MurG-ID/MurG-Dendra2 M. smegmatis was grown +/- ATC for 8 hr. Bacteria were lysed, and MurG-Dendra2 was visualized by in-gel fluorescence. We observed a single band of the predicted size (and absent from wild-type M. smegmatis), indicating that MurG-Dendra2 does not undergo degradation.
Figure 1—figure supplement 2
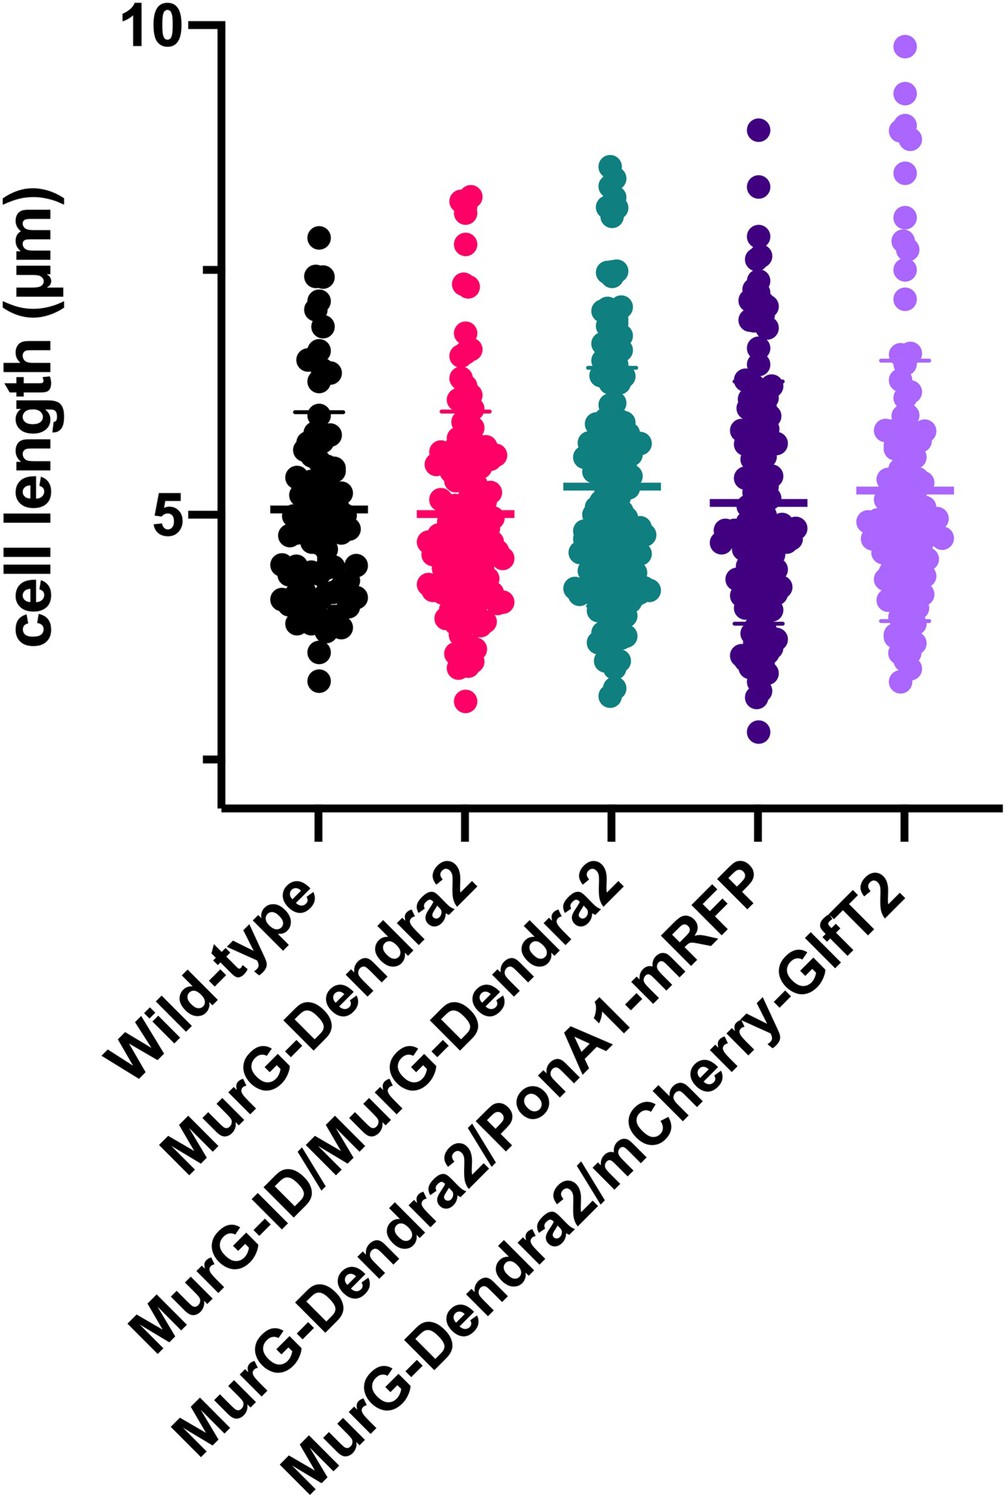
Fluorescent fusions do not change the cell length of M. smegmatis.
Wild-type, MurG-Dendra2, MurG-Dendra2/PonA1-mRFP and MurG-Dendra2/mCherry-GlfT2 or MurG-ID/MurG-Dendra2 M. smegmatis were grown to log phase and imaged in phase contrast. Cell length was quantified using Oufti (Paintdakhi et al., 2016) and MATLAB (García-Heredia et al., 2018). There was no significant difference between the cell lengths of the mutants compared to that of wild-type M. smegmatis as tested by ANOVA and Dunnet’s multiple comparison. 80<n<148.
Figure 1—figure supplement 3
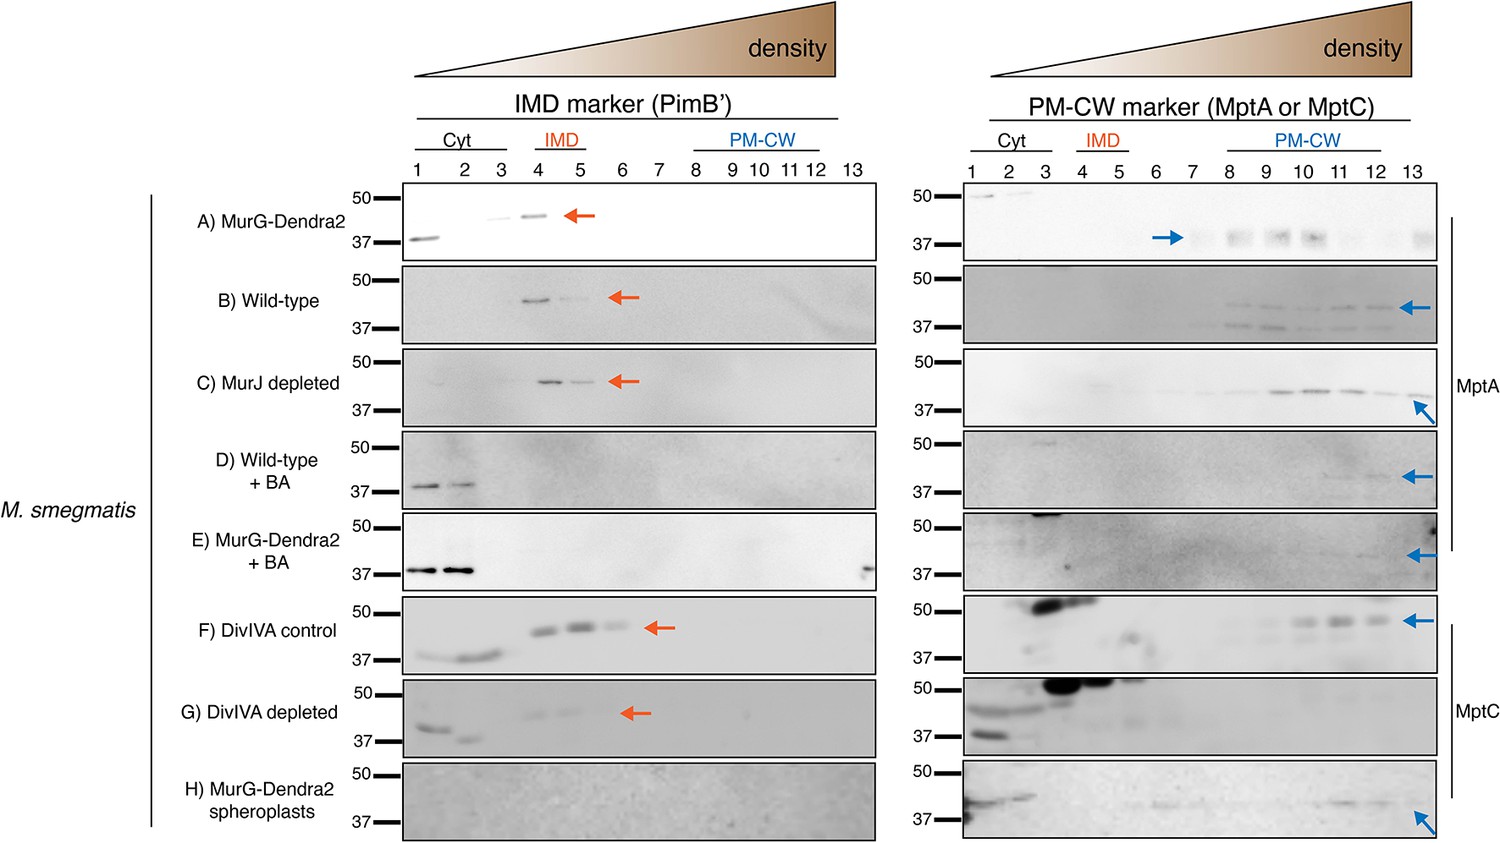
Immunoblot analysis of the IMD and the PM-CW membrane fractions separated by sucrose density sedimentation.
Antibodies against PimB’ and MptA or MptC were used to detect the IMD and PM-CW, respectively (Hayashi et al., 2016; Sena et al., 2010). Fractions shown here correspond to (A) MurG-Dendra2-expressing M. smegmatis in Figure 1C; (B) wild-type M. smegmatis in Figures 1C and 2C; (C) MurJ-depleted M. smegmatis in Figure 2C; (D) wild-type M. smegmatis treated with benzyl alcohol (BA) in Figure 1C; (E) MurG-Dendra2-expressing M. smegmatis treated with benzyl alcohol in Figure 1C; (F) and (G) DivIVA-eGFP-ID M. smegmatis +/- ATC as in Figure 4A. Samples from (F) and (G) were concentrated 10-fold by precipitating proteins in chloroform and water; (H) is spheroplasted MurG-Dendra2 M. smegmatis as in Figure 4C, Figure 4—figure supplement 1. PimB’ appears as ~45 kDa band in the IMD fractions but disappears upon BA treatment or DivIVA depletion. We do not yet know the reason for PimB’ disappearance. The band at ~37 kDa, which is visible especially in the cytoplasmic fractions of BA-treated bacteria, is a non-specific protein (Hayashi et al., 2016). MptA and MptC appear as ~42 kDa band in the PM-CW fractions and become fainter after BA treatment or depletion of DivIVA. Arrows indicate the bands that correspond to PimB’ (left, orange) and MptA or MptC (right, blue).
Figure 1—figure supplement 4
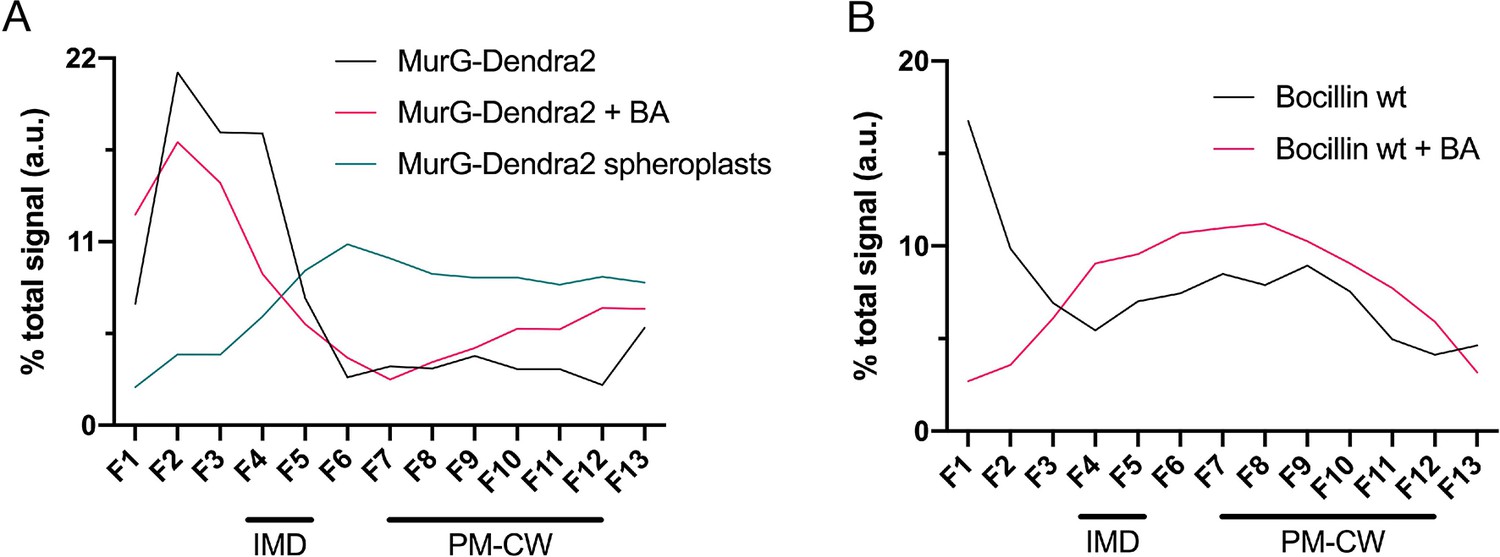
Membrane-bound MurG-Dendra2 (fractions 4–12) is enriched in the IMD (fractions 4–5), (A), and Bocillin-FL-labeled PBPs are enriched in the PM-CW (fractions 7–12), (B).
The association of MurG-Dendra2 with the IMD (black line) decreases upon benzyl alcohol (BA) treatment (pink line) and is lost in spheroplasts (blue line). The distribution of Bocillin-FL-labeled PBPs in IMD vs. PM-CW is similar +/- BA (black and pink lines). In-gel fluorescence from Figure 1C and Figure 4—figure supplement 1 were quantified by densitometry. In (B), the high signal for fraction 1 of untreated M. smegmatis (black line) is background fluorescence (see Figure 1C).
Figure 1—figure supplement 5

MurG-Dendra2 is spatially coincident with the IMD reporter mCherry-GlfT2.
M. smegmatis-coexpressing MurG-Dendra2 and mCherry-GlfT2 was imaged by structured illumination microscopy (SIM-E) and conventional microscopy. Left, representative SIM-E image. Scale bar, 5 µm. Right, the fluorescence intensity profiles from conventional microscopy images were quantitated as in Figure 2A. r, Pearson’s correlation value. n = 59 cells.
Figure 1—figure supplement 6

Visualization of PonA1 using Bocillin-FL.
To assess specificity of the fluorescent signal, membrane fractions were pre-incubated +/- 16 µg/mL ampicillin and 5 µg/mL of the β-lactamase inhibitor clavulanate (García-Heredia et al., 2018) for 30 min at room temperature. One hundred micrograms of total membrane proteins were incubated with 40 µM of Bocillin-FL for 30 min, then separated by SDS–PAGE, and visualized by in-gel fluorescence. WT, wild-type M. smegmatis; ptetponA1 expressed (on) or depleted (off) with addition of ATC as described (Hett et al., 2010). Boxed images are from the same blot but reordered for clarity.
Figure 2 with 3 supplements
Lipid II is synthesized in the IMD and trafficked to the PM-CW.
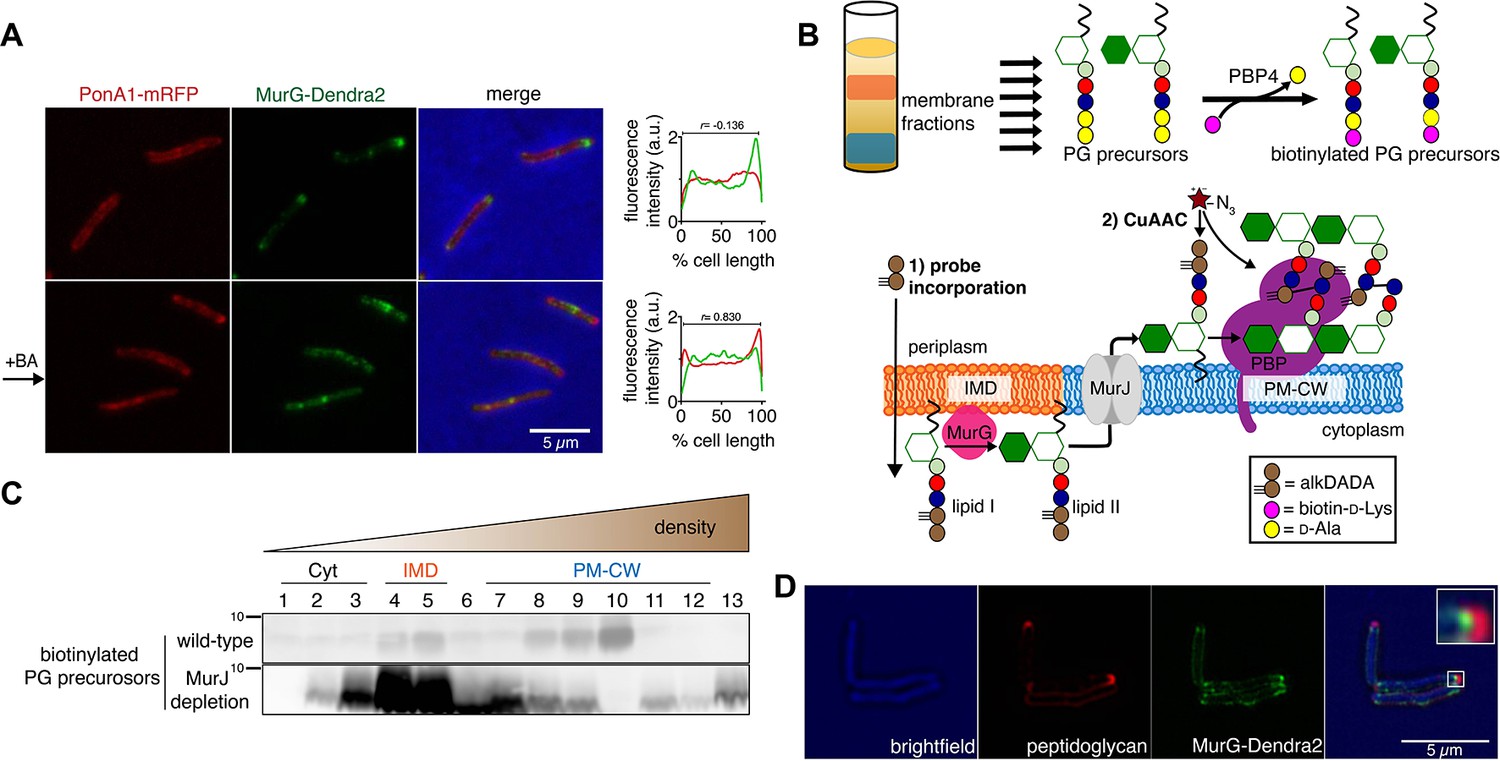
(A) Left, conventional microscopy of M. smegmatis coexpressing PonA1-mRFP and MurG-Dendra2 treated +/- benzyl alcohol (BA). Right, fluorescence distribution of the fusion proteins. a.u., arbitrary units. r denotes the Pearson’s correlation value. 42>n>57. (B) Top, detection of lipid-linked peptidoglycan (PG) precursors from membrane fractions. Bottom, metabolic labeling of mycobacterial cell wall synthesis (García-Heredia et al., 2018). (C) PG precursors are labeled as in (B), top. The labeled precursors are in the IMD and PM-CW of wild-type M. smegmatis but accumulate in the IMD upon MurJ depletion (García-Heredia et al., 2018). While we do not yet understand the loss of signal from fraction 10, we note that there are precursors present but in low abundance (see Figure 2—figure supplement 3B). (D) M. smegmatis-expressing MurG-Dendra2 were incubated with alkDADA. Surface-exposed alkynes on fixed cells were detected by CuAAC (García-Heredia et al., 2018). Bacteria were imaged by SIM-E.
Figure 2—figure supplement 1
PonA1-mRFP is functional.
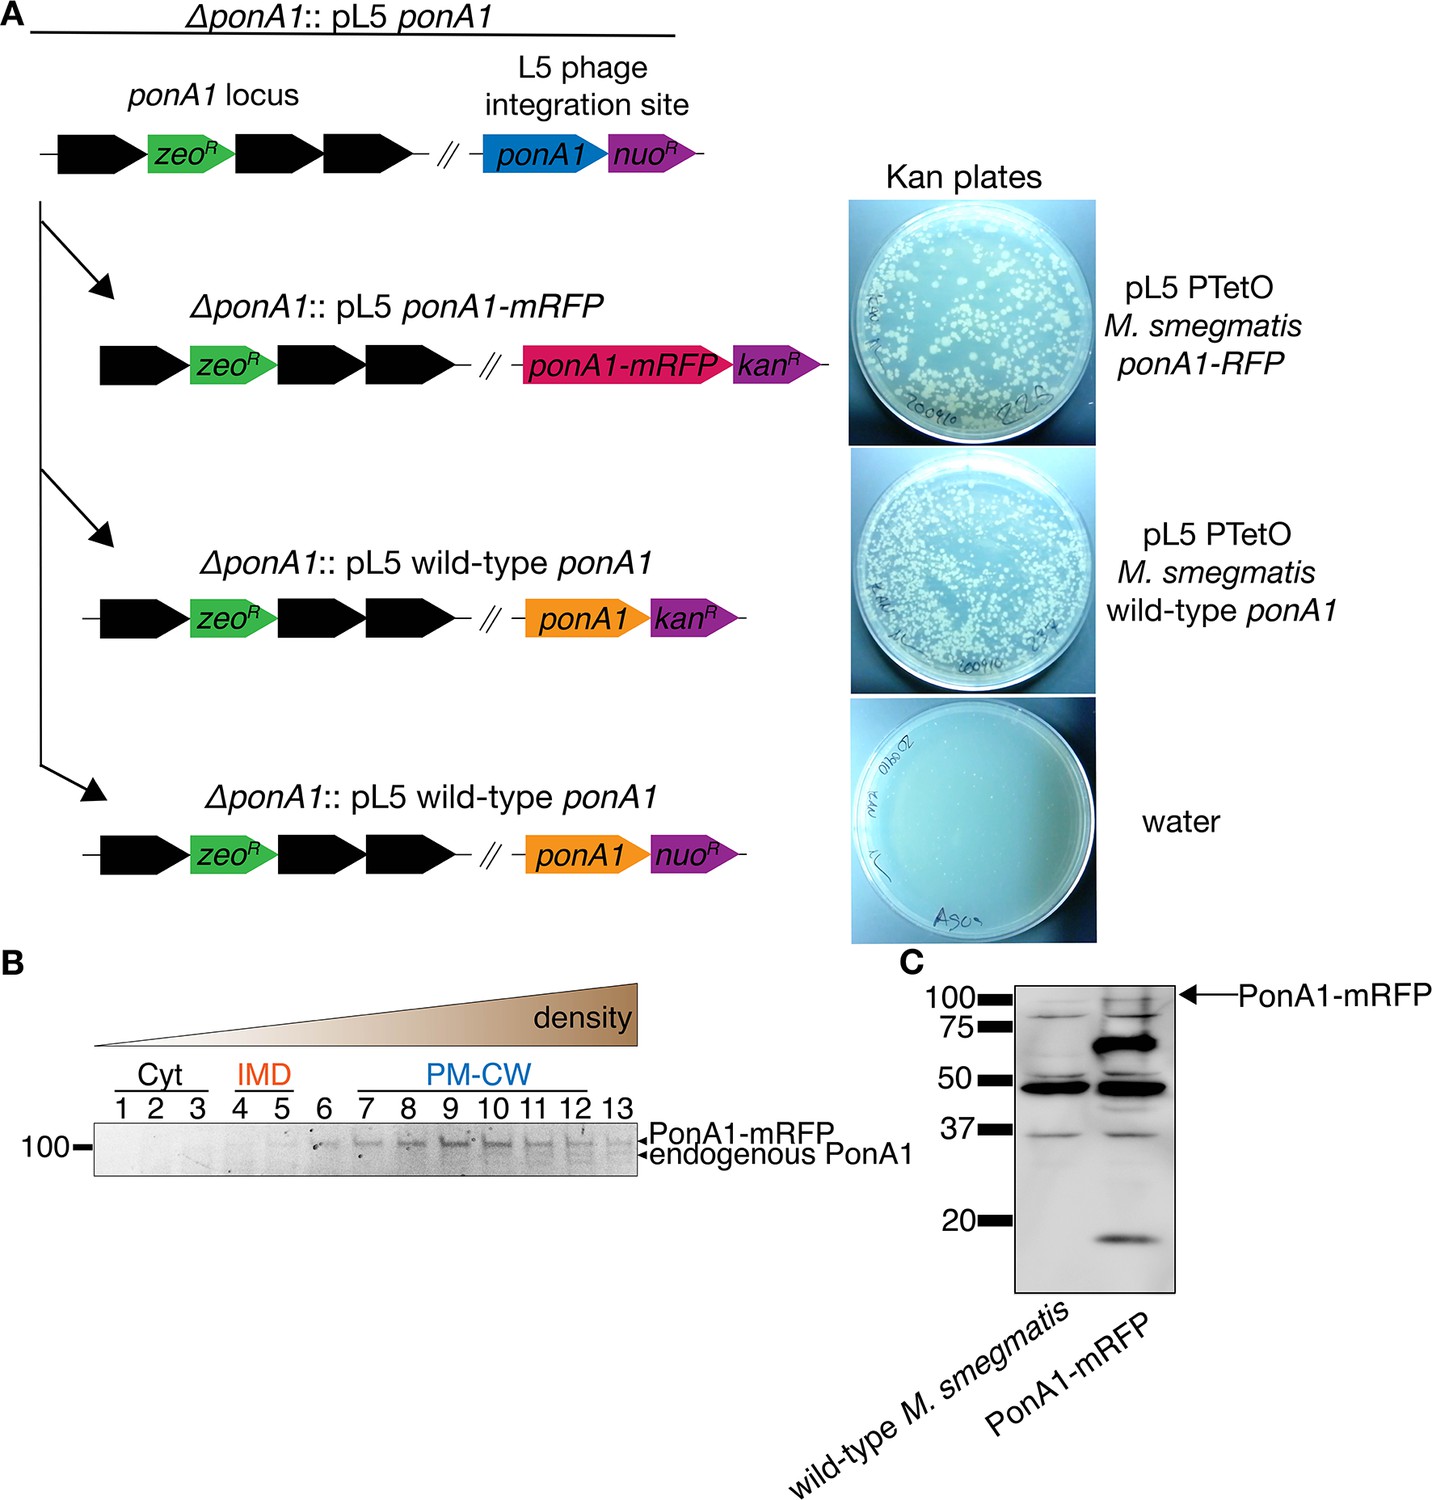
(A) A plasmid bearing ponA1-mRFP supports the growth of ∆ponA1. In M. smegmatis, ponA1 is essential for viability. ∆ponA1 M. smegmatis complemented with a wild-type copy of ponA1 in the L5 phage integration site (∆ponA1::pL5 wild-type ponA1, Kieser et al., 2015; Baranowski et al., 2018) was transformed with an integrating plasmid bearing either ponA1-mRFP (top right), wild-type ponA1 (center right), or nothing (water; bottom right). Transformants were then selected on kanamycin plates. The kanR ponA1 and kanR ponA1-mRFP cassettes replaced nuoR ponA1 at similar frequencies (not shown), indicating that the fluorescent protein fusion construct can function as the sole copy of ponA1. (B) PonA1-mRFP is active in PM-CW. Lysates from PonA1-mRFP-expressing M. smegmatis were separated by density gradient as in Figure 1B, then incubated with Bocillin-FL as in Figure 1C to label active transpeptidases. The top band corresponds to PonA1-mRFP, and the band immediately below to endogenous PonA1 (see Figure 1—figure supplement 6). (C) Lysates from wild-type and PonA1-mRFP-expressing M. smegmatis were blotted with anti-RFP. The presence of bands that are not present in wild-type lysates and do not correspond to full-length PonA1-mRFP suggests that the fusion protein may undergo degradation.
Figure 2—figure supplement 2
PimE-GFP is functional and has a similar subcellular localization to PonA1-mRFP.
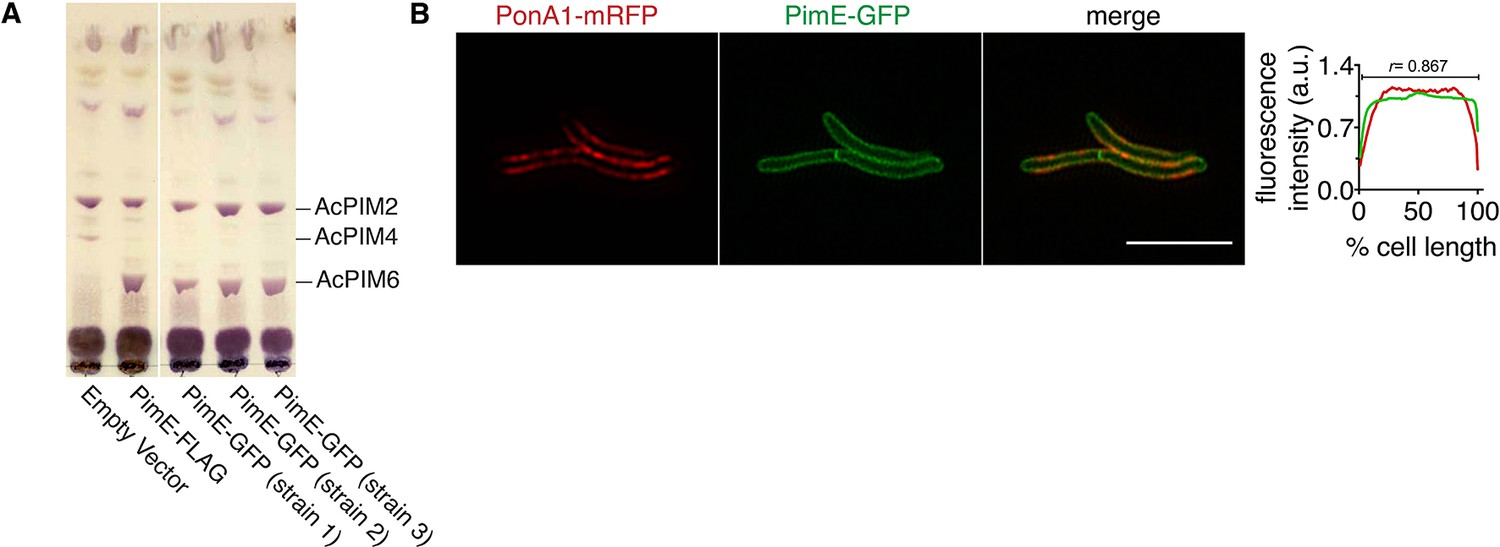
(A) PimE is a mannosyltransferase involved in phosphatidylinositol mannoside (PIM) biosynthesis, converting AcPIM4 to more polar PIMs. ∆pimE M. smegmatis was complemented with the indicated expression vectors. Glycolipids were extracted, purified, and separated by thin-layer chromatography. PIMs were visualized by orcinol staining. Similar to PimE-FLAG (Morita et al., 2006), PimE-GFP can restore the production of AcPIM6. (B) PonA1-mRFP distribution overlaps with that of the PM-CW marker PimE-GFP. M. smegmatis coexpressing PonA1-mRFP and PimE-GFP was imaged by SIM-E and conventional microscopy. Left, representative SIM-E image. Scale bars, 5 µm. Right, the fluorescence intensity profiles from conventional microscopy images were quantitated as in Figure 2A. r, Pearson’s correlation value. n = 116 cells.
Figure 2—figure supplement 3

MurJ is critical to comparmentalize both vertical and lateral cell wall synthesis.
(A) MurJ is depleted upon treatment with ATC. Depletion strain (MurJ-ID; carrying FLAG tag) was grown +/- ATC. Insert, immunoblot of lysates showing that MurJ is degraded after 8 hr of ATC treatment as reported (Gee et al., 2012). (B) Fractions 5 and 10 from Figure 2C were biotinylated as in Figure 2B, and 10-fold dilutions were made from the biotinylated products. We find substantially more lipid-linked precursors in fraction 5 compared to 10 as in Figure 2C (C) Depletion of MurJ alters amount and location of nascent peptidoglycan. Wild-type (left) or MurJ-ID (depletion strain; right) M. smegmatis in early log phase were treated +/- ATC then incubated with alkDADA. Bacteria were washed, fixed, subjected to CuAAC, and imaged by conventional fluorescence microscopy. Scale bar, 5 µm. Representative experiment (n = 2) performed as in (A) where fluorescence of the peptidoglycan labeling was quantified by flow cytometry. The median fluorescence intensities (MFI) of no probe controls were subtracted from those of the samples. Error bars denote standard deviation of technical triplicates.
Figure 3 with 8 supplements
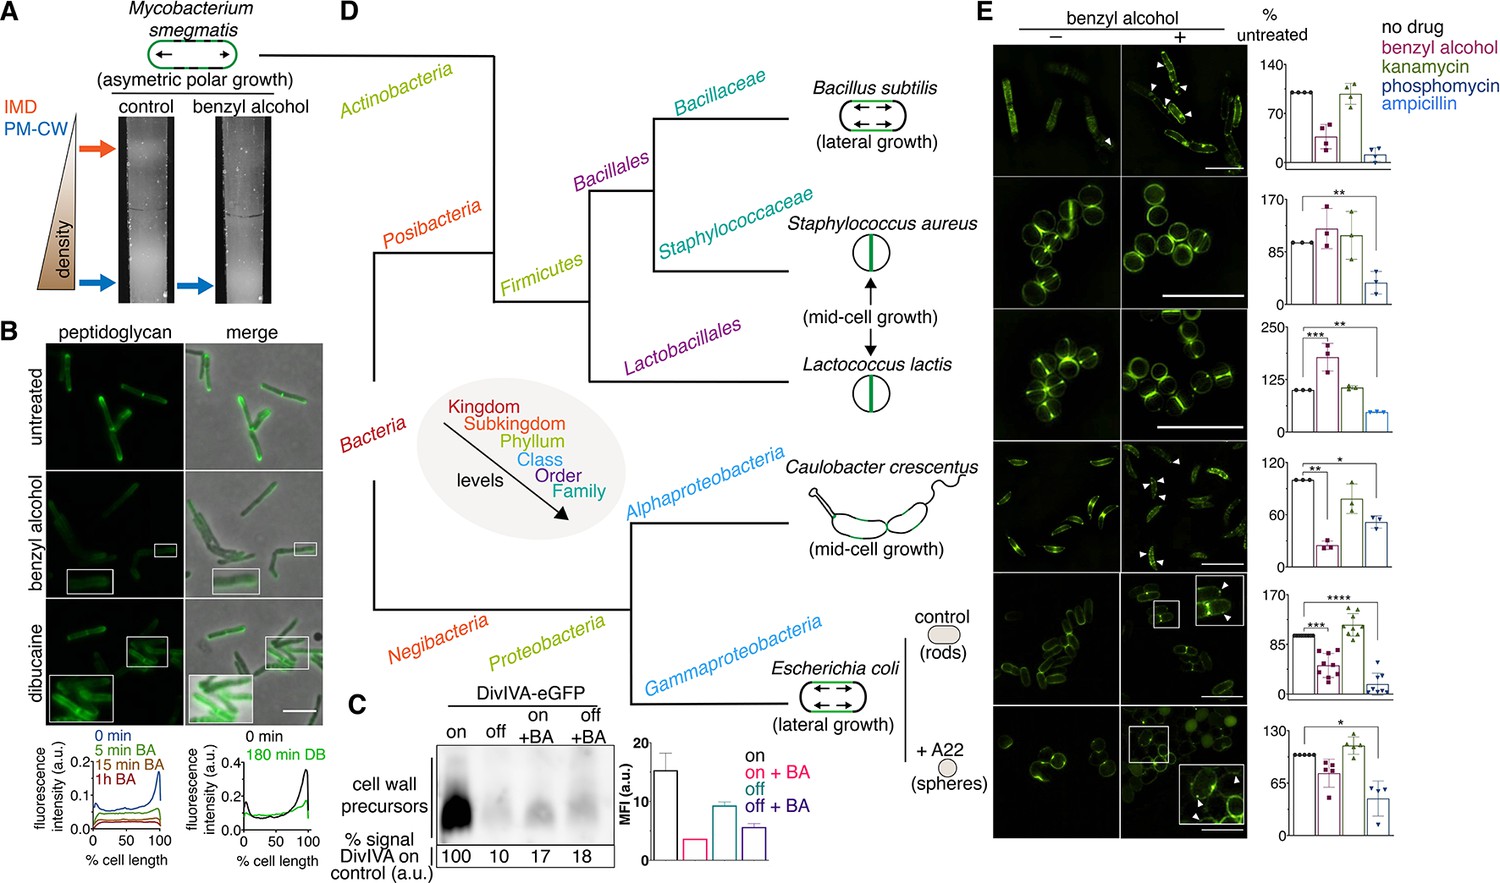
Membrane perturbations disrupt peptidoglycan biogenesis in M. smegmatis and phylogenetically-distant bacilli.
(A) Lysates from wild-type M. smegmatis treated +/- benzyl alcohol (BA) were sedimented in a sucrose density gradient. Density of the cellular material is quantified in Figure 3—figure supplement 1. (B) Top, wild-type M. smegmatis was incubated or not with benzyl alcohol or dibucaine, then labeled with alkDADA; merged images correspond to fluorescent image with the corresponding phase contrast. Bottom, the distribution of peptidoglycan labeling from wild-type M. smegmatis that was incubated with BA or dibucaine (DB) for the indicated time was quantitated as in Figure 2A, except that signal intensity was not normalized. The changes in fluorescence are further quantified by flow cytometry in Figure 3—figure supplement 5. (C) Top left, DivIVA-eGFP-ID M. smegmatis was either treated with benzyl alcohol, depleted of DivIVA, or both, and the peptidoglycan precursors from whole cells were biotinylated as in Figure 2C. Bottom left, biotin-derived chemiluminescence was quantified by densitometry; signal is expressed as % of untreated DivIVA-eGFP-ID (first lane). Right, DivIVA-eGFP-ID M. smegmatis was treated as in the left panel but labeled with alkDADA, subjected to CuAAC, and analyzed by flow cytometry. MFI, median fluorescence intensity values for a representative experiment. Error bars denote standard deviation of technical triplicates. (D) Phylogenetic tree constructed with 16S rDNA sequences (rate of mutation not considered). Taxonomic groups matched with colors to their levels with only diverging points shown. Shapes and growth modes illustrated for select species. (E) Left, different bacteria treated +/- benzyl alcohol followed by alkDADA incubation. Arrowheads highlight irregular patches of peptidoglycan. Insets are magnified. Where applicable, E. coli was pre-incubated with A22. Right, bacteria were treated with benzyl alcohol, translation-inhibiting kanamycin, or peptidoglycan-acting phosphomycin or ampicillin and then labeled as in (B) and analyzed by flow cytometry (see Materials and methods). MFI values were normalized to untreated controls. Experiments were performed three to nine times in triplicate. Error bars denote standard deviation of biological replicates. *p<0.05; **p<0.005; ***p<0.0005; ****p<0.00005, ratio paired t-tests and one-way ANOVA with Dunnet’s test for non-normalized MFI of biological replicates. Scale bars, 5 µm.
Figure 3—figure supplement 1
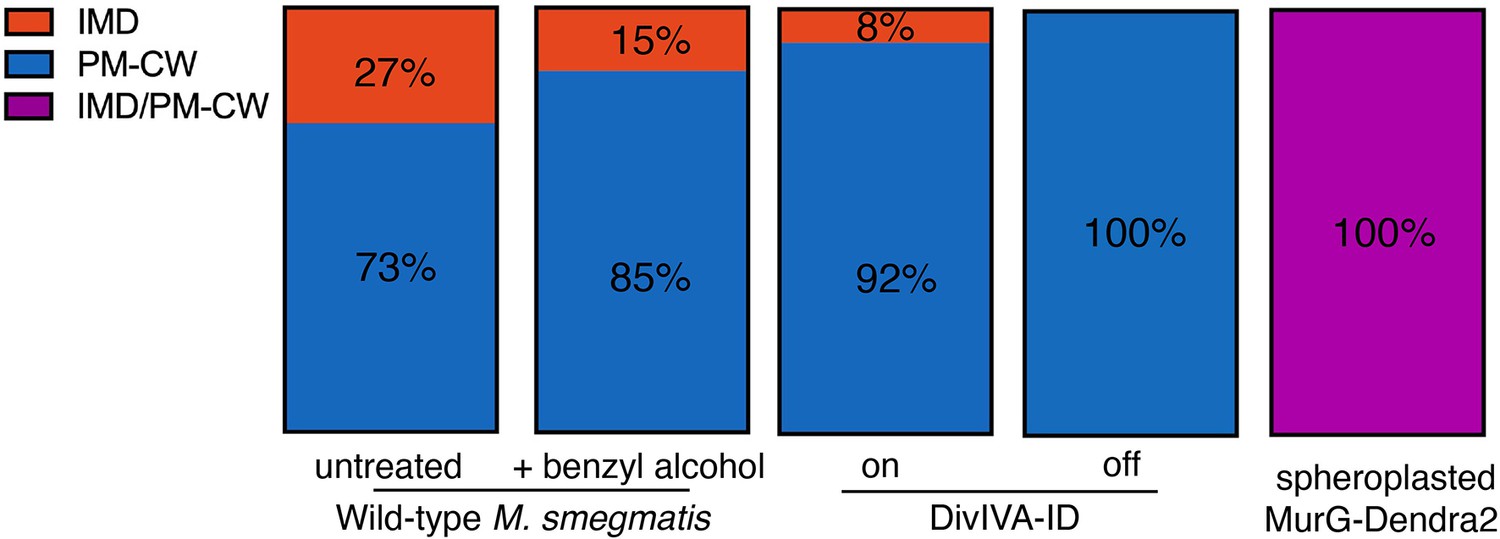
The effects of benzyl alcohol, DivIVA depletion, and spheroplasting on IMD and PM-CW abundance.
Cellular material from IMD (red) and PM-CW (blue) fractions that had been separated by sucrose density gradient (Figures 3A and 4A) was quantified by densitometry. Values were normalized to the combined signal from all of the IMD and PM-CW fractions. For spheroplasts, magenta indicates that IMD and PM-CW fractions were not clearly resolvable by sucrose density gradient.
Figure 3—figure supplement 2
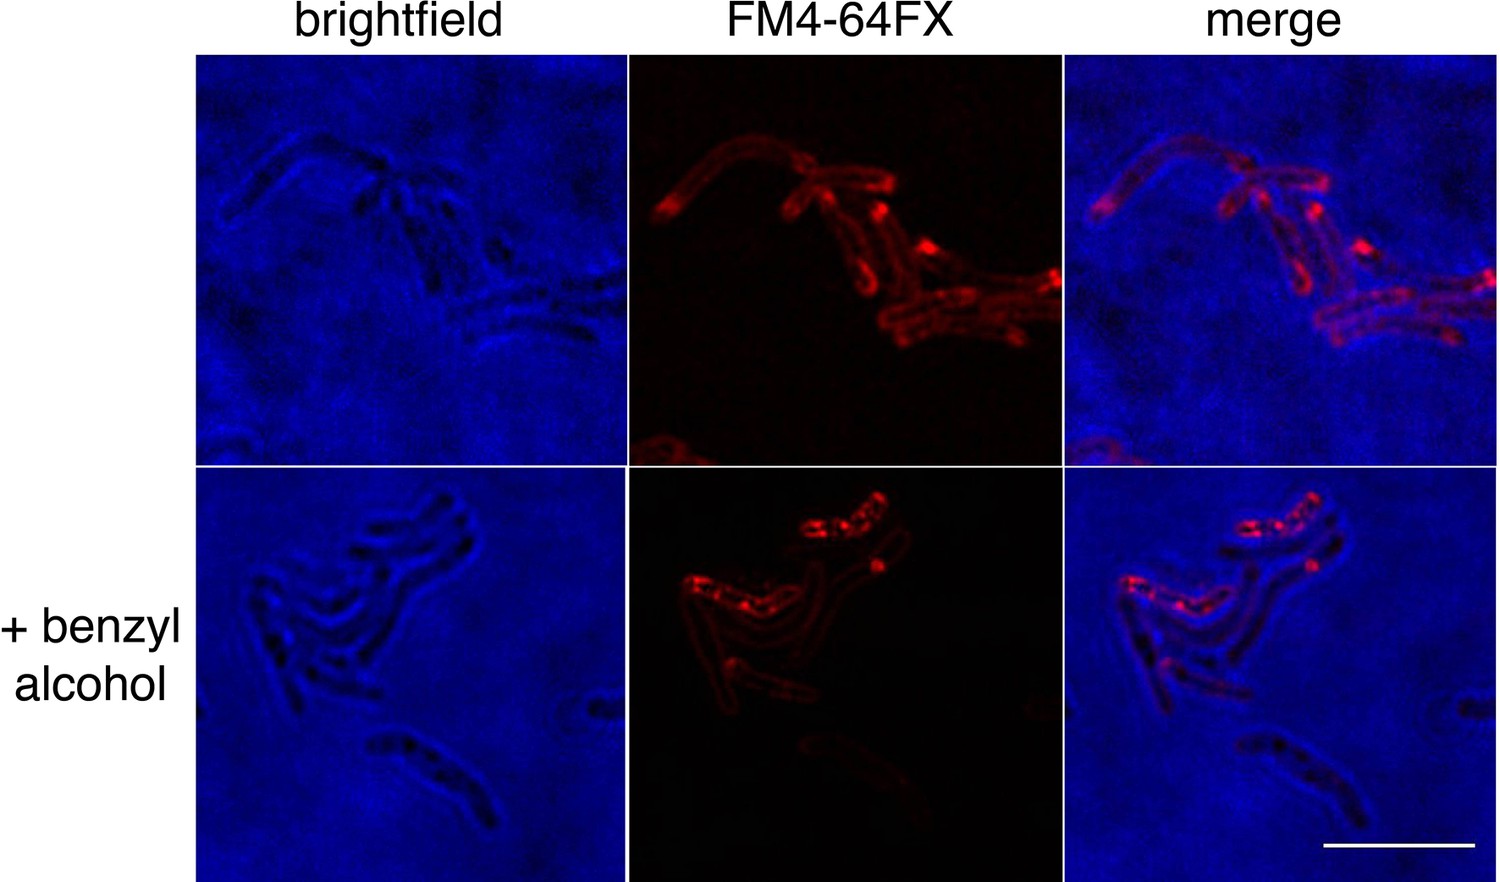
Benzyl alcohol alters FM4-64FX distribution.
Wild-type M. smegmatis was labeled with FM4-64FX, then washed, and incubated with benzyl alcohol. Bacteria were imaged by SIM-E. Scale bar, 5 µm.
Figure 3—figure supplement 3
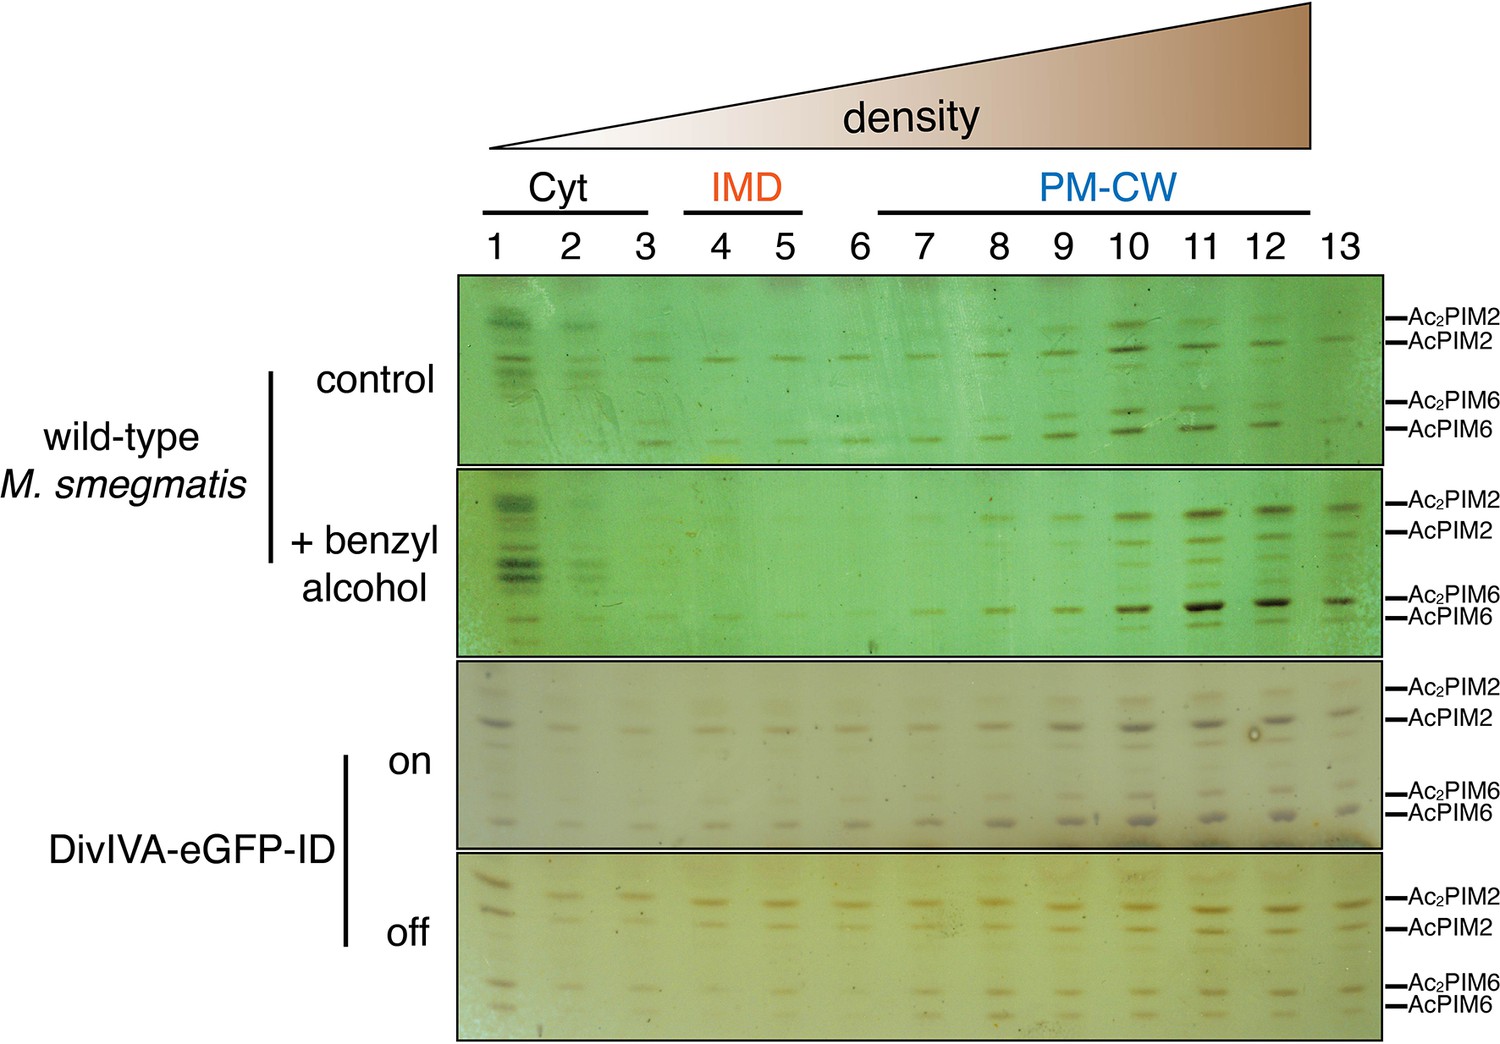
Benzyl alcohol and depletion of DivIVA affect the distribution of membrane glycolipids.
Wild-type or DivIVA-eGFP-ID M. smegmatis were treated +/- benzyl alcohol or ATC, respectively. PIMs were visualized by orcinol staining as in Figure 2—figure supplement 2. AcPIM2 and AcPIM6 present during normal growth in the IMD and are diminished upon benzyl alcohol treatment. Depletion of DivIVA is accompanied by an enrichment of PIM2 species and depletion of PIM6 species. We do not yet know the reason for the change in lipid profile.
Figure 3—figure supplement 4
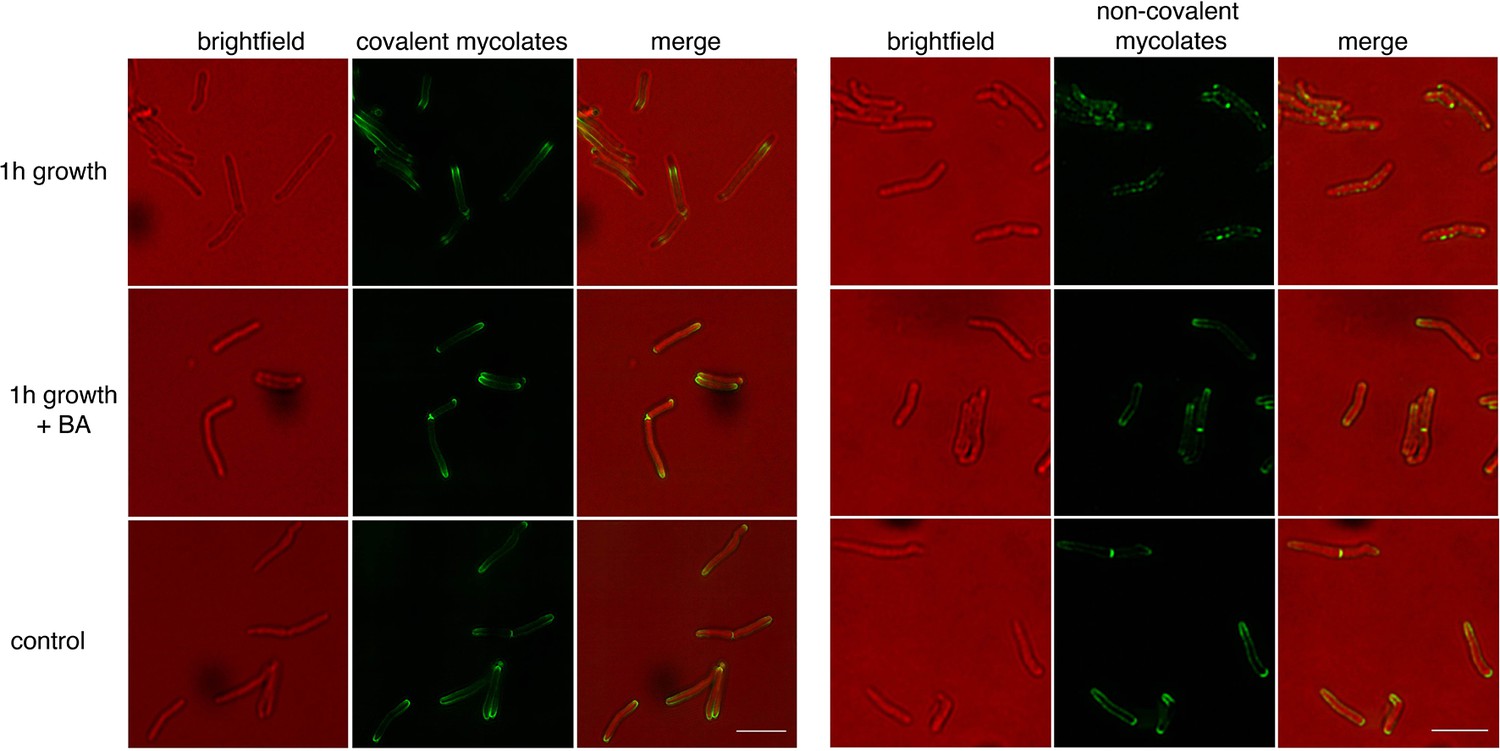
Benzyl alcohol halts cell elongation but does not otherwise impact the localization of mycomembrane probes.
Wild-type M. smegmatis was incubated with O-AlkTMM (left) or N-AlkTMM (right) to label covalent or noncovalent mycolates, respectively, then washed, and subjected or not to benzyl alcohol for 1 hr. Bacteria were washed, fixed, subjected to CuAAC, and imaged by conventional fluorescence microscopy. As a control, bacteria were not treated with benzyl alcohol for 1 hr, that is fixed immediately after probe incubation (bottom panel). Scale bars, 5 µm.
Figure 3—figure supplement 5

Benzyl alcohol and dibucaine decrease peptidoglycan synthesis over time.
Exponentially growing wild-type M. smegmatis treated with 100 mM benzyl alcohol or 0.5 mM dibucaine and, at each time point, labeled with alkDADA for an additional 2 min. Bacteria were then washed, fixed, and subjected to CuAAC. Fluorescence was quantified by flow cytometry and normalized to untreated controls.
Figure 3—figure supplement 6
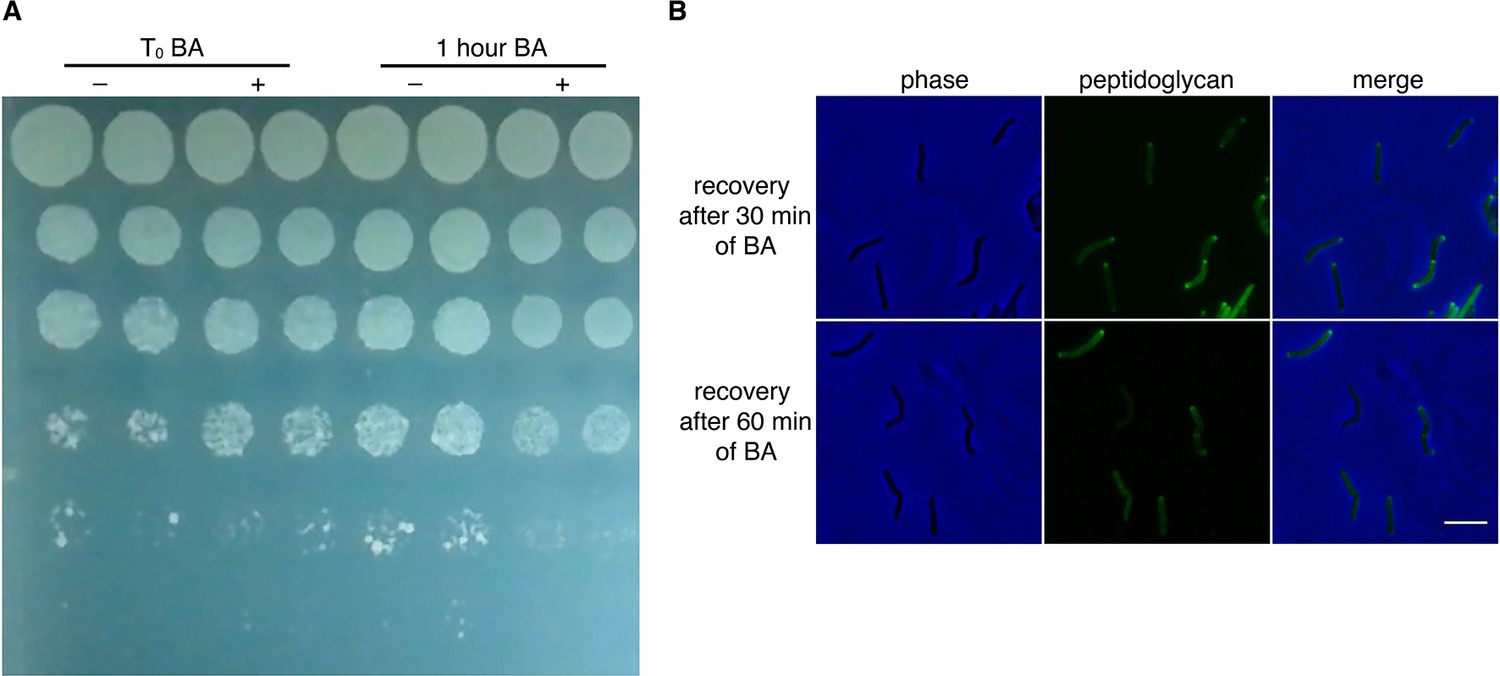
M. smegmatis survives benzyl alcohol (BA) treatment.
(A) M. smegmatis was treated with benzyl alcohol then washed in PBS. Ten-fold serial dilutions were spotted on LB agar. Shown are bacteria plated immediately after addition of benzyl alcohol (T0) or after 1 hour of exposure. (B) M. smegmatis were treated with benzyl alcohol for 30 or 60 min, washed and incubated for 2 hours in fresh 7H9 medium. Bacteria were then labeled with alkDADA for 15 min, fixed, and subjected to CuAAC to reveal active peptidoglycan synthesis. Scale bar 5 µm.
Figure 3—figure supplement 7

Polar enrichment and spatial coincidence of MurG-Dendra2 and mCherry-GlfT2 decrease upon dibucaine treatment.
Left, M. smegmatis-coexpressing MurG-Dendra2 and the IMD marker mCherry-GlfT2 was treated or not with 0.5 mM dibucaine and imaged by conventional microscopy. Scale bar, 5 µm. Right, the fluorescence intensity profiles were determined as in Figure 2A. r, Pearson’s correlation value. 58>n>61.
Figure 3—figure supplement 8
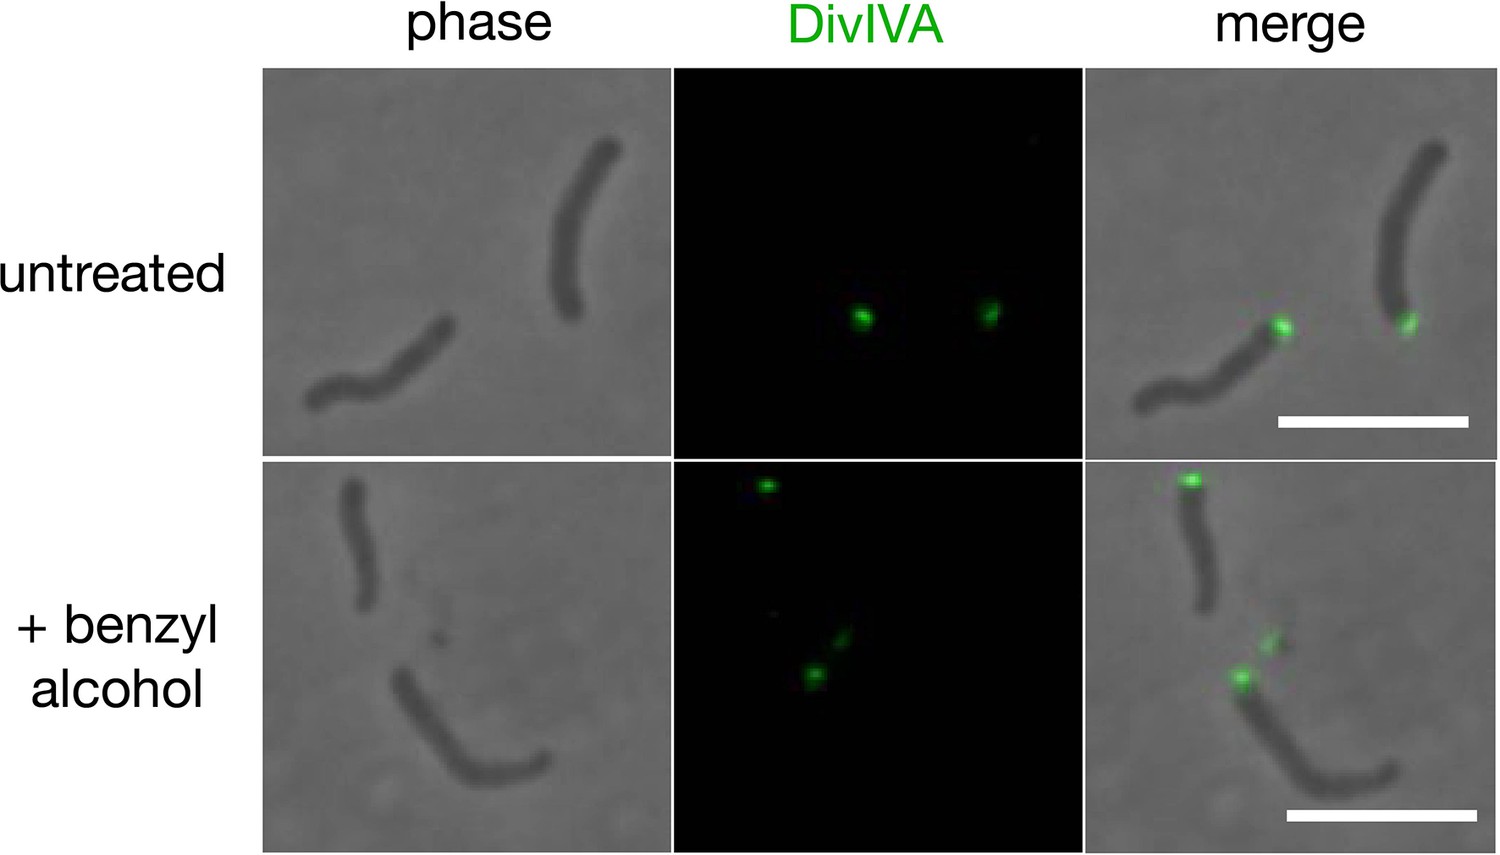
Benzyl alcohol does not delocalize DivIVA-eGFP.
DivIVA-eGFP-ID was grown to log phase and then treated or not with 100 mM benzyl alcohol for 1 hr. Bacteria were washed twice with PBST (see methods) and imaged by conventional microscopy. Scale bars, 5 µm.
Figure 4 with 1 supplement
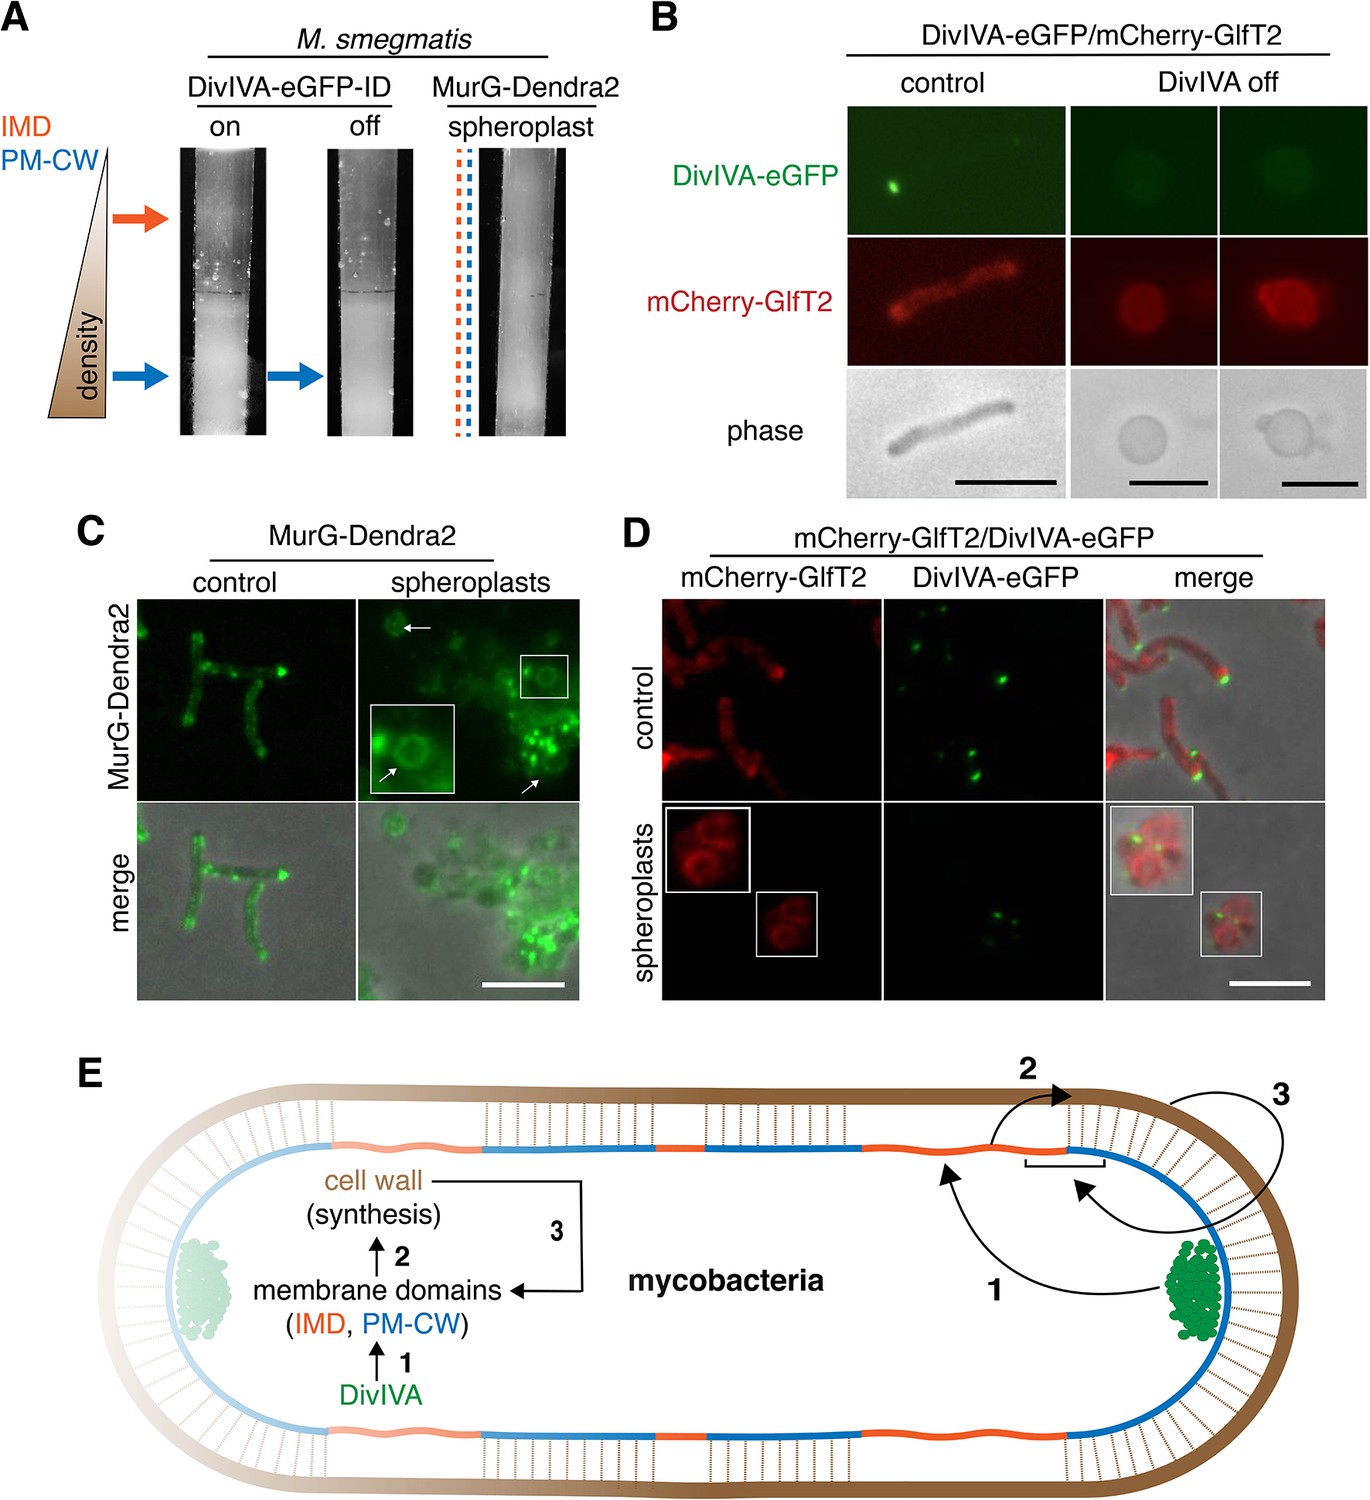
DivIVA and an intact cell wall promote membrane domain maintenance.
(A) Lysates from MurG-Dendra2-expressing M. smegmatis spheroplasts (Melzer et al., 2018) or from the DivIVA-eGFP-ID strain depleted (off) or not (on) of DivIVA (Meniche et al., 2014) were sedimented in a sucrose density gradient. (B) DivIVA was depleted or not from mCherry-GlfT2-expressing M. smegmatis. Depletion of DivIVA delocalizes mCherry-GlfT2. M. smegmatis expressing MurG-Dendra2 (C) or coexpressing mCherry-GlfT2 and DivIVA-eGFP-ID (D) were spheroplasted or not (control) and imaged. In spheroplasted cells, the IMD-associated proteins distribute along the cell periphery. Arrows mark spheroplasts outside and within insets, which have increased size and brightness. Merged images correspond to fluorescent image with the corresponding phase contrast. (E) Model for self-organization of plasma membrane and cell wall in M. smegmatis. Brown line indicates the cell wall. Short brown lines perpendicular to the membrane and cell wall indicate that the cell wall is likely to be physically connected to the membrane in the PM-CW regions (Morita et al., 2005). All scale bars, 5 µm.
Figure 4—figure supplement 1

An intact cell wall supports MurG partitioning within the membrane.
M. smegmatis expressing MurG-Dendra2 was spheroplasted as in Figure 4A and then lysed by nitrogen cavitation. Lysates were separated by sucrose density gradient MurG-Dendra2 was visualized by in-gel fluorescence. MurG-Dendra2 distributes widely across the membrane fractions (compare to Figure 1C and quantitation in Figure 1—figure supplement 4A), consistent with the expanded distribution of cellular material in Figure 4A.
Tables
Key resources table
| Reagent type (species) or resource | Designation | Source or reference | Identifiers | Additional information |
|---|---|---|---|---|
| Strain (M. smegmatis mc2155) | M. smegmatis | NC_008596 in GenBank | Wild-type M. smegmatis | |
| Strain (M. smegmatis) | MurG-Dendra2 | This study | The mutant was generated as described in Supplementary material and methods. | |
| Strain (M. smegmatis) | mCherry-GlfT2 | Hayashi et al., 2016 | See reference for details. | |
| Strain (M. smegmatis) | PonA1-mRFP | Kieser et al., 2015; Baranowski et al., 2018 | Obtained from Dr. Eric Rubin (Harvard SPH) and Dr. Hesper Rego (Yale Med). | |
| Strain (M. smegmatis) | PimE-GFP | This study | The strain was generated as described in Supplementary material and methods. | |
| Strain (M. smegmatis) | MurG-ID depletion strain | Meniche et al., 2014 | Obtained from Dr. Chris Sassetti (U Mass Med) | |
| Strain (M. smegmatis) | MurJ-ID (MviN) depletion strain | Gee et al., 2012 | Obtained from Dr. Chris Sassetti (U Mass Med) | |
| Strain (M. smegmatis) | ptetponA1 | Hett et al., 2010 | Obtained from Dr. Eric Rubin (Harvard SPH) | |
| Strain (M. smegmatis) | DivIVA-eGFP-ID | Meniche et al., 2014 | Obtained from Dr. Chris Sassetti (U Mass Med) | |
| Strain (M. smegmatis) | mCherry-GlfT2/DivIVA-eGFP-ID | This study | See reference for details. | |
| Strain (B. subtilis JH642) | B. subtilis | NZ_CP007800 in GeneBank | ||
| Strain (C. crescentus) | C. crescentus | NA 1000 | Obtained from Dr. Peter Chien (U Mass Amherst) | |
| Strain (E. coli K12) | E. coli K12 | MG1655 | ||
| Strain (S. aureus) | S. aureus | ATCC BA-1718 | Obtained from Dr. Thai Thayumanavan (U Mass Amherst) | |
| Strain (L. lactis) | L. lactis lactis | NRRL B633 | ||
| Chemical compound | Alkyne-d-alanine-d-alanine (alkDADA or EDA-DA) | Liechti et al., 2014 | Synthesized by the Chemical Synthesis Core Facility at Albert Einstein College of Medicine (The Bronx, NY) following the referenced protocols. | |
| Chemical compound | O-alkyne-trehalose monomycolate (O-AlkTMM) | Foley et al., 2016 | Obtained from Dr. Benjamin Swarts (Central Michigan University). | |
| Chemical compound | N-alkyne-trehalose monomycolate (N-AlkTMM) | Foley et al., 2016 | Obtained from Dr. Benjamin Swarts (Central Michigan University). | |
| Software, algorithm | MATLAB codes | García-Heredia et al., 2018 | Scripts designed for MATLAB to analyze the fluorescence profiles along a cell body from data collected in Oufti (Paintdakhi et al., 2016). | |
| Chemical compound | Fmoc-D-Lys(biotinyl)-OH BDL precursor | Chem-Impex International (Wood Dale, IL) | Cat # 16192 | Deprotected as described in Qiao et al., 2014 to yield BDL. |
| Chemical compound | A22 (S-3,4-Dichlorobenzylisothiourea) | Sigma-Aldrich, St. Louis, MO | SML0471 | Dissolved in water and kept at −20°C. |
| Recombinant DNA reagent | PBP4 plasmid | Qiao et al., 2014 | Obtained from Dr. Suzanne Walker (Harvard Med). |
Additional files
-
Supplementary file 1
Supplementary information.
(a) Incubation conditions. The table describes the incubation conditions employed in this study, including the concentrations and exposure times to a reagent. (b) Metabolic labeling conditions The table highlights the incubation conditions in which metabolic labeling was performed. (c) NCBI Accession numbers from 16S rDNA. This table provides the NCBI accession numbers of the rDNA sequences used to create the phylogenetic tree in Figure 3D.
- https://cdn.elifesciences.org/articles/60263/elife-60263-supp1-v2.docx
Download links
A two-part list of links to download the article, or parts of the article, in various formats.
Downloads (link to download the article as PDF)
Open citations (links to open the citations from this article in various online reference manager services)
Cite this article (links to download the citations from this article in formats compatible with various reference manager tools)
Membrane-partitioned cell wall synthesis in mycobacteria
eLife 10:e60263.
https://doi.org/10.7554/eLife.60263


